Embed Size (px)
Citation preview
STUDENT SUCCESS TIGER TEAM
Final Report and Recommendations
May 2009
RIT Student Success Tiger Team Final Report: May 2009
2
Vincent Amuso, Department Head, Electrical Engineering, Kate Gleason College of
Engineering
Heath Boice‐Pardee, Associate Vice President for Student Affairs
Eulas Boyd, Assistant Provost for Student Success
Joan Graham, Director of Institutional Research and Policy Studies
Barbara Heifferon, Professor, Department of English, College of Liberal Arts
David Koster, Student Representative (E. Philip Saunders College of Business) Student
Government
Christine Licata, Interim Senior Associate Provost and Team Chair
Edward Lincoln, Assistant to the Vice President, Enrollment Management and Career
Services
Julia Lisuzzo, Chair, Staff Council and Manager of Administrative Operations, RIT
Libraries
Joseph Loffredo, Assistant Vice President for Academic Affairs & Registrar
Sophia Maggelakis, Department Head and Professor, School of Mathematical Sciences,
College of Science
Chip Sheffield, Associate Professor, Foundations, College of Imaging Arts and Sciences
Kristen Waterstram‐Rich, Chair, Academic Senate, Director of Premedical Studies and
Professor, College of Science
George Zion, Professor, Electrical, Computer and Telecommunications Engineering
Technology, College of Applied Science and Technology
Charlene Reagan, Administrative Support
TIGER TEAM MEMBERS
RIT Student Success Tiger Team Final Report: May 2009
3
TIGER TEAM MEMBERS ……………………………………………………………………………………………………………………………… 2 INTRODUCTION ……………………………………………………………………………………………………………………………………….. 5
RIT’S Vision ………………………………………………………………………………………………………………………………….. 6 FRAMING THE CHALLENGE ………………………………………………………………………………………………………………………… 7 Previous Retention Committee Recommendations ……………………………………………………………………… 7 THE CURRENT CONDITION …………………………………………………………………………………………………………………………. 10 IMPACT OF IMPROVED RETENTION …………………………………………………………………………………………………………… 12 ADDITIONAL GOALS AND BENCHMARKS NEEDED ……………………………………………………………………………………… 12 UNDERSTANDING WHAT WORKS THROUGH BENCHMARKING ………………………………………………………………….. 16 Retention Research ……………………………………………………………………………………………………………………… 16 Studies Connecting Theory with Practice …………………………………………………………………………………….. 16 Heuristic Modeling ………………………………………………………………………………………………………………………. 17 American College Testing (ACT) Survey Research ………………………………………………………………………… 18 Peer Institutions ………………………………………………………………………………………………………………………….. 18 HOW DOES RIT MEASURE UP? …………………………………………………………………………………………………………………… 20 Scoring RIT …………………………………………………………………………………………………………………………………… 22 NSSE Results ………………………………………………………………………………………………………………………………… 22 Summary ……………………………………………………………………………………………………………………………………… 23 RECOMMENDATIONS ………………………………………………………………………………………………………………………………… 23 Category I Recommendations: Predicting and Facilitating Student Transitions And Success …………………………………………………………………………………………………………………………………. 24 Academic Advising Program and Services ………………………………………………………………………. 24 FYE & Learning Communities …………………………………………………………………………………………. 28 Orientation Program ……………………………………………………………………………………………………… 28 Early Alert System ………………………………………………………………………………………………………….. 29 Senior Year Experience Initiatives ………………………………………………………………………………….. 30 Category II Recommendations: Infrastructure & Enabling Factors Critical to Student Success …….. 31 A Campus‐Wide Culture of Assessment and Data‐Informed Decision Making …………………………………………………………………………………………………………………………… 32 Data Analysis to Build Profiles of Students at Risk and to Inform Retention Strategies ………………………………………………………………………………………………………. 34 A Technology Infrastructure that Supports Student Learning and Success …………………………………………………………………………………………………………………………… 36 Ease of Use and Integrated Services ………………………………………………………………………………. 36 Category III Recommendations: Teaching and Learning, Campus Environment and Culture ………… 38 Academic Challenge and Engagement …………………………………………………………………………… 38 Student Interactions with Faculty Members ………………………………………………………………….. 40
Academic Calendar ………………………………………………………………………………………………………… 41 Concluding Thoughts …………………………………………………………………………………………………………………… 42
BIBLIOGRAPHY ………………………………………………………………………………………………………………………………………….. 44 APPENDIX A APPENDIX B APPENDIX C
TABLE OF CONTENTS
RIT Student Success Tiger Team Final Report: May 2009
4
Figure 1. Persistence Rate, First‐time Full‐time Freshmen Entering in the Fall Quarter (7 College) All ……………………………………………………………………………………………….. 13 Figure 2. Persistence Rate, First‐time Full‐time Freshmen Entering in the Fall Quarter (7 College) Female‐Male ……………………………………………………………………………….. 13 Figure 3. Persistence Rate, First‐time Full‐time Freshmen Entering in the Fall Quarter (7 College) AALANA‐Non‐AALANA …………………………………………………………………. 14 Figure 4. Graduation Rate, First‐time Full‐time Freshmen Entering in the Fall Quarter (7 College) 6 yr.‐7 yr. ……………………………………………………………………………………… 14 Figure 5. Six Year Graduation Rate, First‐time Full‐time Freshmen Entering in the Fall Quarter (7 College) Female‐Male …………………………………………………………………… 15 Figure 6. Six Year Graduation Rate, First‐time Full‐time Freshmen Entering in the Fall Quarter (7 College) AALANA‐Non‐AALANA ……………………………………………………. 15 Table 1. RIT Retention Programs ………………………………………………………………………………… 21 Table 2. Framework for Assessment and Data‐Informed Decision Making ………………….. 33
LIST OF FIGURES AND TABLES
RIT Student Success Tiger Team Final Report: May 2009
5
Student Success Tiger Team Final Report In Fall 2008, Provost Jeremy Haefner established two “Tiger Teams.” Each team was charged to focus on different aspects of student success. Our team was tasked to recommend a coordinated institutional retention plan designed to help the University reach its graduation goals and to provide strong student engagement with the University. These graduation goals call for RIT to achieve a first year retention rate of 92% and a six‐year graduation rate of 73% by 2012. In carrying out this charge, the team:
Examined existing retention research and national best practices related to student success;
Reviewed RIT’s current portfolio of retention strategies and programs, including available data on impact and outcomes;
Researched metrics used by other institutions to measure the effectiveness of their retention practices;
Assessed how RIT measures up against national best practices. An outline of the data collection process the team used is found in Appendix A. It should be noted that the AALANA Student Success Tiger Team worked in similar ways. In comparing notes with that team, it appears that there will be significant overlap in our reports and agreement with respect to many of the recommendations made by both. During our seven month journey together, we uncovered some surprising and not‐so‐surprising information. The discussions were rich and the perspectives were varied. While this report represents an ‘end’ product from these deliberations, we trust this report will signal the ‘beginning’ of an action plan which empowers our community to consider how every individual and collective action impacts student success. We believe that we will meet our institutional goals if we think about success in terms of “one student at a time.” According to Victorian philosopher and biologist Herbert Spencer “the great end in life is not knowledge but action.” Fortunately, this report can lead to both!
INTRODUCTION
RIT Student Success Tiger Team Final Report: May 2009
6
RIT’s Vision RIT aspires to move into the ranks of the nation’s finest private universities. A branding study completed in the Fall of 2006 affirmed that RIT’s reputation as a leading technological university with career‐focused, specialized programs is well established. The study also emphasized that, in order to enhance its reputation, the University must complement the well‐regarded dimensions of its reputation by emphasizing creativity and innovation, creating a greater sense of community, and becoming more global in its draw and reach. President Destler has established a number of goals that, collectively and individually, provide benchmarks for our progress toward enhancing our reputation. These goals include increasing the number of applications for admission and the quality, geographic distribution, gender balance, and diversity of the student body. An additional goal, and one that, in part, enables the goals mentioned above, is to increase the retention and graduation rates of undergraduate students. In order to reach this goal, the team believes that the overarching imperative is to engage students at the highest levels possible – academically and personally – and in so doing, to create a vibrant, spirited learning‐living community characterized by a growing number of alumni who have high levels of loyalty and pride. In short, meeting or exceeding the goals of persistence and graduation provide benchmarks for our progress of becoming the type of academic community described above. Perhaps the greatest challenge the team encountered was the lack of data – either quantitative or qualitative – that would allow us to know with confidence why students leave RIT before completing their degree. On the other hand, we recognize that: there are multiple reasons why students leave before graduating, that those reasons are complex, and would surely fall along the lines well‐established by the myriad research we reviewed on student retention. Collecting the kind of data that provides the requisite insight on student attrition is one of our recommendations (See Recommendation #16, page 34). Absent that data, the team felt it was important to push ahead and develop recommendations based on an examination of current programming at RIT and institutions nationally that have been identified as having “best‐practices” and which enjoy higher levels of student persistence and graduation than predicted. We developed recommendations derived from our team’s fact‐finding and from an external scan of retention research and best practices in the field. We believe that these recommendations will help us exceed our 92/73 student success goals for persistence and graduation and achieve a level of student engagement comparable to what one sees in highly engaging institutions as measured by the National Survey on Student Engagement (NSSE).
RIT Student Success Tiger Team Final Report: May 2009
7
The issues of poor retention and modest graduation rates at RIT are not new and have been studied and analyzed on several occasions. In the 1930’s, Leo A. Smith, then VP for Student Affairs at RIT, commented on the Institute’s poor retention and graduation rates in his doctoral dissertation at the University of Rochester. Fast forward fifty years to 1984, and the Long Range Planning Committee of the RIT’s then Policy Council issued a report with twenty recommendations for improving retention and graduation rates. These issues were addressed again in the 1994 and 2004 Strategic Plans for RIT and the corresponding Agendas for Action. In 2000, a Retention Task Force issued a set of twenty‐four recommendations and established a graduation goal of 75% for the 2001 entering freshman cohort (measured in 2008). In 2003, a university‐wide Retention Committee was appointed and issued a report with approximately a dozen recommendations. Based on the reports mentioned above, much has been done to improve retention and graduation rates. An early alert/early warning system has been implemented. Pedagogical changes were made in first‐year physics and calculus classes. Orientation programming was expanded and a first‐year seminar (FYE) established. The residence halls underwent a $68 million dollar renovation. The physical plant of the campus has expanded (with the Gordon Field House and Activities Center being among the most notable additions). The entire campus has been improved aesthetically. Several student gathering places have been created. Currently, there are many freshman learning communities campus‐wide, and RIT has created an Institute Advising Office that oversees the most recent retention initiative, AIM – the Academic Intervention and Mentoring program. Correspondingly, the quality of incoming freshmen and transfer students has improved in the past decade, and RIT is more selective today than at any other time in its history. Despite all of these efforts, RIT retention rates are lower than we would like and lower than they should be given both the quality of incoming students and RIT’s reputation as a leading university. Action has already been taken on most recommendations made by previous study teams. (See Appendix B for complete listing). Several recommendations that we make in this report help close the gap further. The summary below outlines specific action steps from previous reports where continued attention or action is warranted. Previous Retention Committee Recommendations: Progress and Status
• Items with a indicate actions currently in process • Bolded items indicate action recommended by this Tiger Team • *Items in italics indicate no action taken or recommended at this time
FRAMING THE CHALLENGE
RIT Student Success Tiger Team Final Report: May 2009
8
1. Implementation of the degree audit system including “what if” capabilities to facilitate
internal transfer:
a. The Degree Audit System has been fully implemented for undergraduate students in six of eight colleges. GCCIS is scheduled for deployment in summer 2009 and CIAS in Winter 2009. The degree audit system has an integrated “what if” audit facility that is actively used by students and advisors when considering alternate majors.
b. Internal transfer capabilities have been further enhanced with the establishment of the Institute Advising Office and the newly established University Studies Program.
2. Re‐engage Art & Science (Branding consultants) to complete a study of current enrollees and
recently departed students within this academic year to examine factors underlying the persistence of traditional full‐time undergraduate students and the attrition decision of those who withdraw.
a. The Student Success Tiger team is recommending this type of study.
3. Implement a demand‐based course registration system.
a. The “unmet course need” system was implemented in 2004 as a first step toward capturing course need data while the registration for a given quarter is underway. This system very quickly became the standard way for students and academic departments to work on unmet course needs. It has been very successful with a high number of course needs being accommodated by academic departments prior to the start of a quarter.
b. The “unmet course need” system was to be just the first step to a completely new way to track course needs and to facilitate registration. Specifications for a new registration system were developed and approved in 2005. A main component of this system was to permit students to pre‐define the courses they would plan to take for upcoming quarters. Further development of the system was curtailed however in 2006 based on technological limitations. A new review of the status of the system will be initiated.
4. Scheduling of courses must be more systematic and structured to minimize scheduling
conflicts.
a. This remains an issue for many students. The Registrar’s Office, working with the colleges, has initiated a project to review master course scheduling.
5. Develop an RIT Compact for students and faculty. (i.e., Syracuse University Compact)
that outlines student responsibilities related to academic advising and attendant institutional responsibilities.
RIT Student Success Tiger Team Final Report: May 2009
9
a. Presently under consideration by the Provost and AALANA Student Success Team
6. Create a centralized, well‐trained, professional academic advising center. • Provide all students with an annual degree progress report. • Require a meeting with an academic advisor for any student determined to be
“falling behind” in progress toward degree certification and create a recovery plan. • Formally follow‐up with all students who have earned 165 or more credits with a 2.0
or greater cumulative GPA who do not return. (In one review of a 10‐year time frame, there were 1,700 students falling into this category.)
• Provide systematic communication to all students on LOA to facilitate re‐entry to new or original program.
a. A proposal for a central advising and academic information office is being
recommended by the Student Success Tiger Team. 7. Review courses to determine high‐risk and controlling courses that, if not successfully completed, create obstacles to on‐time graduation.
a. Several high‐risk and controlling courses that created obstacles for students have been
identified. The Academic Intervention and Mentoring (AIM) program was developed and implemented to specifically target improvements in the success of students in these high‐risk courses.
b. Pedagogical changes have been made in first‐year physics and calculus classes.
*8. Review the time‐to‐degree for students by examining all programs for credit hour and credit‐hour equivalencies (i.e., FYE, co‐op requirements, and wellness requirements). Consider limiting the maximum number of required co‐ops to three; students can elect a fourth or fifth co‐op. As a result of these changes, students will have the opportunity to graduate in four years.
a. The “Curriculum Flexibility” initiative undertaken in 2005, led by the Provost, did
recommend a reduction in the number of required co‐ops, however, the required number of co‐ops for many programs remains at five.
*9. Develop a list of departmental and Liberal Arts online courses that students may take while
on co‐op and allow students to take up to two with no tuition charge. a. This was not adopted but bears further discussion and examination 10. Upon completion of pre‐registration each quarter, require that all colleges contact all
students not registered for the next quarter to determine why they are not registered. Intervene as appropriate and record reasons why and intervention actions taken. (Especially for students registered in the spring, but not registered for the following fall.)
RIT Student Success Tiger Team Final Report: May 2009
10
a. The contact of non‐registered students has been conducted by some academic
departments each quarter, however a more data driven and coordinated effort is being recommended by the Student Success Tiger Team.
11. Universal, mandated participation in the early alert program.
• Require alerted students to meet with the faculty member and to develop appropriate corrective actions and/or interventions.
• Require any student (especially freshman) receiving a D or F or placed on probation to meet with an academic advisor to determine causes and develop appropriate intervention actions.
• Immediately provide any student (especially freshman) with a D or F a “credit recovery plan” to get them back on track toward graduation.
• Make sure that required sequential courses have staggered, parallel scheduling to allow students to repeat D or F course in the very next quarter.
a. A Utilization Study of the Early Alert System has identified areas to address for
increased usage. The Student Success Tiger Team is making a number of recommendations for improvements to and increase usage of the Early Alert System.
12. Continue to implement curricular flexibility (i.e. open electives, non‐liberal arts minors, double majors, and accelerated degree options)
a. These recommendations were implemented through the New General Education
Curriculum implemented in 2005 by former Provost, Dr. Stan McKenzie. All majors have an increased number of open electives, a growing number of students are selecting double majors and non‐liberal arts minors.
b. The University Studies program has been initiated allowing freshmen to enter RIT without a declared major.
*13. Create common first‐year curricula within each college (where possible).
a. Some colleges and/or groups of programs already have this in place. Additional data and discussion to support this recommendation is required to prior to moving forward with this action in the case of the remaining colleges and programs
In studying the Institute’s current condition with respect to persistence and graduation, the following data should not be ignored.
THE CURRENT CONDITION
RIT Student Success Tiger Team Final Report: May 2009
11
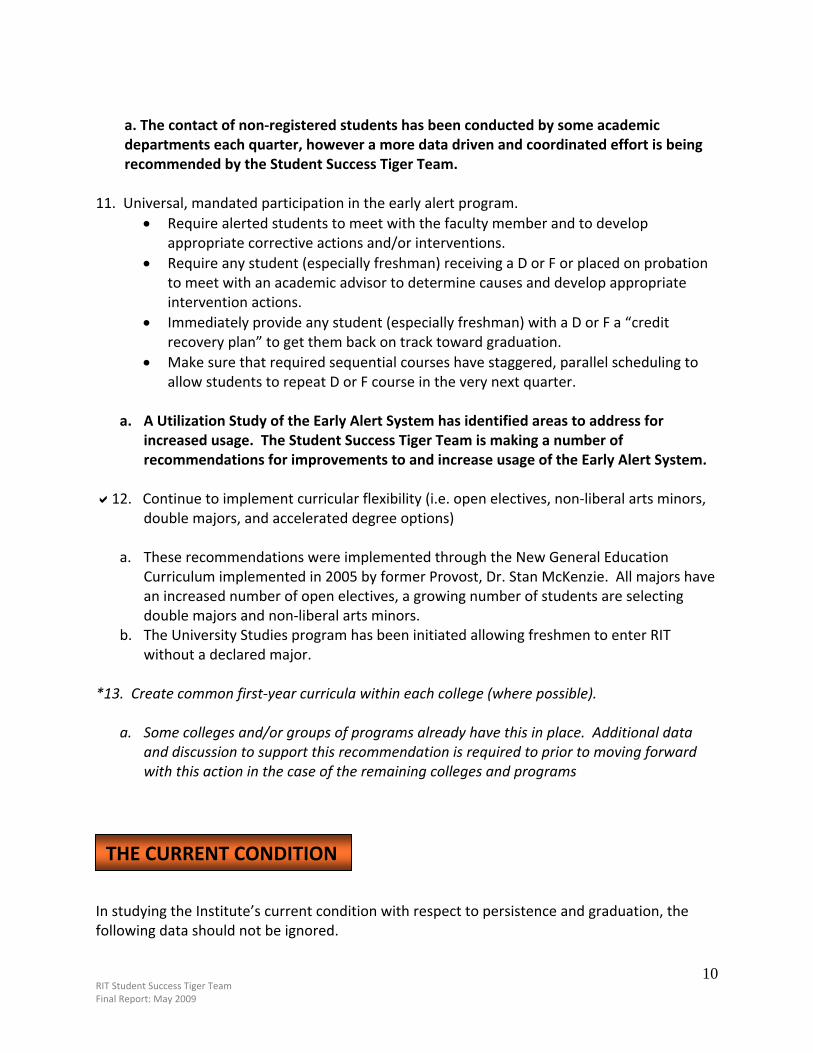
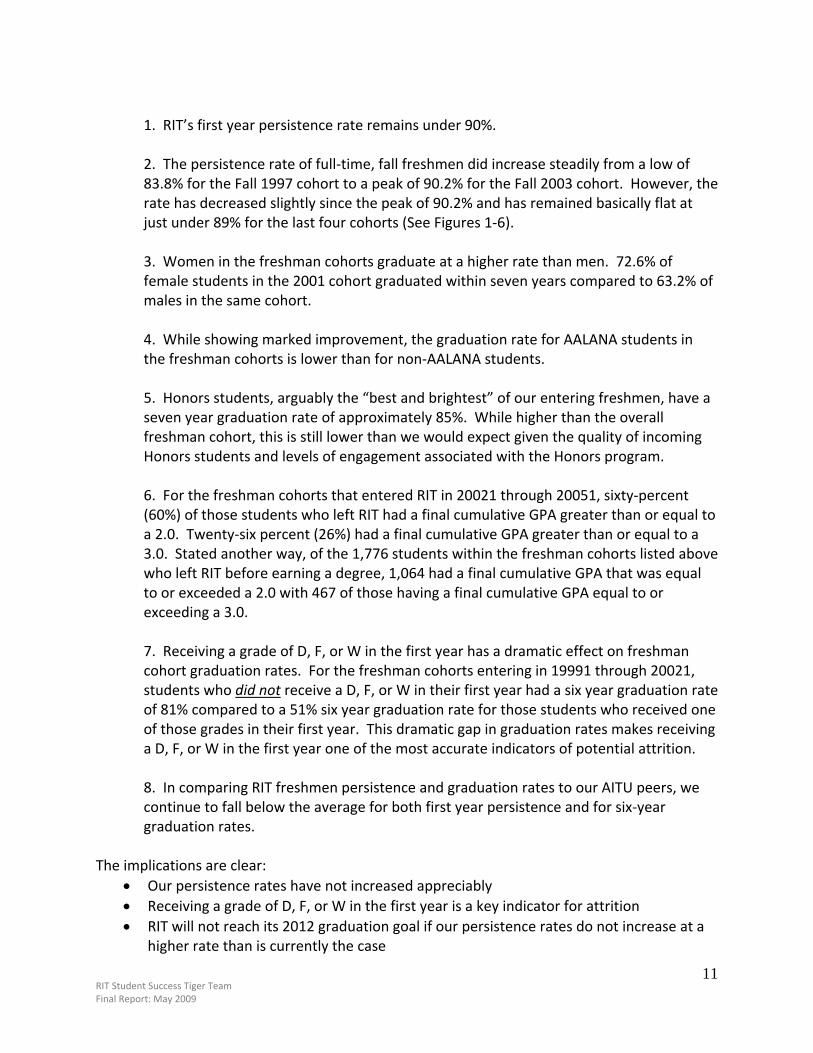
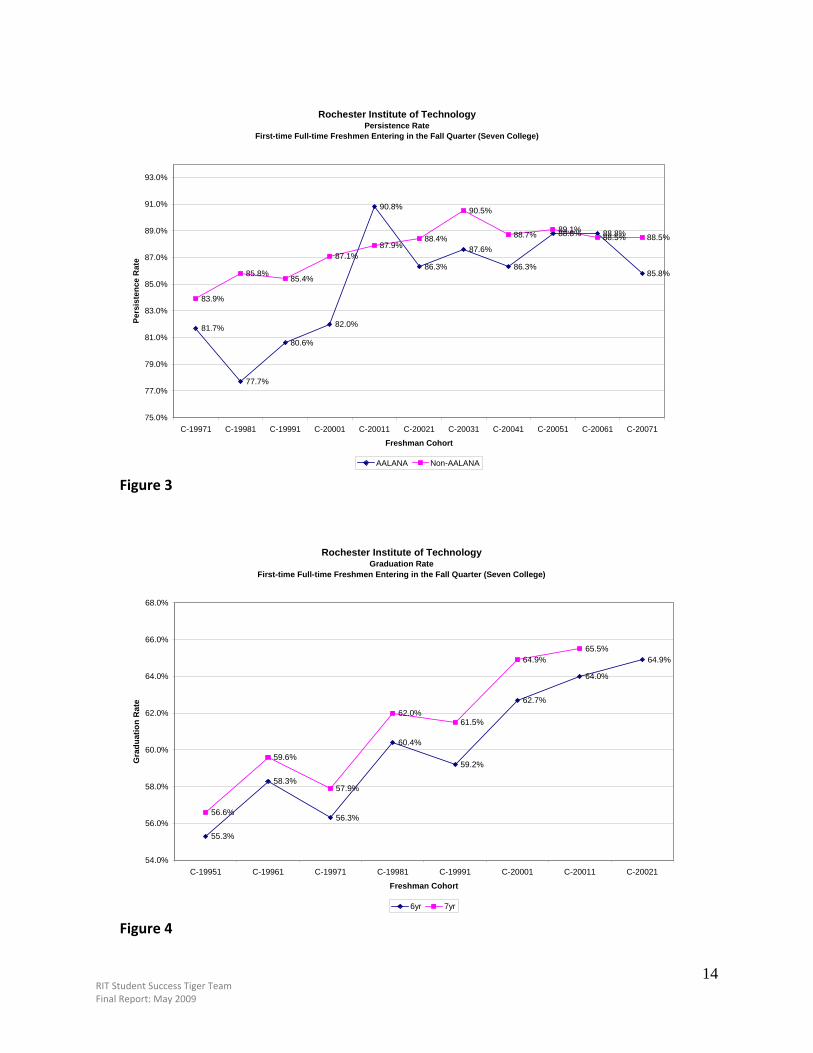
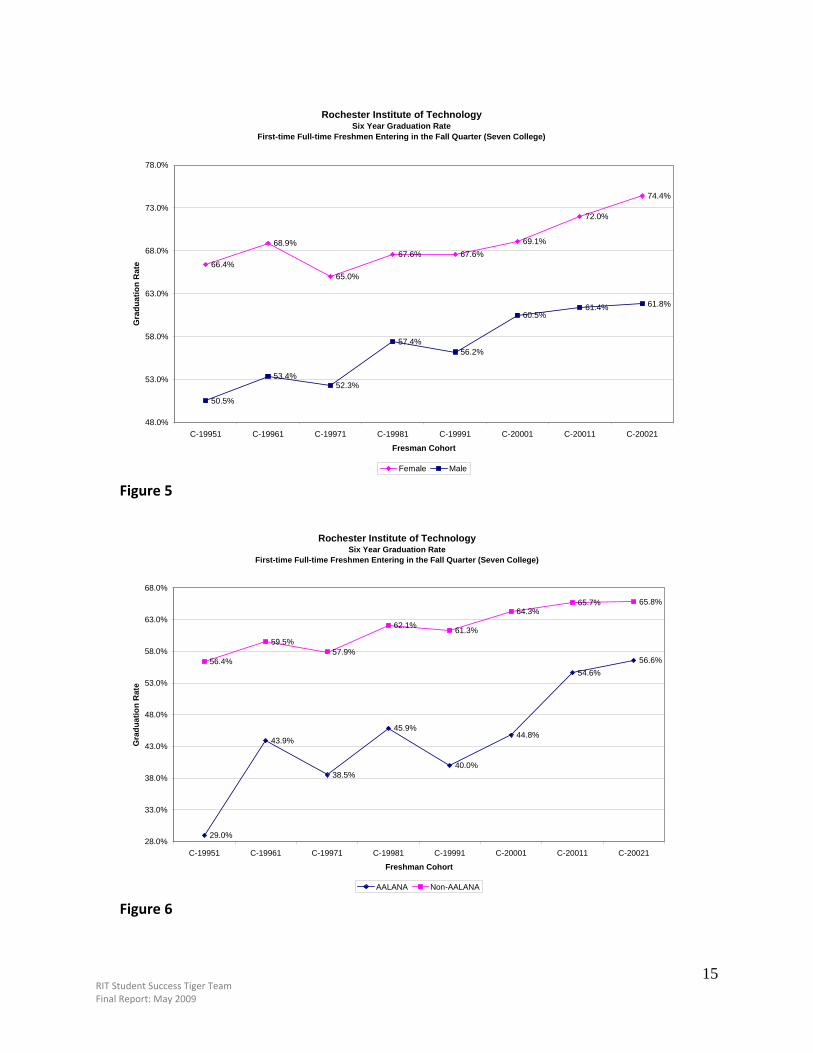
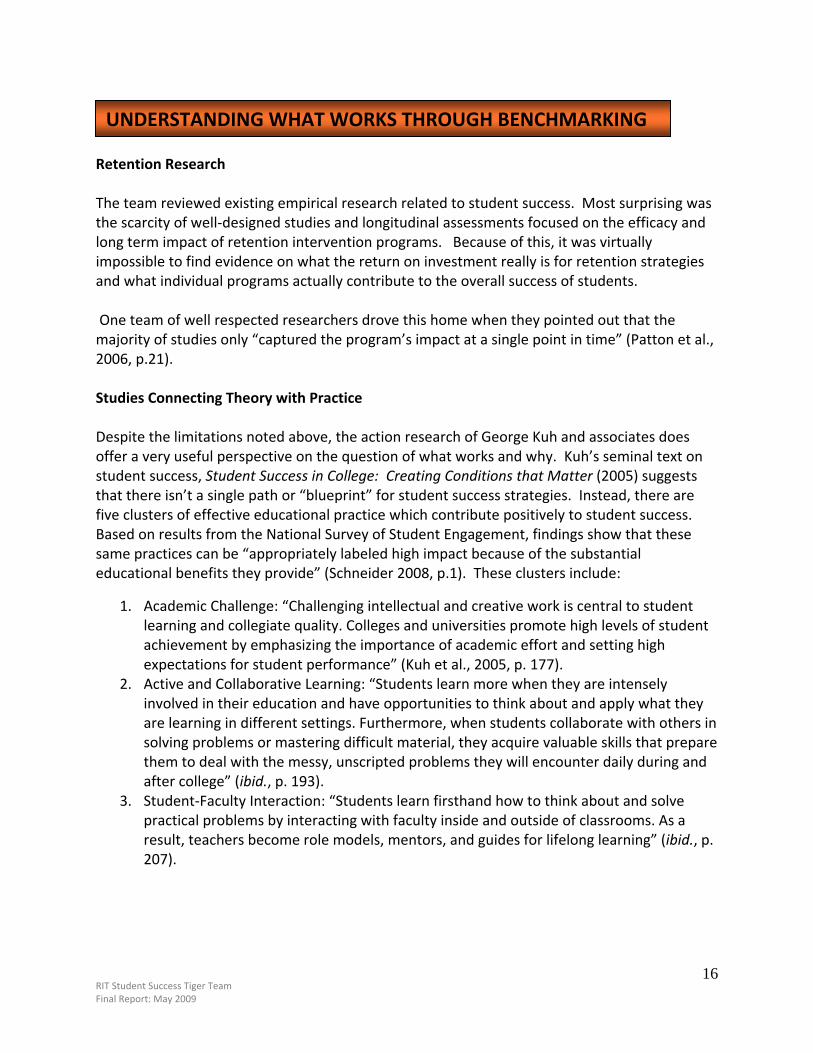
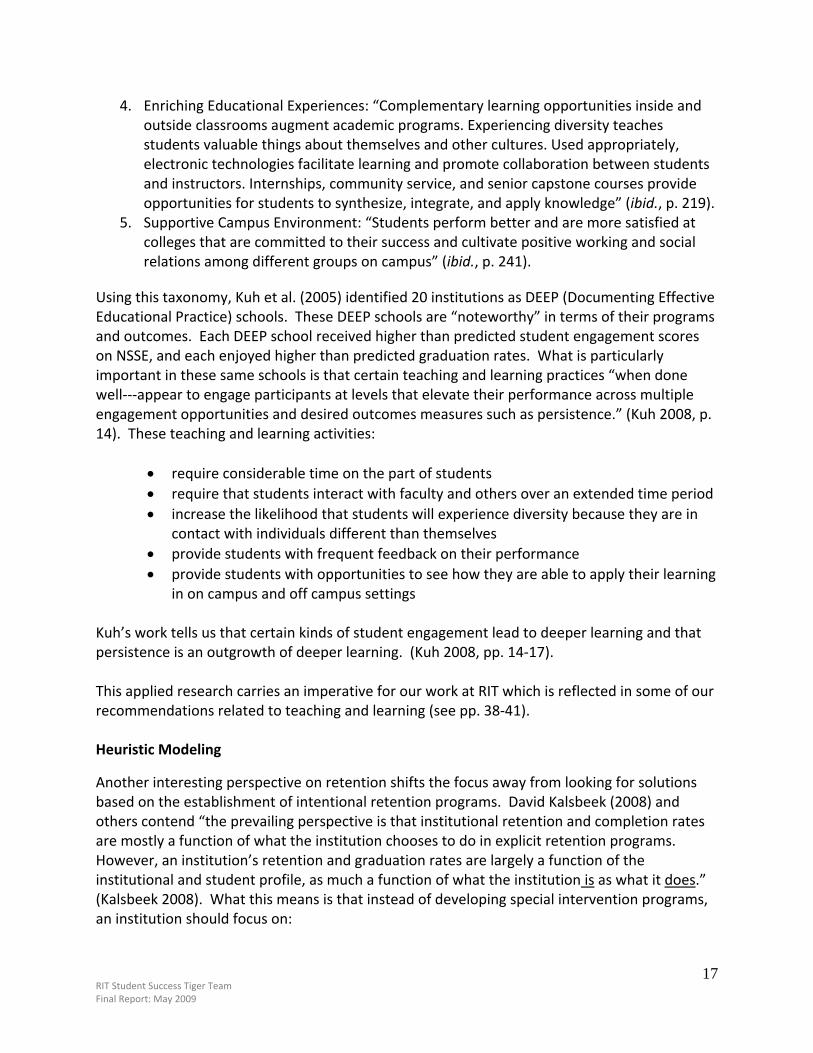
1. RIT’s first year persistence rate remains under 90%. 2. The persistence rate of full‐time, fall freshmen did increase steadily from a low of 83.8% for the Fall 1997 cohort to a peak of 90.2% for the Fall 2003 cohort. However, the rate has decreased slightly since the peak of 90.2% and has remained basically flat at just under 89% for the last four cohorts (See Figures 1‐6). 3. Women in the freshman cohorts graduate at a higher rate than men. 72.6% of female students in the 2001 cohort graduated within seven years compared to 63.2% of males in the same cohort. 4. While showing marked improvement, the graduation rate for AALANA students in the freshman cohorts is lower than for non‐AALANA students. 5. Honors students, arguably the “best and brightest” of our entering freshmen, have a seven year graduation rate of approximately 85%. While higher than the overall freshman cohort, this is still lower than we would expect given the quality of incoming Honors students and levels of engagement associated with the Honors program. 6. For the freshman cohorts that entered RIT in 20021 through 20051, sixty‐percent (60%) of those students who left RIT had a final cumulative GPA greater than or equal to a 2.0. Twenty‐six percent (26%) had a final cumulative GPA greater than or equal to a 3.0. Stated another way, of the 1,776 students within the freshman cohorts listed above who left RIT before earning a degree, 1,064 had a final cumulative GPA that was equal to or exceeded a 2.0 with 467 of those having a final cumulative GPA equal to or exceeding a 3.0. 7. Receiving a grade of D, F, or W in the first year has a dramatic effect on freshman cohort graduation rates. For the freshman cohorts entering in 19991 through 20021, students who did not receive a D, F, or W in their first year had a six year graduation rate of 81% compared to a 51% six year graduation rate for those students who received one of those grades in their first year. This dramatic gap in graduation rates makes receiving a D, F, or W in the first year one of the most accurate indicators of potential attrition. 8. In comparing RIT freshmen persistence and graduation rates to our AITU peers, we continue to fall below the average for both first year persistence and for six‐year graduation rates. The implications are clear:
• Our persistence rates have not increased appreciably • Receiving a grade of D, F, or W in the first year is a key indicator for attrition • RIT will not reach its 2012 graduation goal if our persistence rates do not increase at a
higher rate than is currently the case
RIT Student Success Tiger Team Final Report: May 2009
12
Improved retention and graduation rates will impact the University in a number of ways including fostering higher levels of student engagement, enhancing RIT’s reputation and prestige as a leading university, and enabling greater alumni satisfaction and participation. More specifically, improved retention rates enable the University to be more selective in admissions thereby improving the quality of the overall student body and enabling us to more effectively address the goals of gender balance and ethnic and geographic composition. Given RIT’s tuition dependency, it is appropriate to also consider the economic impact of improved retention rates. The second year retention rate for the 20071 entering seven college freshman cohort was 88.2%. If we retained that cohort at the stated second year retention goal of 93%, an additional 109 students would have returned in 20081. This would have resulted in an additional $3,000,000 in gross tuition revenue. [Note: RIT operates on a net tuition revenue model, so this figure would be reduced to account for the awarding of financial aid.] The point is clear: the economic impact of improved retention is substantial. While President Destler has established goals for one year persistence and six year graduation rates for freshman cohorts, the team believes that additional two, three, and four year goals may be needed. This is based on the fact that RIT loses more students “mid‐career” (in years 2,3, and 4) than most other AITU institutions and an improvement of the one year rate to 93% may not yield a 72% graduation rate without corresponding improvement in the interim years. Having said that, it should also be noted, that because we report one year persistence rates differently than most other AITU institutions (we include LOAs as persisters), this may contribute to the perception that we lose too many students in years 2‐4. The team provides a recommendation later in this report which would modify the way in which we calculate first year retention to match the methodology used in IPEDS reporting. If, however, RIT continues to report first year retention using the current methodology: Recommendation 1: We recommend that the following persistence goals complement the 93/72 goal: Year 2 to 3: 88% Year 3 to 4: 82% Year 4 to 5: 75%
IMPACT OF IMPROVED RETENTION
ADDITIONAL GOALS AND BENCHMARKS NEEDED
RIT Student Success Tiger Team Final Report: May 2009
13
Rochester Institute of TechnologyPersistence Rate
First-time Full-time Freshmen Entering in the Fall Quarter (Seven College)
83.8%
84.9% 84.9%
86.8%
87.8%88.2%
90.2%
88.5%88.9% 88.8%
88.2%
80.0%
82.0%
84.0%
86.0%
88.0%
90.0%
92.0%
C-19971 C-19981 C-19991 C-20001 C-20011 C-20021 C-20031 C-20041 C-20051 C-20061 C-20071
Freshman Cohort
Pers
iste
nce
Rat
e
All
Figure 1
Rochester Institute of TechnologyPersistence Rate
First-time Full-time Freshmen Entering in the Fall Quarter (Seven College)
87.1%
89.6%
87.1%
88.2%
89.6%
91.8%92.1%
93.5%
92.0% 92.0%
90.1%
82.3%82.9%
84.0%
86.3%
87.2% 87.0%
89.6%
87.0%87.7% 87.6% 87.4%
80.0%
82.0%
84.0%
86.0%
88.0%
90.0%
92.0%
94.0%
C-19971 C-19981 C-19991 C-20001 C-20011 C-20021 C-20031 C-20041 C-20051 C-20061 C-20071
Freshman Cohort
Pers
iste
nce
Rat
e
Female Male Figure 2
RIT Student Success Tiger Team Final Report: May 2009
14
Rochester Institute of TechnologyPersistence Rate
First-time Full-time Freshmen Entering in the Fall Quarter (Seven College)
81.7%
77.7%
80.6%
82.0%
90.8%
86.3%
87.6%
86.3%
88.8% 88.8%
85.8%
83.9%
85.8% 85.4%
87.1%87.9%
88.4%
90.5%
88.7% 89.1%88.5% 88.5%
75.0%
77.0%
79.0%
81.0%
83.0%
85.0%
87.0%
89.0%
91.0%
93.0%
C-19971 C-19981 C-19991 C-20001 C-20011 C-20021 C-20031 C-20041 C-20051 C-20061 C-20071
Freshman Cohort
Pers
iste
nce
Rat
e
AALANA Non-AALANA Figure 3
Rochester Institute of TechnologyGraduation Rate
First-time Full-time Freshmen Entering in the Fall Quarter (Seven College)
55.3%
58.3%
56.3%
60.4%
59.2%
62.7%
64.0%
64.9%
56.6%
59.6%
57.9%
62.0%61.5%
64.9%65.5%
54.0%
56.0%
58.0%
60.0%
62.0%
64.0%
66.0%
68.0%
C-19951 C-19961 C-19971 C-19981 C-19991 C-20001 C-20011 C-20021
Freshman Cohort
Gra
duat
ion
Rat
e
6yr 7yr Figure 4
RIT Student Success Tiger Team Final Report: May 2009
15
Rochester Institute of TechnologySix Year Graduation Rate
First-time Full-time Freshmen Entering in the Fall Quarter (Seven College)
66.4%
68.9%
65.0%
67.6% 67.6%69.1%
72.0%
74.4%
50.5%
53.4%52.3%
57.4%56.2%
60.5%61.4% 61.8%
48.0%
53.0%
58.0%
63.0%
68.0%
73.0%
78.0%
C-19951 C-19961 C-19971 C-19981 C-19991 C-20001 C-20011 C-20021
Fresman Cohort
Gra
duat
ion
Rat
e
Female Male Figure 5
Rochester Institute of TechnologySix Year Graduation Rate
First-time Full-time Freshmen Entering in the Fall Quarter (Seven College)
29.0%
43.9%
38.5%
45.9%
40.0%
44.8%
54.6%56.6%56.4%
59.5%57.9%
62.1% 61.3%
64.3%65.7% 65.8%
28.0%
33.0%
38.0%
43.0%
48.0%
53.0%
58.0%
63.0%
68.0%
C-19951 C-19961 C-19971 C-19981 C-19991 C-20001 C-20011 C-20021
Freshman Cohort
Gra
duat
ion
Rat
e
AALANA Non-AALANA Figure 6
RIT Student Success Tiger Team Final Report: May 2009
16
Retention Research The team reviewed existing empirical research related to student success. Most surprising was the scarcity of well‐designed studies and longitudinal assessments focused on the efficacy and long term impact of retention intervention programs. Because of this, it was virtually impossible to find evidence on what the return on investment really is for retention strategies and what individual programs actually contribute to the overall success of students. One team of well respected researchers drove this home when they pointed out that the majority of studies only “captured the program’s impact at a single point in time” (Patton et al., 2006, p.21). Studies Connecting Theory with Practice Despite the limitations noted above, the action research of George Kuh and associates does offer a very useful perspective on the question of what works and why. Kuh’s seminal text on student success, Student Success in College: Creating Conditions that Matter (2005) suggests that there isn’t a single path or “blueprint” for student success strategies. Instead, there are five clusters of effective educational practice which contribute positively to student success. Based on results from the National Survey of Student Engagement, findings show that these same practices can be “appropriately labeled high impact because of the substantial educational benefits they provide” (Schneider 2008, p.1). These clusters include:
1. Academic Challenge: “Challenging intellectual and creative work is central to student learning and collegiate quality. Colleges and universities promote high levels of student achievement by emphasizing the importance of academic effort and setting high expectations for student performance” (Kuh et al., 2005, p. 177).
2. Active and Collaborative Learning: “Students learn more when they are intensely involved in their education and have opportunities to think about and apply what they are learning in different settings. Furthermore, when students collaborate with others in solving problems or mastering difficult material, they acquire valuable skills that prepare them to deal with the messy, unscripted problems they will encounter daily during and after college” (ibid., p. 193).
3. Student‐Faculty Interaction: “Students learn firsthand how to think about and solve practical problems by interacting with faculty inside and outside of classrooms. As a result, teachers become role models, mentors, and guides for lifelong learning” (ibid., p. 207).
UNDERSTANDING WHAT WORKS THROUGH BENCHMARKING
RIT Student Success Tiger Team Final Report: May 2009
17
4. Enriching Educational Experiences: “Complementary learning opportunities inside and outside classrooms augment academic programs. Experiencing diversity teaches students valuable things about themselves and other cultures. Used appropriately, electronic technologies facilitate learning and promote collaboration between students and instructors. Internships, community service, and senior capstone courses provide opportunities for students to synthesize, integrate, and apply knowledge” (ibid., p. 219).
5. Supportive Campus Environment: “Students perform better and are more satisfied at colleges that are committed to their success and cultivate positive working and social relations among different groups on campus” (ibid., p. 241).
Using this taxonomy, Kuh et al. (2005) identified 20 institutions as DEEP (Documenting Effective Educational Practice) schools. These DEEP schools are “noteworthy” in terms of their programs and outcomes. Each DEEP school received higher than predicted student engagement scores on NSSE, and each enjoyed higher than predicted graduation rates. What is particularly important in these same schools is that certain teaching and learning practices “when done well‐‐‐appear to engage participants at levels that elevate their performance across multiple engagement opportunities and desired outcomes measures such as persistence.” (Kuh 2008, p. 14). These teaching and learning activities:
• require considerable time on the part of students • require that students interact with faculty and others over an extended time period • increase the likelihood that students will experience diversity because they are in
contact with individuals different than themselves • provide students with frequent feedback on their performance • provide students with opportunities to see how they are able to apply their learning
in on campus and off campus settings
Kuh’s work tells us that certain kinds of student engagement lead to deeper learning and that persistence is an outgrowth of deeper learning. (Kuh 2008, pp. 14‐17). This applied research carries an imperative for our work at RIT which is reflected in some of our recommendations related to teaching and learning (see pp. 38‐41). Heuristic Modeling
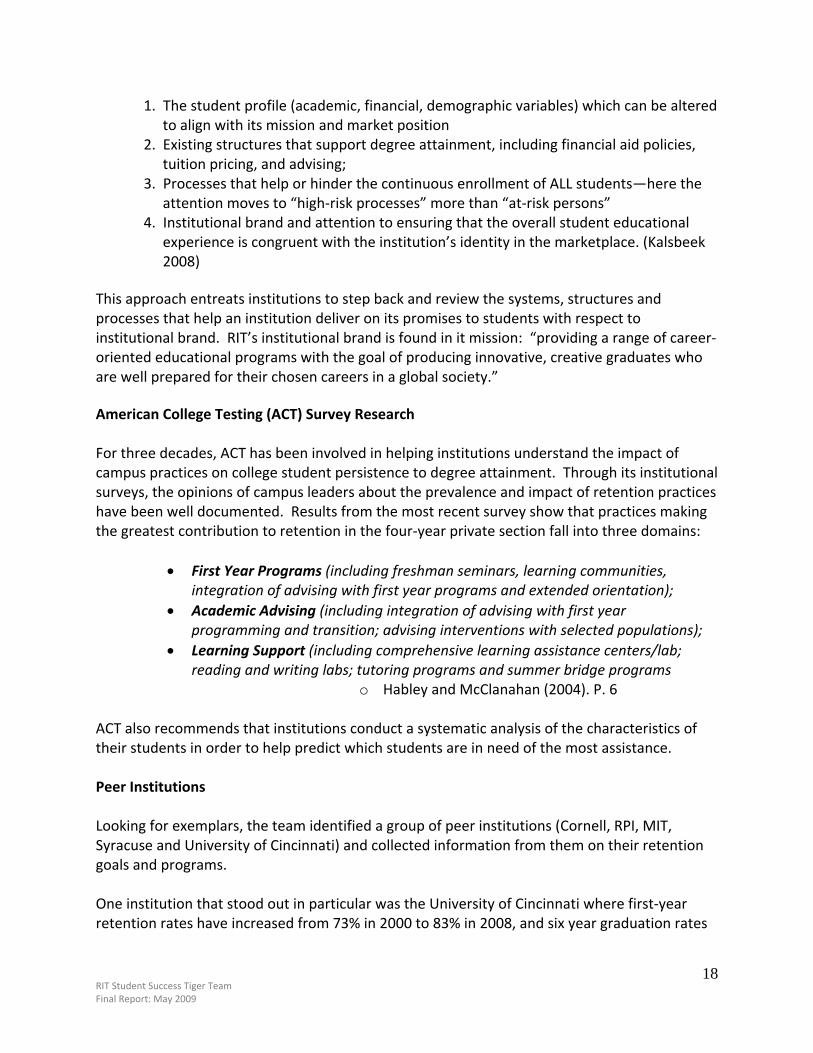
Another interesting perspective on retention shifts the focus away from looking for solutions based on the establishment of intentional retention programs. David Kalsbeek (2008) and others contend “the prevailing perspective is that institutional retention and completion rates are mostly a function of what the institution chooses to do in explicit retention programs. However, an institution’s retention and graduation rates are largely a function of the institutional and student profile, as much a function of what the institution is as what it does.” (Kalsbeek 2008). What this means is that instead of developing special intervention programs, an institution should focus on:
RIT Student Success Tiger Team Final Report: May 2009
18
1. The student profile (academic, financial, demographic variables) which can be altered to align with its mission and market position
2. Existing structures that support degree attainment, including financial aid policies, tuition pricing, and advising;
3. Processes that help or hinder the continuous enrollment of ALL students—here the attention moves to “high‐risk processes” more than “at‐risk persons”
4. Institutional brand and attention to ensuring that the overall student educational experience is congruent with the institution’s identity in the marketplace. (Kalsbeek 2008)
This approach entreats institutions to step back and review the systems, structures and processes that help an institution deliver on its promises to students with respect to institutional brand. RIT’s institutional brand is found in it mission: “providing a range of career‐oriented educational programs with the goal of producing innovative, creative graduates who are well prepared for their chosen careers in a global society.” American College Testing (ACT) Survey Research For three decades, ACT has been involved in helping institutions understand the impact of campus practices on college student persistence to degree attainment. Through its institutional surveys, the opinions of campus leaders about the prevalence and impact of retention practices have been well documented. Results from the most recent survey show that practices making the greatest contribution to retention in the four‐year private section fall into three domains:
• First Year Programs (including freshman seminars, learning communities, integration of advising with first year programs and extended orientation);
• Academic Advising (including integration of advising with first year programming and transition; advising interventions with selected populations);
• Learning Support (including comprehensive learning assistance centers/lab; reading and writing labs; tutoring programs and summer bridge programs
o Habley and McClanahan (2004). P. 6
ACT also recommends that institutions conduct a systematic analysis of the characteristics of their students in order to help predict which students are in need of the most assistance.
Peer Institutions Looking for exemplars, the team identified a group of peer institutions (Cornell, RPI, MIT, Syracuse and University of Cincinnati) and collected information from them on their retention goals and programs. One institution that stood out in particular was the University of Cincinnati where first‐year retention rates have increased from 73% in 2000 to 83% in 2008, and six year graduation rates
RIT Student Success Tiger Team Final Report: May 2009
19
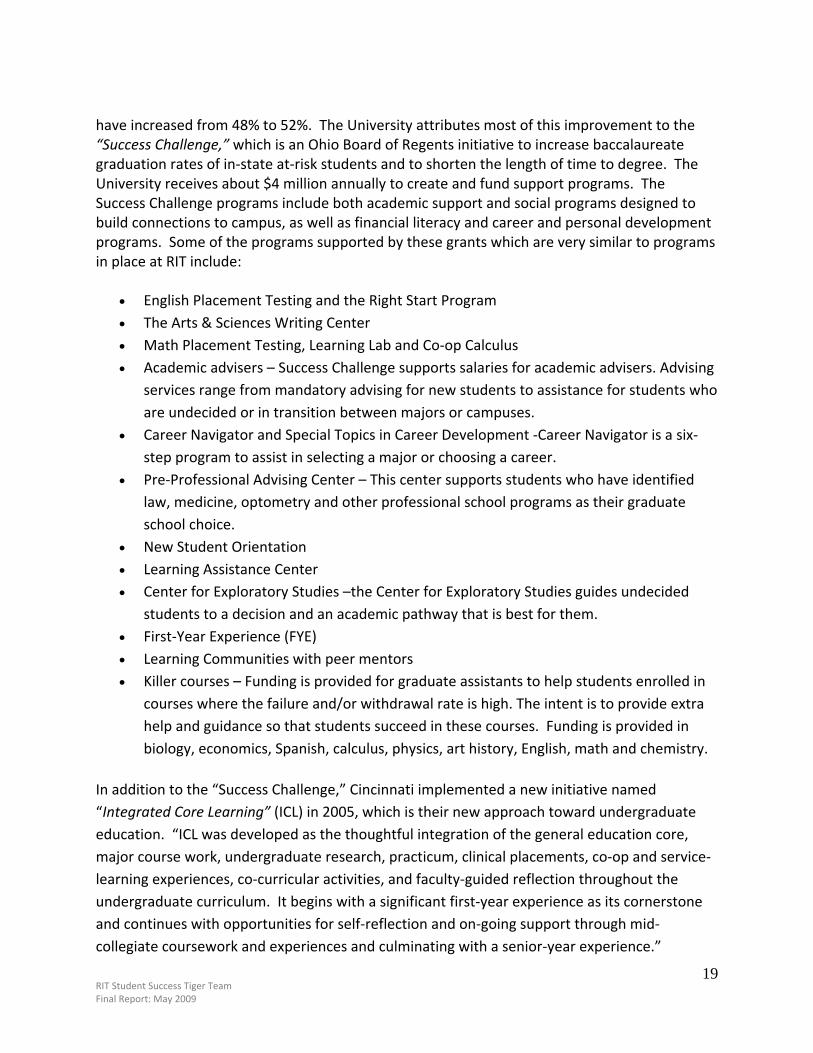
have increased from 48% to 52%. The University attributes most of this improvement to the “Success Challenge,” which is an Ohio Board of Regents initiative to increase baccalaureate graduation rates of in‐state at‐risk students and to shorten the length of time to degree. The University receives about $4 million annually to create and fund support programs. The Success Challenge programs include both academic support and social programs designed to build connections to campus, as well as financial literacy and career and personal development programs. Some of the programs supported by these grants which are very similar to programs in place at RIT include:
• English Placement Testing and the Right Start Program • The Arts & Sciences Writing Center • Math Placement Testing, Learning Lab and Co‐op Calculus • Academic advisers – Success Challenge supports salaries for academic advisers. Advising
services range from mandatory advising for new students to assistance for students who are undecided or in transition between majors or campuses.
• Career Navigator and Special Topics in Career Development ‐Career Navigator is a six‐step program to assist in selecting a major or choosing a career.
• Pre‐Professional Advising Center – This center supports students who have identified law, medicine, optometry and other professional school programs as their graduate school choice.
• New Student Orientation • Learning Assistance Center • Center for Exploratory Studies –the Center for Exploratory Studies guides undecided
students to a decision and an academic pathway that is best for them. • First‐Year Experience (FYE) • Learning Communities with peer mentors • Killer courses – Funding is provided for graduate assistants to help students enrolled in
courses where the failure and/or withdrawal rate is high. The intent is to provide extra help and guidance so that students succeed in these courses. Funding is provided in biology, economics, Spanish, calculus, physics, art history, English, math and chemistry.
In addition to the “Success Challenge,” Cincinnati implemented a new initiative named “Integrated Core Learning” (ICL) in 2005, which is their new approach toward undergraduate education. “ICL was developed as the thoughtful integration of the general education core, major course work, undergraduate research, practicum, clinical placements, co‐op and service‐learning experiences, co‐curricular activities, and faculty‐guided reflection throughout the undergraduate curriculum. It begins with a significant first‐year experience as its cornerstone and continues with opportunities for self‐reflection and on‐going support through mid‐collegiate coursework and experiences and culminating with a senior‐year experience.”
RIT Student Success Tiger Team Final Report: May 2009
20
Finally, the institution does a very good job of identifying goals, tracking and assessing results and communicating these results. The annual report from the President is a good example of this. See: http://www.uc.edu/reportcard/Sept08/2008reportcard.pdf. We recommend that RIT consider a similar reporting approach. Using this national research and data as background, the team examined RIT’s current retention programs—asking the important question: How does RIT Measure Up on Programs and Outcomes as compared to what the field defines as high impact best practice.
Over the past eight years, RIT has established a variety of intentional retention strategies and tactical approaches to support student success. Most of these strategies align very well with what the field defines as exemplary. Many of these programs are a direct outgrowth of previous retention committee suggestions and previous Strategic Plans. The chart in Appendix C outlines these retention programs, describes the program’s goals, numbers of students served and the specific type of outcome assessment that has been accomplished. The table below summarizes how each of these RIT strategies maps to “best practice” in the field and whether or not we have collected data to show the affect of the strategy on student retention. The team realizes that this list is not all encompassing but represents the significant initiatives undertaken.
HOW DOES RIT MEASURE UP?
RIT Student Success Tiger Team Final Report: May 2009
21
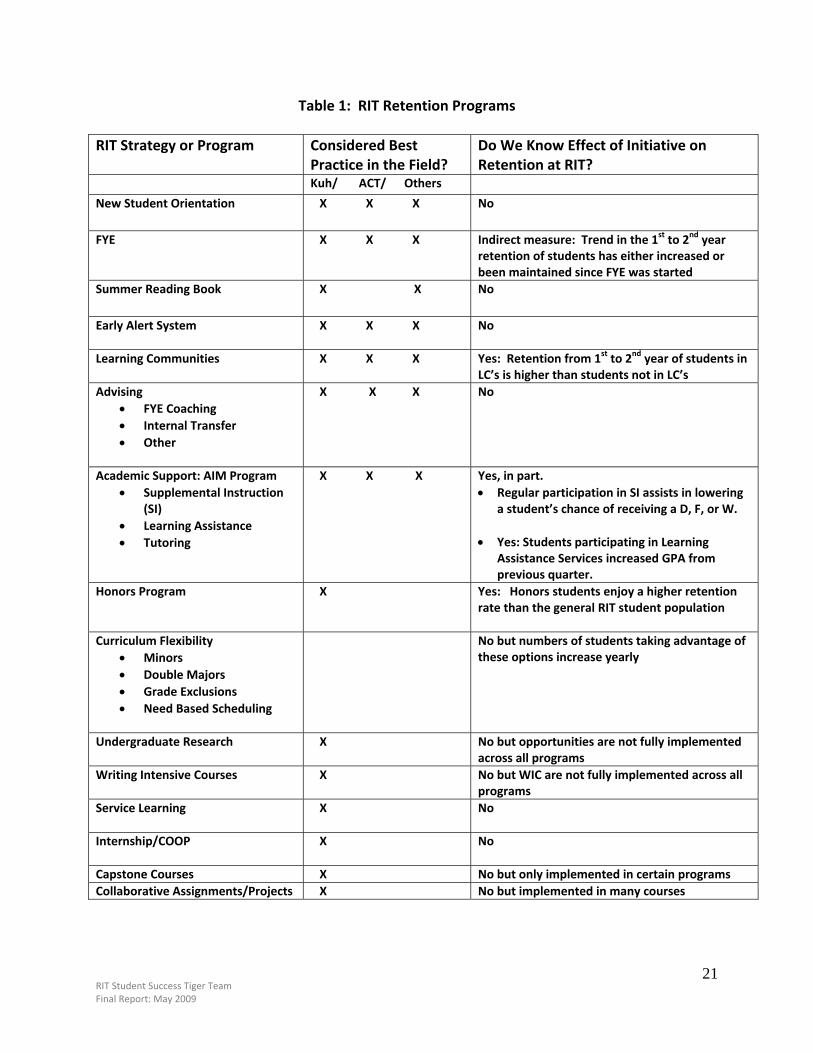
Table 1: RIT Retention Programs RIT Strategy or Program Considered Best
Practice in the Field? Do We Know Effect of Initiative on Retention at RIT?
Kuh/ ACT/ Others
New Student Orientation
X X X No
FYE
X X X Indirect measure: Trend in the 1st to 2nd year retention of students has either increased or been maintained since FYE was started
Summer Reading Book
X X No
Early Alert System X X X No
Learning Communities
X X X Yes: Retention from 1st to 2nd year of students in LC’s is higher than students not in LC’s
Advising • FYE Coaching • Internal Transfer • Other
X X X No
Academic Support: AIM Program • Supplemental Instruction
(SI) • Learning Assistance • Tutoring
X X X Yes, in part. • Regular participation in SI assists in lowering
a student’s chance of receiving a D, F, or W. • Yes: Students participating in Learning
Assistance Services increased GPA from previous quarter.
Honors Program X Yes: Honors students enjoy a higher retention rate than the general RIT student population
Curriculum Flexibility • Minors • Double Majors • Grade Exclusions • Need Based Scheduling
No but numbers of students taking advantage of these options increase yearly
Undergraduate Research X No but opportunities are not fully implemented across all programs
Writing Intensive Courses
X No but WIC are not fully implemented across all programs
Service Learning
X No
Internship/COOP
X No
Capstone Courses X No but only implemented in certain programsCollaborative Assignments/Projects X No but implemented in many courses
RIT Student Success Tiger Team Final Report: May 2009
22
Scoring RIT From this table, a recurring theme emerges: RIT is program rich but outcomes information poor. While we have implemented many of the retention strategies considered to be “best practice,” with the exception of a handful, we have not assessed their individual or combined efficacy and impact. This is not surprising because this form assessment is complicated and difficult. Some would say it is virtually impossible to accomplish. In fact, we could NOT find examples of institutions that have developed evaluation protocols and measured results in this way. Most institutions take a holistic view of their retention plans, citing overall increases in retention and graduation as the indicator of collective programmatic effectiveness. Some use NSSE results as a surrogate measure for providing educational practices that lead to student engagement and overall success (i.e., program completion). The National Survey of Student Engagement (NSSE) is a student survey that assesses the extent to which students engage in educational practices associated with high levels of learning and development. The survey is administered to both first year and senior‐level students. RIT has participated in the survey since 2001. NSSE tracks levels of student engagement according to five domains of effective educational practice, which have been associated with higher‐than‐predicted graduation rates (Kuh et al. 2005). These domains were summarized previously and include:
• Level of Academic Challenge • Active and Collaborative Learning • Student‐Faculty Interaction • Enriching Educational Experiences • Supportive Campus Environment
NSSE (2007) provides benchmarking data to institutions for each of the five domains compared to custom peer groups (i.e., universities with similar program portfolios) and highly engaging institutions (i.e., those that score in the top 10% and 50% on the survey items). NSSE Results With respect to the peer group comparison, RIT’s rated similarly in most domains, including Active and Collaborative Learning, Student‐Faculty Interaction, and Supportive Campus Environments. There were two areas, however, where RIT scored lower than its peer group:
• Enriching Educational Experiences: RIT received significantly lower ratings from first year and senior level students than did our peer institutions.
• Level of Academic Challenge: RIT received significantly lower ratings from first year students in this area than did our peer institutions.
RIT Student Success Tiger Team Final Report: May 2009
23
The peer group comparison is significant because it highlights areas in which RIT is underperforming relative to institutions with a similar program portfolio. The comparison to highly engaging institutions, however, is equally or more important because it illustrates RIT’s performance relative to institutions that are highly engaging in the educational practices shown to be associated with higher‐than‐expected graduation rates (Kuh et al. 2005). The comparison to highly engaging institutions provides a more sobering picture. Compared to highly engaging institutions, RIT scored significantly lower in all five domains of effective educational practice outlined above. These findings persisted among first year and senior level students and compared both to institutions that scored in the top 10% and top 50% of NSSE scores. Effect sizes ranged from small to moderate. In order for RIT to significantly raise its graduation rates, it must improve in these areas. Category III Recommendations that follow will help address this needed improvement. Summary The external scan of retention research, review of high impact educational practices and examination of peer institutional approaches provide strong affirmation that, for the most part, RIT’s retention strategies and tactics compare very favorably to what one finds categorized in the field as “best practice.” The team came away from this analysis with clarity that our challenge is not to add additional retention strategies but to provide better coordination and integration among the current strategies; to track program outcomes in a systematic way and to explore ways in which RIT can increase levels of student engagement as defined by Kuh. In arriving at a set of recommendations, the team focused on what actions are needed to help the University coordinate and calibrate its retention strategies in a more exacting and impactful way. In the end, future planning should lead to a more intentional and systemic approach to how we support student success. Given limited resources, we must leverage and maximize what we currently offer and develop an integrated system where the whole is bigger than any one of the parts. Recommendation 1: We recommend that the following persistence goals complement the 93/72 goal: Year 2 to 3: 88% Year 3 to 4: 82% Year 4 to 5: 75%
RECOMMENDATIONS
RIT Student Success Tiger Team Final Report: May 2009
24
Category I Recommendations: Predicting and Facilitating Student Transitions and Success Institutions with higher than expected graduate rates have three things in common:
• High student participation in advising and counseling • An intentional academic planning process for students • Educational innovations that assist student learning
Source: ( Muraskin, L. and Lee, J. [2004, December]. Raising the graduation rates of low‐income college students. The Pell Institute for the Study of Opportunity in Higher Education. Retrieved September 1, 2007 from http://www.pellinstitute.org.gradrates/Pell_Web.pdf.) See: http://www.nacada.ksu.edu/Webinars/documents/W06Handout_filledin_000.doc
Our recommendations build on this same equation. There are multiple transitions that a college student experiences throughout the academic career. The transitions are often considered bookends beginning with the high school to college transition and finishing with the transition from college to a career or graduate school. The Tiger Team examined existing campus transition programs, compared them with best practices data, and concluded that these programs should each continue but be strengthened and supported in very specific ways. [Programs included here are: Orientation, FYE, Intentional and Intrusive Advising (including AIM), Learning Communities, Early Alert and Senior Year Experiences.] Academic Advising Program and Services The research of renowned Harvard professor, Richard Light (2001) strongly suggests that “Good advising may be the single most underestimated characteristic of a successful college experience.” Recommendation 2: Establish an Institute Academic and Advising Information Center
a. Establish a designated central office (name to be determined) to include advising that is accessible and consistent across the University, staffed by individuals with general University knowledge who can assist students (particularly first year students) with their questions and needs and make appropriate referrals.
b. Such a program should have ties with FYE and other programs for students known to be at risk including HEOP, Northstar, and McNair.
c. Though the office might not be named the “Institute Advising Office” (it may cause confusion since departments and colleges also include advising), a person should be
RIT Student Success Tiger Team Final Report: May 2009
25
designated to provide overall direction for the office, whose primary responsibility would be to coordinate and share advising information with all academic advisors across the University. The Institute Advising Office currently coordinates advising information and shares it with advisors through the RIT Advisors Council. The following actions may be led and coordinated by this office in order to increase the consistency of advising across colleges: • Assess current academic standards and adjust standards /language if necessary. • Revise policy on academic advising to better reflect services and standards that have
been implemented since last revision (1975). • Partner with the Director of Student Learning Outcomes Assessment in order to
establish and recommend minimum baseline advising assessment strategies that can be implemented across colleges.
Recommendation 3: Expand Intentional Advising with Students
a. Academic advisors should be connected with common first year courses (e.g., FYE and other first year seminars). b. In the reframing of FYE, if students remain assigned to sections by major, it should be mandatory that within the first couple of weeks of the first quarter that the instructor of the course invite the assigned academic advisor to the class (or use come other pro‐active strategy) to ensure that the student knows who their academic advisor is and where to find him/her. c. The academic advisor should explain the advising structure of the college and/or department as well as more fully explain the general education requirements and other important topics such as program transfer. d. If the reconfiguration of the FYE results in students assigned to a given section that are not from the same program, requiring students to meet with their academic advisor is still critical. One way to assure this happens is to place holds on the registration of first year students who fail to meet with their academic advisor prior to registration‐‐ only the academic advisor can release the hold. This meeting should occur within the first 5 weeks of each quarter and could be supported by having this become an assignment in the common first year course. This would result in all first year students meeting with their advisor at least twice during the first year. e. Additionally, students with a D, W, or F should be required to meet with their academic advisor during the quarter following the D, W, or F. Registration should be blocked until such a meeting occurs and the advisor has lifted the hold. This meeting would focus on a discussion about why the unsatisfactory grade occurred and the development of a plan for recovery. Students would be encouraged to schedule this
RIT Student Success Tiger Team Final Report: May 2009
26
meeting with their advisor prior to week four of the quarter so registration is not delayed. f. In addition to the expectations for students with D, F, & W grades articulated above, students on academic probation should also be required to meet with their academic advisor at appropriate periodic intervals. The advisor and student should discuss academic standards, minimum grade requirements, and any other relevant information regarding RIT academic policies. The academic department should clearly state any expectations the academic department has of the student (e.g., number of advising meetings in the quarter, minimum grade expectations, etc). Additionally, RIT advisors should be expected to assist students to identify appropriate services that may be beneficial for student development and success. g. A pre‐certification degree audit should be completed for students upon completion of 90 credit hours, normally in the fall quarter of the third year. This type of audit can help align course planning with degree requirements. The academic advisor should schedule a meeting with any student determined to be “falling behind” in progress toward degree certification.
h. Other possibilities for more intentional interaction between students and advisors include taking steps to ensure that individuals asked to provide advising make this a priority in their schedule and that advising is specifically built into their job description or in the case of faculty, the plan of work. Adjustments to workload should be made as appropriate to accommodate the number of advisees assigned. In the case of faculty, the workload portfolio should be flexible enough so that faculty who are particularly skilled and interested in advising can elect to take on more responsibilities for advising. Colleges need to examine how advising resources can be arranged to maximize student success and how to scale up successful advising practices that work.
In some colleges, given the competing demands on faculty time, the addition of professional advisors may be needed in order to accomplish this goal.
Recommendation 4: Create a mechanism/process to comprehensively triage, manage, and coordinate student success. The director of the Institute Academic and Advising Information Center, in collaboration with the Advising Council, should examine highly effective campus models that already exist to identify and discuss students in crises, such as the Student Behavior Consultation Team (SBCT) which is coordinated by the Center for Student Conduct. A similar team tied to predictive modeling and advising might be useful in order to identify and provide safety nets for students who are at risk upon entry or in academic crisis and in danger of leaving the University. (See recommendation # 15 below regarding conducting a data mining study to increase our understanding of the factors that are related to student success and to inform the development and implementation of retention strategies)
RIT Student Success Tiger Team Final Report: May 2009
27
Recommendation 5: Strengthen Advisor Education and Recognition
a. Provide mandatory regular and consistent education and training for advisors. This training should include clarifying expectations for academic advisors and how the advising system can complement RIT’s other student success initiatives. This training program could be accomplished through the Institute‐wide office. Professional development workshops (created & delivered by RIT colleagues with expertise in specific topic areas) are currently being offered through the RIT Advisors Council and the Center for Professional Development. Consider increasing these offerings to allow for varying levels of advisor experience, training, and education. This would allow for a more robust array of professional development opportunities. b. Offer an academic advisement track within the Faculty Institute on Teaching and Learning (FITL) each year. This would provide faculty with an opportunity to participate in professional development explicitly focused on advising practices. It would also serve to elevate the importance of academic advising with respect to faculty. c. Identify inconsistencies in advising practices and services across colleges. Work with Deans or their delegates to determine minimum baseline expectations for all advising across colleges and provide necessary advisor training and development. These expectations, once determined, should be shared in an accessible, electronic format so that students may access them.
Recommendation 6: Recognize Faculty and Staff for Good Advising
a. Include advisement in faculty plans of work (POW), when appropriate. b. Make appropriate work load adjustments to include recognition of large advising loads. c. Include advisement in staff plans of work, when appropriate, and when not already part of one’s job description. d. Develop, if necessary, a new staff level for individuals who advise students as part of their job. e. Reward good advising day in and day out. Consider a university level annual award, similar to the Eisenhart, which would bring visibility and recognition to the importance of good advising.
RIT Student Success Tiger Team Final Report: May 2009
28
FYE and Learning Communities The First Year Enrichment Program and Learning Communities were both under separate University review during the course of this academic year. The First Year Enrichment Program was charged with examining how it might change in the future to heighten student satisfaction, promote greater student engagement and align with the general education curriculum. In the case of Learning Communities, an external consultant from Syracuse University was hired to recommend possible future directions based on a review of program goals, program outcomes and student/faculty satisfaction. Because of this ongoing assessment, the Tiger Team did not focus its attention on these two programs but offers the following suggestion for how to place the soon‐to‐be received recommendations from these two efforts within a larger RIT context.
Recommendation 7: Collaboration, Coordination and Integration A cross‐functional team of University representatives should better define the purpose, expected outcomes, opportunities for collaboration, and the curricular alignment of FYE, Learning Communities, general education, common reading book, and Orientation activities in order to provide a cohesive vision and coordinated approach for these important transition programs. This charge might be part of a standing committee on student retention or could be assigned to a separate team. (NOTE: This particular recommendation was developed before the AAC&U Greater Expectations team project was launched. The Greater Expectations project team has been tasked to develop a plan that responds to this recommendation.)
Orientation Program The orientation program at RIT is intended to welcome new students to the RIT community and introduce them to life within their college. Currently, the orientation program is a week long. Orientation is followed by 2 required quarters of FYE. Although historically the departments of Orientation and FYE were once one, they have worked separately on opposite sides of the campus for the past six years under the Student Affairs umbrella. In Fall 2009, Orientation and FYE will move to one central office area in the new Campus Center. This move has renewed conversations about the synergy that can be created when the two departments work together within one area. The renewed partnership will afford better connections between Orientation and FYE staffs and allow for a more seamless experience for new students.
RIT Student Success Tiger Team Final Report: May 2009
29
Recommendation 8: Orientation should adopt multidisciplinary strategies. Historically, RIT assembles new students into groups by college affiliation. Beginning with orientation, groups of 25 students are aptly led by an upper‐level Orientation Assistant (OA) who is a member of the same college. While this organizational structure allows students to become acquainted with their own college, it is not the national norm and it limits opportunities for multidisciplinary sharing and advances the “silo” mentality. Adopting a multidisciplinary approach and grouping students by interest, residence hall/off‐campus status, or other affinity groups would allow students to meet peers from outside their own colleges – thus expanding their peer circles and giving them the chance to learn about RIT built on a new foundation of institutional affinity.
Recommendation 9: Shorten the orientation program. Based on feedback of orientation and national benchmarks, RIT’s program is comprehensive, but long. The Orientation department is considering alternative options for the length of the week long program. Feedback from students and many faculty/staff suggests a fatigue factor associated with participating in a week of orientation activities. Shortening the length of the orientation program from the current eight days to four or five days would be a drastic, yet potentially positive change in RIT culture.
a. The program should be shortened to lesson fatigue on students, staff, and faculty. b. Major elements of the program should be maintained, including some form of college day. c. Develop a variety of optional summer programs, in addition to orientation, to assist interested students in becoming familiar with the University.
Early Alert System The Tiger Team conducted a survey of students and faculty regarding their usage and satisfaction with the current early alert system. Responses were received from 256 faculty and 778 students. In general students reported a more favorable opinion of early alerts than did the faculty. Here is a brief summary of the findings: Students:
• 82% reported taking some type of action after receiving an alert • 69% thought that alerts were definitely or somewhat effective in communicating the
intended message • 62% thought that alerts were definitely or somewhat helpful in improving their ability to
be successful in the course • 56% thought that alerts were always or usually received in time to improve performance • 54% thought that alerts were definitely or somewhat helpful in improving
communications with the instructor.
RIT Student Success Tiger Team Final Report: May 2009
30
Faculty: • 70% reported that a majority of students do not respond to the alert • Just under 50% thought that alerts were definitely or somewhat likely to improve
student success in their course, however, 60% thought that the alerts were definitely or somewhat helpful with improving communication with the student.
• With regard to the new format that was implemented in 2007, 60% of those who had used the old format thought the new format was an improvement. There were, however, many comments from the faculty that the new format was too restrictive and too “boilerplate.”
Recommendation 10: Improve and enforce Early Alert System components. a. All instructors should be required to use the early alert system to communicate with undergraduate students (specific year levels—especially 1st and 2nd year students) no later than the fourth week of the quarter if there are any signs of poor performance. Wherever possible, instructors should include supportive suggestions for how the student can “recover.”
b. Students should be required to contact the instructor and/or advisor to consult about appropriate steps to improve performance within one week of receiving an early alert.
c. In the event that a student doesn’t respond to an early alert, require that an advisor follow‐up on any alert within one week of receiving a copy of an alert for an advisee. Priority should be given to students receiving more than one alert or receiving an alert in a gatekeeping course.
d. Early alert information needs to be easily accessible to instructors, advisors and academic departments on‐line, with the capability to document the results of follow‐up communications with the students.
e. The Registrar’s Office should report the usage rates of early alerts and the resulting percentage of D, F, and W grades for student receiving alerts to academic departments and colleges quarterly.
f. The Registrar’s Office should be tasked to work with Academic Senate to continue to improve the early alert format to address the concerns expressed by faculty through the survey.
g. Train new faculty in the Early Alert system during RIT’s New Faculty Orientation Program. Senior Year Experience Initiatives Efforts to enhance the senior year experience (SYE) and transition for students have taken many forms. From departmental and College “capstone” courses to developmental programs
RIT Student Success Tiger Team Final Report: May 2009
31
offered through Student Affairs and Coop and Career Services. According to national data, as well as focus groups conducted with seniors at RIT, SYE programs enhance a student’s satisfaction with a university. Currently, efforts advertised as “SYE” programming are coordinated out of the RIT Leadership Institute (RLI). An SYE task force, which is co‐divisional, was established in 2006 and continues to coordinate efforts to enhance the lives of students transitioning from RIT. In 2009, based on overwhelming student feedback, RIT will host a “senior week” of activities designed to celebrate graduation. Recommendation 11: Continue to focus, enhance and expand programs and services for upper‐level students. Category II Recommendations: Infrastructure and Enabling Factors Critical To Student Success Kuh et al. (2005) notes that schools with effective educational practices, as measured by above‐average student engagement and graduation rates, possess a steady, unwavering commitment to student learning. This tenacious commitment to student learning and success is demonstrated differently at different schools but is notably infused throughout institutional policies, pedagogical practices and resource allocation in order to create learning conditions that maximize student potential. Recommendation 12: Establish a campus‐wide planning team and a visible individual to coordinate the team. While everyone on campus has a role in promoting student retention, there is a need for a broad‐based, campus planning team to study student needs, develop University‐wide recommendations which address those needs, oversee the implementation of the recommendations, and assess the implementation and impact of retention strategies. The team will:
• Systematically review student data to understand student needs and the factors that differentiate students who stay versus those who leave
• Identify needs to be addressed, set priorities, and research successful retention strategies
• Implement selected strategies • Assess the strategies (both implementation and impact) to identify opportunities
for program improvement and to assess the effect of such strategies on student outcomes
ACT (2004) notes that the person selected to coordinate the campus planning team must be visible in both position level and title because this communicates to the campus community the priority campus leaders place on retention issues. Also important is the involvement of multiple stakeholders on the planning team, including faculty, staff, and students from all areas of academic and campus life.
RIT Student Success Tiger Team Final Report: May 2009
32
Recommendation 13: Educate our workforce about each member’s role in student success and retention. Each member of the campus community has a role in promoting student engagement, student learning, and ultimately student success. The issue of student success and retention is not a special project with a finite beginning and end, but rather a core component of the University’s institutional effectiveness. There are a variety of ways to promote awareness about student retention and approaches should be tailored to the needs of individual units across campus. Possible strategies include:
• Site‐based professional development related to student retention for departments, divisions, and colleges;
• Inclusion of a student retention component in unit‐level strategic plans or scorecards;
• Regular features in campus publications, such as News & Events and the Reporter; and
• Supervisory support and encouragement of volunteer participation in campus‐wide events such as graduation and the RIT Innovation and Creativity Festival.
A Campus‐Wide Culture of Assessment and Data‐Informed Decision Making Recommendation 14: Incorporate a planning‐assessment cycle into all academic and administrative initiatives to develop a university‐wide culture of assessment and data‐informed decision making. While certain units of the University have well‐developed assessment and analysis activities, the use of data to inform decision making historically has not been pervasive throughout the RIT campus. In the team’s review of RIT’s retention strategies and programs, a lack of assessment data was found for many programs. It was difficult to assess the impact of current strategies given the paucity of evidence related to implementation and impact on stated objectives. Middle States (2007) noted this same thing in its final report to RIT at the conclusion of RIT’s Self‐Study:
“… there is a noticeable absence of statistical evidence across most of the areas covered in the Self Study report”; “… a certain degree of imbalance existing among different offices in collecting and using data for planning and resource allocation”; “… we believe that conscious efforts need to be made by all RIT administrative and academic leaders to use research to effect meaningful changes and program improvement in different areas of the institution”; and
RIT Student Success Tiger Team Final Report: May 2009
33
“… coordination of research efforts across campus and sharing of research findings among colleges/offices should be encouraged (pg. 4).”
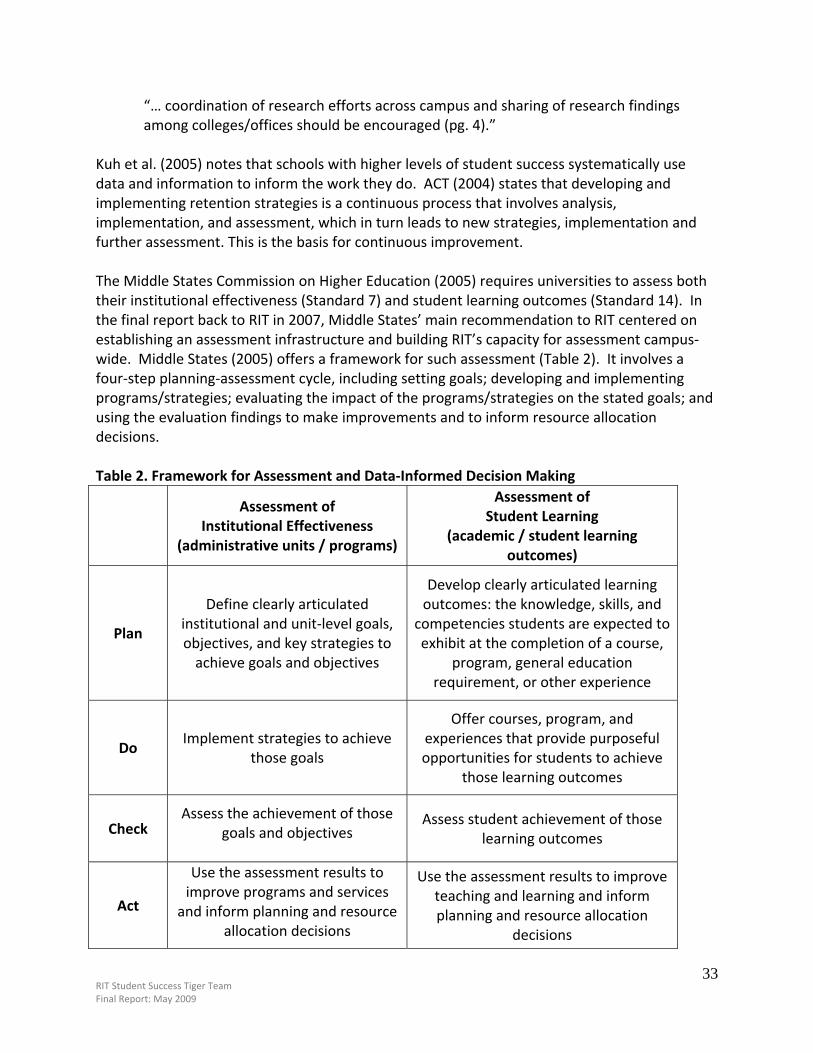
Kuh et al. (2005) notes that schools with higher levels of student success systematically use data and information to inform the work they do. ACT (2004) states that developing and implementing retention strategies is a continuous process that involves analysis, implementation, and assessment, which in turn leads to new strategies, implementation and further assessment. This is the basis for continuous improvement. The Middle States Commission on Higher Education (2005) requires universities to assess both their institutional effectiveness (Standard 7) and student learning outcomes (Standard 14). In the final report back to RIT in 2007, Middle States’ main recommendation to RIT centered on establishing an assessment infrastructure and building RIT’s capacity for assessment campus‐wide. Middle States (2005) offers a framework for such assessment (Table 2). It involves a four‐step planning‐assessment cycle, including setting goals; developing and implementing programs/strategies; evaluating the impact of the programs/strategies on the stated goals; and using the evaluation findings to make improvements and to inform resource allocation decisions. Table 2. Framework for Assessment and Data‐Informed Decision Making
Assessment of Institutional Effectiveness
(administrative units / programs)
Assessment of Student Learning
(academic / student learning outcomes)
Plan
Define clearly articulated institutional and unit‐level goals, objectives, and key strategies to achieve goals and objectives
Develop clearly articulated learning outcomes: the knowledge, skills, and
competencies students are expected to exhibit at the completion of a course,
program, general education requirement, or other experience
Do Implement strategies to achieve
those goals
Offer courses, program, and experiences that provide purposeful opportunities for students to achieve
those learning outcomes
Check Assess the achievement of those
goals and objectives
Assess student achievement of those learning outcomes
Act
Use the assessment results to improve programs and services
and inform planning and resource allocation decisions
Use the assessment results to improve teaching and learning and inform planning and resource allocation
decisions
RIT Student Success Tiger Team Final Report: May 2009
34
Sources: Middle States Commission on Higher Education (2005). Assessing student learning and institutional effectiveness: Understanding Middle States expectations. Philadelphia: Middle States Commission on Higher Education. Prince George’s Community College (May 2006). Assessment committee: A baseline inventory of assessment activities at PGCC. Assessment is critical not as an activity in itself, but because of the information it provides for program improvements and about a program’s impact on stated outcomes. In the context of limited resources, assessment provides vital information to inform strategic decision making, establish priorities, and allocate resources. Employing a culture of assessment and data‐informed decision making will increase RIT’s collective knowledge about effective retention strategies and provide an evidence‐based perspective for long‐term planning and decision‐making. Data Analysis to Build Profiles of Students at Risk and to Inform Retention Strategies Recommendation 15: Conduct a data mining study to increase our understanding of the factors that are related to student success and to inform the development and implementation of retention strategies and targeted intervention. In its review of student success data, the team found data existed about student persistence and graduation rates but less information existed about the factors that place students at risk for leaving RIT and why some students leave versus stay. Data mining is a tool used to uncover trends in student persistence, which then can be used to design targeted intervention and support strategies. Data mining is defined as “an iterative process of creating predictive and descriptive models, by uncovering previously unknown trends and patterns in vast amounts of data from across the enterprise, in order to support decision making (SAS, 2009).” In contrast to hypothesis‐testing, data mining seeks to identify already‐present patterns in data (Luan, 2002). A vast amount of data exists in university databases, including student information, admissions, financial aid, and housing. A data mining project will extract data from multiple databases, run through a set of sophisticated analyses, and identify undiscovered patterns and trends in the data. This information can then be used for program development and enhancement, with the goal of preventing student attrition and supporting student success. One benefit of a data mining approach is that different factors can be identified for different types of students (e.g., by college, transfer students, freshmen, etc.), thus making targeted interventions more successful. The Institutional Research office currently possesses the tools to conduct a data mining analysis. It is recommended that such a project be undertaken immediately to uncover trends about factors that contribute to or hinder student persistence, which will then be widely disseminated to inform retention strategies. Recommendation 16: Conduct a study of students who have left RIT to inform the development and implementation of retention strategies.
RIT Student Success Tiger Team Final Report: May 2009
35
The team also felt that there was a lack of information from students themselves regarding why they leave or stay at RIT. While there are inherent difficulties associated with locating exited students and obtaining accurate information about their reasons for leaving, a study of these students could provide valuable insights upon which to base interventions and program changes. Additionally, understanding why students stay also is important, as the reason students stay may differ from those associated with students leaving. It is recommended that such a study be conducted by external consultants (e.g., Arts and Science) and include both quantitative and qualitative components. Recommendation 17: Adjust our internal reporting of persistence rates to match IPEDS reporting requirements. In its internal analysis of student persistence rates, RIT has historically counted students on leave of absence as persisters. For IPEDS reporting, which is mandated reporting to the federal government, these students are counted as attriters per IPEDS reporting requirements. The difference in methods results in a 3‐4% difference in persistence rates, with the internal method producing a higher persistence rate. Using different methods can cause confusion among those using and interpreting the data. Additionally, benchmarking against other institutions becomes more difficult to interpret if we use our internal persistence rates. Most significantly, our internal methodology makes determining when students truly leave RIT more difficult, which hinders the development of effective interventions strategies. Therefore, it is our recommendation to change our internal persistence reporting to match our external reporting methodology. Recommendation 18: Conduct more in‐depth analysis of student survey data (e.g., NSSE and Noel‐Levitz) and more widely disseminate the results to guide the establishment of priorities, design and implementation of retention strategies, and allocation of resources. RIT participates in several national students surveys, including the National Survey of Student Engagement (NSSE), the Noel‐Levitz Student Satisfaction Inventory, and the Cooperative Institutional Research Program (CIRP) Freshman Survey. These surveys provide information about student characteristics and students’ perceptions and satisfaction with their college experiences. Summaries of the survey results are typically shared with governance groups and other major groups across campus. However, given the amount of data collected and the scope of topics covered, the team felt that a more in‐depth analysis of the data and wider dissemination of the results would benefit the campus and encourage greater utilization of the survey results. Recommendation 19: Continue to invest in the data warehouse to fully leverage its data management, reporting and analytical capabilities, which will in turn support student retention strategies. In the last two years, the University has built a data warehouse, which supports institutional effectiveness by expanding the availability and consistency of institutional data and facilitating
RIT Student Success Tiger Team Final Report: May 2009
36
the analysis of information to support planning, decision making, and resource allocation. The data warehouse serves both as a central repository for the institution’s data and a sophisticated but user‐friendly business intelligence analytical tool to leverage our strategic and competitive information assets. The data warehouse began with one subject area (i.e., retention/graduation) and is now expanding to other areas. It currently houses enrollment, internal transfer, and student retention and graduation data. This information has already benefited the University by providing more consistent, timely, and flexible information in these areas. However, it represents just a fraction of the information the warehouse can hold as well as the analytical information it can provide. The warehouse holds significant potential to support assessment and decision making and warrants continued and possibly expanded investment of resources. A Technology Infrastructure That Supports Student Learning and Success Recommendation 20: Establish a committee to define the requirements and cost estimates for a new student information system for the 2010‐11 budget cycle. Given RIT’s focus on technology, there is an implicit expectation among students, faculty and staff that the University will possess adequate and even superior technology to support University operations. In the student domain, however, the major systems are vastly below expectations. Students in the 2008 Noel‐Levitz Satisfaction Inventory, for example, rated low satisfaction with their ability to register for needed classes with few conflicts and to schedule desired classes. These areas emerged within RIT’s top five challenges among more than 80 possible items. Students’ ratings of their satisfaction with registration also were significantly lower than the average rating for national four‐year private institutions. As RIT’s enrollment grows and the University becomes more complex, the ability of the student information system to support the operations of the University becomes more tenuous. RIT systems, especially the student information system, need to be positioned to better support the strategic direction of the institution now and certainly into the future. RIT’s current student system is based on aging technology that is becoming increasingly difficult to support and maintain. Further, the current environment makes it difficult to respond to the demands for new features and functionality. In order to meet even the minimum expectations of the users, a more student and faculty centric system is needed.
Examples of critical functionality that the RIT student system currently lacks are: Ease of Use and Integrated Services: Each individual should have access to the information and services that he or she needs to support his/her education (student) or to perform assigned duties (faculty/staff). Interfaces should be easy to use and be seamlessly integrated in real‐time, regardless of the data source and should be available through a variety of end‐user devices.
RIT Student Success Tiger Team Final Report: May 2009
37
• Course cart process to permit students to plan registration in advance. This concept also provides advance demand information that can inform changes to the schedule in a proactive way.
• Electronic wait lists • Prerequisite checking • Improved means to communicate and manage course restrictions • A system that can handle peak loads • Integration of course registration with degree audit • Integration of a fully searchable course schedule and course description
database with the registration system. Enhanced Communication and Collaboration Services: Advisors and faculty especially need enhanced tools to communicate with students in ways that support the needs for delivering messages and alerts, for tracking the history of interactions with students that can be shared with others involved with student support and for assessing outcomes. This includes the ability to share an electronic student record that integrates scanned images and advisor comments. Paperless Workflow: Specific advisor, faculty and administrator functions need to be managed with workflow processes to reduce and in most cases eliminate the “paper chase” and the need for students to visit multiple offices to complete transactions. Ubiquitous Access: Service expectations have expanded and all users now demand and expect real‐time access to information and services that are available 24/7/365. This is also required to support our expanding global presence. We must also support a growing and ever changing variety of computing and communications devices used to access these services. Relationship Management: Cultivating and sustaining positive relationships with individuals in many groups, including prospective students, current students, alumni, parents, faculty, staff, as well as corporate and community partners is essential to maintain and enhance the reputation of RIT, through the strategic use of information resources. Scalable and Flexible Infrastructure: A technology infrastructure that is modular, secure, flexible and scalable enough to allow innovative ideas to be explored and easily implemented as required to support strategic initiatives. Information Privacy, Integrity and Authenticity: System capabilities to ensure that the data in our systems are accurate, consistent, secure, and compliant with laws mandating both access (e.g. to policies covering both students and staff) and privacy (e.g. of personal data). Decision‐Making Support: New systems must support the University’s decision‐making efforts by providing integrated, transactional and historical data so that decision makers at all levels of the Institute have efficient and effective access to the data and information needed to make data driven decisions.
RIT Student Success Tiger Team Final Report: May 2009
38
Recommendation 21: Establish a committee to define the requirements and cost estimates for a customer relationship management system for the 2010‐11 budget cycle. Additionally the University lacks or does not fully utilize other technology systems which would improve the efficiency of student services and reduce barriers to student success. Currently individuals across campus who provide support services to students (e.g., advising, North Star, counseling services) lack a coordinated, computerized system to track services provided to students and monitor student progress. Because of this, service providers routinely spend significant time researching information about the student and their contacts with other service providers manually versus looking up the information in a central system. Furthermore, service providers sometimes duplicate services to students because they are unaware of another’s work with the student. This is an inefficient method of service delivery and takes time away from direct service to students. Advisors and faculty in particular need enhanced tools to track the history of interactions with students that can be shared with others involved with student support and for assessing outcomes. This includes the ability to share an electronic student record that integrates scanned images and advisor comments. These same needs are felt within the Academic Support areas in Student Affairs. Category III Recommendations: Teaching and Learning, Campus Environment and Culture As important as strengthening the implementation of RIT’s current retention programming is and as critical as updating RIT’s technology and infrastructure are, we must also recognize that teaching and learning figure clearly at the center of student success. The “key players” in the teaching and learning arena are the students and the faculty. Student success is dependent on having top‐notch faculty who are not only good scholars, but also great teachers. The goal of “helping students to succeed at higher rates” is really too vague to be useful because it does not provide direction or identify appropriate changes in course structure, content, and delivery. It is better, therefore, to determine specific factors that either enhance or mitigate student success. The team used Kuh’s findings related to DEEP schools in formulating the following recommendations.
Academic Challenge and Engagement While most institutional efforts across the nation are aimed at boosting retention by doing something “to or for” the student, another avenue of action research calls on institutions to also look at what happens within the classroom between faculty and students. In so doing, “attention should also be placed on modifying the nature of early academic experiences in all classes to enhance student engagement and not expect a first‐year seminar or learning community to make up for deficiencies in productive learning conditions in other course offerings” (Laird et al. 2008, p. 95). The objective here needs to be twofold: to drive up the
RIT Student Success Tiger Team Final Report: May 2009
39
level of academic challenge AND at the same time increase the level of student support provided. One other important aspect to ensuring that productive learning conditions permeate the classroom is what some refer to as the infusion of social and collaborative learning into the curriculum. For years Vincent Tinto has argued in favor of using active and collaborative learning practices especially for first year students because they serve as a “crosswalk between the institution’s academic and social systems” (Tinto 1993). In fact, it is quite well documented that teaching practices that encourage students to “think and do” rather than to merely “take in knowledge passively” positively influence students beliefs about how much the institution cares about them (Braxton et al. 2008). Student engagement is affected by whether or not a student believes the institution cares about them. Because the teaching and learning relationship is fluid, dynamic and personal, institutions must work with faculty to develop and support productive learning environments. The following set of recommendations will require that the Provost, deans, department chairs and faculty examine their curriculum, course schedules (particularly as these apply to the first and second year in the program), faculty development opportunities, staffing plans and evaluation approaches. Recommendation 22: Rigor. Increase academic challenge and establish high student expectations by incorporating appropriate levels of rigor into the curriculum as follows:
a. Require extensive reading and writing across the curriculum b. Infuse critical thinking and problem solving into coursework c. Include a challenging senior culminating experience in every program d. Ensure that students meet course pre‐requisites by blocking registration as needed.
When students do not have the necessary foundational skills, the likelihood of failure increases exponentially. Recommendation 23: Student Support. Improve course availability for all students and especially those earning D, F or Ws; Increase the number of shadow (trailer) courses for students changing programs and students who have not been successful in the preceding quarter:
a. Provide a staggered schedule of trailer courses for students who previously earn a D, F, W;
1. Divide these courses into smaller sections; 2. Assign experienced faculty (i.e., master teachers) who have appropriate sensitivity, desire and pedagogical expertise to teach these trailer classes; 3. Assign assistant or adjunct faculty to support the “master” teacher in these courses; coordinate with the AIM program in offering supplemental instruction opportunities;
b. Offer parallel scheduling to allow students to repeat courses; c. Offer lower level courses more frequently for those students who need them.
Recommendation 24: Student Workload. Increase sensitivity to student workload:
a. Examine typical student workloads and course masks within a program;
RIT Student Success Tiger Team Final Report: May 2009
40
b. Provide a more feasible schedule for students in terms of how courses and labs are scheduled; c. Coordinate the number of assignments, demands, and scheduled exams within the program and between various programs and courses (especially Math, Physics, Chemistry, Biology, etc.); d. Allow more reading days before the final exams and increase other opportunities for students to prepare for exams in a less “pressurized” context.
Recommendation 25: Experiential Learning. Offer additional opportunities and integrate more experiential learning activities into the undergraduate experience that go above and beyond coop:
a. Increase the numbers of students who participate in Undergraduate research projects and internships (defined by departments); b. Encourage and increase student participation in Summer Research Scholars programs; c. Increase the number of Study Abroad programs and increase the numbers of
students who participate d. Encourage faculty to apply for REU (Research Experience for Undergraduates)
program grants e. Increase opportunities for Service Learning Student Interactions with Faculty Members Another factor that is important to teaching and learning is the affect of the students’ perceptions of faculty members’ concern for them. This has been shown to directly affect retention and has implications for faculty availability outside the classroom, the ways in which faculty communicate with students, respond to students’ questions about their grades and the use of adjunct faculty who may not be as available or accessible to students as full time staff. One recent study that we should keep in mind concluded that students do appear to be negatively affected when important foundational or gatekeeper courses are taught by adjunct faculty, not because of the competence of the adjunct’s pedagogy or content knowledge but because of their accessibility and availability (Eagan and Jaeger 2008). Recommendation 26: Student‐Faculty Interaction. Increase the quality, frequency and ease of student‐faculty interaction through:
a. Designing additional physical spaces within colleges and the University as a whole designed for interaction; b. Requiring that all faculty post office hours outside of their office and in their syllabus and provide specific information about how students can contact them to set up an appointment or seek assistance; c. Office hours and syllabi should be kept on file quarterly in department offices so that departments are assured that students have accessibility and support.
RIT Student Success Tiger Team Final Report: May 2009
41
Recommendation 27: Assessment of Student Learning and Timely Feedback. Enable students to know where they stand in every class at any point during the quarter and provide faculty with training in assessment of learning:
a. Establish the expectation that faculty utilize myCourses as a means to post syllabi and current grades‐‐using the gradebook feature of myCourses. b. Provide faculty training in appropriate test design and evaluation techniques, assessment tools and metrics. c. Provide faculty with training in understanding the importance of timely and frequent feedback on student progress.
Recommendation 28: Assessment of Teaching. Improve and increase assessment of teaching and learning through evaluation and development:
a. Use formative feedback methods (routine class observations, mid‐quarter surveys, mentoring, and student ratings of instruction) to improve teaching:
1. Establish Departmental Peer Evaluation Committees for formative feedback and to ensure that the process is consistent, valued and assessed; 2. Provide additional opportunities through RIT’s Center for Teaching and Learning for:
• cross‐college and cross‐disciplinary Faculty Learning Communities especially designed for first‐year junior faculty
• Faculty Learning Communities for faculty in need of the opportunity to enhance pedagogical skills, particularly faculty whose teaching performance is consistently below department norms
• “In Service Training” for all faculty members (including adjuncts) on how instructional technologies can be used to enhance teaching/learning. This should include use of electronic group discussions; techniques for holding electronic “office” hours; use of technology for assignment submission, testing and feedback to students on academic progress
• Mandatory orientation and training for teaching online. • Training on course development/design • Seminars devoted to sharing best teaching practices, with a
special emphasis on collaborative and active learning strategies in first year classes
Academic Calendar The Student Success Tiger Team would be remiss if we did not mention the topic of the academic calendar as it relates to student success. This is not a new topic. It was well cited and discussed in the 2001 Retention Task Force Report. In many, if not most, of the team meetings, the topic of quarters versus semesters was raised usually within the context of whether a semester system would ease the stressors placed on students. The types of stressors
RIT Student Success Tiger Team Final Report: May 2009
42
mentioned ranged from the fast‐paced level of instruction, the short time period between exams, the inability for faculty to return to topics that students may have not grasped in a sufficient manner, the increased numbers of final exams students take (50% more) and the attempt to catch up with material missed when a student is absent due to extended illness. Concerns were not, however, limited to just pedagogical issues. The fast pace inherent in the quarter system and loss or lack of connection with high school friends due to different vacation and break schedules were also raised. The team did not reach any conclusion nor do we wish to make a specific recommendation regarding this topic. We do believe, though, that any future university discussion around a calendar change should include analysis of whether a change would help or hinder student engagement and success. As we stated earlier, those institutions that have experienced better graduation rates than were expected, also enjoy higher than expected levels of student engagement. The two must be coupled! Concluding Thoughts If Provost Haefner set aside $500,000 for RIT’s Retention Programs and asked our team which retention strategies should be funded and which should be eliminated, we would first point to the conventional wisdom which suggests that it is the combined and cumulative power of programs that should be considered:
“It may be potentially more productive for faculty, administrators and researchers to conceive of the environment of any given campus not as unitary and global but rather as an amalgam of many diverse subenvironments each of which has influence.…furthermore, while the impact of any single subenvironment may be small or modest, the cumulative effect of all subenvironments – if they are mutually supportive – can be substantial” (Baird 1988, p. 655).
Secondly, we would point to what we currently know about our portfolio of practices and argue that we have more work to do before recommending significant changes in the current portfolio given that:
1. RIT has already established a core of retention strategies that, in theory, reflect what the field categorizes as high impact best practice. If one or more of these strategies were discontinued, the overall affect on retention is not clear because it has not been measured or analyzed systematically. Further, a cost/benefit analysis for each retention strategy has not occurred but should be considered.
2. We do not use data mining analysis to uncover trends in student persistence that can help identify students who may benefit the most from particular student success interventions. Because of this, we cannot say with certainty that the right interventions are now coupled and connected to students who need them most.
RIT Student Success Tiger Team Final Report: May 2009
43
3. Our current retention strategies are not intentionally connected or integrated with each other in any systemic or mutually supportive way.
4. A few student success strategies do report a positive impact on the retention of RIT students:
• Learning Community students and students in the Honors Program enjoy higher persistence rates than the general RIT population;
• The AIM program has demonstrated promising early results for lowering a student’s chance of receiving a D, F or W and for helping at‐risk students increase their GPA’s;
• First‐year student persistence increased immediately following the introduction of FYE and has plateaued since; and
• Some students self report that the Early Alert System helps keep them on track.
The recommendations proposed in the report respond to our current condition and emphasize areas and opportunities where the team believes deliberate action is required in order to provide a framework and process that better integrates, coordinates, oversees and assesses student success programming, its quality and its results.
As the University reviews and considers these proposed action steps, one must keep in mind that it will be the cumulative effect from many, rather than from a few, that may help us achieve our 92/73 goals and as we learned from the work and experience of Kuh and others, “…simply offering programs and practices does not guarantee they will have the intended effects on student success; institutional practices must be of high quality customized to meet the needs of students they are intended to reach and firmly rooted in a student success campus culture” (Kuh et al., 2008, p. 556). That is the platform upon which we must further develop and refine our Student Success Initiatives, mindful that our focus must always be centered on “one student at a time.”
RIT Student Success Tiger Team Final Report: May 2009
44
Bibliography
Baird, L. (1988). “The College Environment Revisited: A Review of Research and Theory.” In J. Smart (Ed.) Higher Education: Handbook of Theory and Research (Vol. 4). New York. AGATHON Press. Braxton, John M. “Faculty Professional Choices in Teaching that Foster Student Success.” United States Department of Education: National Postsecondary Education Cooperatives. http://nces.ed.gov/NPEC/papers.asp (June 2006). Web. Braxton John M., Jones, Willis A., Hirschy, Amy S. and Hartley, Harold V III. “The Role of Active Learning in College Student Persistence.” The Role of the Classroom in College Student Persistence. New Directions for Teaching and Learning, Ed. John Braxton. no. 115 (Fall2008). 71‐83. San Francisco: Jossey‐Bass. Print. Eagan, Kevin M., and Jaeger, Audrey J. “Closing the Gate: Part‐time Faculty Instruction in Gatekeeper Courses and First‐Year Persistence.” The Role of the Classroom in College Student Persistence. New Directions for Teaching and Learning, Ed. John M. Braxton. no. 115. (Fall 2008). 39‐53. San Francisco: Jossey‐Bass. Print. Habley, Wesley R. and McClanahan, Randy. What Works in Student Retention: Four‐Year Private Colleges. Research Report: American College Testing, Inc (ACT). Web. 2004. Kalsbeek, David. Plenary Address. Consortium for Student Retention Data Exchange (CSRDE), National Symposium. Little Rock, Arkansas, 2008. Kuh, George D., Cruce, Ty M., Shoup, Rick, Kinzie, Jillian and Gonyea, Robert M. “Unmasking the Effects of Student Engagement on First‐Year College Grades and Persistence.” Journal of Higher Education 79, (September/October 2008): 531‐563. Print. Kuh, George D. LEAP (Liberal Education and America’s Promise) Report. High‐Impact Educational Practices: What They Are, Who Has Access to Them and Why They Matter. Washington, DC: Association of American Colleges and Universities (AAC&U). 2008. Print. Kuh, George D., Kinzie, Jillian, Schuh, John H., Whitt, Elizabeth J., and Associates. Student Success in College: Creating Conditions That Matter. San Francisco: Jossey‐Bass. 2005. Print. Light, Richard J. (2001). Making the Most of College: Students Speak Their Minds. Cambridge, Mass: Harvard University Press. Luan, Jing. “Data Mining and its Applications in Higher Education.” Eds. Andreea M. Serban and Jing Luan. Knowledge Management: Building a Competitive Advantage in Higher Education.
RIT Student Success Tiger Team Final Report: May 2009
45
New Directions for Institutional Research. no. 113. (Spring 2002). 17‐36. San Francisco: Jossey‐Bass. Print. Middle States Commission on Higher Education. Assessing Student Learning and Institutional Effectiveness: Understanding Middle States Expectations. Philadelphia: Middle States Commission on Higher Education. 2005. Print. Middle States Commission on Higher Education. Report to the Faculty, Administration, Trustees, and Students of the Rochester Institute of Technology. 2007. Muraskin, L. and Lee, J. (December 2004). “Raising the Graduation Rates of Low Income College Students.” The Pell Institute for the Study of Opportunity in Higher Education. http://www.nacada.ksu/Webinars/documents/W06Handout filledin 000.doc. Retrieved September 1, 2007. Web. National Survey of Student Engagement. Results for Rochester Institute of Technology. 2007 Bernchmark Comparisons with Highly Engaging Institions. Bloomington, Indiana. 2007. Nelson Laird, Thomas F., Chen, Daniel, and Kuh, George D. “Classroom Practices at Institutions With Higher‐Than‐Expected Persistence Rates: What Student Engagement Data Tell Us.” The Role of the Classroom in College Student Persistence. New Directions for Teaching and Learning, Ed. John M. Braxton. no. 115 (Fall 2008). 85‐99. San Francisco: Jossey‐Bass. Print. Noel‐Levitz. Results for Rochester Institute of Technology. Coralville, Iowa. 2008. Patton, Lori D., Morelon, Carla, Whitehead, Dawn Michele, and Hossler, Don. “Campus‐Based Retention Initiatives: Does the Emperor Have Clothes?” Eds. E.P. St. John and M. Wilkerson. New Directions for Institutional Research. no. 130. (Summer 2006). 9‐24. San Francisco: Jossey‐Bass. Print. Prince George’s Community College. Assessment committee: A baseline inventory of assessment activities at PGCC. 2006. SAS . “Data Mining and Text Mining.” http://www.sas.com/technologies/analytics/datamining/index.html. Retrieved March 6, 2009. Web. Schneider, Carol Geary. Introduction. “Liberal Education and High‐Impact Practices.” High Impact Educational Practices: What Are They, Who Has Access to Them and Why They Matter. Ed. Kuh, George. Washington, D.C.: LEAP (Liberal Education and America’s Promise) Report: Association of American Colleges and Universities (AAC&U). 2008. Print. Tinto, Vincent. Leaving College: Rethinking the Causes and Cures of Student Attrition. 2nd ed. Chicago: University of Chicago Press, 1994. Print.
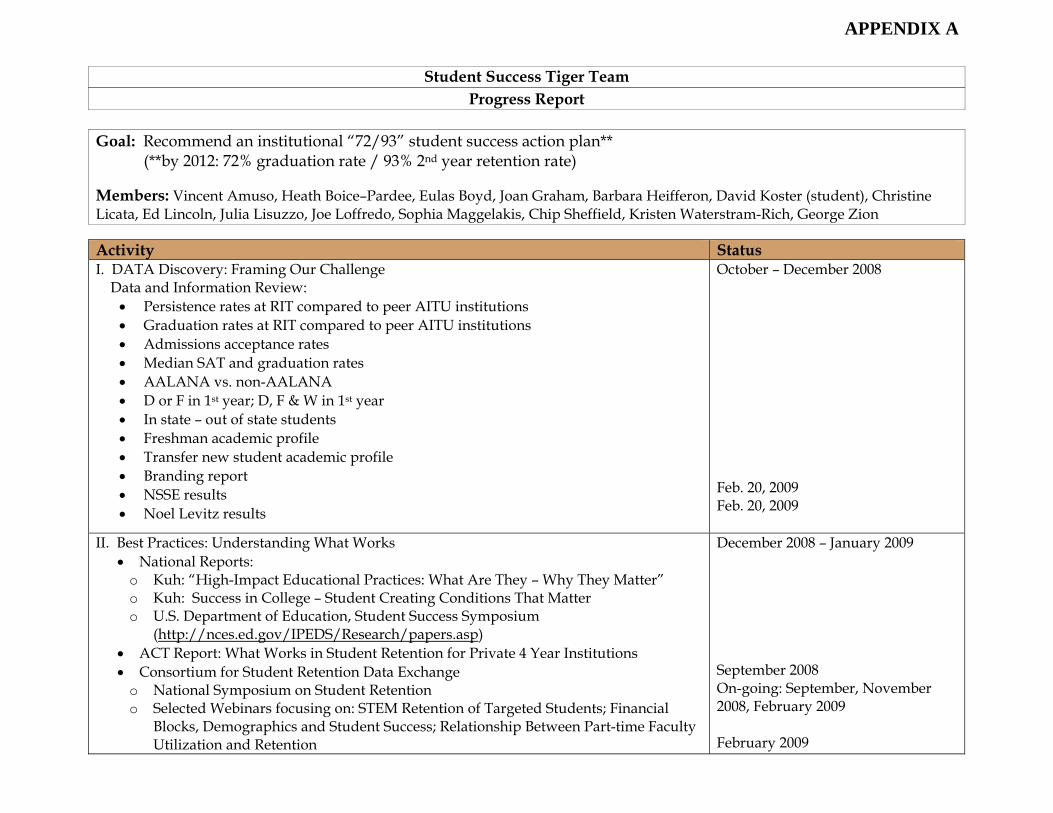
APPENDIX A
Student Success Tiger Team Progress Report
Goal: Recommend an institutional “72/93” student success action plan** (**by 2012: 72% graduation rate / 93% 2nd year retention rate) Members: Vincent Amuso, Heath Boice–Pardee, Eulas Boyd, Joan Graham, Barbara Heifferon, David Koster (student), Christine Licata, Ed Lincoln, Julia Lisuzzo, Joe Loffredo, Sophia Maggelakis, Chip Sheffield, Kristen Waterstram-Rich, George Zion Activity Status I. DATA Discovery: Framing Our Challenge Data and Information Review:
• Persistence rates at RIT compared to peer AITU institutions • Graduation rates at RIT compared to peer AITU institutions • Admissions acceptance rates • Median SAT and graduation rates • AALANA vs. non-AALANA • D or F in 1st year; D, F & W in 1st year • In state – out of state students • Freshman academic profile • Transfer new student academic profile • Branding report • NSSE results • Noel Levitz results
October – December 2008 Feb. 20, 2009 Feb. 20, 2009
II. Best Practices: Understanding What Works • National Reports:
o Kuh: “High-Impact Educational Practices: What Are They – Why They Matter” o Kuh: Success in College – Student Creating Conditions That Matter o U.S. Department of Education, Student Success Symposium
(http://nces.ed.gov/IPEDS/Research/papers.asp) • ACT Report: What Works in Student Retention for Private 4 Year Institutions • Consortium for Student Retention Data Exchange
o National Symposium on Student Retention o Selected Webinars focusing on: STEM Retention of Targeted Students; Financial
Blocks, Demographics and Student Success; Relationship Between Part-time Faculty Utilization and Retention
December 2008 – January 2009 September 2008 On-going: September, November 2008, February 2009 February 2009
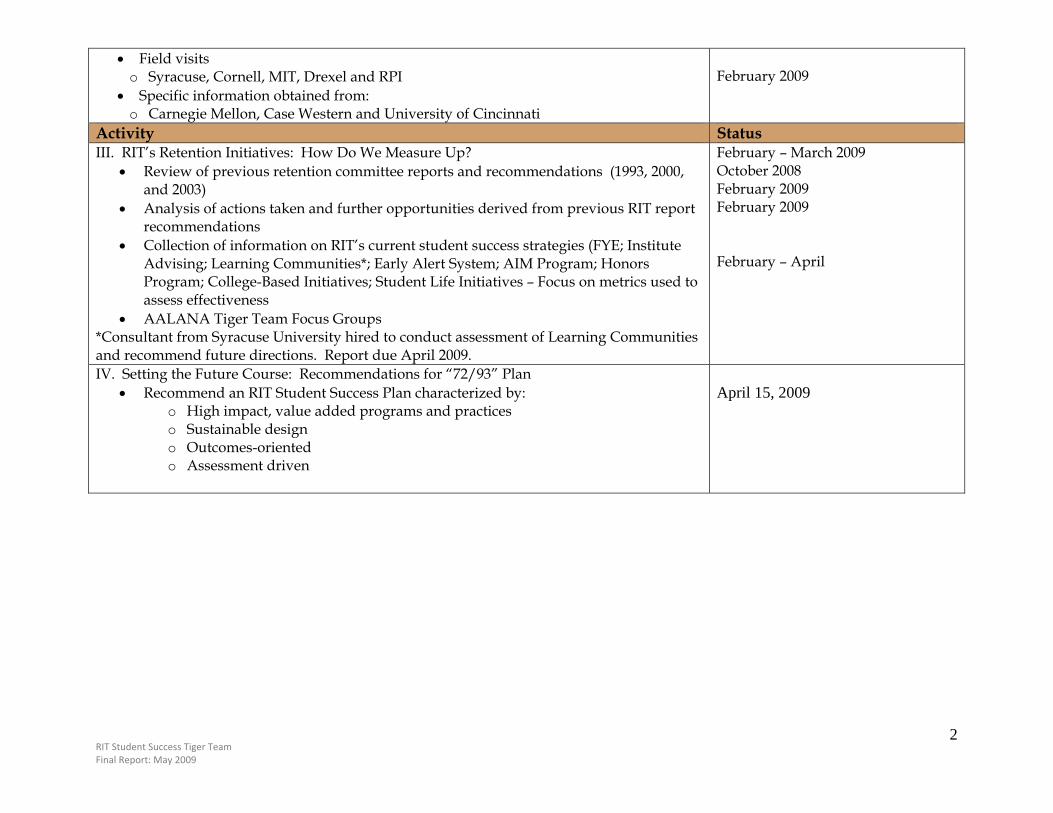
RIT Student Success Tiger Team Final Report: May 2009
2
• Field visits o Syracuse, Cornell, MIT, Drexel and RPI
• Specific information obtained from: o Carnegie Mellon, Case Western and University of Cincinnati
February 2009
Activity Status III. RIT’s Retention Initiatives: How Do We Measure Up?
• Review of previous retention committee reports and recommendations (1993, 2000, and 2003)
• Analysis of actions taken and further opportunities derived from previous RIT report recommendations
• Collection of information on RIT’s current student success strategies (FYE; Institute Advising; Learning Communities*; Early Alert System; AIM Program; Honors Program; College-Based Initiatives; Student Life Initiatives – Focus on metrics used to assess effectiveness
• AALANA Tiger Team Focus Groups *Consultant from Syracuse University hired to conduct assessment of Learning Communities and recommend future directions. Report due April 2009.
February – March 2009 October 2008 February 2009 February 2009 February – April
IV. Setting the Future Course: Recommendations for “72/93” Plan • Recommend an RIT Student Success Plan characterized by:
o High impact, value added programs and practices o Sustainable design o Outcomes-oriented o Assessment driven
April 15, 2009
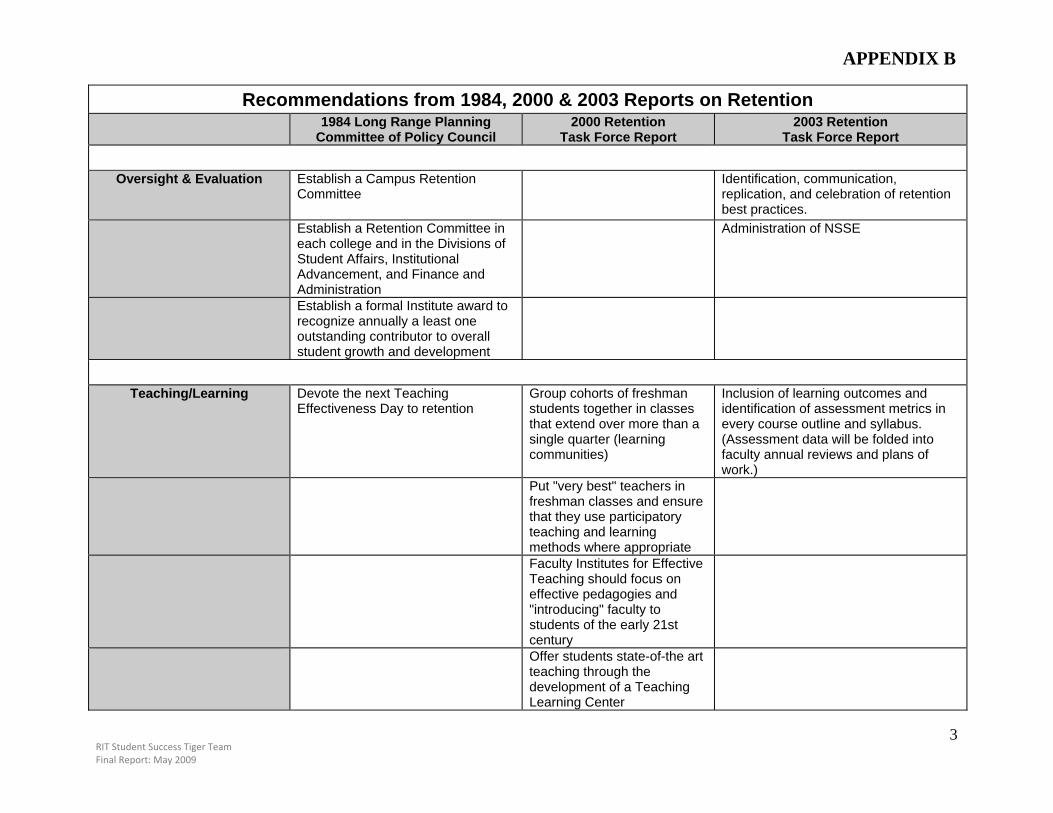
RIT Student Success Tiger Team Final Report: May 2009
3
Recommendations from 1984, 2000 & 2003 Reports on Retention 1984 Long Range Planning
Committee of Policy Council 2000 Retention
Task Force Report 2003 Retention
Task Force Report
Oversight & Evaluation Establish a Campus Retention Committee
Identification, communication, replication, and celebration of retention best practices.
Establish a Retention Committee in each college and in the Divisions of Student Affairs, Institutional Advancement, and Finance and Administration
Administration of NSSE
Establish a formal Institute award to recognize annually a least one outstanding contributor to overall student growth and development
Teaching/Learning Devote the next Teaching Effectiveness Day to retention
Group cohorts of freshman students together in classes that extend over more than a single quarter (learning communities)
Inclusion of learning outcomes and identification of assessment metrics in every course outline and syllabus. (Assessment data will be folded into faculty annual reviews and plans of work.)
Put "very best" teachers in freshman classes and ensure that they use participatory teaching and learning methods where appropriate
Faculty Institutes for Effective Teaching should focus on effective pedagogies and "introducing" faculty to students of the early 21st century
Offer students state-of-the art teaching through the development of a Teaching Learning Center
APPENDIX B
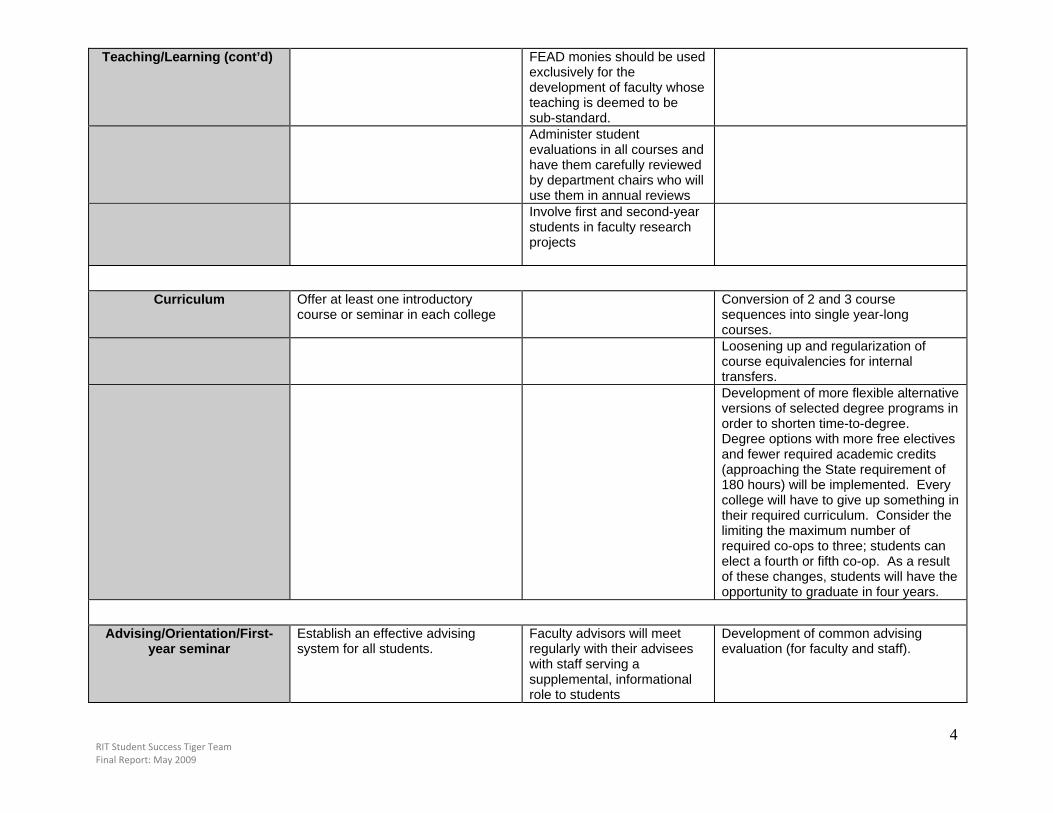
RIT Student Success Tiger Team Final Report: May 2009
4
Teaching/Learning (cont’d)
FEAD monies should be used exclusively for the development of faculty whose teaching is deemed to be sub-standard.
Administer student evaluations in all courses and have them carefully reviewed by department chairs who will use them in annual reviews
Involve first and second-year students in faculty research projects
Curriculum Offer at least one introductory course or seminar in each college
Conversion of 2 and 3 course sequences into single year-long courses.
Loosening up and regularization of course equivalencies for internal transfers.
Development of more flexible alternative versions of selected degree programs in order to shorten time-to-degree. Degree options with more free electives and fewer required academic credits (approaching the State requirement of 180 hours) will be implemented. Every college will have to give up something in their required curriculum. Consider the limiting the maximum number of required co-ops to three; students can elect a fourth or fifth co-op. As a result of these changes, students will have the opportunity to graduate in four years.
Advising/Orientation/First-year seminar
Establish an effective advising system for all students.
Faculty advisors will meet regularly with their advisees with staff serving a supplemental, informational role to students
Development of common advising evaluation (for faculty and staff).
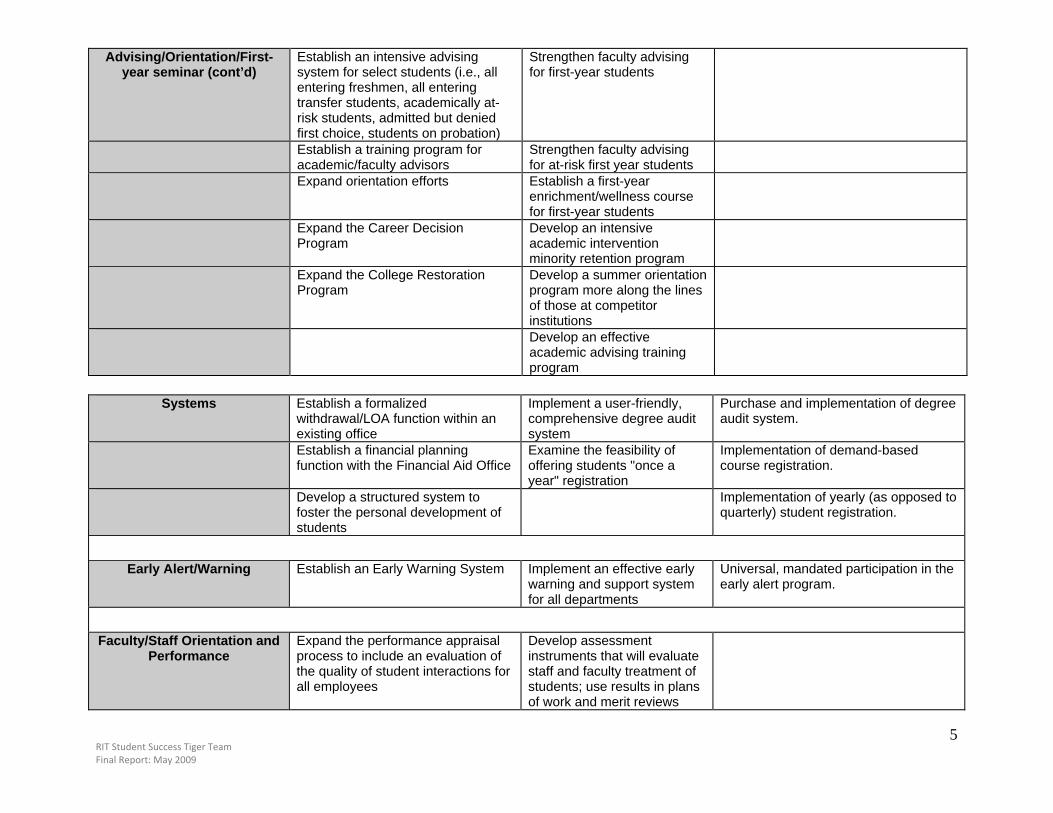
RIT Student Success Tiger Team Final Report: May 2009
5
Advising/Orientation/First-year seminar (cont’d)
Establish an intensive advising system for select students (i.e., all entering freshmen, all entering transfer students, academically at-risk students, admitted but denied first choice, students on probation)
Strengthen faculty advising for first-year students
Establish a training program for academic/faculty advisors
Strengthen faculty advising for at-risk first year students
Expand orientation efforts Establish a first-year enrichment/wellness course for first-year students
Expand the Career Decision Program
Develop an intensive academic intervention minority retention program
Expand the College Restoration Program
Develop a summer orientation program more along the lines of those at competitor institutions
Develop an effective academic advising training program
Systems Establish a formalized
withdrawal/LOA function within an existing office
Implement a user-friendly, comprehensive degree audit system
Purchase and implementation of degree audit system.
Establish a financial planning function with the Financial Aid Office
Examine the feasibility of offering students "once a year" registration
Implementation of demand-based course registration.
Develop a structured system to foster the personal development of students
Implementation of yearly (as opposed to quarterly) student registration.
Early Alert/Warning Establish an Early Warning System Implement an effective early warning and support system for all departments
Universal, mandated participation in the early alert program.
Faculty/Staff Orientation and Performance
Expand the performance appraisal process to include an evaluation of the quality of student interactions for all employees
Develop assessment instruments that will evaluate staff and faculty treatment of students; use results in plans of work and merit reviews
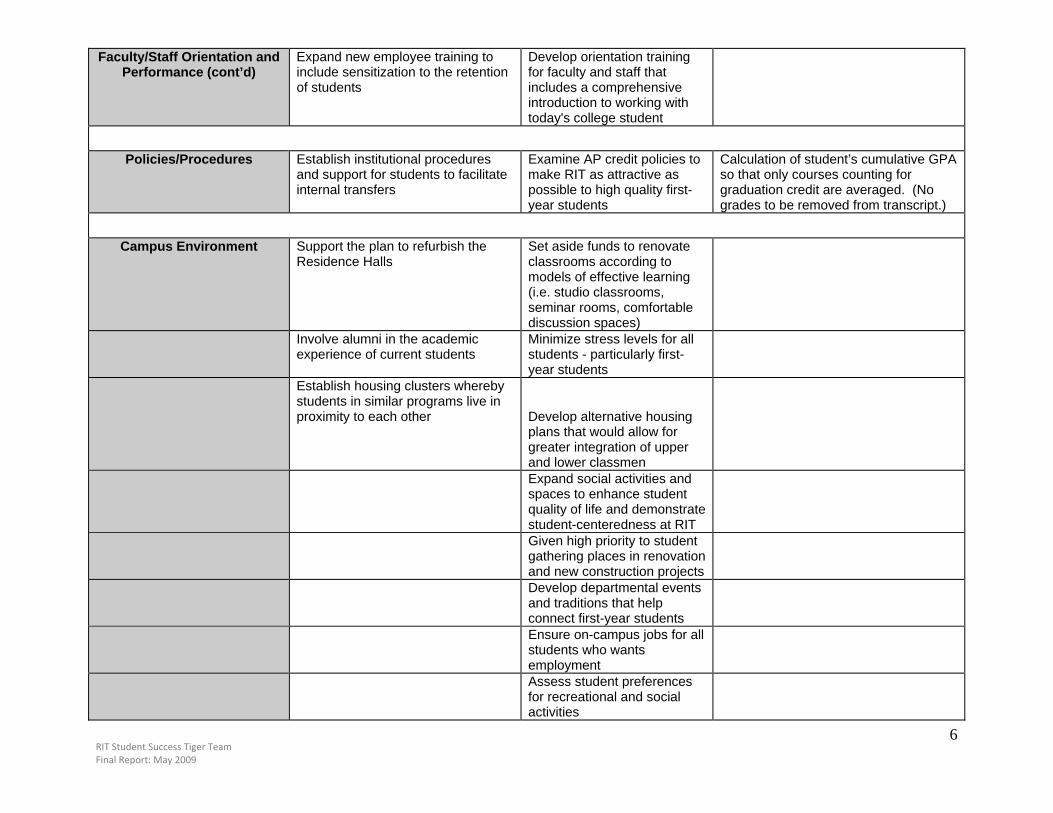
RIT Student Success Tiger Team Final Report: May 2009
6
Faculty/Staff Orientation and Performance (cont’d)
Expand new employee training to include sensitization to the retention of students
Develop orientation training for faculty and staff that includes a comprehensive introduction to working with today's college student
Policies/Procedures Establish institutional procedures and support for students to facilitate internal transfers
Examine AP credit policies to make RIT as attractive as possible to high quality first-year students
Calculation of student’s cumulative GPA so that only courses counting for graduation credit are averaged. (No grades to be removed from transcript.)
Campus Environment Support the plan to refurbish the Residence Halls
Set aside funds to renovate classrooms according to models of effective learning (i.e. studio classrooms, seminar rooms, comfortable discussion spaces)
Involve alumni in the academic experience of current students
Minimize stress levels for all students - particularly first-year students
Establish housing clusters whereby students in similar programs live in proximity to each other
Develop alternative housing plans that would allow for greater integration of upper and lower classmen
Expand social activities and spaces to enhance student quality of life and demonstrate student-centeredness at RIT
Given high priority to student gathering places in renovation and new construction projects
Develop departmental events and traditions that help connect first-year students
Ensure on-campus jobs for all students who wants employment
Assess student preferences for recreational and social activities
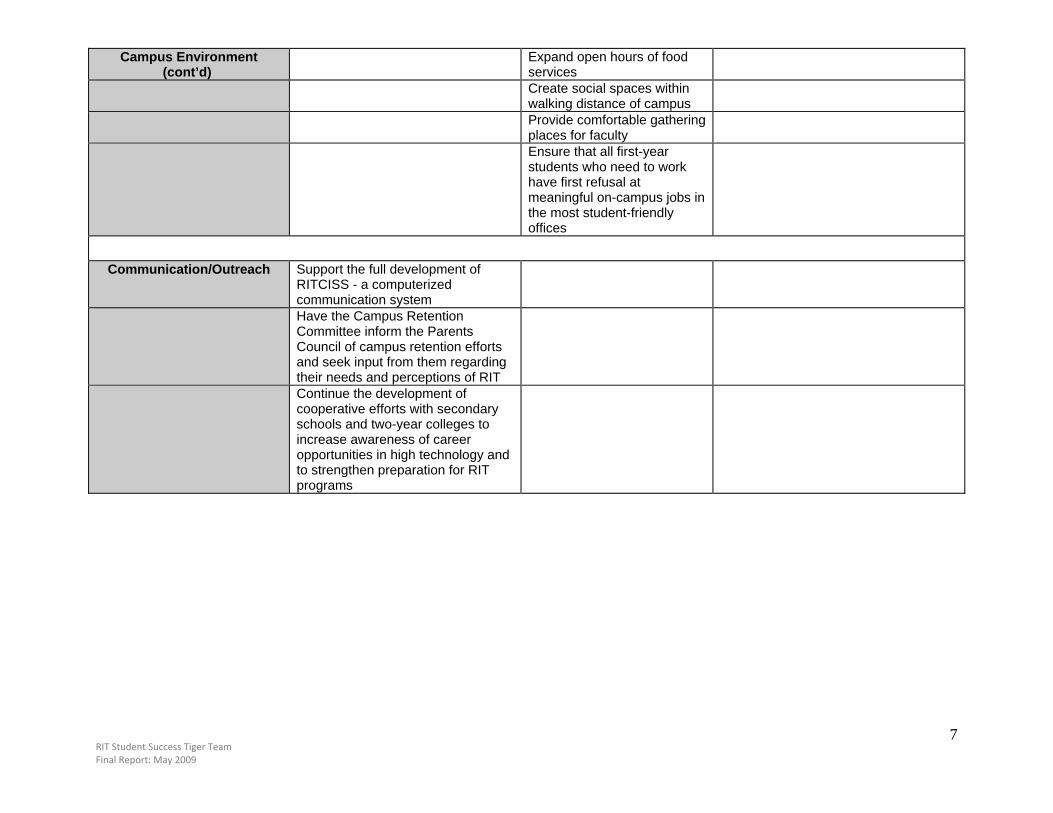
RIT Student Success Tiger Team Final Report: May 2009
7
Campus Environment (cont’d)
Expand open hours of food services
Create social spaces within walking distance of campus
Provide comfortable gathering places for faculty
Ensure that all first-year students who need to work have first refusal at meaningful on-campus jobs in the most student-friendly offices
Communication/Outreach Support the full development of RITCISS - a computerized communication system
Have the Campus Retention Committee inform the Parents Council of campus retention efforts and seek input from them regarding their needs and perceptions of RIT
Continue the development of cooperative efforts with secondary schools and two-year colleges to increase awareness of career opportunities in high technology and to strengthen preparation for RIT programs
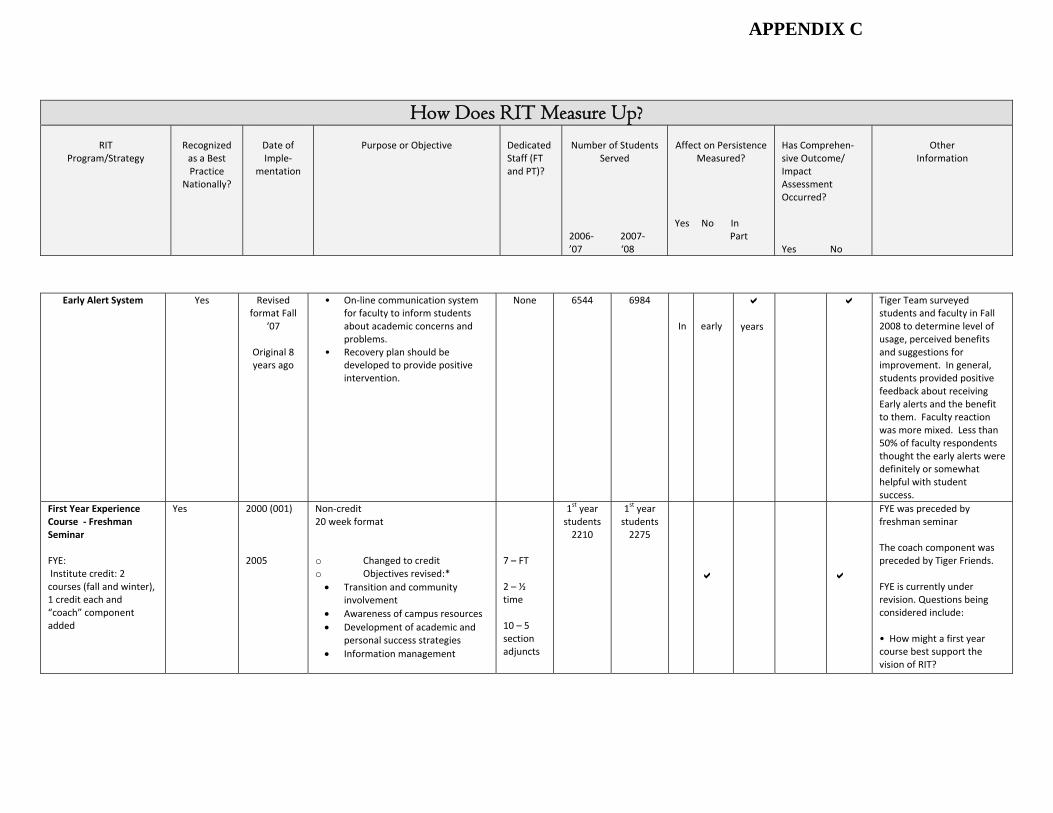
How Does RIT Measure Up?
RIT Program/Strategy
Recognized as a Best Practice
Nationally?
Date of Imple‐
mentation
Purpose or Objective Dedicated Staff (FT and PT)?
Number of Students
Served 2006‐ 2007‐ ’07 ‘08
Affect on Persistence Measured?
Yes No In Part
Has Comprehen‐sive Outcome/ Impact Assessment Occurred? Yes No
Other Information
Early Alert System Yes Revised format Fall
‘07 Original 8 years ago
• On‐line communication system for faculty to inform students about academic concerns and problems.
• Recovery plan should be developed to provide positive intervention.
None 6544 6984 In
early
years
Tiger Team surveyed students and faculty in Fall 2008 to determine level of usage, perceived benefits and suggestions for improvement. In general, students provided positive feedback about receiving Early alerts and the benefit to them. Faculty reaction was more mixed. Less than 50% of faculty respondents thought the early alerts were definitely or somewhat helpful with student success.
First Year Experience Course ‐ Freshman Seminar FYE: Institute credit: 2 courses (fall and winter), 1 credit each and “coach” component added
Yes 2000 (001) 2005
Non‐credit20 week format o Changed to credit o Objectives revised:* • Transition and community
involvement • Awareness of campus resources • Development of academic and
personal success strategies • Information management
7 – FT 2 – ½ time 10 – 5 section adjuncts
1st year students 2210
1st year students 2275
FYE was preceded by freshman seminar The coach component was preceded by Tiger Friends. FYE is currently under revision. Questions being considered include: • How might a first year course best support the vision of RIT?
APPENDIX C
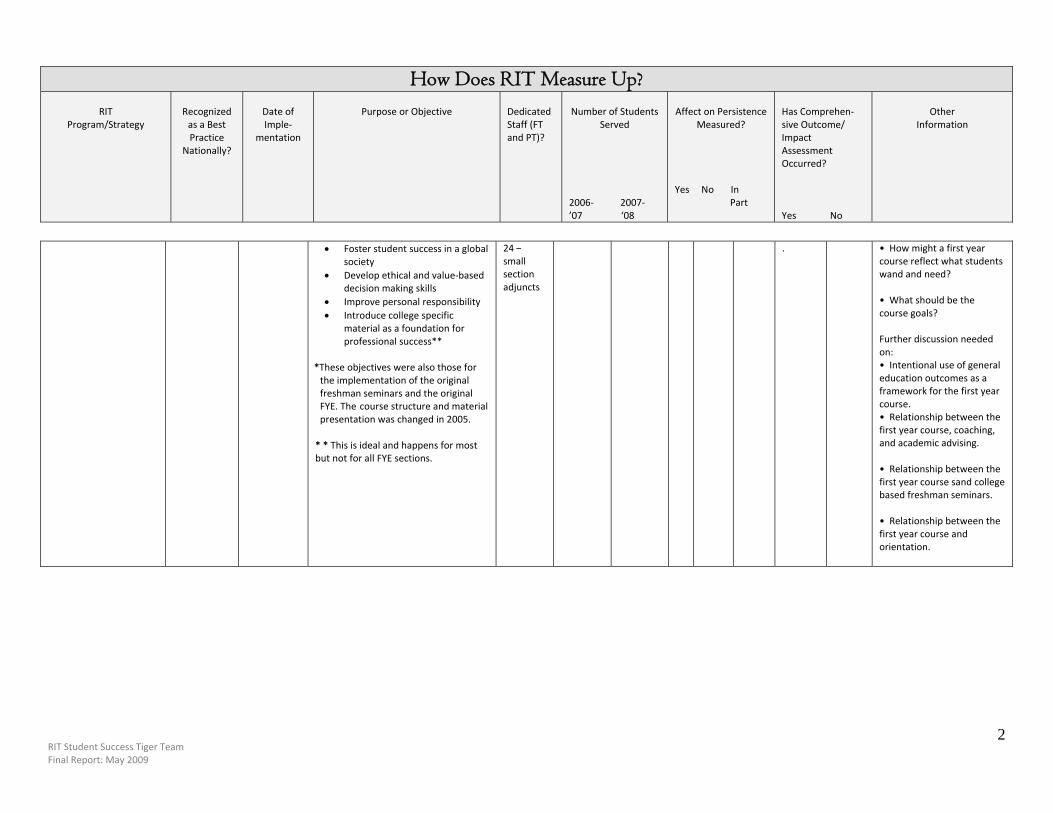
RIT Student Success Tiger Team Final Report: May 2009
2
How Does RIT Measure Up?
RIT
Program/Strategy
Recognized as a Best Practice
Nationally?
Date of Imple‐
mentation
Purpose or Objective Dedicated Staff (FT and PT)?
Number of Students
Served 2006‐ 2007‐ ’07 ‘08
Affect on Persistence Measured?
Yes No In Part
Has Comprehen‐sive Outcome/ Impact Assessment Occurred? Yes No
Other Information
• Foster student success in a global society
• Develop ethical and value‐based decision making skills
• Improve personal responsibility • Introduce college specific
material as a foundation for professional success**
*These objectives were also those for the implementation of the original freshman seminars and the original FYE. The course structure and material presentation was changed in 2005. * * This is ideal and happens for most but not for all FYE sections.
24 –small section adjuncts
.
• How might a first year course reflect what students wand and need? • What should be the course goals? Further discussion needed on: • Intentional use of general education outcomes as a framework for the first year course. • Relationship between the first year course, coaching, and academic advising. • Relationship between the first year course sand college based freshman seminars. • Relationship between the first year course and orientation.
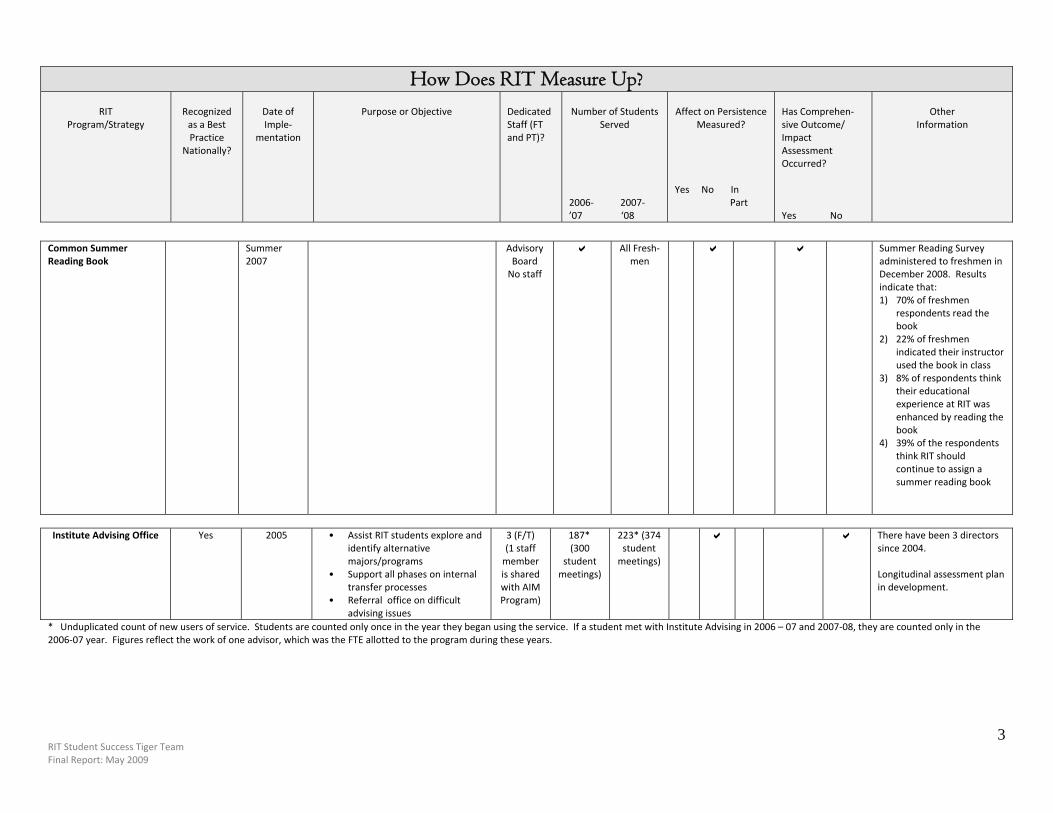
RIT Student Success Tiger Team Final Report: May 2009
3
How Does RIT Measure Up?
RIT
Program/Strategy
Recognized as a Best Practice
Nationally?
Date of Imple‐
mentation
Purpose or Objective Dedicated Staff (FT and PT)?
Number of Students
Served 2006‐ 2007‐ ’07 ‘08
Affect on Persistence Measured?
Yes No In Part
Has Comprehen‐sive Outcome/ Impact Assessment Occurred? Yes No
Other Information
Common Summer Reading Book
Summer 2007
Advisory Board No staff
All Fresh‐men
Summer Reading Survey administered to freshmen in December 2008. Results indicate that: 1) 70% of freshmen
respondents read the book
2) 22% of freshmen indicated their instructor used the book in class
3) 8% of respondents think their educational experience at RIT was enhanced by reading the book
4) 39% of the respondents think RIT should continue to assign a summer reading book
Institute Advising Office Yes 2005 • Assist RIT students explore and
identify alternative majors/programs
• Support all phases on internal transfer processes
• Referral office on difficult advising issues
3 (F/T)(1 staff member is shared with AIM Program)
187*(300
student meetings)
223* (374student meetings)
There have been 3 directors since 2004. Longitudinal assessment plan in development.
* Unduplicated count of new users of service. Students are counted only once in the year they began using the service. If a student met with Institute Advising in 2006 – 07 and 2007‐08, they are counted only in the 2006‐07 year. Figures reflect the work of one advisor, which was the FTE allotted to the program during these years.
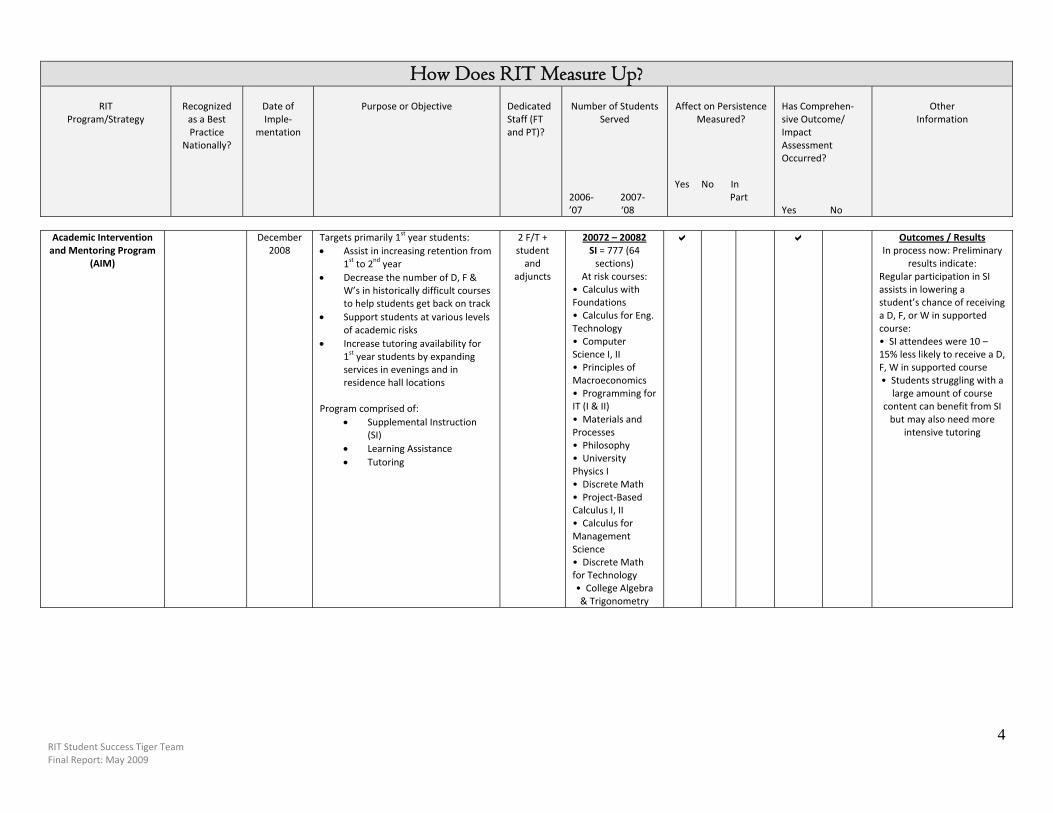
RIT Student Success Tiger Team Final Report: May 2009
4
How Does RIT Measure Up?
RIT Program/Strategy
Recognized as a Best Practice
Nationally?
Date of Imple‐
mentation
Purpose or Objective Dedicated Staff (FT and PT)?
Number of Students
Served 2006‐ 2007‐ ’07 ‘08
Affect on Persistence Measured?
Yes No In Part
Has Comprehen‐sive Outcome/ Impact Assessment Occurred? Yes No
Other Information
Academic Intervention and Mentoring Program
(AIM)
December 2008
Targets primarily 1st year students:• Assist in increasing retention from
1st to 2nd year • Decrease the number of D, F &
W’s in historically difficult courses to help students get back on track
• Support students at various levels of academic risks
• Increase tutoring availability for 1st year students by expanding services in evenings and in residence hall locations
Program comprised of:
• Supplemental Instruction (SI)
• Learning Assistance • Tutoring
2 F/T +student and
adjuncts
20072 – 20082 SI = 777 (64 sections)
At risk courses: • Calculus with Foundations • Calculus for Eng. Technology • Computer Science I, II • Principles of Macroeconomics • Programming for IT (I & II) • Materials and Processes • Philosophy • University Physics I • Discrete Math • Project‐Based Calculus I, II • Calculus for Management Science • Discrete Math for Technology • College Algebra & Trigonometry
Outcomes / Results In process now: Preliminary
results indicate: Regular participation in SI assists in lowering a student’s chance of receiving a D, F, or W in supported course: • SI attendees were 10 – 15% less likely to receive a D, F, W in supported course • Students struggling with a
large amount of course content can benefit from SI but may also need more
intensive tutoring
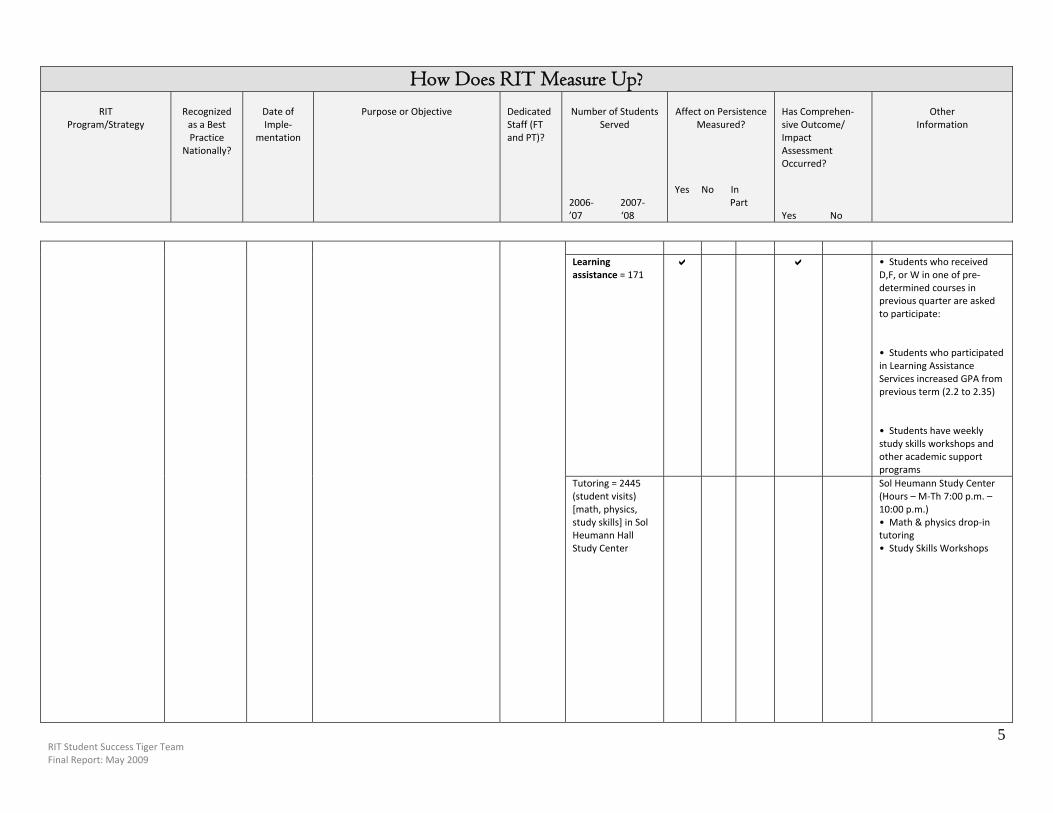
RIT Student Success Tiger Team Final Report: May 2009
5
How Does RIT Measure Up?
RIT
Program/Strategy
Recognized as a Best Practice
Nationally?
Date of Imple‐
mentation
Purpose or Objective Dedicated Staff (FT and PT)?
Number of Students
Served 2006‐ 2007‐ ’07 ‘08
Affect on Persistence Measured?
Yes No In Part
Has Comprehen‐sive Outcome/ Impact Assessment Occurred? Yes No
Other Information
Learning assistance = 171
• Students who received D,F, or W in one of pre‐determined courses in previous quarter are asked to participate:
• Students who participated in Learning Assistance Services increased GPA from previous term (2.2 to 2.35) • Students have weekly study skills workshops and other academic support programs
Tutoring = 2445 (student visits) [math, physics, study skills] in Sol Heumann Hall Study Center
Sol Heumann Study Center (Hours – M‐Th 7:00 p.m. – 10:00 p.m.) • Math & physics drop‐in tutoring • Study Skills Workshops
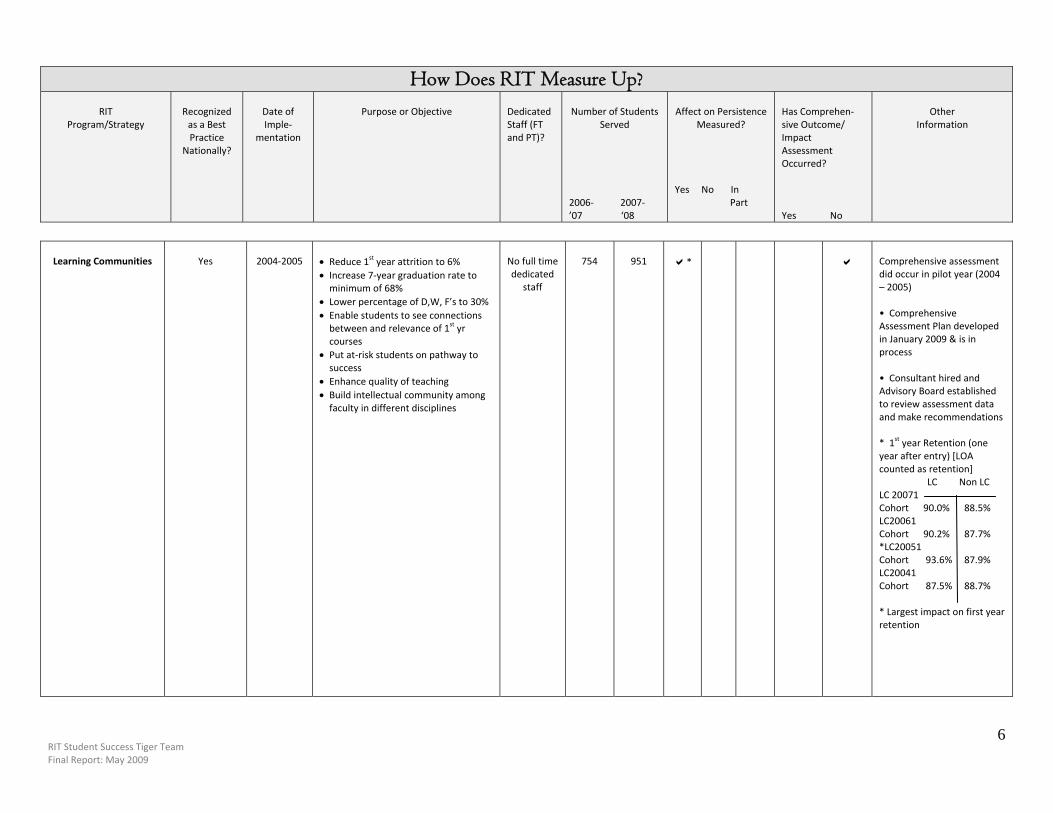
RIT Student Success Tiger Team Final Report: May 2009
6
How Does RIT Measure Up?
RIT
Program/Strategy
Recognized as a Best Practice
Nationally?
Date of Imple‐
mentation
Purpose or Objective Dedicated Staff (FT and PT)?
Number of Students
Served 2006‐ 2007‐ ’07 ‘08
Affect on Persistence Measured?
Yes No In Part
Has Comprehen‐sive Outcome/ Impact Assessment Occurred? Yes No
Other Information
Learning Communities
Yes
2004‐2005
• Reduce 1st year attrition to 6% • Increase 7‐year graduation rate to minimum of 68%
• Lower percentage of D,W, F’s to 30% • Enable students to see connections between and relevance of 1st yr courses
• Put at‐risk students on pathway to success
• Enhance quality of teaching • Build intellectual community among faculty in different disciplines
No full time dedicated
staff
754
951 *
Comprehensive assessment
did occur in pilot year (2004 – 2005) • Comprehensive Assessment Plan developed in January 2009 & is in process • Consultant hired and Advisory Board established to review assessment data and make recommendations * 1st year Retention (one year after entry) [LOA counted as retention] LC Non LC LC 20071 Cohort 90.0% 88.5% LC20061 Cohort 90.2% 87.7% *LC20051 Cohort 93.6% 87.9% LC20041 Cohort 87.5% 88.7% * Largest impact on first year retention
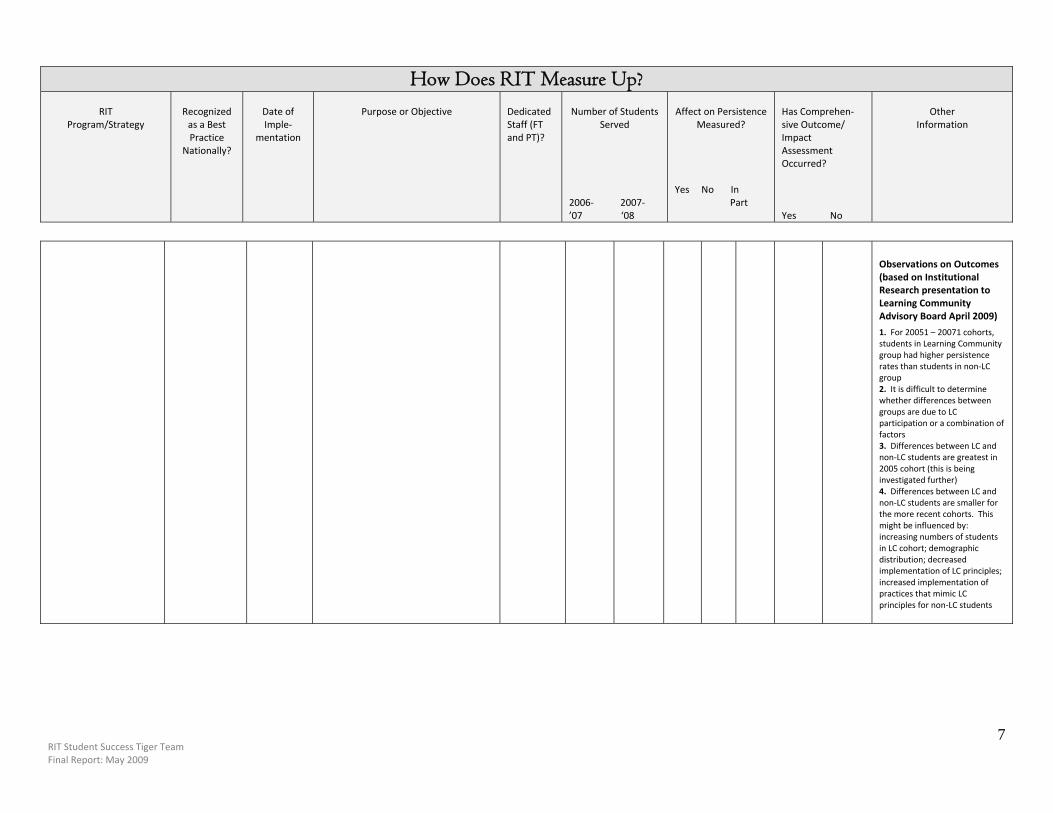
RIT Student Success Tiger Team Final Report: May 2009
7
How Does RIT Measure Up?
RIT
Program/Strategy
Recognized as a Best Practice
Nationally?
Date of Imple‐
mentation
Purpose or Objective Dedicated Staff (FT and PT)?
Number of Students
Served 2006‐ 2007‐ ’07 ‘08
Affect on Persistence Measured?
Yes No In Part
Has Comprehen‐sive Outcome/ Impact Assessment Occurred? Yes No
Other Information
Observations on Outcomes (based on Institutional Research presentation to Learning Community Advisory Board April 2009)
1. For 20051 – 20071 cohorts, students in Learning Community group had higher persistence rates than students in non‐LC group 2. It is difficult to determine whether differences between groups are due to LC participation or a combination of factors 3. Differences between LC and non‐LC students are greatest in 2005 cohort (this is being investigated further) 4. Differences between LC and non‐LC students are smaller for the more recent cohorts. This might be influenced by: increasing numbers of students in LC cohort; demographic distribution; decreased implementation of LC principles; increased implementation of practices that mimic LC principles for non‐LC students
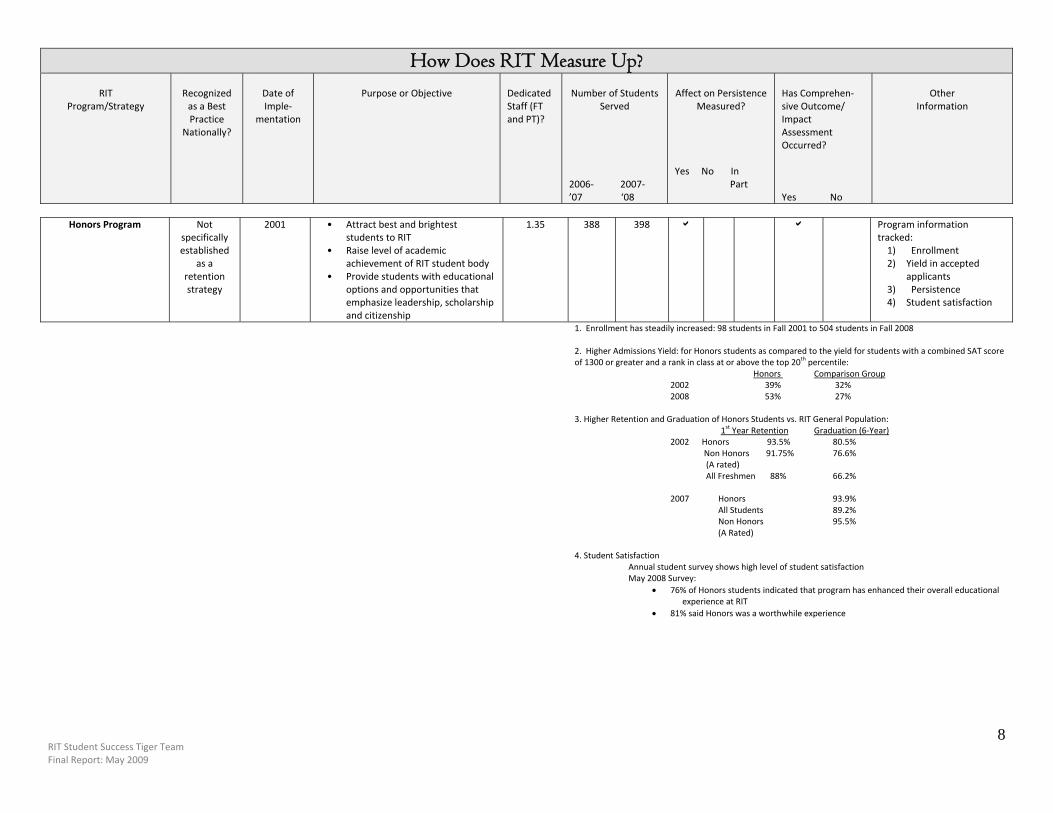
RIT Student Success Tiger Team Final Report: May 2009
8
How Does RIT Measure Up?
RIT Program/Strategy
Recognized as a Best Practice
Nationally?
Date of Imple‐
mentation
Purpose or Objective Dedicated Staff (FT and PT)?
Number of Students
Served 2006‐ 2007‐ ’07 ‘08
Affect on Persistence Measured?
Yes No In Part
Has Comprehen‐sive Outcome/ Impact Assessment Occurred? Yes No
Other Information
Honors Program Not
specifically established
as a retention strategy
2001 • Attract best and brightest students to RIT
• Raise level of academic achievement of RIT student body
• Provide students with educational options and opportunities that emphasize leadership, scholarship and citizenship
1.35 388 398
Program information tracked: 1) Enrollment 2) Yield in accepted
applicants 3) Persistence 4) Student satisfaction
1. Enrollment has steadily increased: 98 students in Fall 2001 to 504 students in Fall 2008
2. Higher Admissions Yield: for Honors students as compared to the yield for students with a combined SAT score of 1300 or greater and a rank in class at or above the top 20th percentile: Honors Comparison Group
2002 39% 32% 2008 53% 27%
3. Higher Retention and Graduation of Honors Students vs. RIT General Population:
1st Year Retention Graduation (6‐Year) 2002 Honors 93.5% 80.5% Non Honors 91.75% 76.6%
(A rated) All Freshmen 88% 66.2% 2007 Honors 93.9% All Students 89.2% Non Honors 95.5% (A Rated)
4. Student Satisfaction Annual student survey shows high level of student satisfaction May 2008 Survey:
• 76% of Honors students indicated that program has enhanced their overall educational experience at RIT
• 81% said Honors was a worthwhile experience
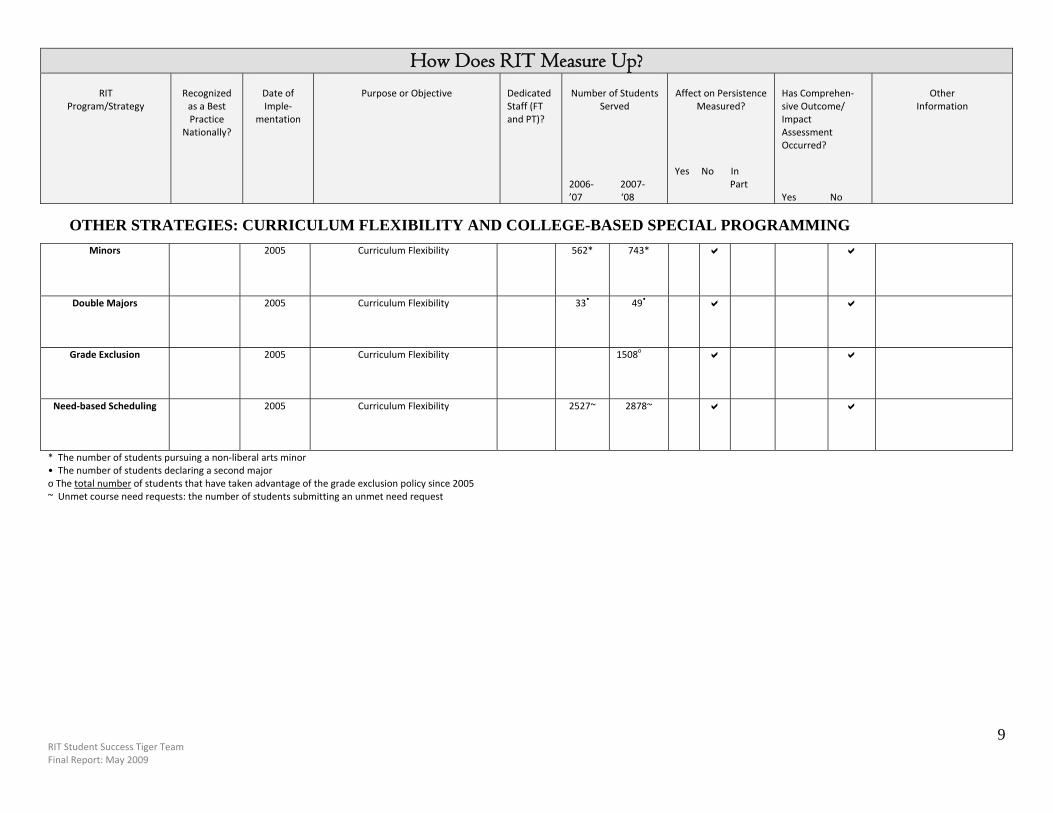
RIT Student Success Tiger Team Final Report: May 2009
9
How Does RIT Measure Up?
RIT Program/Strategy
Recognized as a Best Practice
Nationally?
Date of Imple‐
mentation
Purpose or Objective Dedicated Staff (FT and PT)?
Number of Students
Served 2006‐ 2007‐ ’07 ‘08
Affect on Persistence Measured?
Yes No In Part
Has Comprehen‐sive Outcome/ Impact Assessment Occurred? Yes No
Other Information
Minors
2005 Curriculum Flexibility
562* 743*
Double Majors 2005 Curriculum Flexibility
33• 49•
Grade Exclusion 2005 Curriculum Flexibility
1508o
Need‐based Scheduling 2005 Curriculum Flexibility
2527~ 2878~
* The number of students pursuing a non‐liberal arts minor • The number of students declaring a second major o The total number of students that have taken advantage of the grade exclusion policy since 2005 ~ Unmet course need requests: the number of students submitting an unmet need request
OTHER STRATEGIES: CURRICULUM FLEXIBILITY AND COLLEGE-BASED SPECIAL PROGRAMMING
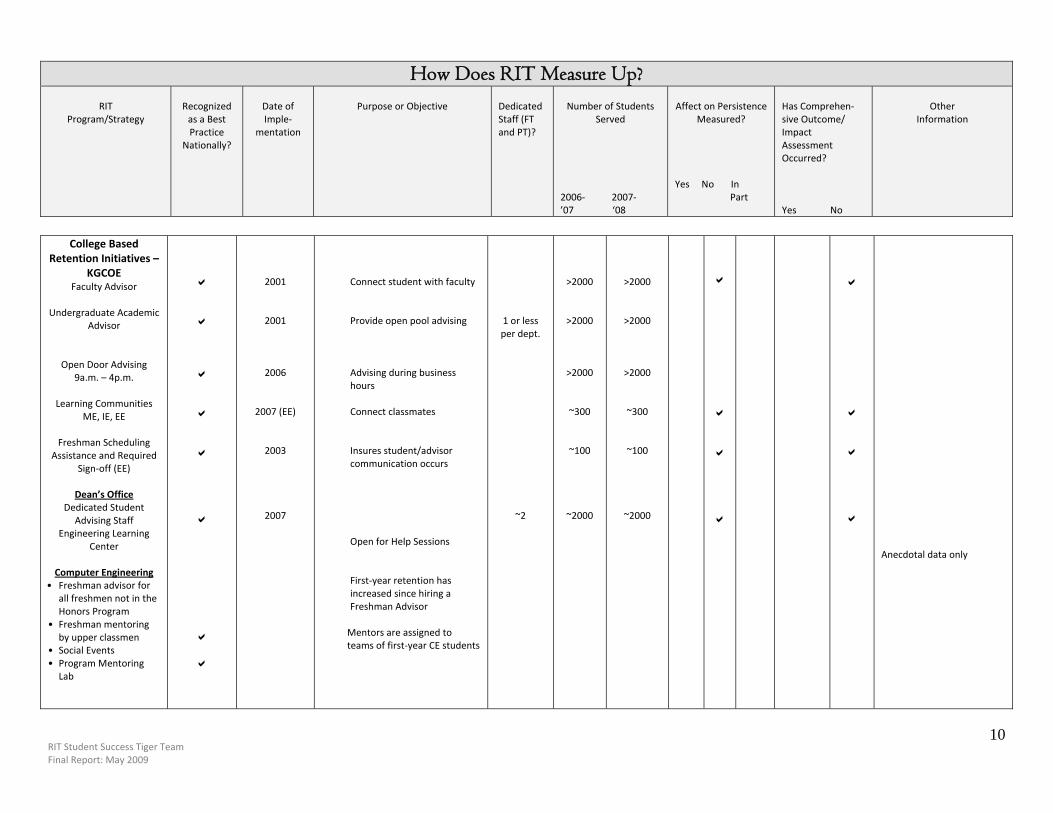
RIT Student Success Tiger Team Final Report: May 2009
10
How Does RIT Measure Up?
RIT Program/Strategy
Recognized as a Best Practice
Nationally?
Date of Imple‐
mentation
Purpose or Objective Dedicated Staff (FT and PT)?
Number of Students
Served 2006‐ 2007‐ ’07 ‘08
Affect on Persistence Measured?
Yes No In Part
Has Comprehen‐sive Outcome/ Impact Assessment Occurred? Yes No
Other Information
College Based
Retention Initiatives – KGCOE
Faculty Advisor
Undergraduate Academic Advisor
Open Door Advising 9a.m. – 4p.m.
Learning Communities
ME, IE, EE
Freshman Scheduling Assistance and Required
Sign‐off (EE)
Dean’s Office Dedicated Student
Advising Staff Engineering Learning
Center
Computer Engineering • Freshman advisor for
all freshmen not in the Honors Program
• Freshman mentoring by upper classmen
• Social Events • Program Mentoring
Lab
2001
2001
2006
2007 (EE)
2003
2007
Connect student with faculty Provide open pool advising Advising during business hours Connect classmates Insures student/advisor communication occurs Open for Help Sessions First‐year retention has increased since hiring a Freshman Advisor Mentors are assigned to teams of first‐year CE students
1 or less per dept.
~2
>2000
>2000
>2000
~300
~100
~2000
>2000
>2000
>2000
~300
~100
~2000
Anecdotal data only
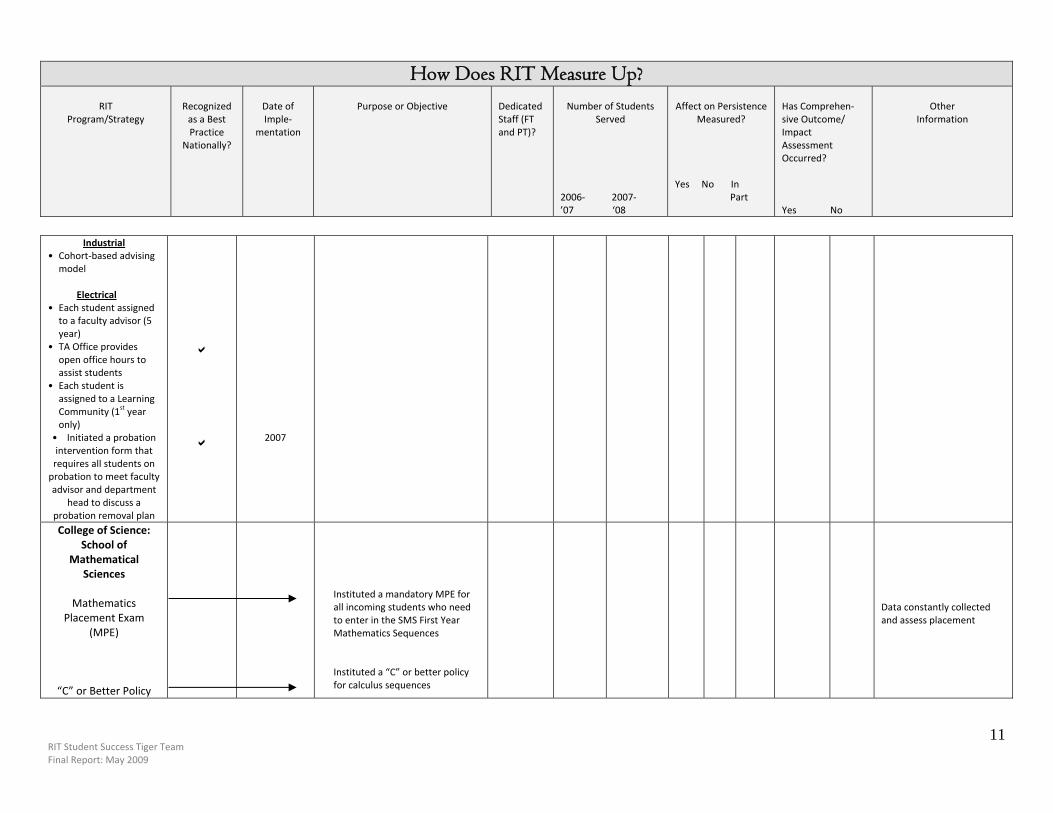
RIT Student Success Tiger Team Final Report: May 2009
11
How Does RIT Measure Up?
RIT Program/Strategy
Recognized as a Best Practice
Nationally?
Date of Imple‐
mentation
Purpose or Objective Dedicated Staff (FT and PT)?
Number of Students
Served 2006‐ 2007‐ ’07 ‘08
Affect on Persistence Measured?
Yes No In Part
Has Comprehen‐sive Outcome/ Impact Assessment Occurred? Yes No
Other Information
Industrial
• Cohort‐based advising model
Electrical
• Each student assigned to a faculty advisor (5 year)
• TA Office provides open office hours to assist students
• Each student is assigned to a Learning Community (1st year only)
• Initiated a probation intervention form that requires all students on probation to meet faculty advisor and department
head to discuss a probation removal plan
2007
College of Science: School of
Mathematical Sciences
Mathematics
Placement Exam (MPE)
“C” or Better Policy
Instituted a mandatory MPE for all incoming students who need to enter in the SMS First Year Mathematics Sequences Instituted a “C” or better policy for calculus sequences
Data constantly collected and assess placement
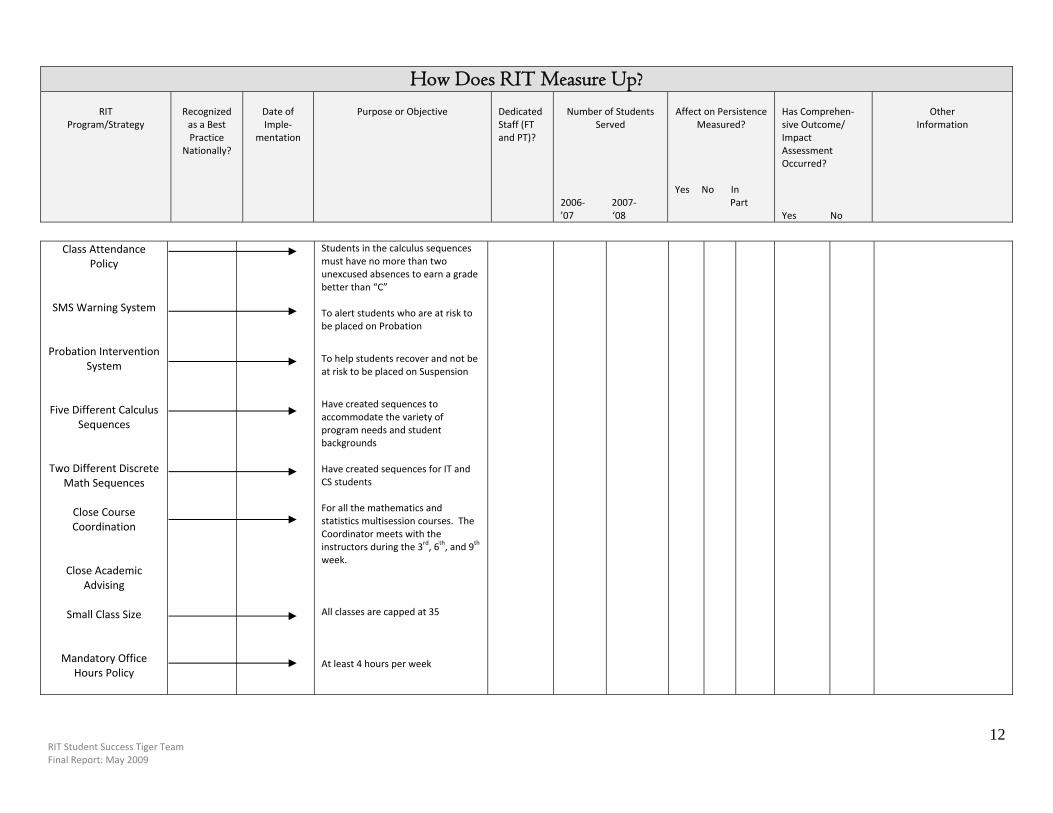
RIT Student Success Tiger Team Final Report: May 2009
12
How Does RIT Measure Up?
RIT
Program/Strategy
Recognized as a Best Practice
Nationally?
Date of Imple‐
mentation
Purpose or Objective Dedicated Staff (FT and PT)?
Number of Students
Served 2006‐ 2007‐ ’07 ‘08
Affect on Persistence Measured?
Yes No In Part
Has Comprehen‐sive Outcome/ Impact Assessment Occurred? Yes No
Other Information
Class Attendance
Policy
SMS Warning System
Probation Intervention System
Five Different Calculus Sequences
Two Different Discrete Math Sequences
Close Course Coordination
Close Academic Advising
Small Class Size
Mandatory Office Hours Policy
Students in the calculus sequences must have no more than two unexcused absences to earn a grade better than “C”
To alert students who are at risk to be placed on Probation
To help students recover and not be at risk to be placed on Suspension
Have created sequences to accommodate the variety of program needs and student backgrounds
Have created sequences for IT and CS students
For all the mathematics and statistics multisession courses. The Coordinator meets with the instructors during the 3rd, 6th, and 9th week.
All classes are capped at 35
At least 4 hours per week
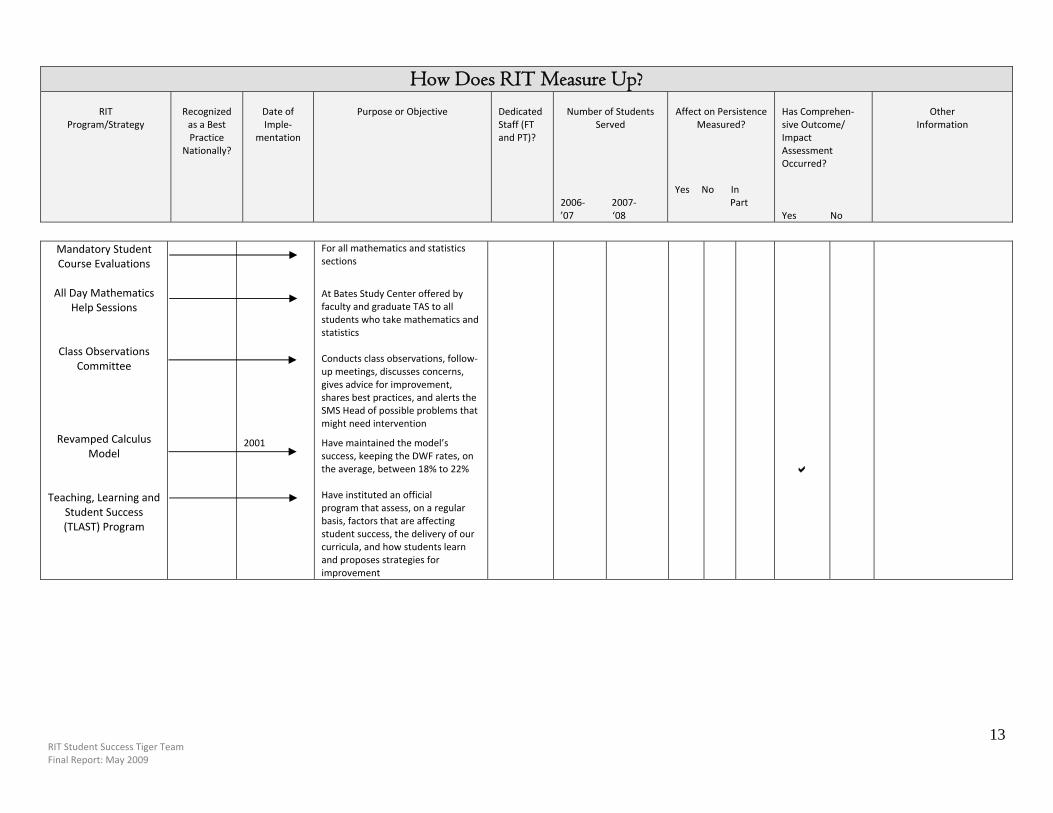
RIT Student Success Tiger Team Final Report: May 2009
13
How Does RIT Measure Up?
RIT
Program/Strategy
Recognized as a Best Practice
Nationally?
Date of Imple‐
mentation
Purpose or Objective Dedicated Staff (FT and PT)?
Number of Students
Served 2006‐ 2007‐ ’07 ‘08
Affect on Persistence Measured?
Yes No In Part
Has Comprehen‐sive Outcome/ Impact Assessment Occurred? Yes No
Other Information
Mandatory Student Course Evaluations
All Day Mathematics
Help Sessions
Class Observations Committee
Revamped Calculus Model
Teaching, Learning and Student Success (TLAST) Program
2001
For all mathematics and statistics sections
At Bates Study Center offered by faculty and graduate TAS to all students who take mathematics and statistics
Conducts class observations, follow‐up meetings, discusses concerns, gives advice for improvement, shares best practices, and alerts the SMS Head of possible problems that might need intervention
Have maintained the model’s success, keeping the DWF rates, on the average, between 18% to 22%
Have instituted an official program that assess, on a regular basis, factors that are affecting student success, the delivery of our curricula, and how students learn and proposes strategies for improvement