Embed Size (px)
Citation preview
This article was downloaded by: [Aston University]On: 06 October 2014, At: 00:13Publisher: RoutledgeInforma Ltd Registered in England and Wales Registered Number: 1072954 Registeredoffice: Mortimer House, 37-41 Mortimer Street, London W1T 3JH, UK
Adoption QuarterlyPublication details, including instructions for authors andsubscription information:http://www.tandfonline.com/loi/wado20
Structured Home Study Evaluations:Perceived Benefits of SAFE VersusConventional Home StudiesThomas M. Crea a , Richard P. Barth b , Laura Chintapalli c & RachelL. Buchanan da Boston College , Chestnut Hill, Massachusetts, USAb University of Maryland at Baltimore , Baltimore, Maryland, USAc University of North Carolina at Chapel Hill , Chapel Hill, NorthCarolina, USAd Salisbury University , Salisbury, Maryland, USAPublished online: 15 Jun 2009.
To cite this article: Thomas M. Crea , Richard P. Barth , Laura Chintapalli & Rachel L. Buchanan(2009) Structured Home Study Evaluations: Perceived Benefits of SAFE Versus Conventional HomeStudies, Adoption Quarterly, 12:2, 78-99, DOI: 10.1080/10926750902978824
To link to this article: http://dx.doi.org/10.1080/10926750902978824
PLEASE SCROLL DOWN FOR ARTICLE
Taylor & Francis makes every effort to ensure the accuracy of all the information (the“Content”) contained in the publications on our platform. However, Taylor & Francis,our agents, and our licensors make no representations or warranties whatsoever as tothe accuracy, completeness, or suitability for any purpose of the Content. Any opinionsand views expressed in this publication are the opinions and views of the authors,and are not the views of or endorsed by Taylor & Francis. The accuracy of the Contentshould not be relied upon and should be independently verified with primary sourcesof information. Taylor and Francis shall not be liable for any losses, actions, claims,proceedings, demands, costs, expenses, damages, and other liabilities whatsoever orhowsoever caused arising directly or indirectly in connection with, in relation to or arisingout of the use of the Content.
This article may be used for research, teaching, and private study purposes. Anysubstantial or systematic reproduction, redistribution, reselling, loan, sub-licensing,systematic supply, or distribution in any form to anyone is expressly forbidden. Terms &

Conditions of access and use can be found at http://www.tandfonline.com/page/terms-and-conditions
Dow
nloa
ded
by [
Ast
on U
nive
rsity
] at
00:
13 0
6 O
ctob
er 2
014

Adoption Quarterly, 12:78–99, 2009Copyright © Taylor & Francis Group, LLCISSN: 1092-6755 print / 1544-452X onlineDOI: 10.1080/10926750902978824
Structured Home Study Evaluations:Perceived Benefits of SAFE Versus
Conventional Home Studies
THOMAS M. CREABoston College, Chestnut Hill, Massachusetts, USA
RICHARD P. BARTHUniversity of Maryland at Baltimore, Baltimore, Maryland, USA
LAURA CHINTAPALLIUniversity of North Carolina at Chapel Hill, Chapel Hill, North Carolina, USA
RACHEL L. BUCHANANSalisbury University, Salisbury, Maryland, USA
Structured decision-making methods are gaining ascendance inchild welfare services, in which professionals combine standard-ized methods of data collection and analysis with clinical judg-ments. This study measures professionals’ perception of a new ap-proach to home study assessments, the Structured Analysis FamilyEvaluation (SAFE). Findings indicate that workers favor the useof SAFE overall. Less experienced workers are especially positiveabout SAFE, while more experienced workers and supervisors tendto be less positive. State-by-state differences also emerged. Open-ended responses offer areas for clarification, training, and potentialimprovement.
KEYWORDS home studies, structured assessments, resource fam-ilies, adoption, foster care
Received 10 March 2008; revised 23 June 2008; accepted 22 February 2009.This research was funded by the United States Department of Health and Human Services,
Administration on Children and Families, Children’s Bureau via an interagency agreement withthe Consortium for Children, San Rafael, CA, and the University of North Carolina at ChapelHill. The authors wish to thank Kate Cleary and Jim Brown for their helpful comments andcritiques of this manuscript.
Address correspondence to Thomas M. Crea, PhD, LCSW, Graduate School of SocialWork, Boston College, 140 Commonwealth Avenue, Chestnut Hill, MA 02467. E-mail: [email protected]
78
Dow
nloa
ded
by [
Ast
on U
nive
rsity
] at
00:
13 0
6 O
ctob
er 2
014

Structured Home Studies 79
In adoption practice, the home study process is the avenue through whichall prospective adoptive and foster families are assessed and approvedfor child placement. Some consensus exists with regard to the essentialcomponents of home studies in the field of adoption, including demo-graphic, relational, and financial information; a series of interviews; andreferences. Yet, even in adoption, the application of home study processesvaries (Allphin, Simmons, & Barth, 2001) such that the level and qualityof information under consideration may differ considerably among statesand agencies (Freundlich, Heffernan, & Jacobs, 2004). Even less uniformityexists among conventional foster care licensure and kin care assessments.Foster care licensing activities tend to focus more on physical and safetyissues than psychosocial dimensions. Kin care assessments fall somewherebetween adoption practice and foster care in terms of scope and compre-hensiveness. Some evidence suggests that child welfare workers tend tomake inconsistent decisions (DePanfilis & Girvin, 2005; Rossi, Schuermann,& Budde, 1999) that likely affect home study assessment decisions. Yet,despite approximately 90 years of home study practice in American childwelfare and despite state and federal requirements mandating the use ofhome study, few social service researchers have systematically studied homestudy processes (Crea, Barth, & Chintapalli, 2007).
THE STRUCTURED ANALYSIS FAMILY EVALUATIONMETHODOLOGY
This study measures professionals’ perceptions of a new approach to homestudy assessments, the Structured Analysis Family Evaluation (SAFE), a stan-dardized home study method for assessing prospective adoptive, foster, andkinship families currently operating, at the time of writing, in 13 states and3 Canadian provinces. The SAFE home study methodology comprises sixprimary components:
1. A statement of practice values that outlines 10 practice guidelines to ensurethe validity of the process
2. Information-gathering tools that include standardized questionnaires andtemplates for the family’s references
3. A psychosocial inventory that provides assessment based on 68 psychoso-cial factors using a 5-point scale
4. The desk guide, a tool for rating and analyzing the data gathered usingthe psychosocial inventory
5. A preformatted home study that provides a comprehensive, standardizedreport
6. The matching inventory, a structured compatibility list designed to assistplacement workers in assessing the “goodness of fit” between childrenand prospective families (Consortium for Children, n.d.)
Dow
nloa
ded
by [
Ast
on U
nive
rsity
] at
00:
13 0
6 O
ctob
er 2
014
80 T. M. Crea et al.
The more uniform and standardized approach of SAFE may hold poten-tial as a means for increasing the reliability and validity of home studies andalso serves as a model for standardizing studies across jurisdictions.
The purpose of this study is to measure the perceptions of child welfareworkers and supervisors regarding the benefits of SAFE compared with con-ventional home study methods. This study represents the first effort in manyyears to pursue an empirical examination of home study methods in childwelfare. Our previous review of home study literature in the child welfarefield (Crea et al., 2007) discovered no strong empirical studies of home studymethods after 1962. As such, our review required the use of literature outsidethe realm of home studies.
We first review literature pertaining to other efforts to integrate struc-tured data collection and clinical interviews. Examples of this are: (a) riskassessments, (b) the relationship between interview structure and the relia-bility and validity of data, (c) the balance of the dual purposes of selectionand retention within interviews, and (d) how interview structure may af-fect the perceptions of both applicants and interviewers regarding the valueof the interview process. We next introduce the SAFE structure and pro-cess and present quantitative and qualitative results delineating respondents’preferences for either SAFE or conventional home study methods.
STRUCTURED ASSESSMENTS IN CHILD WELFARE
The increased use of structured assessments in child welfare is an attemptto standardize predictions of future child maltreatment or derivative caseoutcomes. The most widely used approach is the structured risk assess-ment instrument, used to analyze two main components of a given situation:(1) the likelihood that a harmful event will occur and (2) if a harmful eventoccurs, the extent of its potential severity. In child welfare, structured risk as-sessments are essentially lists of caregiver, child, or environmental attributesthat can inform prediction of an outcome of interest (Gambrill & Shlonsky,2000).
Structured risk assessment procedures are intended to improve the deci-sion making process by promoting greater consistency in assessments, higherlevels of supervision, and more efficient allocation of resources (Wald &Woolverton, 1990). The move toward this approach reflects research thatdemonstrates inconsistencies in workers’ clinical judgments. For example,Rossi et al. (1999) found that workers varied widely in their assessmentsof child maltreatment cases and that decisions tended not to predict casecharacteristics in a structured manner. Generally, structured assessments im-prove the precision of predictions and their related decisions by integratingstructured recording of case information with professional judgment (Freitag,2007). Some empirical evidence suggests the success of structured decisionmaking at doing so (Baird & Wagner, 2000).
Dow
nloa
ded
by [
Ast
on U
nive
rsity
] at
00:
13 0
6 O
ctob
er 2
014

Structured Home Studies 81
INTERVIEW STRUCTURE: SELECTION AND RETENTIONOF APPLICANTS
SAFE differs from conventional home study methods in child welfare in itsincreased use of structure. This approach cannot be considered a “risk as-sessment” as typically characterized in the field of child welfare, however,because the purpose of SAFE is to explore the suitability of resource familyapplicants, not simply to estimate the probability of future abuse or neglect.To that end, SAFE incorporates an array of structured tools to support thecaseworker in making sound decisions regarding the licensing/approval ofprospective adoptive, foster, and kin care families and the determination ofthe children they can best serve. This standardization is intended to increasethe validity of these decisions through promoting more thorough assess-ments and to increase the reliability of decision making across workers andjurisdictions.
SAFE interviews are informed by applicant-completed questionnairesto ensure that every applicant is exposed to, and every worker considers,all core home study questions in every study. The answers to the SAFEquestionnaires are intended to provide focus and clues to the social workerin determining what issues require greater clarification during the ensuinginterviews. While SAFE questionnaire content is uniform and standardized,the style, scope, and nature of the related interview processes are not. TheSAFE home study process relies on traditional social work interviews tofacilitate the applicants’ opportunity to “tell their story” and the caseworker’sopportunity to pursue and satisfy their curiosity regarding those stories.
According to SAFE developers, interviews should be done in an open,unstructured manner consistent with the social worker’s judgment and skill,the applicant’s readiness, and the topical guidance rendered by the question-naires (Jim Brown, personal communication, October 5, 2007). The SAFEmethodology is not a structured interview (or “checklist interview”) thatimposes artificial constraints on practitioners. Other avenues of inquiry re-garding family and relationship issues that fall outside the scope of thequestionnaires’ content may develop. While these questionnaires containcomprehensive home study information, no system or packaged methodcan exhaust all of the issues that may be relevant in a particular home study.
Evidence has demonstrated that increased structure tends to increasethe validity of the decision making process (Campion, Palmer, & Campion,1997). Although SAFE is not a structured interview in the traditional senseof strict adherence to checklists, it represents a substantial increase in thestructure of the home study. The goal of structuring interviews is to reducethe inherent error involved in gathering complete and accurate informationfrom applicants, especially when inquiring about sensitive behaviors thatfrequently are misreported or underreported (Van der Heijden, van Gils,Bouts, & Hox, 2000). The purpose of home studies is to evaluate and engage
Dow
nloa
ded
by [
Ast
on U
nive
rsity
] at
00:
13 0
6 O
ctob
er 2
014
82 T. M. Crea et al.
prospective families by thoroughly exploring applicants’ past and presentbehavior and overall functioning (Crea et al., 2007). Therefore, it shouldfollow that increasing structure in home studies should also increase thevalidity of the information gathered as well as the reliability of decisionsacross workers and agencies.
Yet, both applicants and interviewers generally perceive unstructuredinterviews as more effective in gathering information (Chapman & Zweig,2005; Lievens, Highhouse, & De Corte, 2005). This discrepancy may haveseveral possible explanations. Practitioners’ favorable perceptions of unstruc-tured interviews may be related either to their sense of loss of control over thedecision making process when using highly structured methods (Chapman& Zweig, 2005) or to the belief that intuition supersedes actuarial knowledge(Shlonsky & Wagner, 2005). In fact, a study conducted by Lievens et al.(2005) showed that supervisors making hiring decisions typically regardedinformation derived from paper-and-pencil formats with greater skepticismthan that obtained from unstructured interviews. One explanation for thisskepticism was the great importance supervisors placed on their interactionswith the applicant during the interview. Thus, from the decision maker’sperspective, the combination of structured data collection and personal in-terviewing appears optimal.
Alternatively, this skepticism could be related to the unequal perfor-mance of different formats in achieving the dual objectives involved in manyhuman resources situations, that is, selection and recruitment (Chapman &Zweig, 2005). Interviewers may resist adopting structured techniques if theypreclude the ability to build rapport with applicants. In other words, thebenefits of increased structure may be lost if it impairs the ability to en-gage the interviewee and effectively recruit them (Chapman & Zweig, 2005).As it pertains to approving prospective families, this recruitment dynamiclikely pertains more to retention, that is, the extent to which the home studyprocess succeeds in retaining strong candidates for fostering or adopting.
SAFE represents increased structure in the home study process, but italso provides an interview forum to explore sensitive issues with the familyin an organized but tailored fashion. Thus, SAFE is more of a structured guidefor social work home study practice and judgment. The following sectionintroduces the structure and process of SAFE as a home study method.
THE STRUCTURED ANALYSIS FAMILY EVALUATION (SAFE)
SAFE practice guidelines encourage the use of unstructured clinical inter-views that draw on information gathered by structured questionnaires. Inpart, the rationale of SAFE’s methodology is that providing workers withinstruments that consistently cover difficult topics will promote a consis-tent and structured process of gathering and analyzing information from
Dow
nloa
ded
by [
Ast
on U
nive
rsity
] at
00:
13 0
6 O
ctob
er 2
014
Structured Home Studies 83
applicants and their references. SAFE incorporates an array of structuredtools, including
1. applicant-completed questionnaires that provide an opportunity for appli-cants to reflect on their upbringing, family relationships, life experiences,habits, and patterns of behavior, giving the social worker points of depar-ture for discussion
2. reference letter templates3. a psychosocial inventory4. a desk guide that provides anchored scales to assist the social worker in
interpreting the a psychosocial inventory in light of the “big picture” of thefamily developed through the home study process (for more information,see www.safehomestudy.org).
The questionnaires help the caseworker identify topics that require clarifica-tion, development, and understanding during the course of the home studyinterviews. These questionnaires facilitate and supplement the interview pro-cess, rather than supplant or direct the interview. As such, caseworkers arefree to pursue other topics that are important to understanding an applicant’ssituation.
SAFE DECISION MAKING PROCESS
SAFE outlines an iterative decision making process for workers to obtaininformation from families, discuss sensitive information, and then evalu-ate whether the family should be approved. This process follows 6 stages.Stage 1, information gathering, focuses on using social work interviewsguided by SAFE questionnaires, agency applications, and third-party infor-mation to build a store of knowledge about the family. Stage 2, analysis, is anexploration of salient issues that prompt further probing by the practitionerto clarify, develop, and understand the issues. Stage 3, addressing issues, usessocial work interviews to actively engage applicants, gather additional infor-mation, and develop confidence in the data. Stage 4, assessment, uses thedesk guide rating manual to determine the appropriate ratings on the 68 fac-tors included in the psychosocial inventory instrument. Once the ratings arecompleted, the practitioner must decide to either proceed to the next stageor return to stage 1 to develop further knowledge and confidence. Stage 5,the mitigation process, considers the final ratings along with informed socialwork judgment as applied to any of the psychosocial inventory factors thatrated as “issues of concern.” This process takes into account additional con-siderations developed during the course of the home study (i.e., beyond thescope of the desk guide) that sustain, reduce, or erase the level of concernregistered in the stage 4 assessment. Stage 6, evaluation, draws upon all the
Dow
nloa
ded
by [
Ast
on U
nive
rsity
] at
00:
13 0
6 O
ctob
er 2
014
84 T. M. Crea et al.
information and considerations from previous stages to answer the question,“What does the information developed during this home study mean?” Thisevaluation requires an informed social work judgment about the applicants’capability, willingness, and ability to carry out the role of parent safely andeffectively. In addition, the social worker must develop a description of thechildren with whom the applicants would be most compatible.
THE MITIGATION PROCESS: THE LINK BETWEEN SAFESTANDARDS AND SOCIAL WORK JUDGMENT
As described above as part of the mitigation process, the social worker setsaside the desk guide to examine all available information. This process isguided by explicit analytical components that are intended to produce aclear decision as to whether an issue of concern is sustained, reduced, orerased. These components include: (a) the issue of concern; (b) its extent,frequency, and severity; (c) its roots in time, place, and context; (d) the appli-cant’s degree of resolution or adaptation; (e) the strength of the applicant’sresolution or adaptation; (f) the amount of energy required to sustain theresolution or adaptation; and (g) a statement of the evidence that supportsthis evaluation.
As each concern is considered during the mitigation process, the prac-titioner rates the current and likely future impact of the concern using aconceptual rating scale. This scale includes the following categories:
exceptional strength: exceptionally positive qualities that are consistent withsafe and effective family functioning
strength: positive qualities that are consistent with safe and effective familyfunctioning
concern: concerns that could or would impede safe and/or effective familyfunctioning
serious concern: more serious concerns that could or would impede safeand/or effective family functioning
extremely serious concern: extremely serious concerns that could or wouldseverely impede safe and/or effective family functioning.
For example, during the mitigation process (stage 5), an applicant’s his-tory of heavy marijuana use would warrant a desk guide rating of 4 on the5-point scale, which is equivalent to a “serious concern.” In this case, thesocial worker would probe further to discover the status of the applicant’smarijuana use. If the social worker found that the applicant’s marijuana useoccurred many years ago, that there has been no such subsequent behavior;that the applicant has resolved the issue of marijuana use, and that sustain-ing that resolution requires little or no effort, then the social worker mightdetermine through his or her clinical judgment that this historical fact is no
Dow
nloa
ded
by [
Ast
on U
nive
rsity
] at
00:
13 0
6 O
ctob
er 2
014
Structured Home Studies 85
longer a concern. Thus, the new information would mitigate the impact ofthe issue to a rating of 2 on the 5-point scale (i.e., not a current problem).In this case, the issue of concern would still be included in the narrative ofthe home study report, but with a good showing of evidence that the issuehas been mitigated. After completing these stages, the practitioner writesthe narrative psychosocial evaluation report and explains the basis for anymovement away from the anchored ratings obtained from the desk guide.The purpose of the comprehensive narrative is to provide the reader with thefull scope of information gathered during the home study and of the decisionmaking process used to justify the final recommendation. The SAFE processis further refined by the availability of computer-assisted compartmentalizedhome study templates that provide a structured format for narrating each ofthe 68 factors of psychosocial functioning.
METHOD
After a pretest period involving approximately 7 participants, researcherssent an online survey to child welfare agency staff members (workers andsupervisors) in four states selected based on their expressed commitment toSAFE implementation: Colorado (implemented in 2004), New Jersey (imple-mented in 2004), Nevada (implemented in 2003), and Utah (implementedin 2005). Workers and supervisors in each site received an intensive 2-daytraining prior to using SAFE. Following these initial trainings, New Jerseyreceived multiple on-site follow-up trainings, Colorado and Utah receivedfollow-up trainings by phone conference, and no follow-up trainings wereheld in Nevada. State administrators e-mailed links to the survey with a mes-sage in the e-mail outlining institutional review board consent and confiden-tiality procedures, to approximately 500 foster care and adoption workers inColorado, 400 in New Jersey, 35 in Nevada, and 20 in Utah. Between Januaryand March of 2007, responses were collected from 105 workers in Colorado(21.0%), 66 in New Jersey (16.5%), 25 in Nevada (71.4%), and 13 in Utah(65.0%) for a total of 209 responses. This number represents between 21.9%and 33.1% of the approximately 630 to 955 total workers who were e-mailedthe survey. The uncertainty about the response rate is because workers weretold not to complete the survey if they had not done at least three SAFEhome studies; we are not certain how many of the workers who were sentthe survey received the e-mail or how many screened themselves out be-cause of their observance of this requirement. We expect that this numbermight be as high as one-third of all the workers who were sent the survey. Inaddition, some state administrators were unclear regarding the exact numberof e-mails in their database. A statistical analysis comparing respondents andnonrespondents is therefore not possible.
Dow
nloa
ded
by [
Ast
on U
nive
rsity
] at
00:
13 0
6 O
ctob
er 2
014
86 T. M. Crea et al.
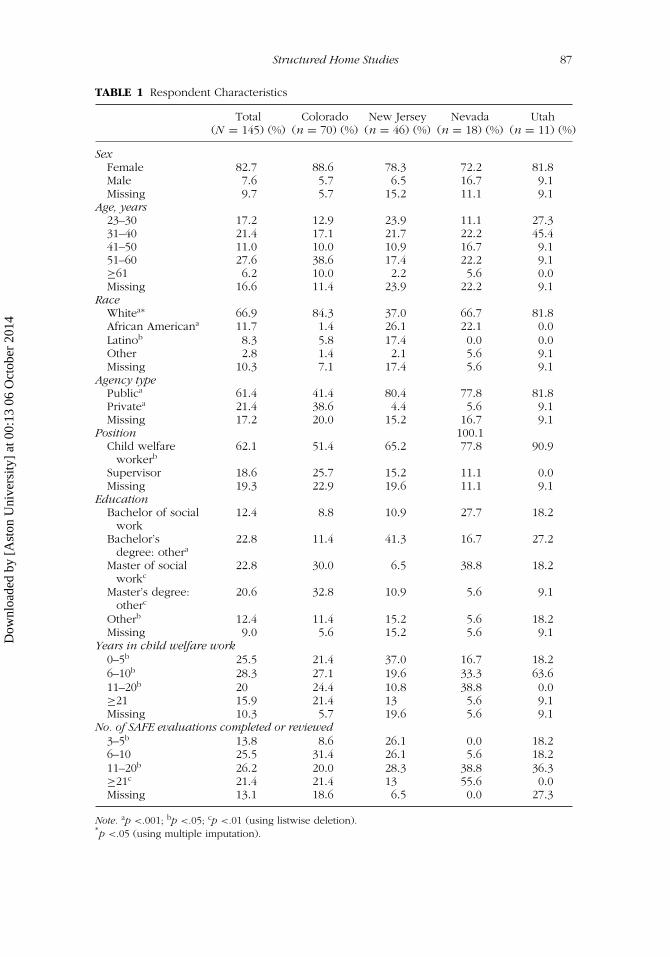
Further examination revealed a large percentage of missing data forseveral variables in our analyses. We opted to restrict the sample, usinglistwise deletion, only to respondents (N = 145) who completed the fullpreference scale for SAFE compared with conventional methods, describedin more detail below. This sample resulted in 70 responses from Colorado(48.3%), 46 from New Jersey (31.7%), 18 from Nevada (12.4%), and 11 fromUtah (7.6%). Table 1 presents the characteristics of workers who completedthe survey, by state.
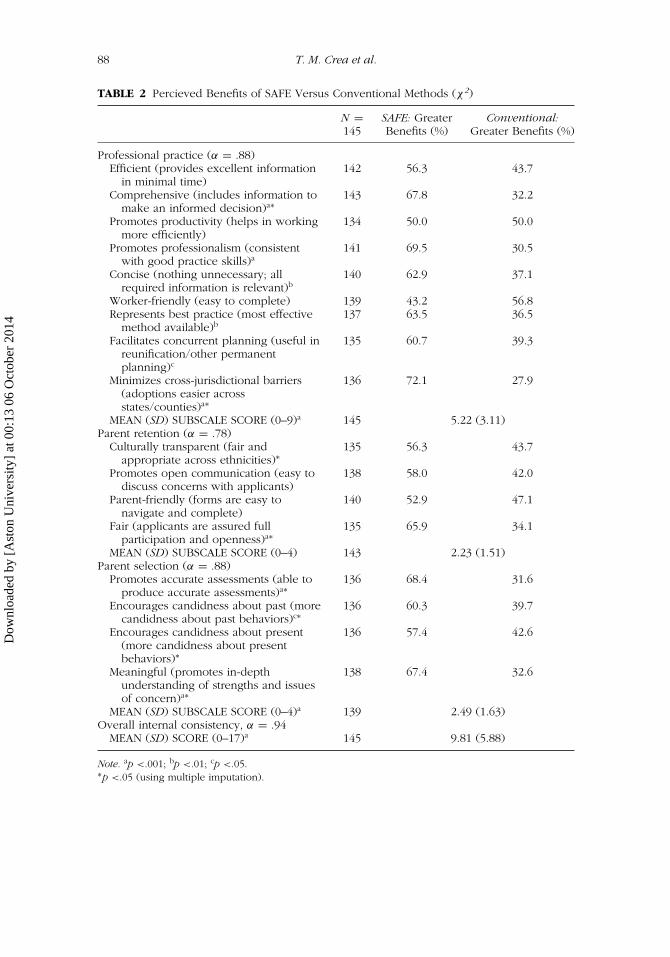
The survey collected demographic information and measured prefer-ences for the SAFE program. Research questions were as follows: (1) Towhat extent do respondents prefer SAFE or conventional home study meth-ods overall and specifically within the areas of professional practice andthe retention and selection of potential resource parents? (2) What themesemerge from respondents’ written opinions of SAFE compared with con-ventional methods? Preferences were measured using a scale comprisingindicators within the areas of professional practice, parent retention, andparent selection. Responses were summed to create an overall preferencescore for SAFE and preference scores for the three subscales of professionalpractice, parent retention, and parent selection (higher scores represented astronger endorsement of SAFE). Using listwise deletion of missing data, chi-square tests were used for each indicator to determine significant differencesbetween SAFE and conventional home study methods (see Table 2, whichincludes slightly abridged item descriptions). Summed scores were then strat-ified by demographic variables and compared using one-way ANOVA toexamine mean differences in the perceived benefits of SAFE (Table 3).
Even after the listwise deletion of all cases not containing a score onthe full scale, individual scale items contained missing data for between 2and 10 cases (Table 2). Other variables contained missing data for between2 and 29 cases (Table 3). As a result, in addition to the analyses describedabove, we conducted a sensitivity analysis using multiple imputation (MI)methods for missing data. These methods allow the combining of resultsfrom a series of data sets derived from the original to impute missing datawith estimated values (Acock, 2005; Yuan, 2000). We used SAS PROC MI andPROC MIANALYZE to produce p values with imputed missing data. Wheneither listwise deletion or MI produced a significant result, we report p valuesfor both.
Open-ended questions solicited staff persons’ opinions regarding therelative benefits of SAFE. A logistic regression model measured the likeli-hood of a respondent’s providing a comment based on their demographicinformation and experience with SAFE. Written answers to 3 items wereanalyzed to obtain a better understanding of the perceptions child welfareworkers and supervisors have of the SAFE methodology for home studies.The 3 items were the following: (1) “Please provide additional commentson how accurately SAFE identifies a range of issues when compared with
Dow
nloa
ded
by [
Ast
on U
nive
rsity
] at
00:
13 0
6 O
ctob
er 2
014
Structured Home Studies 87
TABLE 1 Respondent Characteristics
Total Colorado New Jersey Nevada Utah(N = 145) (%) (n = 70) (%) (n = 46) (%) (n = 18) (%) (n = 11) (%)
SexFemale 82.7 88.6 78.3 72.2 81.8Male 7.6 5.7 6.5 16.7 9.1Missing 9.7 5.7 15.2 11.1 9.1
Age, years23–30 17.2 12.9 23.9 11.1 27.331–40 21.4 17.1 21.7 22.2 45.441–50 11.0 10.0 10.9 16.7 9.151–60 27.6 38.6 17.4 22.2 9.1≥61 6.2 10.0 2.2 5.6 0.0Missing 16.6 11.4 23.9 22.2 9.1
RaceWhitea∗ 66.9 84.3 37.0 66.7 81.8African Americana 11.7 1.4 26.1 22.1 0.0Latinob 8.3 5.8 17.4 0.0 0.0Other 2.8 1.4 2.1 5.6 9.1Missing 10.3 7.1 17.4 5.6 9.1
Agency typePublica 61.4 41.4 80.4 77.8 81.8Privatea 21.4 38.6 4.4 5.6 9.1Missing 17.2 20.0 15.2 16.7 9.1
Position 100.1Child welfare
workerb62.1 51.4 65.2 77.8 90.9
Supervisor 18.6 25.7 15.2 11.1 0.0Missing 19.3 22.9 19.6 11.1 9.1
EducationBachelor of social
work12.4 8.8 10.9 27.7 18.2
Bachelor’sdegree: othera
22.8 11.4 41.3 16.7 27.2
Master of socialworkc
22.8 30.0 6.5 38.8 18.2
Master’s degree:otherc
20.6 32.8 10.9 5.6 9.1
Otherb 12.4 11.4 15.2 5.6 18.2Missing 9.0 5.6 15.2 5.6 9.1
Years in child welfare work0–5b 25.5 21.4 37.0 16.7 18.26–10b 28.3 27.1 19.6 33.3 63.611–20b 20 24.4 10.8 38.8 0.0≥21 15.9 21.4 13 5.6 9.1Missing 10.3 5.7 19.6 5.6 9.1
No. of SAFE evaluations completed or reviewed3–5b 13.8 8.6 26.1 0.0 18.26–10 25.5 31.4 26.1 5.6 18.211–20b 26.2 20.0 28.3 38.8 36.3≥21c 21.4 21.4 13 55.6 0.0Missing 13.1 18.6 6.5 0.0 27.3
Note. ap <.001; bp <.05; cp <.01 (using listwise deletion).∗p <.05 (using multiple imputation).
Dow
nloa
ded
by [
Ast
on U
nive
rsity
] at
00:
13 0
6 O
ctob
er 2
014
88 T. M. Crea et al.
TABLE 2 Percieved Benefits of SAFE Versus Conventional Methods (χ2)
N = SAFE: Greater Conventional:145 Benefits (%) Greater Benefits (%)
Professional practice (α = .88)Efficient (provides excellent information
in minimal time)142 56.3 43.7
Comprehensive (includes information tomake an informed decision)a∗
143 67.8 32.2
Promotes productivity (helps in workingmore efficiently)
134 50.0 50.0
Promotes professionalism (consistentwith good practice skills)a
141 69.5 30.5
Concise (nothing unnecessary; allrequired information is relevant)b
140 62.9 37.1
Worker-friendly (easy to complete) 139 43.2 56.8Represents best practice (most effective
method available)b137 63.5 36.5
Facilitates concurrent planning (useful inreunification/other permanentplanning)c
135 60.7 39.3
Minimizes cross-jurisdictional barriers(adoptions easier acrossstates/counties)a∗
136 72.1 27.9
MEAN (SD) SUBSCALE SCORE (0–9)a 145 5.22 (3.11)Parent retention (α = .78)
Culturally transparent (fair andappropriate across ethnicities)∗
135 56.3 43.7
Promotes open communication (easy todiscuss concerns with applicants)
138 58.0 42.0
Parent-friendly (forms are easy tonavigate and complete)
140 52.9 47.1
Fair (applicants are assured fullparticipation and openness)a∗
135 65.9 34.1
MEAN (SD) SUBSCALE SCORE (0–4) 143 2.23 (1.51)Parent selection (α = .88)
Promotes accurate assessments (able toproduce accurate assessments)a∗
136 68.4 31.6
Encourages candidness about past (morecandidness about past behaviors)c∗
136 60.3 39.7
Encourages candidness about present(more candidness about presentbehaviors)∗
136 57.4 42.6
Meaningful (promotes in-depthunderstanding of strengths and issuesof concern)a∗
138 67.4 32.6
MEAN (SD) SUBSCALE SCORE (0–4)a 139 2.49 (1.63)Overall internal consistency, α = .94
MEAN (SD) SCORE (0–17)a 145 9.81 (5.88)
Note. ap <.001; bp <.01; cp <.05.∗p <.05 (using multiple imputation).
Dow
nloa
ded
by [
Ast
on U
nive
rsity
] at
00:
13 0
6 O
ctob
er 2
014
Structured Home Studies 89
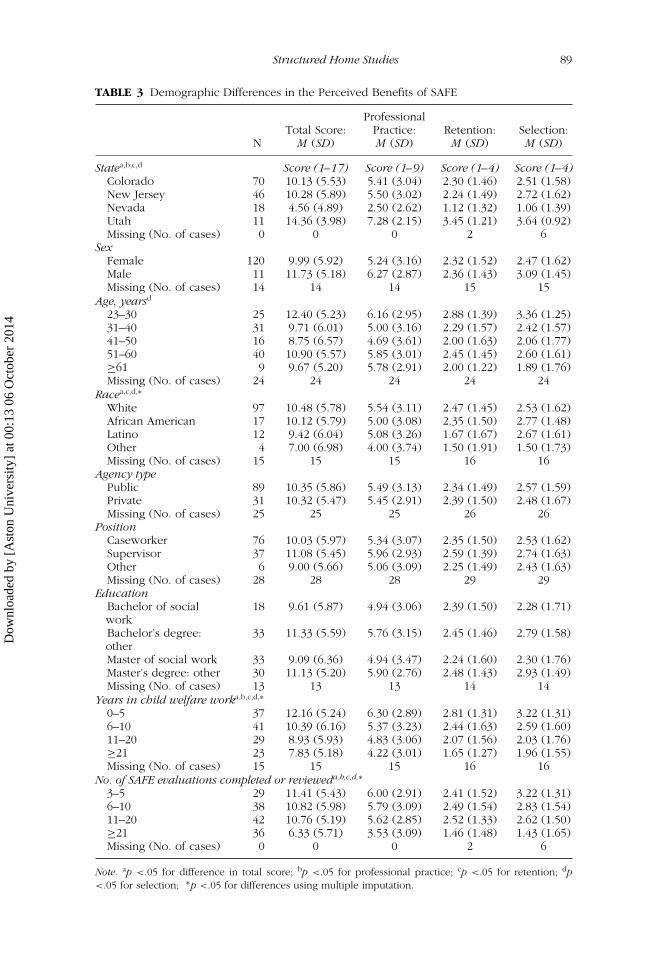
TABLE 3 Demographic Differences in the Perceived Benefits of SAFE
ProfessionalTotal Score: Practice: Retention: Selection:
N M (SD) M (SD) M (SD) M (SD)
Statea,b,c,d Score (1–17) Score (1–9) Score (1–4) Score (1–4)Colorado 70 10.13 (5.53) 5.41 (3.04) 2.30 (1.46) 2.51 (1.58)New Jersey 46 10.28 (5.89) 5.50 (3.02) 2.24 (1.49) 2.72 (1.62)Nevada 18 4.56 (4.89) 2.50 (2.62) 1.12 (1.32) 1.06 (1.39)Utah 11 14.36 (3.98) 7.28 (2.15) 3.45 (1.21) 3.64 (0.92)Missing (No. of cases) 0 0 0 2 6
SexFemale 120 9.99 (5.92) 5.24 (3.16) 2.32 (1.52) 2.47 (1.62)Male 11 11.73 (5.18) 6.27 (2.87) 2.36 (1.43) 3.09 (1.45)Missing (No. of cases) 14 14 14 15 15
Age, yearsd
23–30 25 12.40 (5.23) 6.16 (2.95) 2.88 (1.39) 3.36 (1.25)31–40 31 9.71 (6.01) 5.00 (3.16) 2.29 (1.57) 2.42 (1.57)41–50 16 8.75 (6.57) 4.69 (3.61) 2.00 (1.63) 2.06 (1.77)51–60 40 10.90 (5.57) 5.85 (3.01) 2.45 (1.45) 2.60 (1.61)≥61 9 9.67 (5.20) 5.78 (2.91) 2.00 (1.22) 1.89 (1.76)Missing (No. of cases) 24 24 24 24 24
Racea,c,d,∗
White 97 10.48 (5.78) 5.54 (3.11) 2.47 (1.45) 2.53 (1.62)African American 17 10.12 (5.79) 5.00 (3.08) 2.35 (1.50) 2.77 (1.48)Latino 12 9.42 (6.04) 5.08 (3.26) 1.67 (1.67) 2.67 (1.61)Other 4 7.00 (6.98) 4.00 (3.74) 1.50 (1.91) 1.50 (1.73)Missing (No. of cases) 15 15 15 16 16
Agency typePublic 89 10.35 (5.86) 5.49 (3.13) 2.34 (1.49) 2.57 (1.59)Private 31 10.32 (5.47) 5.45 (2.91) 2.39 (1.50) 2.48 (1.67)Missing (No. of cases) 25 25 25 26 26
PositionCaseworker 76 10.03 (5.97) 5.34 (3.07) 2.35 (1.50) 2.53 (1.62)Supervisor 37 11.08 (5.45) 5.96 (2.93) 2.59 (1.39) 2.74 (1.63)Other 6 9.00 (5.66) 5.06 (3.09) 2.25 (1.49) 2.43 (1.63)Missing (No. of cases) 28 28 28 29 29
EducationBachelor of socialwork
18 9.61 (5.87) 4.94 (3.06) 2.39 (1.50) 2.28 (1.71)
Bachelor’s degree:other
33 11.33 (5.59) 5.76 (3.15) 2.45 (1.46) 2.79 (1.58)
Master of social work 33 9.09 (6.36) 4.94 (3.47) 2.24 (1.60) 2.30 (1.76)Master’s degree: other 30 11.13 (5.20) 5.90 (2.76) 2.48 (1.43) 2.93 (1.49)Missing (No. of cases) 13 13 13 14 14
Years in child welfare worka,b,c,d,∗
0–5 37 12.16 (5.24) 6.30 (2.89) 2.81 (1.31) 3.22 (1.31)6–10 41 10.39 (6.16) 5.37 (3.23) 2.44 (1.63) 2.59 (1.60)11–20 29 8.93 (5.93) 4.83 (3.06) 2.07 (1.56) 2.03 (1.76)≥21 23 7.83 (5.18) 4.22 (3.01) 1.65 (1.27) 1.96 (1.55)Missing (No. of cases) 15 15 15 16 16
No. of SAFE evaluations completed or revieweda,b,c,d,∗
3–5 29 11.41 (5.43) 6.00 (2.91) 2.41 (1.52) 3.22 (1.31)6–10 38 10.82 (5.98) 5.79 (3.09) 2.49 (1.54) 2.83 (1.54)11–20 42 10.76 (5.19) 5.62 (2.85) 2.52 (1.33) 2.62 (1.50)≥21 36 6.33 (5.71) 3.53 (3.09) 1.46 (1.48) 1.43 (1.65)Missing (No. of cases) 0 0 0 2 6
Note. ap <.05 for difference in total score; bp <.05 for professional practice; cp <.05 for retention; dp<.05 for selection; ∗p <.05 for differences using multiple imputation.
Dow
nloa
ded
by [
Ast
on U
nive
rsity
] at
00:
13 0
6 O
ctob
er 2
014
90 T. M. Crea et al.
conventional assessment methods.” (2) “Please provide additional commentsabout the benefits of using SAFE versus conventional assessment methods.”(3) “Please add other comments that would add to our understanding ofhow SAFE works.” Participant responses were transferred into text form andthen imported into ATLAS.ti version 5.0. Based on their content, responses(n = 138 discrete comments) were then classified within 25 codes. Primaryand secondary codes were assigned to each comment by one researcher,and these codes were then reviewed by three other researchers. There were226 codes used in all, as some responses were multiply coded.
To ensure that selected quotations were reasonably representative, weanalyzed the frequency of codes and the use of quotations described bythose codes. Nine codes were rated as the most frequently used codes (142total uses); each of these codes was applied as the primary code to sevenof the quotes used in this article. The remaining 16 codes were used lessoften (84 times in all) and were supported by five of the quotes used inthis discussion. Thus, the preponderance of quotes came from the mostused codes. The number of codes applied and the frequency of their use isprovided in parentheses following each quote.
RESULTS
Of the 145 cases across sites, a large percentage of variables had missinginformation. Follow-up analyses showed that most of these respondentsdropped out of the survey soon after beginning. There was no statisti-cally significant pattern of dropping out across the four states, such thatthese missing cases appear to be missing at random (MAR). Among com-pleted questionnaires, results of chi-square tests showed no sex differencesacross sites and no differences in age categories (Table 1). Racial differ-ences emerged: White respondents ranged from 37.0% in New Jersey to81.8% in Utah (p < .001; MI, p < .05); African American respondents rangedfrom 0% in Utah to 26.1% in New Jersey (p < .001; MI, n.s.); and Latinorespondents ranged from 0% in Nevada and Utah to 17.4% in New Jer-sey (p < .05; MI, n.s.). Cross-state differences also emerged for agencytype, with more public agency employees in New Jersey, Nevada, andUtah and an approximately even division of public and private agencyemployees in Colorado (p < .001; MI, n.s.; many adoptions in Coloradooccur through private child-placing agencies that contract with the state).Using MI, these differences showed p values of .09. More workers re-sponded to the survey than did supervisors in all four states (p < .05;MI, n.s.). Education levels of respondents also varied across states. BothColorado and Nevada had a higher percentage of respondents with a mas-ter’s degree in social work (p < .01; MI, n.s.), and Colorado had a higherpercentage of respondents with a master’s-level degree in an area other than
Dow
nloa
ded
by [
Ast
on U
nive
rsity
] at
00:
13 0
6 O
ctob
er 2
014
Structured Home Studies 91
social work (p < .01; MI, n.s.) than did the other states. Collectively, Coloradorespondents reported the highest educational attainment.
The distribution of years’ experience in child welfare was similar acrossstates with the exception of staff categorized as having 0 to 5 years expe-rience; respondents reporting this experience level ranged from a low of16.7% in Nevada to a high of 37.0% in New Jersey (p < .05; MI, n.s.). Re-spondents differed significantly in the number of SAFE home studies theyhad completed (if they were caseworkers) or reviewed (if they were su-pervisors; p < .05; MI, n.s.). In general, respondents in Colorado and NewJersey tended to have less experience with conducting or reviewing SAFEevaluations, whereas respondents in Nevada reported the most experiencewith the SAFE home study.
The next analyses measured respondents’ overall preferences for theSAFE method and their preference within the domains of professional prac-tice, parent retention, and parent selection (Table 2). The internal consistencyof the overall scale was found to be highly reliable (α = .94), but was some-what lower for professional practice (α = .88), parent retention (α = .78),and parent selection (α = .88). We conducted two rounds of analyses, firstusing nonparametric chi-square tests using listwise deletion, and then con-ducting chi-square tests using MI. Respondents generally favored the SAFEhome study methodology, although there was modest variation on subscalesand by type of respondent. Within the area of professional practice, respon-dents were more likely to report that they perceived SAFE as being morecomprehensive (p < .001; MI, p < .001) and concise (p < .01; MI, p =.63.) than conventional methods. Respondents also reported perceiving thatSAFE promoted increased professionalism (p < .001; MI, p = .15.), promotedconcurrent planning (p < .05; MI, p = .35.), minimized cross-jurisdictionalbarriers more effectively (p < .001; MI, p < .05), and represented best prac-tice (p < .01; MI, p = .27). The professional practice subscale showed amean score of 5.22 out of a possible 9.00 (p < .001; MI not used becausethere were no missing cases for the subscale score). When asked aboutparent retention, respondents reported perceiving that SAFE was more equi-table (p <.001; MI, p < .05) and culturally transparent (listwise, p = .14; MI,p < .05) compared with conventional methods. Respondents also indicatedthat parent selection was aided by SAFE because it promoted more accurateassessments (p < .001; MI, p < .05), encouraged greater candor about theapplicant’s past (p < .05; MI, p < .05) and present (listwise, p = .09; MI,p < .05), and provided information that was more meaningful (p < .001; MI,p < .05). The parent selection subscale showed a mean score of 2.49 outof a possible 4.00 (p < .001; MI, p < .05). It is noteworthy that none of thestatistically significant findings favored conventional methods over the SAFEmethodology.
Respondents’ preferences varied by the level of the respondent’s ex-perience (see Table 3). Respondents from the four sampled states differed
Dow
nloa
ded
by [
Ast
on U
nive
rsity
] at
00:
13 0
6 O
ctob
er 2
014
92 T. M. Crea et al.
significantly regarding professionalism (p < .05; MI, p = .86) and parentretention (p < .05; MI, p = .62) and selection (p < .05; MI, p = .95). Youngerrespondents tended to prefer SAFE in the parent selection subscale (p < .05;MI, p = .56). Racial differences also emerged across the full scales and sub-scales (listwise, n.s.; MI, p < .05). Opinions over SAFE’s greater retentionabilities also differed by years of experience (p < .05; MI, p < .05), withless experienced workers more frequently stating a preference for the SAFEapproach. In addition, workers with fewer completed studies preferred SAFEfor the overall scale and each subscale (p < .05; MI, p < .05).
SAFE Qualitative Analysis Results
We constructed a logistic regression model to predict the likelihood of re-spondents’ completing open-ended responses. Results indicated that respon-dents who had completed more SAFE evaluations, as well as workers fromColorado, were more likely to comment (p < .01). The following qualitativeanalysis should be interpreted with consideration for these potential biases.
Qualitative analyses found support both for and against the use of SAFE,as the respondents understood the program. Positive responses focused onthe structure of questionnaires and the consistency across studies inherentwhen using a standardized instrument. However, some respondents per-ceived this standardization and structure to be detrimental to the home studyprocess. In some cases, it appeared that respondents disagreed with a com-ponent of SAFE that was, in actuality, a misuse of the SAFE method. Forthese circumstances, we have identified this incongruity at the end of thecorresponding section. Aside from this problem, the skills and abilities of theindividuals completing the home studies were important issues emphasizedby several respondents.
Structure and Standardization
Some respondents considered SAFE’s structure a positive characteristic and astrength of the method, whereas others considered it a weakness. For some,this structured approach promoted greater consistency across studies andprovided a useful method for bringing up sensitive topics for discussion.(As previously mentioned, the number of codes applied to each of therespondent quotes presented in this discussion and the frequency of theiruse is provided in parentheses following each quote.)
[The] SAFE process allows [the] worker to access or open for discussionthat information which the applicants may be more uncomfortable or un-willing to discuss. . . . The individual multiple choice questions in a SAFEhome study flag things more [frequently] than a conventional assessment
Dow
nloa
ded
by [
Ast
on U
nive
rsity
] at
00:
13 0
6 O
ctob
er 2
014
Structured Home Studies 93
does. SAFE requires you to be more specific than a conventional study.(3; 23)
Respondents who provided a positive opinion of SAFE generally indi-cated that the structured approach contributed to a home study that was morethorough, less subjective, and nonjudgmental as compared to conventionalmethods. One respondent stated the following:
SAFE appears to be a sound instrument that provides an excellent guidefor the evaluator to conduct an appropriate, consistent evaluation of afamily. I have found that with more conventional home studies theretends to be no clear guidelines for careful family evaluation, and theytherefore can easily lead to an overall inconsistency, often because of theabsence of any sound instrument for family assessment. (2; 19)
Another respondent wrote the following:
I think the SAFE home study takes more time and work for the workers,but I still think that it is a better, less subjective, more comprehensiveprocess than a conventional home study. I would not want to switchback to the conventional home study. (1; 7)
The increased consistency in home studies across state lines was notedas an additional benefit of the structure and standardization of the SAFEmethod. Yet, some workers also acknowledged that the application of theSAFE approach varies within areas of the same state:
The benefits are that the studies are standardized and can easily beunderstood across state lines, although we have found that even withinthe same state, the use of the SAFE varies . . . (2; 19)
Respondents generally preferred SAFE, as measured by the quantitativedata, and many noted considerable benefits of the SAFE structured approachin their open-ended responses; however, many respondents offered critiquesof SAFE. One critique indicated that the structured approach has the poten-tial to make families feel judged and may leave the worker feeling as ifshe or he is “a teacher administering a test.” Other comments indicated thatthe answer options are limited and do not capture all possible responses,that questionnaire items could be confusing and open to individual inter-pretation, and that SAFE made it difficult to target specifics related to familyrelationships and child care philosophies that come through more easily withconventional methods of interviewing. Some of these comments appear toreflect improper use of the SAFE methodology; according to SAFE trainingprotocols, practitioners are specifically instructed to avoid using the ques-tionnaire checklists in a rote fashion. Rather, the SAFE guidelines encourage
Dow
nloa
ded
by [
Ast
on U
nive
rsity
] at
00:
13 0
6 O
ctob
er 2
014
94 T. M. Crea et al.
practitioners to use the questionnaires as a springboard to explore issues ofconcern as they emerge.
Although most respondents indicated that SAFE questionnaire items cov-ered multiple topics important to family evaluation, some agencies havecreated supplemental questionnaires. However, respondents did not specifythe types of information collected in these supplemental questionnaires. Itis possible that some agencies, such as those with a religious affiliation, willask additional questions regarding applicants’ beliefs and practices.
Some respondents noted their perceptions of repetition and redundancyin SAFE:
SAFE also seems inefficient (compared to a conventional study) becausethere is still quite a bit of repetition from the first part of the study (beforerating page) to the latter half of the report. (2; 24)
However, as one respondent noted, this repetition could be seen as apositive in that it does not allow the practitioner to exclude any information:
The only complaint I have is [that] you seem to answer the same questionsa lot in the different areas. [I] feel like I repeat myself a lot, but it definitelydoesn’t let you miss anything. After you do a few, it gets easier; [it] justtakes a long time to type it all. (2; 19)
Another key critique pointed to the importance of the autobiography,commonly included in conventional home studies but not included in theSAFE method. Several respondents indicated that they thought that the ap-plicants’ autobiographies provided needed insight into the individual. Onecaseworker commented as follows:
I know that the concern is that families don’t like to write, but I haven’tfound that to be true, and even the briefest written answers to an au-tobiographical questionnaire can prove very helpful. If nothing else, itencourages a person to think about what they want to say and not justcheck off boxes. I do not find that families write glowing or narcissisticbiographies of themselves, and in fact this provides them with an ex-tra tool for their own soul searching about the adoption commitment. Iwould like to see the use of both tools. (1; 16)
Among those who included comments regarding applicants’ autobiogra-phies, 4 of the 16 workers indicated that they continue to require that familiescomplete an autobiography as a means for obtaining specific information andenhancing their insight into the applicants.
Regardless of the respondent’s expressed perceptions of SAFE, severalrespondents mentioned the importance of interviewing skills. Although manyexperienced practitioners acknowledged that the SAFE method would be
Dow
nloa
ded
by [
Ast
on U
nive
rsity
] at
00:
13 0
6 O
ctob
er 2
014

Structured Home Studies 95
helpful to less experienced workers when conducting home studies, theexperienced practitioners often perceived the SAFE format as a hindrance:
If a social worker does a conventional home study correctly and thor-oughly, there is virtually no difference in the quality of the report or inhow well a SAFE versus conventional study can assess a family. (1; 30)
The SAFE questionnaires help to shorten interview time, but it is thequality and techniques of interviewing that really get to the core issuesof family dynamics and interactions. (2; 47)
Although this last comment was likely intended as a critique of the SAFEmethod, in fact the comment restates one of the core practice values of SAFE:that the quality of the home study will ultimately depend on the depth ofunderstanding a practitioner is able to gain regarding a family’s situation andoverall functioning.
DISCUSSION
The quantitative survey results seem to offer an endorsement of SAFE, as re-spondents preferred SAFE over conventional methods on multiple indicators.Respondents reported that SAFE promoted a greater sense of professionalpractice, and many indicated that they perceived SAFE to be a more thor-ough and more equitable method of conducting home study assessments.In addition, respondents said that use of SAFE minimized jurisdictional bar-riers and facilitated concurrent planning (Table 2). However, we observedsignificant differences in respondents’ opinions of SAFE delineated by demo-graphic characteristics (Table 3). Respondents with less experience tended toprefer SAFE. This finding is consistent with prior research (DePanfilis, 1996)showing that more experienced workers were less supportive of the im-plementation of innovations that involved providing structure to previouslyunstructured practices.
Data gleaned from open-ended responses revealed that some amongthe professionals with greater experience preferred particular componentsof conventional home study practice, such as autobiographies, and keenlyfelt their absence in the SAFE method. In addition, these experienced workerswere also more likely to express the opinion that the quality of an evaluationwas primarily dependent on the quality of an individual caseworker’s perfor-mance. Some respondents perceived SAFE’s structure as too limited for work-ers and families. Furthermore, in contrast with our quantitative results, someworkers reported that they regarded SAFE as overly repetitive and redundantto the extent that they viewed the process as time-consuming and inefficient.
A number of scenarios may help explain the apparent discrepancy be-tween our quantitative and qualitative findings. Workers lacking experience
Dow
nloa
ded
by [
Ast
on U
nive
rsity
] at
00:
13 0
6 O
ctob
er 2
014
96 T. M. Crea et al.
and formal training appear to appreciate SAFE’s increased structure, possiblybecause SAFE provides a clear format for pursuing a thorough family evalua-tion. The criticisms that SAFE hinders the discretion of professionals and thatfamilies may find the process threatening corroborate Chapman and Zwieg’s(2005) conclusions regarding the potential negative reactions of practitionerstoward increased structure. Overall, however, respondents in the full samplegenerally agreed that SAFE promotes more professional practice and moreobjective evaluations of families; in other words, SAFE was perceived to bemore a more valid process than conventional, unstructured methods.
Other reasons may exist for the discrepancy in our quantitative andqualitative findings. Based on our logistic regression model, the written com-ments may not represent the sentiments of our full sample. Second, someevidence suggests that quantitative surveys tend to capture higher levels ofsatisfaction in general, while qualitative assessments are more likely to reveallower levels of satisfaction (Williams, 1994). Thus, despite an overall prefer-ence for SAFE as a home study method, the open-ended responses triggeredsome respondents to mention specific preferences for conventional methodsbased on their personal experience (Williams, Coyle, & Healy, 1998).
Limitations
Comparisons between methodologies are best done with random assignmentto condition so that the characteristics of the participants assigned to eachmethod have an unbiased relationship with their use of the method. Byasking individuals to compare their experiences with using two methods, thestudy also controls for individual differences. Nonetheless, the method usedto compare SAFE and conventional home studies allows for other threats tothe findings. Respondents are unlikely to have had equivalent exposure tothe array of conventional methods and the SAFE methodology. Furthermore,conventional methods often differ depending on the primary role of therespondent as an adoption, foster care, or kinship care worker; our analysesdo not control for these variations. Although completion of a minimumnumber of SAFE home studies was required for participation, experiencewith this method varied considerably and the satisfaction with SAFE couldbe sensitive to familiarity with the method. In addition, because SAFE isthe current method used in the participating agencies, this study relied onrespondents’ memory of conventional methods. Cognitive consistency effectsmight have operated and made experiences that were more recent eithermore or less favorable to achieve consistency between an individual’s currentactions and beliefs about the value of those actions or their nostalgia for pastmethods that are no longer used.
Importantly, some of the discrepancies between analyses using list-wise deletion and those using MI methods lend additional caution to the
Dow
nloa
ded
by [
Ast
on U
nive
rsity
] at
00:
13 0
6 O
ctob
er 2
014
Structured Home Studies 97
interpretation of our results. Also, the response rate (between 21.9% and33.1%) is low, but fairly typical of many Web-based surveys the responserates of which can range from 10.6% (Cole, 2005) to 41.8% (Converse,Wolfe, Huang, & Oswald, 2008). Our study confirms the majority of re-search showing lower response rates in Web-based surveys compared withmail-based or mixed approaches (Converse et al., 2008) and research show-ing a higher percentage of missing items in Web-based surveys comparedwith other formats (Cole, 2005). Finally, the relatively small sample size limitsour ability to generalize these findings to the larger child welfare practicecontext.
CONCLUSION
As the first empirical exploration of home study methods in many years, thisstudy is a first step in understanding how increased structure may improvehome study decision making processes in adoption, foster care, and kincare. The overall preference for SAFE among workers and supervisors in thissample is an encouraging indicator of the potential strength of this method.Yet, from a practice perspective, the challenge of integrating the advantagesof increased structure within the realm of clinical decision making endures.This challenge is especially relevant for practitioners with greater experi-ence who tend to prefer the conventional methods of using an unstructuredapproach.
Further research is needed regarding the implementation of the SAFEmethodology in practice. In the long term, the relationship between usingSAFE and the fairness and effectiveness of the recruitment, screening, andadoption placement process is of central importance. Further research is alsoneeded to examine particular challenges faced by practitioners implement-ing SAFE as prescribed by the developers (i.e., close adherence to the statedpractice values). In addition, providing practitioners with a better under-standing of what information from SAFE triggers an approval or disapprovalwould also help clarify its screening function. Longitudinal research compar-ing the placement rates for families involved with SAFE and conventionalhome studies will help to determine whether this approach is as welcomedby families as the respondents to this survey suggest. One of the great advan-tages of this methodology is that SAFE offers the opportunity to study andimprove the quality and reliability of home studies. Findings from researchon SAFE may point the way to improving all methods of resource familyevaluation.
REFERENCES
Acock, A. C. (2005). Working with missing values. Journal of Marriage and Family,67, 1012–1028.
Dow
nloa
ded
by [
Ast
on U
nive
rsity
] at
00:
13 0
6 O
ctob
er 2
014

98 T. M. Crea et al.
Allphin, S., Simmons, B., & Barth, R. P. (2001). Adoption of foster children: Howmuch does it cost public agencies? Children and Youth Services Review, 23,45–68.
Baird, C., & Wagner, D. (2000). The relative validity of actuarial- and consensus-based risk assessment systems. Children and Youth Services Review, 22(11/12),839–871.
Campion, M. A., Palmer, D. K., & Campion, J. E. (1997). A review of structure in theselection interview. Personnel Psychology, 50, 655–702.
Chapman, D. S., & Zweig, D. I. (2005). Developing a nomological network forinterview structure: Antecedents and consequences of the structured selectioninterview. Personnel Psychology, 58, 673–702.
Cole, S. T. (2005). Comparing mail and Web-based survey distribution methods:Results of surveys to leisure travel retailers. Journal of Travel Research, 43,422–430.
Consortium for Children. (n.d.) The SAFE home study. Retrieved January 8, 2008,from http://www.safehomestudy.org/.
Converse, P. D., Wolfe, E. W., Huang, X., & Oswald, F. L. (2008). Response rates formixed-mode surveys using mail and e-mail/Web. American Journal of Evalua-tion, 29(1), 99–107.
Crea, T. M., Barth, R. P., & Chintapalli, L. K. (2007). Home study methods for evalu-ating prospective resource families: History, current challenges, and promisingapproaches. Child Welfare, 86, 141–157.
DePanfilis, D. (1996). Implementing child mistreatment risk assessment systems:Lessons from theory. Administration in Social Work, 20(2), 41–59.
DePanfilis, D., & Girvin, H. (2005). Investigating child maltreatment in out-of-homecare: Barriers to effective decision-making. Children and Youth Services Review,27, 353–374.
Freitag, R. (2007, May). The relationship between structured tools and profes-sional judgment. SDM News. Retrieved August 31, 2007, from http://www.nccd-crc.org/crc/pubs/sdm news may07.pdf.
Freundlich, M., Heffernan, M., & Jacobs, J. (2004). Interjurisdictional placement ofchildren in foster care. Child Welfare, 83, 5–26.
Gambrill, E., & Shlonsky, A. (2000). Risk assessment in context. Children and YouthServices Review, 22, 813–837.
Lievens, F., Highhouse, S., & De Corte, W. (2005). The importance of traits and abil-ities in supervisors’ hirability decisions as a function of method of assessment.Journal of Occupational and Organizational Psychology, 78, 453–470.
Rossi, P. H., Schuermann, J., & Budde, S. (1999). Understanding decisions aboutchild maltreatment. Evaluation Review, 23, 579–598.
Shlonsky, A., & Wagner, D. (2005). The next step: Integrating actuarial risk assess-ment and clinical judgment into an evidence-based practice framework in CPScase management. Children and Youth Services Review, 27, 409–427.
Van Der Heijden, P. G. M., van Gils, G., Bouts, J., & Hox, J. J. (2000). A comparison ofrandomized response, computer-assisted self-interview, and face-to-face directquestioning. Sociological Methods & Research, 28, 505–537.
Wald, M. S., & Woolverton, M. (1990). Risk assessment: The emperor’s new clothes?Child Welfare, 69, 483–512.
Dow
nloa
ded
by [
Ast
on U
nive
rsity
] at
00:
13 0
6 O
ctob
er 2
014
Structured Home Studies 99
Williams, B. (1994). Patient satisfaction: A valid concept? Social Science & Medicine,38, 509–516.
Williams, B., Coyle, J., & Healy, D. (1998). The meaning of patient satisfaction: Anexplanation of high reported levels. Social Science & Medicine, 47, 1351–1359.
Yuan, Y. C. (2000). Multiple imputation for missing data: Concepts and new de-velopment. In Proceedings of the 25th Annual SAS Users Group InternationalConference. SAS Institute, Paper No. 267.
Dow
nloa
ded
by [
Ast
on U
nive
rsity
] at
00:
13 0
6 O
ctob
er 2
014