Embed Size (px)
Citation preview

Freddie Mac STACR 101
March 2018

© Freddie Mac 2
Disclaimer
Notice to all Investors:
This presentation (“Presentation”) is not an offer to sell any Freddie Mac securities. Offers for any given security are made only through applicable offering circulars and any related supplements, which
incorporate Freddie Mac's Annual Report on Form 10-K for the year ended December 31, 2017, filed with the SEC on February 15, 2018, and all documents that Freddie Mac files with the SEC pursuant to
Section 13(a), 13(c) or 14 of the Exchange Act, excluding any information "furnished" to the SEC on Form 8-K. Content in this Presentation is not reflective of current markets/spreads and is not indicative of
any future Freddie Mac offerings. Please use this Presentation for informational purposes only.
Notice to United Kingdom Investors:
This Presentation is only being distributed to and is directed at: (a) investment professionals falling within Article 19 of the Financial Services and Markets Act 2000 (Financial Promotion) Order 2005 (the
"FPO"); (b) high net worth entities falling within Article 49 of the FPO; and (c) other persons in respect of whom exemptions under the FPO are available. The investments to which this Presentation relates are
available only to, and any agreement to acquire such investments, will be made only with, such persons. Any other person should not act or rely on this Presentation or any of its contents.
This Presentation is not intended to be an offer of transferable securities to the public in the United Kingdom or any European Union jurisdiction, in accordance with the Prospectus Directive (2003/71/EC, as
amended). In any event, this Presentation is made available only in circumstances in which a prospectus requirement under such Directive does not apply, including but not limited to the distribution of this
Presentation to qualified investors only.
Notice to Canadian Investors:
This Presentation is confidential and may not be reproduced or transferred, in whole or in part, to any other party that is not an employee, officer, director, or authorized agent of the recipient without the
express written consent of Freddie Mac. Each person accepting these materials agrees to return them promptly upon request.
The material provided herein is for informational purposes only and delivered solely as reference material with respect to Freddie Mac. The Presentation does not constitute an offer to sell or a solicitation of an
offer to buy any securities of Freddie Mac. Any offering of securities of Freddie Mac will occur only in accordance with the terms and conditions set forth in an offering circular (“Offering Circular”). Investors are
strongly urged to carefully review the Offering Circular (including the risk factors described therein) and to discuss any prospective investment in Freddie Mac with their legal and tax advisers in order to make
an independent determination of the suitability and consequences of an investment.
No person has been authorized to give any information or to make any representation, warranty, statement or assurance not contained in the Offering Circular and, if given or made, such other information or
representation, warranty, statement or assurance must not be relied upon.
Prospective investors should inform themselves and take appropriate advice as to any applicable legal requirements and any applicable taxation and exchange control regulations in the countries of their
citizenship, residence or domicile which might be relevant to the subscription, purchase, holding, exchange, redemption or disposal of any securities of Freddie Mac.
Targets shown in this Presentation are objectives and should not be construed as providing any assurance or guarantee as to the results that may be realized in the future from investment in any asset or asset
class described in the Presentation. Please be advised that any targets shown in the Presentation are subject to change at any time and are current as of the date of this Presentation only. In addition, the
information contained herein includes observations and/or assumptions and involves significant elements of subjective judgment and analysis. No representations are made as to the accuracy of such
observations and assumptions and there can be no assurances that actual events will not differ materially from those assumed. In the event any of the assumptions used in the Presentation do not prove to be
true, results are likely to vary substantially from those discussed therein.
Notice to Spain Investors:
No action has been or will be taken by Freddie Mac that would permit a public offering of the STACR securities in Spain. Neither the STACR securities nor the offering have been or will be registered or
approved by the Spanish Securities Market Commission (Comisión Nacional del Mercado de Valores) and, therefore, no prospectus has been or will be registered or approved by the CNMV for the purposes of
this offering.
A prospective investor in securities of Freddie Mac must conduct its own independent review and due diligence to make its own assessment of the merits and risks of making an investment in,
perform its own legal, accounting and tax analysis and conclude that the investment in the securities of Freddie Mac (i) is fully consistent with the investor’s financial requirements and financial
condition, investment objectives and risk tolerance; (ii) complies and is fully consistent with all investment policies, guidelines and restrictions applicable to the investor; and (iii) is a fit, proper
and suitable investment for the investor.

© Freddie Mac 3
A Better Freddie Mac …and a better housing finance system
For families
...innovating to improve the liquidity, stability and
affordability of mortgage markets
For customers
...competing to earn their business
For investors
...producing attractive mortgage interest rate and credit risk investments
For taxpayers
...reducing their exposure to mortgage risks
“We now have a fully competitive company that is executing on its mission, protecting
taxpayers and helping to build a better housing finance system for the nation.”
Don Layton, CEO

© Freddie Mac 4
Agenda
1. Freddie Mac Overview 5
2. Credit Guarantee Business 15
3. Macro Economics 19
4. Risk Management Framework 24
5. Credit Risk Transfer (CRT) Overview 29
6. STACR Overview 35
7. STACR SPI Overview 45
8. Collateral Performance 51
9. Data Resources 59

© Freddie Mac 5
Freddie Mac Overview

© Freddie Mac 6
Freddie Mac’s Role in US Housing Finance

© Freddie Mac 7
▪ We continue to operate under the conservatorship that commenced on September 6, 2008, under the direction of the Federal Housing Finance Agency (FHFA) as our Conservator.
▪ FHFA as our Conservator:
» Assumed all powers of the Board, management and shareholders
» Has directed and will continue to direct certain of our business activities and strategies
» Delegated certain authority to our Board of Directors to oversee, and to management to conduct, day-to-day operations
▪ Our ability to access funds from the Treasury under the Purchase Agreement is critical to keeping us solvent.
▪ There is significant uncertainty as to whether or when we will emerge from conservatorship, as it has no specified termination date.
▪ Our future structure and role will be determined by the Administration and Congress, and it is possible, and perhaps likely, that there will be significant changes beyond the near term.
Conservatorship

© Freddie Mac 8
FHFA Strategic Plan – Fiscal Years 2018 - 2022
▪ On January 29, 2018, FHFA released the FHFA Strategic Plan: Fiscal Years 2018-2022,
which reflects the Agency’s priorities as regulator and conservator of Fannie Mae and
Freddie Mac (the Enterprises).
▪ FHFA’s Strategic Plan sets forth three goals for the Agency:
» Ensure safe and sound regulated entities
» Ensure liquidity, stability and access in housing finance
» Manage the enterprises’ ongoing conservatorships
▪ FHFA, acting as conservator and regulator, must follow the mandates assigned to it by
statute and oversee the missions assigned to the Enterprises by their charters until such
time as Congress revises those mandates and missions.

© Freddie Mac 9
▪ On August 17, 2012, the Conservator, acting on our behalf, and Treasury entered into a third
amendment to the Purchase Agreement.
▪ The principal changes include:
» Replacement of the fixed dividend rate with a net worth sweep dividend beginning in the
first quarter of 2013
» Accelerated wind-down of the retained portfolio
» Submission of annual risk management plan to Treasury
» Suspension of periodic commitment fee
Amended Purchase Agreement

© Freddie Mac 10
$71.3 $71.3
$91.0
$5.5 $5.0$10.9
$112.4
2008 - 2014 2015 2016 2017 Cumulative Total
Draw Requests from Treasury Dividend Payments to Treasury
Treasury Draw Requests and Dividend Payments
Treasury draw requests and dividend payments$ Billions
Note: Totals may not add due to rounding.
1
© Freddie Mac 11
▪ On December 21, 2017, the Conservator, acting on our behalf, ended into a Letter
Agreement with Treasury. The principal changes pursuant to the Letter Agreement are as
follows:
» The senior preferred stock dividend for the dividend period from October 1, 2017
through and including December 31, 2017 was reduced to $2.25 billion.
» The applicable Capital Reserve Amount from January 1, 2018 and thereafter will be
$3.0 billion, rather than zero as previously provided. If for any reason we were not to
pay our dividend requirement on the senior preferred stock in full in any future period,
the applicable Capital Reserve Amount would thereafter be zero.
» The liquidation preference of the senior preferred stock increased by $3.0 billion, to
$75.3 billion, on December 31, 2017.
2017 Letter Agreement

© Freddie Mac 12
2018 Conservatorship Scorecard
Strategic Goal Weight Scorecard Objective
Maintain 40%
Increase access to single-family mortgage credit for creditworthy borrowers, including underserved segments of the market.
Finalize post-crisis loss mitigation activities.
Continue to responsibly support the Neighborhood Stabilization Initiative.
Assess the current mortgage servicing business model and develop plans to support ongoing liquidity in the mortgage servicing market.
Single-Family Rental Strategies: continue to gather and report to FHFA information needed to inform policy decisions regarding single-
family rentals and assist FHFA in assessing single-family rental strategies.
Develop plans to further support liquidity in the multifamily workforce housing market and consider market cost differences.
Manage the dollar volume of new multifamily business to remain at or below $35 billion for each enterprise. (affordable and underserved
market segments are to be excluded from the $35 billion cap).
Reduce 30%
Single-family Credit Risk Transfers:
• Transfer a meaningful portion of credit risk on at least 90% of the UPB of newly acquired single-family mortgages in loan categories
targeted for risk transfer.
• Report to FHFA the actual amount of underlying mortgage credit risk transferred
Multifamily Credit Risk Transfers: Transfer a meaningful portion of credit risk on newly acquired mortgages, subject to FHFA target
adjustments as may be necessary to reflect market conditions and economic considerations.
Retained Portfolio: Execute FHFA-approved retained portfolio plans that meet, even under adverse conditions, the annual PSPA
requirements and the $250 billion PSPA cap by December 31, 2018.
Private Mortgage Insurer Eligibility Requirements (PMIERs 2.0): Evaluate existing PMIERs and whether changes or updates are
appropriate.
Build 30%
Common Securitization Platform (CSP) and Single Security Initiative:
• Continue working with FHFA, each other, and CSS to implement the Single Security Initiative on the CSP for both Enterprises.
• Focus on the functions necessary for current Enterprise single-family securitization activities; include the development of operational
and system capabilities necessary for CSP to facilitate the issuance and administration of a common, single security for the
enterprises; and allow for the integration of additional market participants in the future.
• Continue to work with each other and CSS to obtain and use input from the Single Security/CSP Industry Advisory Group.
• Work proactively with the industry to help market participants prepare for implementation of the Single Security Initiative.
Provide active support for Mortgage Data standardization initiatives.
Source: FHFA

© Freddie Mac 13
Market Presence
2006 2007 2008 2009 2010 2011 2012 2013 2014 2015 2016 2017
Enterprises &
Ginnie Mae44% 62% 95% 97% 96% 98% 99% 98% 95% 95% 97% 96%
Private Label 56% 38% 5% 3% 4% 2% 1% 2% 5% 5% 3% 4%
$2.0$1.9
$1.2
$1.7
$1.4$1.2
$1.7 $1.6
$1.0
$1.3$1.5
$1.4
2006 2007 2008 2009 2010 2011 2012 2013 2014 2015 2016 2017
Freddie Mac Fannie Mae Ginnie Mae Private Label
MBS Issuance Volume$ Trillions
Source: Inside MBS & ABS.

© Freddie Mac 14
Housing Market Support
Number of families Freddie Mac helped
to own or rent a home2
In Thousands
Number of single-family loan workouts3
In Thousands
388 413 650 739 820
515 606
677745
828
1,555
608
910937 663
2,458
1,627
2,237
2,4212,311
2013 2014 2015 2016 2017
Multifamily rental units Purchase borrowers Refinance borrowers
44
19 13 9 5
12
96 5 15
29
2521
1210
83
67
54
4345
168
120
94
6975
2013 2014 2015 2016 2017
Loan modifications⁵
Repayment plans⁵
Forbearance agreements⁵
Short sales and deed-in-lieu of foreclosure transactions⁵
Note: Totals may not add due to rounding.
Home Retention Actions
Foreclosure Alternatives
4
4
4
4

© Freddie Mac 15
Credit Guarantee Business

© Freddie Mac 16
$121
$135
$1,842
$1,827
$2,103
$2,207$2,251
$2,165$2,075
$1,956$1,915 $1,910 $1,942
$2,011$2,098
2006 2007 2008 2009 2010 2011 2012 2013 2014 2015 2016 2017 YTD 2018
$ Billions
Outstanding Freddie Mac Mortgage-Related Securities and Other Mortgage-Related Guarantees
Mortgage-Related Investments Portfolio (PCs, REMICs and Other Securitization Products)
Mortgage-Related Investments Portfolio (Non-Freddie Mac Mortgage-Related Securities & Mortgage Loans)
$1,977
Total Mortgage Portfolio
$256
*Data as of January 31, 2018.
Note: Totals may not add due to rounding.
$2,098
*

© Freddie Mac 17
Freddie Mac Share of PC/MBS IssuancesPercent (%)
Freddie Mac’s GSE Market Share
37%
38%
35% 35%
38%
41%
43%
41%
42%
2009 2010 2011 2012 2013 2014 2015 2016 2017
Source: Freddie Mac and Fannie Mae Monthly Volume Summaries.

© Freddie Mac 18
Single-family Financial Highlights and Key Metrics
Single-family segment earnings$ Millions
Credit guarantee portfolio$ Billions
New funding volume$ Billions
Guarantee fees charged on new acquisitions (bps)5
Serious delinquency rates
+4%
(73%) (74%) (75%)(71%)
(77%)
$46 $39 $45 $57 $57
$71$47 $28
$30 $41
$117
$86$73
$87$98
43 44 44 4236
4Q16 1Q17 2Q17 3Q17 4Q17
Purchase UPB Refinance UPB
$1,275 $1,317 $1,343 $1,377 $1,424
$480 $462 $441 $423 $405
$1,755 $1,779 $1,784 $1,800 $1,829
4Q16 1Q17 2Q17 3Q17 4Q17
Note: Totals may not add due to rounding.
(75%)(73%) (74%) (77%) (78%)
© Freddie Mac 19
Macro Economic Indicators

© Freddie Mac 20
Macro Economy and Consumer Debt(Quarterly as of 12/31/2017)
Source: Unemployment and GDP Data from economy.com. Consumer Debt from FRBNY Consumer Credit Panel/Equifax. Data as of 3Q 2017.
Consumer debt level is increasing Unemployment rate at lowest point in the last 18 years
Decline in Mortgage and HELOC delinquenciesStudent loan and Auto loan delinquencies are increasing
© Freddie Mac 21
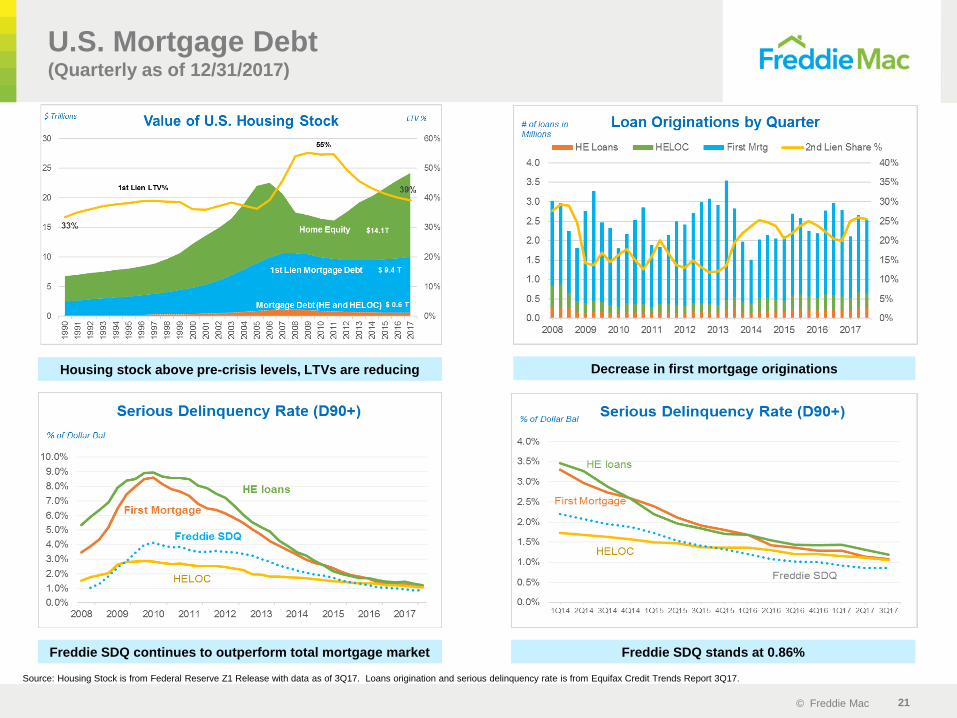
U.S. Mortgage Debt(Quarterly as of 12/31/2017)
Source: Housing Stock is from Federal Reserve Z1 Release with data as of 3Q17. Loans origination and serious delinquency rate is from Equifax Credit Trends Report 3Q17.
Decrease in first mortgage originationsHousing stock above pre-crisis levels, LTVs are reducing
Freddie SDQ continues to outperform total mortgage market Freddie SDQ stands at 0.86%

© Freddie Mac 22
Home Sales and Affordability(Quarterly as of 12/31/2017)
▪ Home Sales declined slightly in Q3 from Q2 and
inventory of homes available for sales remains low.
▪ Months supply of homes continues to be low as
compared to the peak.
▪ Interest rates remained below 4% in Q3. Housing
would remain affordable even if interest rate rose to
5% or 6%.
▪ Price-to-income ratio is trending upward since 2012.
Source: Home sales and affordability data from economy.com. Data as of 3Q 2017.

© Freddie Mac 23
Economic and Housing Market Outlook
Note: Quarterly and annual forecasts (or estimates) are shown in shaded areas; totals may not add due to rounding; annual forecast data are averages of quarterly values; annual historical
data is reported as Q4 over Q4.
a. Calculations based on quarterly averages of monthly index levels; index levels based on the seasonally-adjusted, all-urban consumer price index; reported as an annual rate.
b. Quarterly average of monthly unemployment rates (seasonally-adjusted); Quarterly average of monthly interest rates (not seasonally-adjusted); reported as an annual rate.
c. Millions of housing units; quarterly averages of monthly, seasonally-adjusted levels (reported at an annual rate).
d. Millions of housing units; total sales are the sum of new and existing detached single-family homes; quarterly averages of monthly, seasonally-adjusted levels (reported at an annual rate).
e. Quarterly growth rate of Freddie Mac's House Price Index; seasonally-adjusted; annual rates for yearly data.
f. Billions of dollars (not seasonally-adjusted).
g. Home Mortgage Disclosure Act for all single-family mortgages (not seasonally-adjusted); Annual share is dollar-weighted average of quarterly shares.
h. Federal Reserve Board; growth rate of residential mortgage debt, the sum of single-family and multifamily mortgages (not seasonally-adjusted, reported as Q4 over Q4).
Prepared by Office of the Economic & Housing Research group as of February 16, 2018; Send comments and questions to [email protected].
http://www.freddiemac.com/research/pdf/201802-Outlook.pdf
Major Economic Indicators
2016 2017 2018
Indicator Q1 Q2 Q3 Q4 Q1 Q2 Q3 Q4 Q1 Q2 Q3 Q4 2016 2017 2018 2019
Real GDP Growth (%) 0.6 2.2 2.8 1.8 1.2 3.1 3.2 2.6 2.9 3.1 2.5 2.3 1.8 2.5 2.7 2.1
Consumer Prices (%)a0.1 2.3 1.8 3.0 3.1 -0.3 2.0 3.7 2.1 2.2 2.3 2.4 1.8 2.1 2.2 2.3
Unemployment Rate (%)b4.9 4.9 4.9 4.7 4.7 4.4 4.3 4.1 4.0 4.0 3.9 3.8 4.9 4.4 3.9 4.0
30-Year Fixed Mtg. Rate (%)b3.7 3.6 3.5 3.8 4.2 4.0 3.9 3.9 4.3 4.5 4.6 4.9 3.7 4.0 4.6 5.1
5/1 Hybrid Treas. Indexed ARM Rate (%)b2.9 2.8 2.8 3.0 3.2 3.1 3.2 3.3 3.8 3.9 4.1 4.4 2.9 3.2 4.1 4.7
10-Year Const. Mat. Treas. Rate (%)b1.9 1.8 1.6 2.1 2.4 2.3 2.2 2.4 2.8 2.9 3.0 3.2 1.9 2.3 3.0 3.5
1-Year Const. Mat. Treas. Rate (%)b0.6 0.6 0.6 0.8 0.9 1.1 1.3 1.6 1.9 2.1 2.3 2.5 0.7 1.2 2.2 2.9
Housing and Mortgage Markets
Housing Startsc1.15 1.16 1.15 1.25 1.24 1.17 1.17 1.25 1.26 1.28 1.31 1.33 1.17 1.20 1.30 1.40
Total Home Sales (Incl. Condos)d5.88 6.04 5.97 6.11 6.24 6.17 5.97 6.25 6.15 6.31 6.37 6.45 6.01 6.12 6.35 6.45
FMHPI House Price Appreciation (%)e1.5 1.4 1.6 1.7 1.8 1.6 1.7 1.8 1.5 1.5 1.4 1.2 6.4 7.1 5.7 4.6
1-4 Family Mortgage Originationsf
Conventional ($) 305 421 474 451 290 369 388 377 258 381 385 316 1,651 1,423 1,339 1,372
FHA & VA ($) 95 113 134 132 107 106 112 101 77 114 115 94 474 427 401 408
Total ($) 400 534 608 583 397 475 500 478 335 495 500 410 2,125 1,850 1,740 1,780
Refinancing Share - Originations (%)g48 42 47 51 46 30 32 36 30 25 24 23 47 36 25 23
Residential Mortgage Debt (%)h1.1 3.3 4.1 3.5 2.8 3.6 4.1 4.3 4.4 4.6 4.8 4.9 3.0 3.7 4.7 5.2

© Freddie Mac 24
Risk Management Framework

© Freddie Mac 25
Mortgage Credit Risk Management
❖ Seller In-House Quality Control
❖ Seller Servicer Approval
Standards
❖ Loan Servicer Performance
Monitoring and Scorecard
❖ CORE Reviews
Underwriting Loan Quality ControlSeller / Servicer
Management
❖ Documentation Standards
and Credit Eligibility
Requirements
❖ Delegated Underwriting
Guidelines
❖ Seller Representations and
Warranties
❖ Post-Close Credit Review
❖ Quality Assurance
❖ Compliance Review
❖ Performing Loan Quality Control Review
❖ Non-Performing Loan Quality Control Review
❖ Underwriting Defects Repurchase Process
Optimized 3-pronged risk management infrastructure ensures high quality
loans and transparent data are passed on to credit risk investors.
▪ Following the crisis, 100% of the loans Freddie Mac purchases are required to have full documentation,
naturally constraining the type of pre-crisis fraud experienced during 2005-2008. We are prohibited from
purchasing loans where the borrower has no documented assets or income.
▪ Freddie Mac is also subject to and enforcing appraisal independence rules, which insulate the appraiser from
influence by other parties involved in processing or originating the loan.
▪ Data Enhancements: Expanded mortgage data collection, with enhanced quality and standardization enables
Freddie Mac to identify anomalous activity more quickly and effectively.
Credit Risk Management Toolset
Post-Crisis
Enhancements

© Freddie Mac 26
Credit Policy & Underwriting Standards
▪ Freddie Mac’s automated underwriting system, Loan Product Advisor®, provides lenders with access
to credit requirements and generates an assessment of a loan’s eligibility for sale to Freddie Mac.
▪ Corporate credit policy pillars: i) Minimum credit score requirements, ii) Maximum debt-to-income ratio
limits, iii) Maximum loan-to-value and total-loan-to-value ratio limits, iv) Elimination of risky products
such as interest-only loans, pay option ARMs, reduced documentation, and balloons.
Credit
▪ Require the seller-servicer to repurchase the loan if there is a material underwriting defect
discovered, subject to certain limits. In lieu of repurchase, an alternative remedy (such as
indemnification) can be mutually agreed or Freddie Mac can elect to waive the enforcement of a
remedy.
Reps &
Warrants
(R&Ws)
▪ Vast majority of the loans sold to Freddie Mac require an appraisal. We have recently developed
innovative tools leveraging algorithms and big data advanced analytics to streamline appraisal
requirements for certain loans.
▪ Freddie Mac can evaluate the quality of the appraisal and provide feedback to the lender,
allowing focus on appraisals with the highest risk.
Collateral
Reducing risk through high-quality underwriting standards, data and innovative tools
▪ Loans sold to Freddie Mac must have documented evidence of the mortgagor’s ability to repay
and of the value of the property.Capacity

© Freddie Mac 27
Quality Control (QC) Program
▪ Regularly perform QC on a random and targeted basis to test the quality of recently
purchased loans, including added focus on key elements of particular interest or
concern (e.g., loan attributes or sellers).
▪ Freddie Mac benchmarks every loan we purchase against our valuation model and
evaluates the appraisals within our automated system, Loan Collateral Advisor® for
instantaneous feedback to the originator.
Performing
Loan QC
Non-
Performing
Loan QC
▪ Each loan seller must have an in-house QC program that has written procedures and
operates independently of the sellers’ origination and underwriting functions.
▪ Freddie Mac reviews, monitors, and provides feedback on sellers’ QC and
origination practices, including performing on-site reviews of its largest sellers.
Seller In-House
QC
▪ Freddie Mac also reviews 100% of mortgage loans that default within the first few
years after purchase or guarantee.
Losses are mitigated through a comprehensive QC program across performing /
non-performing loans, including third-party QC processes by lenders

© Freddie Mac 28
Freddie Mac and Independent Quality Control
Defect Rate
0.00%
0.50%
1.00%
1.50%
2.00%
2.50%
3.00%
3.50%
4.00%
4.50%
5.00%13
DN
01
13
DN
02
14
DN
01
14
DN
02
14
DN
03
14
HQ
01
14
HQ
02
14
DN
04
14
HQ
03
15
DN
01
15
HQ
01
15
DN
A1
15
HQ
02
15
DN
A2
15
HQ
A1
15
DN
A3
15
HQ
A2
16
DN
A1
16
HQ
A1
16
DN
A2
16
HQ
A2
16
DN
A3
16
HQ
A3
16
DN
A4
16
HQ
A4
17
DN
A1
17
HQ
A1
17
DN
A2
17
HQ
A2
17
DN
A3
17
HQ
A3
18
DN
A1
Random FRE QC STACR Defect Rate Random Independent QC STACR Defect Rate

© Freddie Mac 29
Credit Risk Transfer (CRT) Overview

© Freddie Mac 30
CRT Product Evolution
2011 & 2012Inception:
- Freddie Mac establishes team
to pioneer CRT concepts
- FHFA publishes strategic plan
for CRT and guidelines
governing GSE risk sharing
2014Building Tools:
- Introduced STACR HQ series
covering >80% LTV collateral
- Selling risk higher up the capital
structure – increased
subordination level from BBB to A
2016Expanding Offerings:
- First Deep MI CRT
transaction offering a front-
end forward credit risk
transfer structure
- First CRT transaction
associated 15yr collateral
(ACIS Standalone)
2015Achieve Scale & Depth:
- New CRT tools added – Seller Risk
Retention, Whole Loan Securities (WLS)
- Enhanced all CRT programs to transfer
actual loss
- Begin transferring first loss risk
2013Establish the Market:
- Historical loan level data released
to develop investor demand
- First STACR transaction (debt) kick-
started the CRT market
- Focused on 60-80% LTV fixed rate
collateral
- First ACIS transaction (reinsurance)
FutureContinued Expansion
- STACR CLN/Trust
- STACR REMIC
2017Further Development:
- New Seller Facing Forward Risk Transaction
- HARP Historical Data release
- Inaugural STACR SPI transaction
- Inaugural STACR HRP “SHRP” transaction.
- Introduced ACIS Forward transactions
“AFRM”

© Freddie Mac 31
▪ Reduces risk to taxpayers
▪ Expands mortgage credit investor base
▪ Reduces concentration of mortgage risk
CRT benefits the housing finance system
Key Statistics of CRT Program:
▪ 77 CRT Transactions to Date
▪ $33.9 Billion Issued in Securitization
and Insurance Coverage
▪ Over 220 Unique Investors
▪ Minimizes volatility through economic cycles
▪ Maintains borrower access to credit
CRT Investor Distribution
Money Manager
41%
Reinsurance26%
Hedge Fund20%
Bank / Credit Union
1%
Insurance5%
REIT5%
Sovereign Fund2%
Freddie Mac’s CRT Program

© Freddie Mac 32
CRT Market Offerings
Credit Risk Transfer (CRT) has become a fundamental component of Freddie Mac’s
operating model while enabling us to address new strategic objectives.
Freddie Mac’s CRT Market Offerings and Access to Diversified Investor Markets
STACR® *STACR SPISM ACISDeep Mortgage
Insurance CRTACIS AFRM
Seller Facing
Forward Risk
Transfer
SCRT/SLST
Issuance
TypeDebt Notes
Cash Securitization/
REMIC
Reinsurance
Policy
Forward
Mortgage
Insurance
Reinsurance
Policy
Debt Notes/
OtherCash Securitization/
REMIC
Primary
Investor Base
Money Managers,
Hedge Funds,
Sovereign Funds &
Insurance
Companies
Money Managers,
Hedge Funds, REITS
Sovereign Funds &
Insurance Companies
Reinsurance/
Insurance
Private
Mortgage
Insurers
Reinsurance
Seller/
Servicers
Money Managers,
Hedge Funds, REITs,
Banks & Insurance
Companies
Offerings
(Multi Class)
Investment Grade
Non-Investment Grade
Not Rated
Front end pool
level coverage
(Multi Class)
Front end
Insurance
Policy
Front end risk
sharing
(Multi Class)
Guaranteed & Non-
Guaranteed
Non-Investment Grade
Not Rated

© Freddie Mac 33
Single-family Credit Risk Transfer – STACR / ACIS
Total Single-family credit guarantee portfolio with
transferred credit risk$ Billions
Cumulative Single-family transferred credit risk
based on outstanding balance at period end$ Billions
Outstanding reference pool UPB
as a percentage of total Single-
family portfolio

© Freddie Mac 34
2018 STACR Issuance Calendar
Expected Issuance Window
January – February 2018
March – April 2018
May – June 2018
August – September 2018
September – October 2018
Source: http://www.freddiemac.com/creditriskofferings/docs/2018_stacr_issuance_calendar.pdf
Freddie Mac retains sole discretion over whether or not the STACR issuances come to market and the timing thereof, which may be impacted by market conditions. As such, the
information contained in this document does not guarantee the timing of any future Freddie Mac offerings or the amount of such offerings. This document may be amended,
superseded or replaced. Please use this STACR issuance calendar for informational purposes only. This document is not an offer to sell any Freddie Mac securities.

© Freddie Mac 35
STACR Overview(DNA, HQA, and HRP)

© Freddie Mac 36
STACR Structure Illustration (On the run transactions- Example Purposes Only)
For illustration purposes only
Reference Pool
Class A-H
(Reference Tranche Only)
Class M-1H
(Reference
Tranche Only)
Class M-2AH
(Reference
Tranche Only)
Class M-2BH
(Reference
Tranche Only)
Class B-1H
(Reference
Tranche Only)
Class M-1
(Note and Corresponding
Reference Tranche)
Class M-2A*
(Note and Corresponding
Reference Tranche)
Class M-2B*
(Note and Corresponding
Reference Tranche)
Class B-1
(Note and Corresponding
Reference Tranche)
Hypothetical Allocations of Principal Payments
Specified Credit Events and Modification Events
Freddie Mac pays coupon
on Notes, and its
obligation to pay interest
on the Notes and to repay
principal on the Notes is
reduced for Credit Events
and/or Modification Events
on the Reference Pool
based on an actual loss
approach.
STACR Issued Notes Retained Credit Risk
Class B-2H
(Reference
Tranche Only)
Represents
Class
M-1 Notes
Represents
Class
B-1 Notes
Represents
Class
M-2 Notes
Offered at
Closing
* The Class M-2A and Class M-2B Notes and corresponding Reference Tranches relate to the Class M-2 Notes, which Class M-2A and Class M-2B Notes are exchangeable for the Class M-2
Notes, and vice versa.
Freddie Mac may transfer a portion of the retained credit risk, but has agreed not to transfer or hedge more than a 95% pro rata share of the credit risk on any of (i) the Class A-H Reference
Tranche, (ii) the Class M-1 and Class M-1H Reference Tranches (in the aggregate), (iii) the Class M-2A and Class M-2AH Reference Tranches (in the aggregate), (iv) the Class M-2B and Class M-
2BH Reference Tranches (in the aggregate), (v) the Class B-1 and Class B-1H Reference Tranches (in the aggregate) or (vi) the Class B-2H Reference Tranche. Additionally, Freddie Mac does not
intend, through this transaction or any subsequent transactions, to enter into agreements that transfer or hedge more than a 25% share of the credit risk on the Class B-2H Reference Tranche.

© Freddie Mac 37
First – M1 and M-1H Reference Tranche
– Principal payment
Second – M2 and M-2H Reference Tranche (MACR Option
Available)– Principal payment
Third – B1 and B1-H Reference Tranche
– Principal payment
Fourth – B2-H Reference Tranche
– Principal payment
Allocation of Principal Payment Among Subordinate Classes
Scheduled principal:
▪ Pro rata between senior and subordinate. Sequential pay among subordinate
classes.
Unscheduled principal:
▪ Pro rata between senior and subordinate if all triggers pass. Sequential pay among
subordinate classes.
▪ Sequential between senior and subordinate if any trigger fails. Sequential pay
among subordinate classes.
STACR – Allocation of Principal

© Freddie Mac 38
STACR – Actual Loss Waterfall
Freddie Mac will utilize the below waterfalls to allocate actual losses
▪ Modification Loss Amount = Modification Shortfall minus Modification Excess
» Modification Shortfall / Excess
1/12* (original interest rate - 35 bps) * Current Actual UPB - 1/12*(current interest rate -35 bps) * Current Interest Bearing UPB
First - Class B-2H Reference Tranche
– Write-down
Second - Class B-1 and Class B-1H Reference Tranches, pro rata
– Write-down
Fourth - Class M-2A and Class M-2AH Reference Tranches, pro rata
– Write-down
Fifth - Class M-1 and Class M-1H Reference Tranches, pro rata
– Write-down
Allocation of Loss on Dispositions
First - Class B-2H Reference Tranche
– Interest Amount
Second - Class B-2H Reference Tranche
– Write-down
Third - Class B-1 and Class B-1H Reference Tranches, pro rata
– Interest Amount
Fifth - Class M-2B and Class M-2BH Reference Tranches, pro rata
– Interest Amount
Seventh - Class M-2B and Class M-2BH Reference Tranches, pro rata
– Write down
Eighth - Class M-2A Class M-2AH Reference Tranches, pro rata
– Write-down
Ninth - Class M-1 and Class M-1H Reference Tranches, pro rata
– Interest Amount
Tenth - Class M-1 and Class M-1H Reference Tranches, pro rata
– Write-down
Sixth - Class A-H Reference Tranche
– Write-down
Third - Class M-2B and Class M-2BH Reference Tranches, pro rata
– Write-down
Sixth - Class M-2A and Class M-2AH Reference Tranches, pro rata
– Interest Amount
Fourth - Class B-1 and Class B-1H Reference Tranches, pro rata
– Write-down
Allocation of Modification Loss Amounts
© Freddie Mac 39
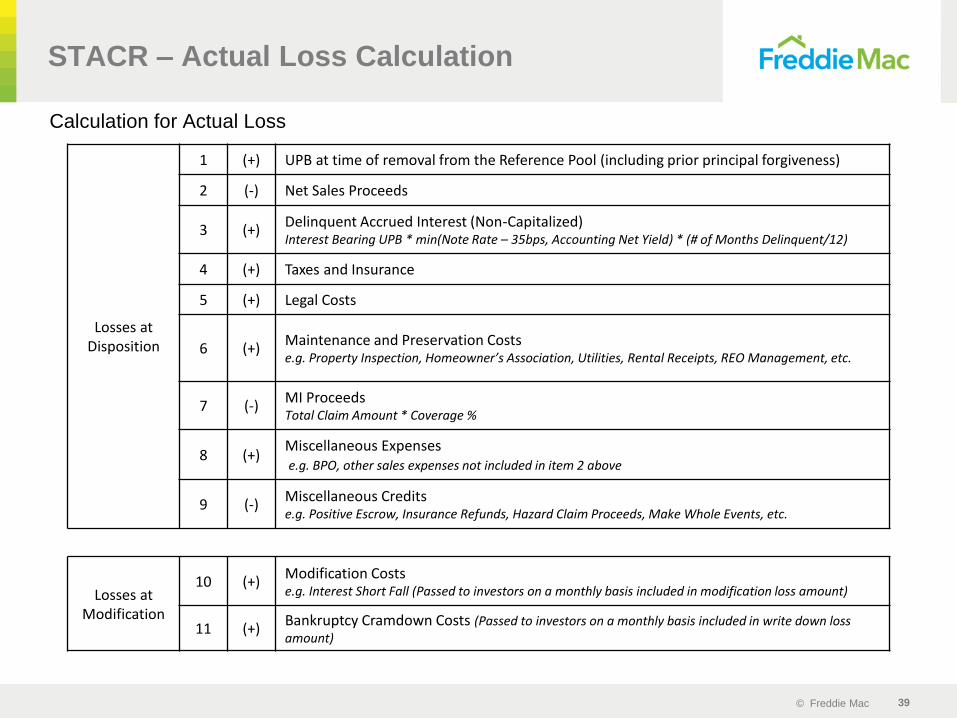
Calculation for Actual Loss
STACR – Actual Loss Calculation
Losses atDisposition
1 (+) UPB at time of removal from the Reference Pool (including prior principal forgiveness)
2 (-) Net Sales Proceeds
3 (+)Delinquent Accrued Interest (Non-Capitalized)Interest Bearing UPB * min(Note Rate – 35bps, Accounting Net Yield) * (# of Months Delinquent/12)
4 (+) Taxes and Insurance
5 (+) Legal Costs
6 (+)Maintenance and Preservation Costse.g. Property Inspection, Homeowner’s Association, Utilities, Rental Receipts, REO Management, etc.
7 (-)MI ProceedsTotal Claim Amount * Coverage %
8 (+)Miscellaneous Expensese.g. BPO, other sales expenses not included in item 2 above
9 (-)Miscellaneous Creditse.g. Positive Escrow, Insurance Refunds, Hazard Claim Proceeds, Make Whole Events, etc.
Losses at Modification
10 (+)Modification Costse.g. Interest Short Fall (Passed to investors on a monthly basis included in modification loss amount)
11 (+)Bankruptcy Cramdown Costs (Passed to investors on a monthly basis included in write down loss amount)

© Freddie Mac 40
STACR 2018-DNA1 Capital Structure Overview
*Calculated Weighted Average Life (“WAL”) and Principal Window assuming either 5 CPR or 10 CPR and 0 CDR. WAL (years) and Principal Window are to Early Redemption Date.
STACR 2018-DNA1
Tranche Expected Ratings Balance ($) Coupon WAL (yrs.)* Principal Window* Loss Coverage
Fitch KBRA 10% CPR 5% CPR 10% CPR 5% CPR Attach Detach
M-1 BBB- BBB+ 230,000,000 1mL + 0.45% 1.97 3.33 1-37 1-64 3.10% 4.00%
M-2 B BB- 540,000,000 1mL + 1.80% 6.55 8.87 37-120 64-120 1.00% 3.10%
B-1 NR NR 130,000,000 1mL + 3.15% 9.99 9.99 120-120 120-120 0.50% 1.00%
Total 900,000,000
April 1, 2017 – July 31, 2017 acquisitions
Reference Pool is based on a pool of loans with a UPB of $34.7bn, LTV range: 60% < LTV <= 80%
Min C/E Test: 4.50%
Cumulative Net Loss % Threshold: Year 1: 0.10%, with 0.10% step-ups each year
Delinquency Test: 50% of subordinate balance
Minimum Denomination: $10,000 and QIB requirement

© Freddie Mac 41
STACR 2018-DNA1 Initial Cohort
Pool to Reference Pool
1) Other filters include: government guaranteed loans, IO only, balloons, etc.
2) Loans removed because reconciliation with the related sellers regarding certain data they provided has not yet been completed or loans removed because data corrections or certain pilot programs made the loans
ineligible. 3,198 of the 3,200 loans removed were already subject to credit enhancement.
3) Includes loans removed as a result of the findings of the Third-Party Diligence Provider, if applicable. Also includes Mortgage Loans repurchased by the seller/servicer as a result of their internal quality control
process and/or voluntarily repurchased by the seller/servicer.
4) Out of the 3,138 loans that were excluded from the Reference Pool due to failing delinquency criteria or having filed for bankruptcy, 1,733 of those loans were reported to be currently performing as of November 30,
2017.
▪ Key Reference Pool Characteristics:» 100% Never Delinquent
» 100% fully amortizing, fixed-rate, one-to-four unit, first lien mortgage loans
with original terms of 241 to 360 months
» No loans originated under Relief Refinance program (including HARP)
» No government guaranteed loans
» No IOs or Balloons
» No LTV > 80% or <=60%
Category Aggregate Original Loan Balance ($ Billion)
All non-HARP loans funded between April 1, 2017 and July 31, 2017 97.9
Non-HARP loans, fixed 93.7
Non-HARP loans, fixed 241 to 360 months term 78.9
Non-HARP loans, fixed 241 to 360 months term, 60% < LTV <= 80% 39.9
Non-HARP loans, fixed 241 to 360 months term, 60% < LTV <= 80% & other filters (1) 38.6
Category Loan CountAggregate Original Loan Balance ($)
Average Original Loan Balance ($)
Non-Zero Weighted Average Original Credit
Score
Weighted Average Original LTV Ratio (%)
Non-Zero Weighted Average Original DTI (%)
Initial Cohort Pool 159,240 38,635,375,000 242,624 747 76 36
less loans that were removed due to incomplete data reconciliation or corrected data(2)
3,200 938,556,000 293,299 755 76 36
less loans that were repurchased or removed by quality control process(3) 270 73,732,000 273,081 714 75 39
less loans that were paid in full 5,695 1,612,310,000 283,110 749 75 37
less loans that were removed due to having failed delinquency criteria or the borrower having filed for bankruptcy(4)
3,138 745,243,000 237,490 720 76 37
Reference Pool 146,937 35,265,534,000 240,004 747 76 36

© Freddie Mac 42
▪ The Class B-1 Notes should be treated as derivatives for U.S. federal income tax purposes
▪ Freddie Mac will treat the Class B-1 Notes as notional principal contracts (“NPC”) (except with
respect to Non-U.S. Beneficial Owners for purposes of U.S. federal withholding tax) and will bind
investors to such treatment
▪ Freddie Mac (and holders) agree to treat the NPC as a deemed loan (equal to the initial payment for
the Class B-1 Notes) and an on-market swap pursuant to the NPC accounting rules (tax accounting
guidance will be provided in the Offering Circular)
▪ The Class B-1 Notes will be issued as DTC Eligible Notes
▪ Freddie Mac intends to withhold on Non-U.S. Beneficial Owners of Class B-1 Notes with respect to
non-principal Class B-1 payments. However, depending on the residence of a Non-U.S. Beneficial
Owner, Treaty rates may apply to reduce the withholding rate
▪ Sample Treaty rates:
» United Kingdom: 0% for Business Profits, 0% for Other Income
» Spain: 0% for Business Profits, 0% for Other Income
» Luxembourg: 0% for Business Profits, 0% for Other Income
Class B-1 Tax Considerations

© Freddie Mac 43
M-1 M-2 B-1/B B-2
STACR
2017-
DNA3
Not
Offered
STACR
2018-
DNA1
Not
Offered
STACR
2017-
HQA2
Not
Offered
STACR
2017-
HQA3
Not
Offered
STACR
2017-
SPI1N/A
STACR Investor Participation
Note: Institution type is our best estimate based on information provided to Freddie Mac from the underwriting syndicate as some institutions may be involved in multiple lines of business. Percentages may not add up to 100% due to rounding.
REIT Money Manager Insurance Hedge Fund Bank / Credit UnionSovereign Fund
5%
63%
32%
17%
44%
39%
14%
43%
42%
75%
12%
13% 15%
36%
49%
4%
48%48%
97%
3% 18%
44%
38% 42%
58%
81%
8%
11%
70%
30%
4%
88%
8%
15%
64%
20%
50%
13%
37%
68%
32%

© Freddie Mac 44
STACR Evolution
▪ Freddie Mac has issued 34 STACR transactions to date:
Transaction #1
STACR 2013-DN1
July 26, 2013
$500,000,000
Inaugural STACR Transaction
Transaction #6
STACR 2014-HQ1
August 11, 2014
$460,000,000
New Series “HQ” (80%-95% LTV
Collateral)
Transaction #7
STACR 2014-HQ2
September 15, 2014
$770,000,000
Seasoned Deal
Transaction #10
STACR 2015-DN1
February 3, 2015
$880,000,000
Introduced “B” Bond
“M-3” Now Rated
Transaction #12
STACR 2015-DNA1
April 28, 2015
$1,010,000,000
New series “DNA” – actual loss
Seasoned Collateral
Transaction #15
STACR 2015-HQA1
September 28, 2015
$872,000,000
New Series “HQA” –
Actual Loss (80%-95% LTV
Collateral)
Transaction #20
STACR 2016-DNA2
May 10, 2016
$916,000,000
Introduced new M-3 MAC Notes
Transaction #3
STACR 2014-DN1
February 12, 2014
$1,008,000,000
Introduced 3 ”M” Bond Structure
Transaction #26
STACR 2017-DNA1
February 7, 2017
$802,000,000
Decrease Detachment Point
New M-1, M-2, B-1, and B-2
Structure
New MAC Notes
Transaction #25
STACR 2016-HQA4
October 25, 2016
$478,000,000
Up to 97% LTV collateral
Loans not backing PCs eligible
Transaction #32
STACR 2017-SPI1
October 2017
$50,088,878
Inaugural SPI transaction
Transaction #33
STACR 2017-HRP1
December 2017
$200,000,000
Inaugural STACR HRP “SHRP”
Transaction #34
STACR 2018-DNA1
January 30, 2018
$900,000,000
Minimum Denominations reduced
to $10k, Offering limited to QIBs

© Freddie Mac 45
STACR SPI Overview

© Freddie Mac 46
▪ Unguaranteed certificates and PCs will be backed by participation interests in loans (in lieu of
loans).
▪ The STACR SPI trust will issue only unguaranteed credit certificates.
▪ This structure allows for the buy-out of collateral from PC trusts (in accordance with the PC
Master Agreement) while preserving the credit risk protection afforded by the sale of
unguaranteed certificates.
▪ Key to the STACR SPI structure is Freddie Mac’s willingness/ability to advance funds for the
repurchase of assets from the related PC trusts (as it does in the existing PC process).
▪ These advances are certificated within the SPI trust and accrue interest; and such certificates
have principal and interest payment priority over subordinate bonds.
▪ The creation of, and principal payment priority to, these certificates effectively creates a loan
level trigger, enabling the elimination of deal level triggers.
▪ Improves upon pricing execution of WLS, the initial CRT using a cash securitization structure.
STACR SPI - Summary
Structure allows for issuance of regular PCs using existing PC
processes/systems while transferring credit risk via a cash securitization
© Freddie Mac 47
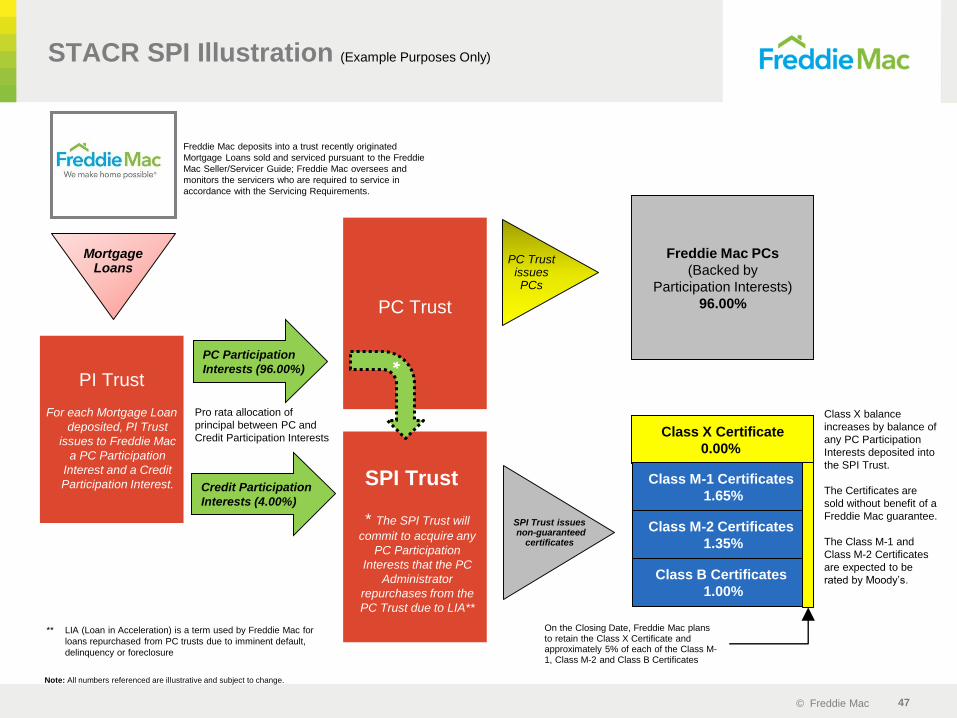
SPI Trust
* The SPI Trust will
commit to acquire any
PC Participation
Interests that the PC
Administrator
repurchases from the
PC Trust due to LIA**
STACR SPI Illustration (Example Purposes Only)
SPI Trust issuesnon-guaranteed
certificates
Class B Certificates
1.00%
Class X Certificate
0.00%
Class X balance
increases by balance of
any PC Participation
Interests deposited into
the SPI Trust.
The Certificates are
sold without benefit of a
Freddie Mac guarantee.
The Class M-1 and
Class M-2 Certificates
are expected to be
rated by Moody’s.
On the Closing Date, Freddie Mac plans to retain the Class X Certificate and approximately 5% of each of the Class M-1, Class M-2 and Class B Certificates
Class M-2 Certificates
1.35%
Class M-1 Certificates
1.65%
Note: All numbers referenced are illustrative and subject to change.
PI Trust
For each Mortgage Loan
deposited, PI Trust
issues to Freddie Mac
a PC Participation
Interest and a Credit
Participation Interest.
Freddie Mac PCs
(Backed by
Participation Interests)
96.00%PC Trust
Freddie Mac deposits into a trust recently originated
Mortgage Loans sold and serviced pursuant to the Freddie
Mac Seller/Servicer Guide; Freddie Mac oversees and
monitors the servicers who are required to service in
accordance with the Servicing Requirements.
MortgageLoans
PC Trust issues PCs
PC Participation
Interests (96.00%)
Credit Participation
Interests (4.00%)
Pro rata allocation of
principal between PC and
Credit Participation Interests
*
** LIA (Loan in Acceleration) is a term used by Freddie Mac for
loans repurchased from PC trusts due to imminent default,
delinquency or foreclosure

© Freddie Mac 48
Sequential within SPI Trust
Sequential within SPI Trust
STACR SPI - Principal & Interest Allocation
B Certificates
Participation
Certificates
M-2 Certificates
M-1 Certificates
Principal & Interest
Payments on non-
Constructive Default Loans
(pre-LIA)scheduled P&I advanced through
LIA date
Pro Rata between Participation Interests
Principal & Interest
Payments and Liquidation
Proceeds on Constructive
Default Loans
Class X is at top of SPI
Trust waterfall
Upon Constructive Default:
PC is paid down; Class X
written up by equal amount
Constructive Default mechanism acts as a loan level trigger, locking out the subordinate certificates from
principal allocations until the balance of the Class X Certificate is reduced to zero. There are no deal level
delinquency, cumulative loss or credit enhancement triggers in the SPI Trust structure.

© Freddie Mac 49
STACR 2017-SPI1 Capital Structure
Freddie Mac Structured Agency Credit Risk , Series 2017-SPI1
Class
Expected Rating
(Moody’s)
Initial Class Principal
Amount ($)
Approximate Initial Class Coupon (%)
WAL (Years)(4)
Principal Window
(Months)(4)
Final Scheduled Distribution
Date
Initial Credit Enhancement
(%) Class Type
X(1) NR $0 (2) N/A N/A Sept. 2047 4.00% Non-Guaranteed
M-1 Baa3 (sf) $20,661,000 3.992%(3) 1.39 1 - 36 Sept. 2047 2.35% Subordinate, Non-Guaranteed
M-2 B2 (sf) $16,905,000 3.992%(3) 4.97 36 - 91 Sept. 2047 1.00% Subordinate, Non-Guaranteed
B NR $12,522,878 3.992%(3) 10.66 91 - 147 Sept. 2047 0.00% Subordinate, Non-Guaranteed
R(5) NR $0 0.000% N/A N/A N/A N/A Residual, Non-Guaranteed
(1) The Certificate Principal Amount of the Class X Certificate will initially be zero, but will increase by the PC Investor Balance (as defined herein) of PC
Participation Interests, if any, deposited into the SPI Trust by Freddie Mac after the Closing Date.
(2) The Class Coupon of the Class X Certificate will be a per annum rate equal to the sum of the Net WAC for the related Distribution Date and the Master
Servicing Fee Rate.
(3) The Class Coupon of the Class M-1, Class M-2 and Class B Certificates will be a per annum rate equal to the Net WAC for the related Distribution Date. The
initial Class Coupon of the Class M-1, Class M-2 and Class B Certificates with respect to the first Distribution Date will be approximately 3.992% per annum.
(4) Weighted average lives and principal windows with respect to the certificates are based on certain modeling assumptions, including: (i) prepayments occur at
the pricing speed of 15% CPR, calculated from the Closing Date, (ii) the Optional Termination right is exercised on the first Distribution Date on which it is
eligible to be exercised, and (iii) distributions on the certificates occur on the 25th day of each calendar month beginning in November 2017.
(5) The Class R Certificate does not have a Class Principal Amount and is not entitled to distributions of interest or principal.

© Freddie Mac 50
Structural Comparison of STACR SPI to
STACR DNA/HQA
Structural Comparison STACR SPI STACR DNA/HQA
Guaranteed No Same
Default Loan Disposition Event Liquidation/Actual Loss Same
Typical Secondary Trade Settle T+2 Same
Factor Date 25th Same
Payment Day 25th Same
Rating Rated and Unrated Classes Same
MI Rescission/Counterparty Risk Borne by Freddie Mac Same (applies to HQA only)
Representations & WarrantiesInvestors receive no direct R+Ws from Freddie Mac, however, they benefit from R&Ws provided by underlying sellers to Freddie Mac under the Guide
Same
Collateral Participation Interests in Mortgage Loans Synthetic/Reference Pool
Coupon / Pricing Fixed, subject to Net WAC drift; results in non-par pricing Floating; all bonds priced at par
Tax Status REMIC/Good REIT Asset Debt for Tax/Derivative for Tax
Delinquency AdvancingWhile PCPI is in related PC (generally to D120); Once CDL, advancing limited to less than D60
Debt service payment which references a mortgage pool
Priority within Credit ClassesSequential (Class X Certificates have priority over subordinate certificates)
Sequential
TriggersConstructive Default/Class X mechanism is effectively a loan level trigger; no deal level triggers
Minimum Credit Enhancement Test, Delinquency Test and Cumulative Loss Test Triggers
Legal Final ~ 30 years (latest maturity date of Mortgage Loans) 12.5 Years
Optional Termination Yes, 10% Subordinate Certificates bond factor Yes, earlier of 10% collateral factor or 10 years
Modification – PrincipalForborne UPB treated as Realized Loss at time of modification; forgiven principal advanced by Master Servicer
Investors take losses on forborne UPB through the Modification Loss Amount waterfall; principal forgiven is treated as unscheduled principal
Modification – Interest Forgone interest (in excess of Class B accrued interest) due to rate modifications funded out of certain principal payments with corresponding losses allocated to Class B
Forgone interest (in excess of Class B accrued interest) due to rate modifications treated as loss to Class B notes. Remaining amounts allocated to interest and principal in reverse sequential order
ERISA Eligibility Yes, the Class M1 is ERISA eligible All notes are ERISA eligible
STACR SPIs are similar in many
ways to Freddie Mac’s STACR
DNA and HQA debt notes,
though certain differences exist.

© Freddie Mac 51
Collateral Performance

© Freddie Mac 52
2018 Returns Summary: CRT vs. Other
Sectors
0.4%
2.8%
0.6%2.3%
1.2%
-0.2%
1.8%
5.5%
1.0%
4.9%
2.0%
10.9%
6.2%7.6%
4.2%2.4%
7.8%
15.3%
4.8%
19.0%
-2.0%
3.0%
8.0%
13.0%
18.0%
CRT IG CRT Non-IG IG Bonds HY Bonds HY Loans Agency MBS Legacy RMBS CMBS BBB- SFR BBB- S&P 500
2018 YTD Returns 2017 Returns
0
100
200
300
400
500
600
700
800
March-17 June-17 September-17 December-17 March-18
CRT Non IG
CMBS BBB-
Legacy RMBS
HY Bonds
HY Loans
SFR BBB-
Total Returns
Historical Spreads
(2)
(1) (2)
(1) CRT IG total returns calculated from a 2015 index of A-rated bonds.(2) CRT Non-IG total returns and historical spreads calculated from a 2015 index of BB/B-rated bonds.
Source: J.P. Morgan Research as of March 8, 2018.Note: Indexes use bond rating at origination.
© Freddie Mac 53
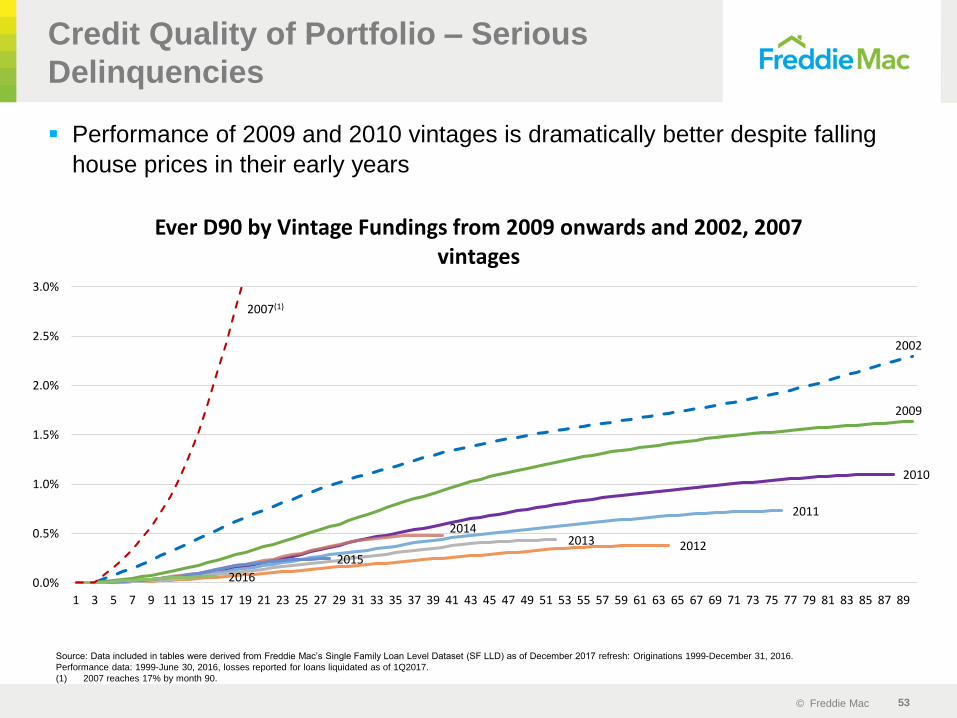
Credit Quality of Portfolio – Serious
Delinquencies
▪ Performance of 2009 and 2010 vintages is dramatically better despite falling
house prices in their early years
Source: Data included in tables were derived from Freddie Mac’s Single Family Loan Level Dataset (SF LLD) as of December 2017 refresh: Originations 1999-December 31, 2016.
Performance data: 1999-June 30, 2016, losses reported for loans liquidated as of 1Q2017.
(1) 2007 reaches 17% by month 90.
2002
2009
2010
2011
201220132014
2015
2016
2007(1)
0.0%
0.5%
1.0%
1.5%
2.0%
2.5%
3.0%
1 3 5 7 9 11 13 15 17 19 21 23 25 27 29 31 33 35 37 39 41 43 45 47 49 51 53 55 57 59 61 63 65 67 69 71 73 75 77 79 81 83 85 87 89
Ever D90 by Vintage Fundings from 2009 onwards and 2002, 2007 vintages
© Freddie Mac 54
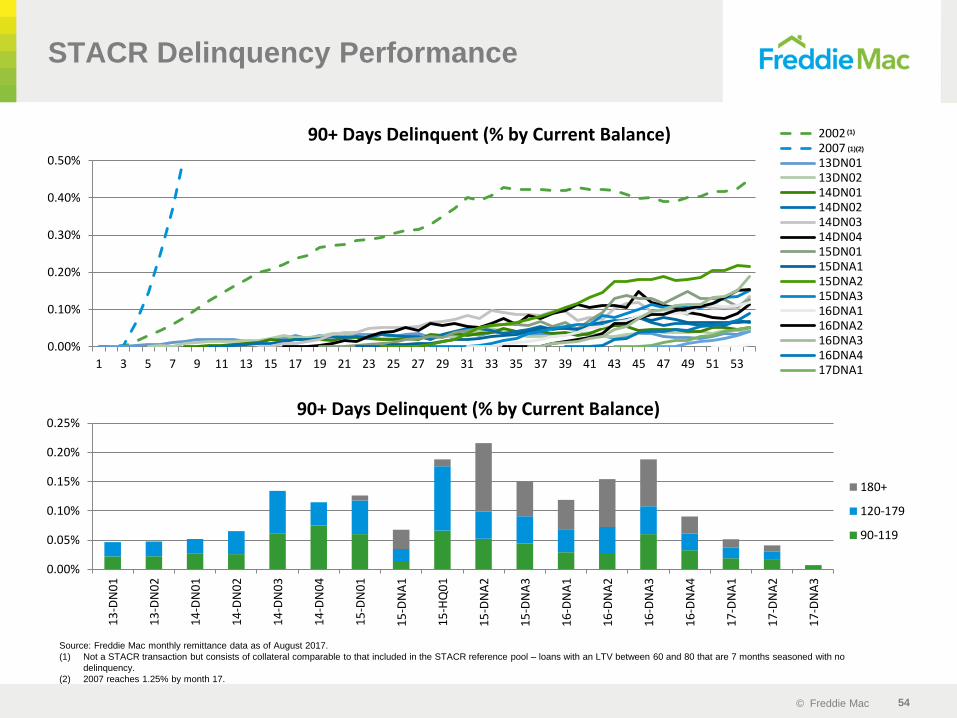
STACR Delinquency Performance
0.00%
0.05%
0.10%
0.15%
0.20%
0.25%
13
-DN
01
13
-DN
02
14
-DN
01
14
-DN
02
14
-DN
03
14
-DN
04
15
-DN
01
15
-DN
A1
15
-HQ
01
15
-DN
A2
15
-DN
A3
16
-DN
A1
16
-DN
A2
16
-DN
A3
16
-DN
A4
17
-DN
A1
17
-DN
A2
17
-DN
A3
90+ Days Delinquent (% by Current Balance)
180+
120-179
90-119
0.00%
0.10%
0.20%
0.30%
0.40%
0.50%
1 3 5 7 9 11 13 15 17 19 21 23 25 27 29 31 33 35 37 39 41 43 45 47 49 51 53
90+ Days Delinquent (% by Current Balance) 2002200713DN0113DN0214DN0114DN0214DN0314DN0415DN0115DNA115DNA215DNA316DNA116DNA216DNA316DNA417DNA1
Source: Freddie Mac monthly remittance data as of August 2017.
(1) Not a STACR transaction but consists of collateral comparable to that included in the STACR reference pool – loans with an LTV between 60 and 80 that are 7 months seasoned with no
delinquency.
(2) 2007 reaches 1.25% by month 17.
(1)
(1)(2)

© Freddie Mac 55
STACR Historical Performance
Transaction
Source: Freddie Mac monthly remittance data as of December 2017.
0.00
0.05
0.10
0.15
0.20
0.25
0.30
0.35
1 2 3 4 5 6 7 8 9 10 11 12 13 14 15 16 17 18 19 20 21 22 23 24 25 26 27 28 29 30 31 32
Cumulative Net Loss (bps) 15-DNA1
15-DNA2
15-DNA3
16-DNA1
16-DNA2
16-DNA3
16-DNA4
17-DNA1
17-DNA2
17-DNA3
Cumulative Net Loss (bps)
0%
5%
10%
15%
20%
25%
30%
0%
5%
10%
15%
20%
25%
Interest Rate Distribution Across Balance and Prepayments
LTV Bal (Rt Axis) LTV VPR (Lt Axis)
Interest Rate Distribution Across Balance and Prepayments
0
5
10
15
20
25
30
35
40
45
Voluntary Prepayment Rate (% by balance)13DN0113DN0214DN0114DN0214DN0314DN0415DN0115DNA115DNA215DNA316DNA116DNA216DNA316DNA417DNA117DNA217DNA3
Voluntary Prepayment Rate (% by Balance)

© Freddie Mac 56
STACR Series 2018-DNA1 Proxy Cohort
Performance
Notes: Data included in tables were derived from Freddie Mac’s Single Family Loan Level Dataset (SF LLD) as of December 2017 refresh: Originations 1999-December 31, 2016. Performance data: 1999-
June 30, 2017 losses reported for loans liquidated as of 1Q2017.
Cumulative Losses do not include modification losses.
Data is weighted in proportion to 2018-DNA1 FICO and LTV cohorts.
(1) Assuming no principal payments.
For Freddie Mac data above:
-Net Losses are calculated as noted on the “Actual Loss Calculation” slide:
Collateral Deficiency + Delinquent Interest + Expenses – MI Recoveries – Non MI Recoveries
-Freddie Mac data does not include bulk settlements
-Assumes 35bps g-fee to calculate delinquent interest
-Collateral Deficiency: Defaulted UPB – Net Sales Proceeds
-Loans with Repurchase flag = Y have been set to zero loss
0.1% 0.2% 0.2%0.4%
0.9%
2.6%
3.9% 3.9%
2.1%
0.4%
0.2% 0.1% 0.0% 0.0% 0.0% 0.0% 0.0%
Class B-1 takes 100% loss (1)
Class M-2 takes 100% loss(1)
Class M-1 takes 100% loss(1)
0.0%
0.5%
1.0%
1.5%
2.0%
2.5%
3.0%
3.5%
4.0%
4.5%
2000 2002 2004 2006 2008 2010 2012 2014 2016
Cu
mu
lati
ve N
et
Loss
Reference Pool Proxy

© Freddie Mac 57
0%
20%
40%
60%
80%
100%
2000 2002 2004 2006 2008 2010 2012 2014<660 660 - 700 >700
680
690
700
710
720
730
740
750
760
Evolution in Mortgage Credit Quality
Borrower Mix by FICO Scores Over Time
Credit quality of mortgages underlying CRT and other post-crisis RMBS
transactions has improved materially vs. pre-crisis originations
0
2
4
6
8
10
12
14
16
18
1998 1999 2000 2001 2002 2003 2004 2005 2006 2007 2008 2009 2010 2011 2012 2013 2014 2015 2016 2017
(%)
Product Risk
Borrower risk
Default Risk Taken by the Mortgage Market
Source: Freddie Mac, Intex, Loan Performance, Urban Institute and Barclays Research

© Freddie Mac 58
Improved Collateral Performance Over Time
Source: Freddie Mac, Intex, Loan Performance, Urban Institute and Barclays Research
Cumulative 60+ Delinquencies 18 months post origination
Underwriting WA FICO WA CLTV WA DTI ALS GWAC Non 30Y Fixed % Full Doc. % Owner Occ. % Purchase %
Alt-A (1998–2008) 711 79% 36% $288,276 5.30% 69% 26% 81% 47%
Subprime (1998–2008) 623 84% 41% $161,799 7.90% 74% 61% 93% 37%
Non-Prime (2015–2016) 697 75% 37% $384,812 7.00% 3% 84% 88% 85%
All STACR 756 81% 34% $232,394 4.08% 0% 100% 91% 58%
1.2%
0.4%
0.6%
3.4%
0.0%
2.0%
4.0%
6.0%
1 3 5 7 9 11 13 15 17
Ramps up to 21% by month 18Ramps up to 9% by month 18

© Freddie Mac 59
Data Resources

© Freddie Mac 60
Data Transparency
▪ Freddie Mac has made available the Single-Family Loan-Level Dataset as part of a larger effort to
increase transparency and help investors build more accurate credit performance models in support
of the risk-sharing initiatives.
▪ The Single-Family Loan-Level Dataset includes loan-level origination and monthly loan performance
data on a portion of single-family mortgages acquired by Freddie Mac. Approximately 25.4 million
loans are in the “full” Single-Family Loan-Level Dataset
▪ This level of quality and historical data is generally not seen in the private label RMBS market.
▪ Freddie Mac has created a smaller dataset for those who do not require the full dataset or do not have
the capability to download the full dataset.
▪ Investors can rely upon the dataset to model transaction projections and performance.
▪ Additionally, Freddie Mac releases loan level data for all STACR deals on a monthly basis.
» Actual loss data was first made available in November 2014.

© Freddie Mac 61
Disclosed Loan-Level Fields
D = not disclosed, but derivable from other disclosed fields.
For more information on file layout and field definition, please refer to the STACR Reference Pool Disclosure Guide
(http://www.freddiemac.com/creditriskofferings/docs/reference_pool_disclosure_guide.pdf).
# Origination Records SF LLDSTACR Relief
Refi
STACR Pre-Relief
Refi
(Issuance Only)
1 LOAN IDENTIFIER Y Y Y
2 PRODUCT TYPE Y Y Y
3 SELLER NAME Y Y Y
4 PROPERTY STATE Y Y Y
5 POSTAL CODE (Zip 3) Y Y N
6 MSA Y Y Y
7 FIRST PAYMENT DATE Y Y Y
8 MATURITY DATE Y Y Y
9 ORIGINAL LOAN TERM Y Y Y
10 ORIGINAL INTEREST RATE Y Y Y
11 ORIGINAL UPB Y Y Y
12 UPB AT ISSUANCE N Y N
13 LOAN PURPOSE Y Y Y
14 CHANNEL Y Y Y
15 PROPERTY TYPE Y Y Y
16 NUMBER OF UNITS Y Y Y
17 OCCUPANCY STATUS Y Y Y
18 NUMBER OF BORROWERS Y Y Y
19 FIRST TIME HOMEBUYER Y Y Y
20 PREPAYMENT PENALTY INDICATOR Y Y Y
21 ORIGINAL CREDIT SCORE Y Y Y
22 ORIGINAL LOAN-TO-VALUE (LTV) Y Y Y
23 ORIGINAL COMBINED LOAN-TO-VALUE (CLTV) Y Y Y
24 ORIGINAL DEBT-TO-INCOME (DTI) RATIO Y Y Y
25 MORTGAGE INSURANCE PERCENTAGE (MI %) Y Y Y
26 MI: LENDER OR BORROWER PAID N N N

© Freddie Mac 62
Disclosed Loan-Level Fields (cont.)
D = not disclosed, but derivable from other disclosed fields.
# Performance Records SF LLD STACR Relief RefiSTACR Pre-Relief Refi
(at Issuance Only)
27 SERVICER NAME Y Y N
28 LOAN AGE Y Y N
29 REMAINING MONTHS TO LEGAL MATURITY Y Y N
30 ADJUSTED REMAINING MONTHS TO MATURITY (RMM) N Y N
31 CURRENT LOAN DELINQUENCY STATUS Y Y N
32 PAYMENT HISTORY D Y N
33 CURRENT INTEREST RATE Y Y N
34 CURRENT ACTUAL UPB Y Y N
35 CURRENT INTEREST BEARING UPB D Y N
36 CURRENT DEFERRED UPB Y D N
37 LOAN IN ELIGIBLE DISASTER AREA N Y N
38 DUE DATE OF LAST PAID INSTALLMENT (DDLPI) Y Y N
39 BANKRUPTCY FLAG N Y N
40 DATE REFERRED TO FORECLOSURE N Y N
41 MORTGAGE INSURANCE CANCELLATION INDICATOR N Y N
42 ESTIMATED LOAN-TO-VALUE (LTV) N Y N
43 FORECAST STANDARD DEVIATION (FSD) N Y N
44 UPDATED CREDIT SCORE N Y N
For more information on file layout and field definition, please refer to the STACR Reference Pool Disclosure Guide
(http://www.freddiemac.com/creditriskofferings/docs/reference_pool_disclosure_guide.pdf).

© Freddie Mac 63
Freddie Mac Key Contacts
Team Member Email Address Business Phone
Michael S. Reynolds
Vice [email protected] (571) 382-4852
Dirk Niese
Transaction Manager, [email protected] (571) 382-4738
Song Pan
Transaction Manager, [email protected] (571) 382-3077
Christian Valencia
[email protected] (571) 382-3727
Michael Murai
Portfolio Manager, [email protected] (571) 382-5702
Sonya Sheth
CRT Investor Development and Marketing [email protected] (571) 382-4376
Peter Wu
Portfolio Manager, [email protected] (571) 382-5367
Charlotte Gladwin
Portfolio Manager, Manager [email protected] (571) 382-3732
Jantsen Roney
Portfolio Manager, [email protected] (571) 382-3711
Luke Abraham
CRT Investor Development and Marketing, [email protected] (571) 382-5211

© Freddie Mac 64
CRT Resources
Please find additional resources for Freddie Mac Credit Risk Transfer
products at:
http://www.freddiemac.com/creditriskofferings/stacr_debt.html
http://www.freddiemac.com/creditriskofferings/stacr_spi.html
http://www.freddiemac.com/creditriskofferings/freddie_mac_whole_loan_securities.html

© Freddie Mac 65
Endnotes
1 Excludes the initial $1 billion liquidation preference of senior preferred stock issued to Treasury in September 2008 as consideration for Treasury’s funding commitment and the $3.0
billion increase in the aggregate liquidation preference of the senior preferred stock pursuant to the December 21, 2017 Letter Agreement. The company received no cash proceeds as
a result of issuing the initial $1 billion liquidation preference of senior preferred stock or the $3.0 billion increase on December 31, 2017. At December 31, 2017, we had a net worth deficit of
$312 million. As a result, FHFA, as Conservator, will submit a draw request, on our behalf, to Treasury under the Purchase Agreement in the amount of $312 million.
2 Based on the company’s purchases of loans and issuances of mortgage-related securities. For the periods presented, a borrower may be counted more than once if the company purchased
more than one loan (purchase or refinance mortgage) relating to the same borrower.
3 Consists of both home retention actions and foreclosure alternatives.
4 Categories are not mutually exclusive, and a borrower in one category may also be included in another category in the same or another period. For example, a borrower helped through a home
retention action in one period may subsequently lose his or her home through a foreclosure alternative in a later period.
5 Represents the estimated average rate of guarantee fees for new acquisitions during the period assuming amortization of upfront delivery fees using the estimated life of the related loans rather
than the original contractual maturity date of the related loans. Includes the effect of fee adjustments that are based on the price performance of Freddie Mac’s PCs relative to comparable
Fannie Mae securities. Net of legislated 10 basis point guarantee fee remitted to Treasury as part of the Temporary Payroll Tax Cut Continuation Act of 2011.

© Freddie Mac 66
Safe Harbor Statements
Freddie Mac obligations
Freddie Mac’s securities are obligations of Freddie Mac only. The securities, including any interest or return of discount on the securities, are not guaranteed by and are not debts or obligations of the United States or any federal agency or instrumentality other than Freddie Mac.
No offer or solicitation of securities
This presentation includes information related to, or referenced in the offering documentation for, certain Freddie Mac securities, including offering circulars and related supplements and agreements. Freddie Mac securities may not be eligible for offer or sale in certain jurisdictions or to certain persons. This information is provided for your general information only, is current only as of its specified date and does not constitute an offer to sell or a solicitation of an offer to buy securities. The information does not constitute a sufficient basis for making a decision with respect to the purchase or sale of any security. All information regarding or relating to Freddie Mac securities is qualified in its entirety by the relevant offering circular and any related supplements. Investors should review the relevant offering circular and any related supplements before making a decision with respect to the purchase or sale of any security. In addition, before purchasing any security, please consult your legal and financial advisors for information about and analysis of the security, its risks and its suitability as an investment in your particular circumstances.
Forward-looking statements
Freddie Mac's presentations may contain forward-looking statements, which may include statements pertaining to the conservatorship, the company’s current expectations and objectives for its Single-family Guarantee, Multifamily and Capital Markets segments, its efforts to assist the housing market, liquidity and capital management, economic and market conditions and trends, market share, the effect of legislative and regulatory developments and new accounting guidance, credit quality of loans the company guarantees, the costs and benefits of the company’s credit risk transfer transactions, and results of operations and financial condition on a GAAP, Segment Earnings, non-GAAP and fair value basis. Forward-looking statements involve known and unknown risks and uncertainties, some of which are beyond the company’s control. Management’s expectations for the company’s future necessarily involve a number of assumptions, judgments and estimates, and various factors, including changes in market conditions, liquidity, mortgage spreads, credit outlook, actions by the U.S. government (including FHFA, Treasury and Congress), and the impacts of legislation or regulations and new or amended accounting guidance, could cause actual results to differ materially from these expectations. These assumptions, judgments, estimates and factors are discussed in the company’s Annual Report on Form 10-K for the year ended December 31, 2017 and Current Reports on Form 8-K, which are available on the Investor Relations page of the company’s Web site at www.freddiemac.com/investors and the SEC’s Web site at www.sec.gov. The company undertakes no obligation to update forward-looking statements it makes to reflect events or circumstances occurring after the date of this presentation.