Embed Size (px)
Citation preview
LETTERdoi:10.1038/nature10867
Structure and dynamics of the M3 muscarinicacetylcholine receptorAndrew C. Kruse1, Jianxin Hu2, Albert C. Pan3, Daniel H. Arlow3, Daniel M. Rosenbaum4, Erica Rosemond2, Hillary F. Green3,Tong Liu2, Pil Seok Chae5, Ron O. Dror3, David E. Shaw3, William I. Weis1,6, Jurgen Wess2 & Brian K. Kobilka1
Acetylcholine, the first neurotransmitter to be identified1, exertsmany of its physiological actions via activation of a family ofG-protein-coupled receptors (GPCRs) known as muscarinicacetylcholine receptors (mAChRs). Although the five mAChRsubtypes (M1–M5) share a high degree of sequence homology, theyshow pronounced differences in G-protein coupling preferenceand the physiological responses they mediate2–4. Unfortunately,despite decades of effort, no therapeutic agents endowed with clearmAChR subtype selectivity have been developed to exploit thesedifferences5,6. We describe here the structure of the Gq/11-coupledM3 mAChR (‘M3 receptor’, from rat) bound to the bronchodilatordrug tiotropium and identify the binding mode for this clinicallyimportant drug. This structure, together with that of the Gi/o-coupled M2 receptor7, offers possibilities for the design ofmAChR subtype-selective ligands. Importantly, the M3 receptorstructure allows a structural comparison between two members ofa mammalian GPCR subfamily displaying different G-proteincoupling selectivities. Furthermore, molecular dynamics simula-tions suggest that tiotropium binds transiently to an allostericsite en route to the binding pocket of both receptors. These simula-tions offer a structural view of an allosteric binding mode for anorthosteric GPCR ligand and provide additional opportunities forthe design of ligands with different affinities or binding kinetics fordifferent mAChR subtypes. Our findings not only offer insightsinto the structure and function of one of the most important GPCRfamilies, but may also facilitate the design of improved therapeuticstargeting these critical receptors.
The mAChR family consists of five subtypes, M1–M5, which can besubdivided into two major classes (Fig. 1a). The M1, M3 and M5receptors show selectivity for G proteins of the Gq/11 family (that is,Gq and G11), whereas the M2 and M4 receptors preferentially couple toGi/o-type G proteins (Gi and Go)2–4. The development of small moleculeligands that can selectively act on specific mAChR subtypes has provenextremely challenging, primarily owing to the high degree of sequencesimilarity in the transmembrane (TM) core of these receptors2–4. Morerecently, considerable progress has been made in targeting drugs tonon-classical (allosteric) binding sites of certain mAChR subtypes5.
Within the mAChR family, the M3 subtype mediates many import-ant physiological functions, including smooth muscle contraction andglandular secretion3,4,6,8-10. Central M3 receptors have also been impli-cated in the regulation of food intake8, learning and memory9, and theproper development of the anterior pituitary gland10. Selective drugstargeted at this receptor subtype may prove clinically useful4,6,8–10, andnon-selective muscarinic ligands are already widely used in currentpractice.
Owing to the profound physiological importance of the M3 receptorand its long-standing role as a model system for understanding GPCRfunction3,11, we used the T4 lysozyme (T4L) fusion protein strategy12 to
obtain crystals of Rattus norvegicus M3 receptor–T4L fusion protein(Supplementary Fig. 1) by lipidic cubic phase crystallization. Diffractiondata from more than 70 crystals were merged to create a data set to 3.4 Aresolution and to solve the structure by molecular replacement. The M3receptor structure, together with that of the M2 receptor7, affords anopportunity to compare two closely related mammalian receptors withdivergent G-protein coupling selectivities.
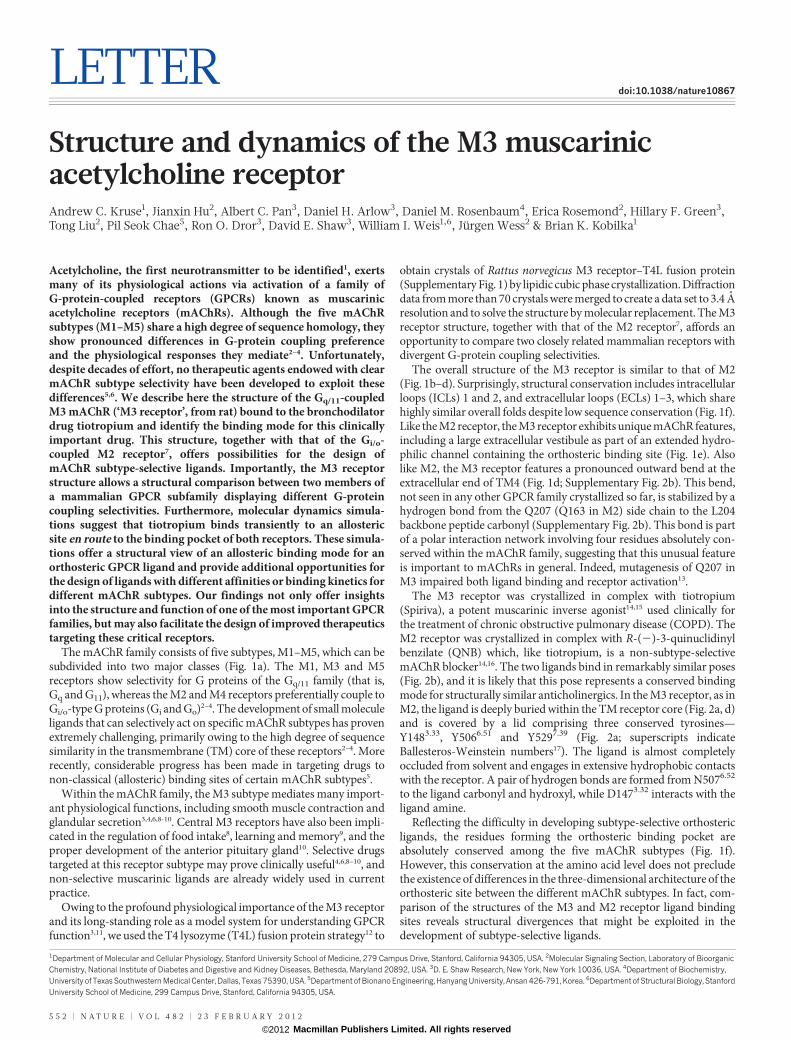
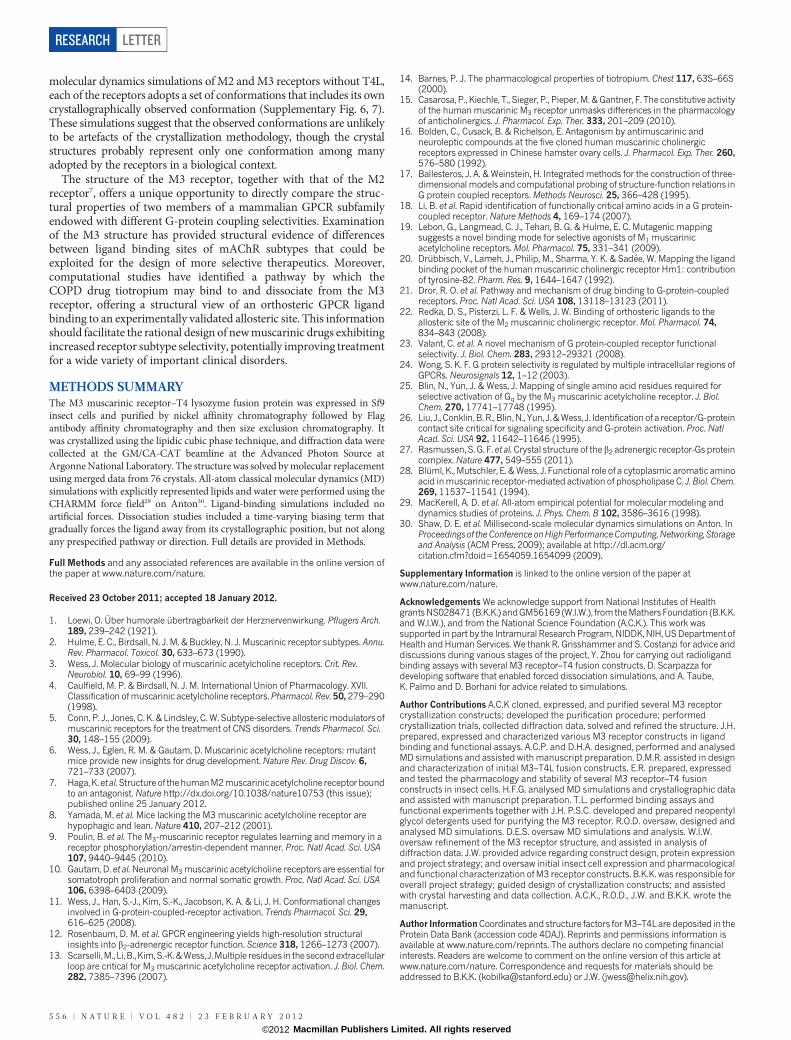
The overall structure of the M3 receptor is similar to that of M2(Fig. 1b–d). Surprisingly, structural conservation includes intracellularloops (ICLs) 1 and 2, and extracellular loops (ECLs) 1–3, which sharehighly similar overall folds despite low sequence conservation (Fig. 1f).Like the M2 receptor, the M3 receptor exhibits unique mAChR features,including a large extracellular vestibule as part of an extended hydro-philic channel containing the orthosteric binding site (Fig. 1e). Alsolike M2, the M3 receptor features a pronounced outward bend at theextracellular end of TM4 (Fig. 1d; Supplementary Fig. 2b). This bend,not seen in any other GPCR family crystallized so far, is stabilized by ahydrogen bond from the Q207 (Q163 in M2) side chain to the L204backbone peptide carbonyl (Supplementary Fig. 2b). This bond is partof a polar interaction network involving four residues absolutely con-served within the mAChR family, suggesting that this unusual featureis important to mAChRs in general. Indeed, mutagenesis of Q207 inM3 impaired both ligand binding and receptor activation13.
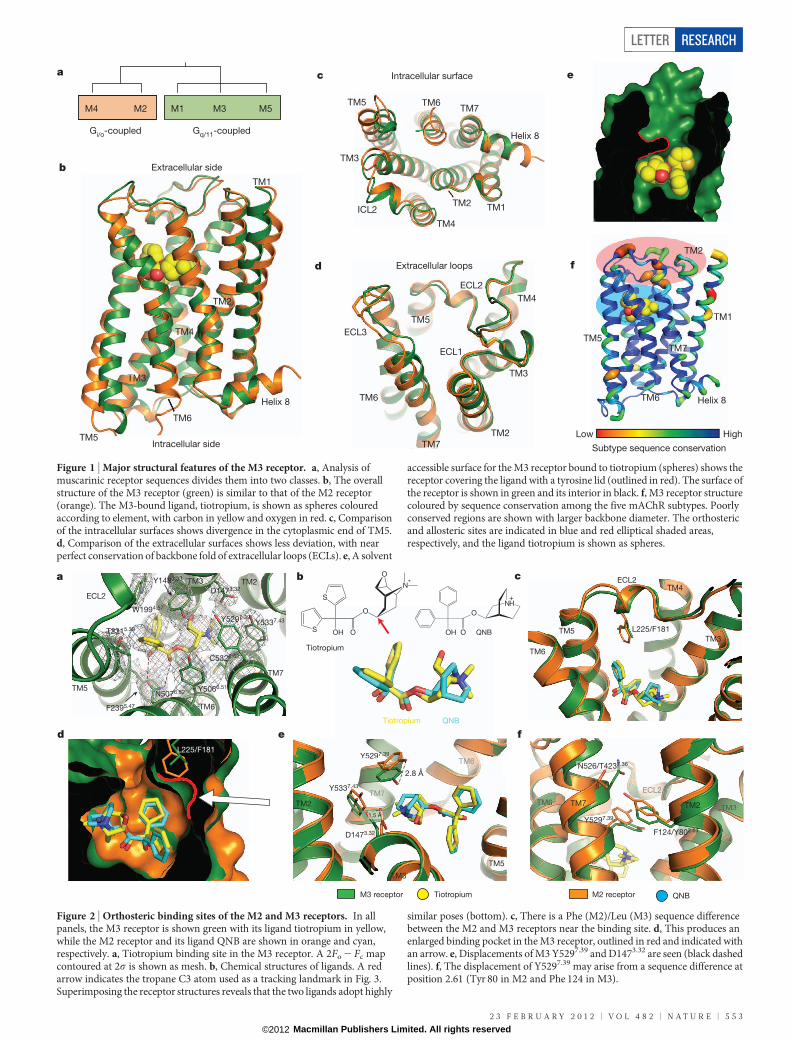
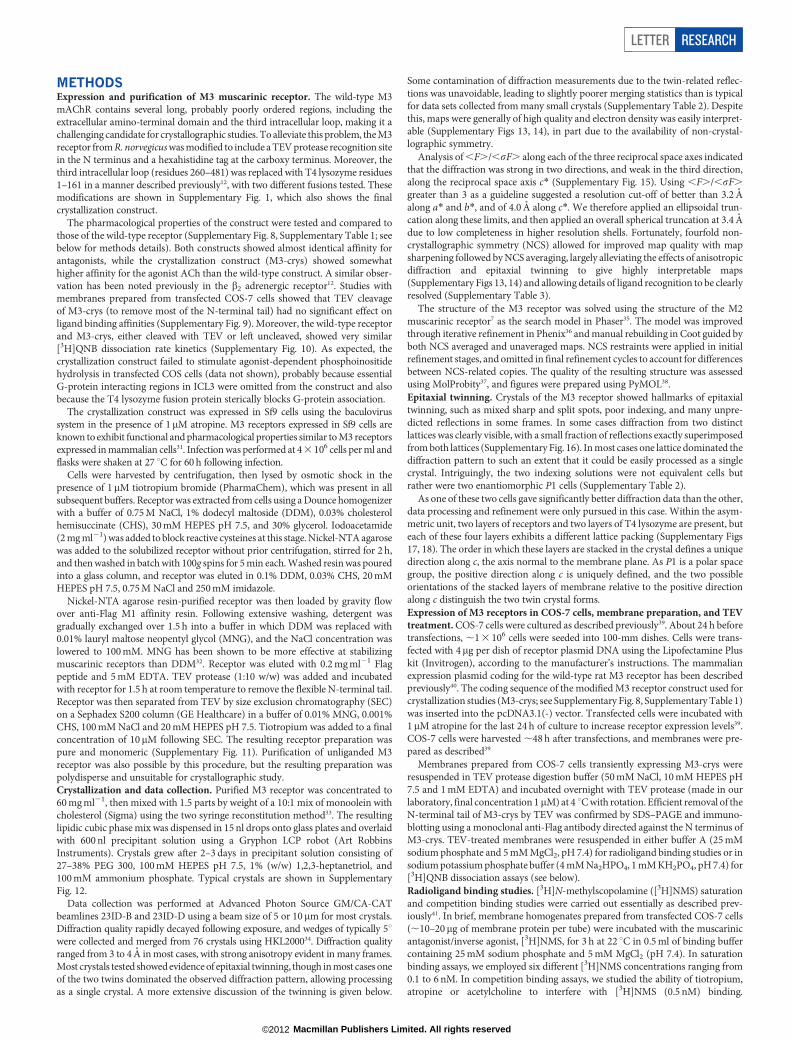
The M3 receptor was crystallized in complex with tiotropium(Spiriva), a potent muscarinic inverse agonist14,15 used clinically forthe treatment of chronic obstructive pulmonary disease (COPD). TheM2 receptor was crystallized in complex with R-(2)-3-quinuclidinylbenzilate (QNB) which, like tiotropium, is a non-subtype-selectivemAChR blocker14,16. The two ligands bind in remarkably similar poses(Fig. 2b), and it is likely that this pose represents a conserved bindingmode for structurally similar anticholinergics. In the M3 receptor, as inM2, the ligand is deeply buried within the TM receptor core (Fig. 2a, d)and is covered by a lid comprising three conserved tyrosines—Y1483.33, Y5066.51 and Y5297.39 (Fig. 2a; superscripts indicateBallesteros-Weinstein numbers17). The ligand is almost completelyoccluded from solvent and engages in extensive hydrophobic contactswith the receptor. A pair of hydrogen bonds are formed from N5076.52
to the ligand carbonyl and hydroxyl, while D1473.32 interacts with theligand amine.
Reflecting the difficulty in developing subtype-selective orthostericligands, the residues forming the orthosteric binding pocket areabsolutely conserved among the five mAChR subtypes (Fig. 1f).However, this conservation at the amino acid level does not precludethe existence of differences in the three-dimensional architecture of theorthosteric site between the different mAChR subtypes. In fact, com-parison of the structures of the M3 and M2 receptor ligand bindingsites reveals structural divergences that might be exploited in thedevelopment of subtype-selective ligands.
1Department of Molecular and Cellular Physiology, Stanford University School of Medicine, 279 Campus Drive, Stanford, California 94305, USA. 2Molecular Signaling Section, Laboratory of BioorganicChemistry, National Institute of Diabetes and Digestive and Kidney Diseases, Bethesda, Maryland 20892, USA. 3D. E. Shaw Research, New York, New York 10036, USA. 4Department of Biochemistry,University of Texas Southwestern Medical Center, Dallas, Texas 75390, USA. 5Department of Bionano Engineering, Hanyang University, Ansan 426-791, Korea. 6Department of Structural Biology, StanfordUniversity School of Medicine, 299 Campus Drive, Stanford, California 94305, USA.
5 5 2 | N A T U R E | V O L 4 8 2 | 2 3 F E B R U A R Y 2 0 1 2
Macmillan Publishers Limited. All rights reserved©2012
M3 receptor M2 receptor
a b
ECL2
TM7
TM2TM3
TM6
TM5
W1994.57
N5076.52
D1473.32
Y5297.39
Y5066.51
Y1483.33
C5327.42
Y5337.43
F2395.47
T2315.39
2.8 Å
F124/Y802.61
e f
Y5297.39
D1473.32
Y5337.43
TM77TMTMTM
TMMMM66M
TM5
TM2
TM3
Y5297.39
TM7TTTM6TM6TM6M6M666M6
ECLECLECL2ECL2
TM2 TTMTM3TTTTTT
c
d
L225/F181
TM3TM5
ECL2TM4
TM6
L225/F181Y5297.39
TMMMM66MMM
O
OS
S
OH
O
N+
QNB
Tiotropium QNB
Tiotropium
O
N
OH O
H+
1.5 Å
Tiotropium QNB
N526/T4237.36
Figure 2 | Orthosteric binding sites of the M2 and M3 receptors. In allpanels, the M3 receptor is shown green with its ligand tiotropium in yellow,while the M2 receptor and its ligand QNB are shown in orange and cyan,respectively. a, Tiotropium binding site in the M3 receptor. A 2Fo 2 Fc mapcontoured at 2s is shown as mesh. b, Chemical structures of ligands. A redarrow indicates the tropane C3 atom used as a tracking landmark in Fig. 3.Superimposing the receptor structures reveals that the two ligands adopt highly
similar poses (bottom). c, There is a Phe (M2)/Leu (M3) sequence differencebetween the M2 and M3 receptors near the binding site. d, This produces anenlarged binding pocket in the M3 receptor, outlined in red and indicated withan arrow. e, Displacements of M3 Y5297.39 and D1473.32 are seen (black dashedlines). f, The displacement of Y5297.39 may arise from a sequence difference atposition 2.61 (Tyr 80 in M2 and Phe 124 in M3).
Extracellular side
TM5
TM1
Helix 8
TM3
TM6
Intracellular side
Extracellular loops
ECL2
ECL1
ECL3
TM2
TM7
TM5
TM4
TM6
TM3
Intracellular surface
ICL2
TM5
Helix 8
TM1
TM7
TM3
TM4
TM6
TM2
Subtype sequence conservation
HighLow
a
b
c
d
e
f
M5M3M1M2M4
Gi/o-coupled Gq/11-coupled
TM2
TM4
TM1
Helix 8
TM2
TM5
TM6
TM7
Figure 1 | Major structural features of the M3 receptor. a, Analysis ofmuscarinic receptor sequences divides them into two classes. b, The overallstructure of the M3 receptor (green) is similar to that of the M2 receptor(orange). The M3-bound ligand, tiotropium, is shown as spheres colouredaccording to element, with carbon in yellow and oxygen in red. c, Comparisonof the intracellular surfaces shows divergence in the cytoplasmic end of TM5.d, Comparison of the extracellular surfaces shows less deviation, with nearperfect conservation of backbone fold of extracellular loops (ECLs). e, A solvent
accessible surface for the M3 receptor bound to tiotropium (spheres) shows thereceptor covering the ligand with a tyrosine lid (outlined in red). The surface ofthe receptor is shown in green and its interior in black. f, M3 receptor structurecoloured by sequence conservation among the five mAChR subtypes. Poorlyconserved regions are shown with larger backbone diameter. The orthostericand allosteric sites are indicated in blue and red elliptical shaded areas,respectively, and the ligand tiotropium is shown as spheres.
LETTER RESEARCH
2 3 F E B R U A R Y 2 0 1 2 | V O L 4 8 2 | N A T U R E | 5 5 3
Macmillan Publishers Limited. All rights reserved©2012
One such difference derives from the replacement of Phe 181 inECL2 of M2 with Leu 225 in M3 (this residue is leucine in allmAChRs except M2). This creates a pocket in M3 not found in M2(Fig. 2c, d). A second difference is a 2.8 A shift of Tyr5297.39 relative tothe position of the corresponding M2 residue (Tyr 426; Fig. 2e). Thisfeature may derive from a difference in the identity of the residue inposition 2.61 (Phe 124 in M3 and Tyr 80 in M2; Fig. 2f). This residueinteracts directly with TM7, influencing the position of this helix andthe residues within it, including Tyr5297.39. Notably, the residue atposition 2.61 is not a part of the orthosteric binding pocket, but ispositioned near a probable allosteric binding site7. Because tiotropiumand QNB are structurally similar but not identical, the observed bind-ing site differences must be interpreted with some degree of caution.However, site-directed mutagenesis studies with M1 and M3 receptorssupport the concept that the residue at position 2.61 plays a role inreceptor activation18,19 and ligand binding selectivity20. This site doesnot appear to play a role in determining antagonist dissociation rates,because mutation of M3 F2.61 to tyrosine or of M2 Y2.61 to phenylalaninehad no effect on dissociation rates for [3H]N-methyl scopolamine([3H]NMS) or [3H]QNB.
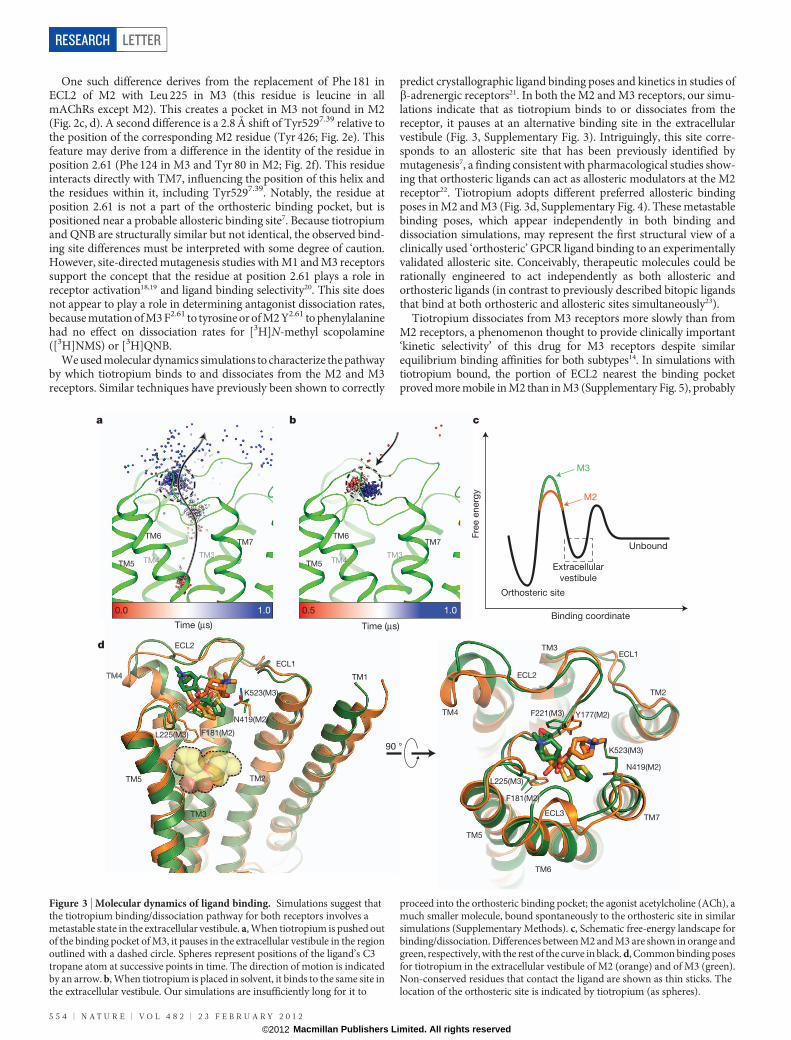
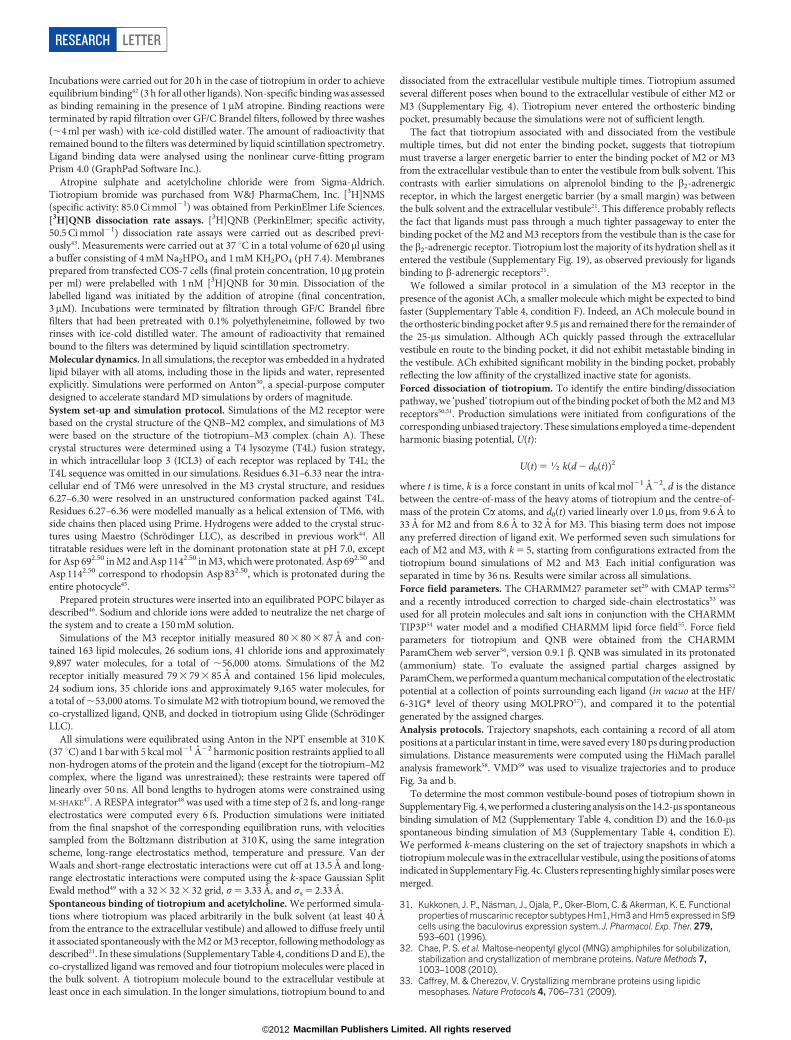
We used molecular dynamics simulations to characterize the pathwayby which tiotropium binds to and dissociates from the M2 and M3receptors. Similar techniques have previously been shown to correctly
predict crystallographic ligand binding poses and kinetics in studies ofb-adrenergic receptors21. In both the M2 and M3 receptors, our simu-lations indicate that as tiotropium binds to or dissociates from thereceptor, it pauses at an alternative binding site in the extracellularvestibule (Fig. 3, Supplementary Fig. 3). Intriguingly, this site corre-sponds to an allosteric site that has been previously identified bymutagenesis7, a finding consistent with pharmacological studies show-ing that orthosteric ligands can act as allosteric modulators at the M2receptor22. Tiotropium adopts different preferred allosteric bindingposes in M2 and M3 (Fig. 3d, Supplementary Fig. 4). These metastablebinding poses, which appear independently in both binding anddissociation simulations, may represent the first structural view of aclinically used ‘orthosteric’ GPCR ligand binding to an experimentallyvalidated allosteric site. Conceivably, therapeutic molecules could berationally engineered to act independently as both allosteric andorthosteric ligands (in contrast to previously described bitopic ligandsthat bind at both orthosteric and allosteric sites simultaneously23).
Tiotropium dissociates from M3 receptors more slowly than fromM2 receptors, a phenomenon thought to provide clinically important‘kinetic selectivity’ of this drug for M3 receptors despite similarequilibrium binding affinities for both subtypes14. In simulations withtiotropium bound, the portion of ECL2 nearest the binding pocketproved more mobile in M2 than in M3 (Supplementary Fig. 5), probably
1
90 °
Orthosteric site
Extracellular
vestibule
Unbound
Binding coordinate
M3
M2
Fre
e e
nerg
y
c
d
TM4
TM2
TM3
TM5
TM6
TM7
ECL1
ECL2
ECL3
Y177(M2)F221(M3)
L225(M3)
N419(M2)
K523(M3)
TM1
TM2TM5
TM3
ECL2
ECL1
N419(M2)
K523(M3)
1
F
0.5 1.0
b
TM3M3333333M33M33TM5
TM6TM7
TM4M4M4M444444444444
1.00.0
TM33333333333M3TM5
TM6TM7
TM4M4M4M44444444444
a
Time (μs) Time (μs)
F181(M2)
L225(M3) F181(M2)
Figure 3 | Molecular dynamics of ligand binding. Simulations suggest thatthe tiotropium binding/dissociation pathway for both receptors involves ametastable state in the extracellular vestibule. a, When tiotropium is pushed outof the binding pocket of M3, it pauses in the extracellular vestibule in the regionoutlined with a dashed circle. Spheres represent positions of the ligand’s C3tropane atom at successive points in time. The direction of motion is indicatedby an arrow. b, When tiotropium is placed in solvent, it binds to the same site inthe extracellular vestibule. Our simulations are insufficiently long for it to
proceed into the orthosteric binding pocket; the agonist acetylcholine (ACh), amuch smaller molecule, bound spontaneously to the orthosteric site in similarsimulations (Supplementary Methods). c, Schematic free-energy landscape forbinding/dissociation. Differences between M2 and M3 are shown in orange andgreen, respectively, with the rest of the curve in black. d, Common binding posesfor tiotropium in the extracellular vestibule of M2 (orange) and of M3 (green).Non-conserved residues that contact the ligand are shown as thin sticks. Thelocation of the orthosteric site is indicated by tiotropium (as spheres).
RESEARCH LETTER
5 5 4 | N A T U R E | V O L 4 8 2 | 2 3 F E B R U A R Y 2 0 1 2
Macmillan Publishers Limited. All rights reserved©2012
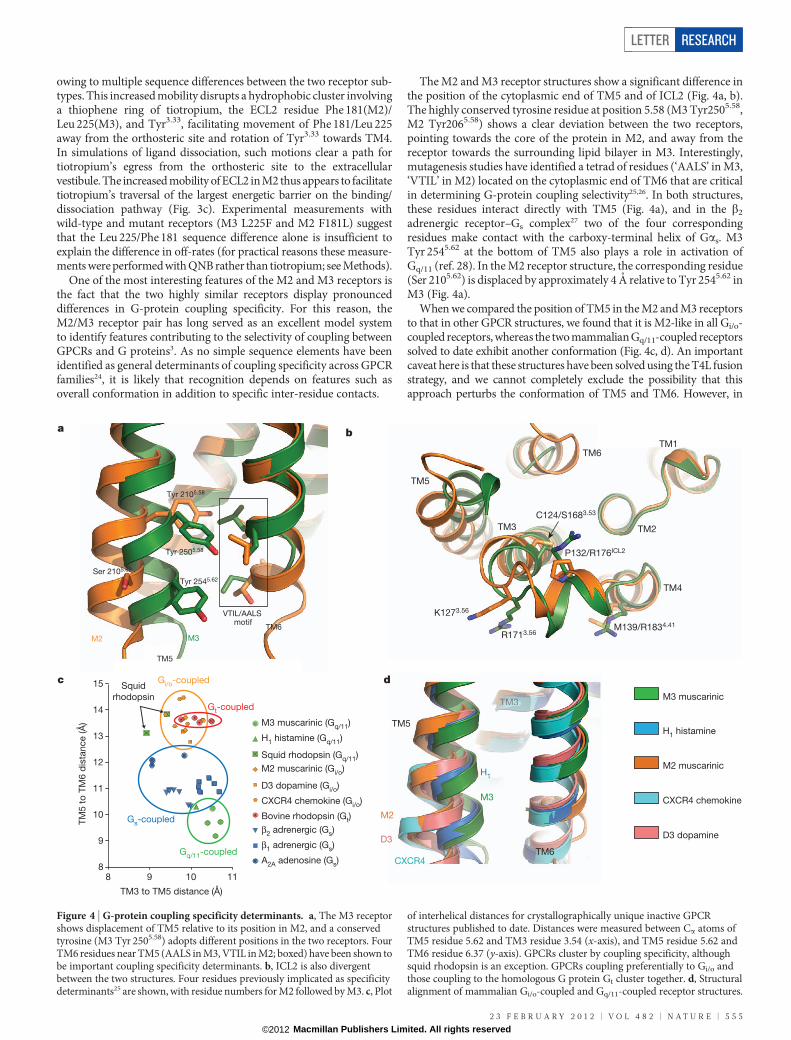
owing to multiple sequence differences between the two receptor sub-types. This increased mobility disrupts a hydrophobic cluster involvinga thiophene ring of tiotropium, the ECL2 residue Phe 181(M2)/Leu 225(M3), and Tyr3.33, facilitating movement of Phe 181/Leu 225away from the orthosteric site and rotation of Tyr3.33 towards TM4.In simulations of ligand dissociation, such motions clear a path fortiotropium’s egress from the orthosteric site to the extracellularvestibule. The increased mobility of ECL2 in M2 thus appears to facilitatetiotropium’s traversal of the largest energetic barrier on the binding/dissociation pathway (Fig. 3c). Experimental measurements withwild-type and mutant receptors (M3 L225F and M2 F181L) suggestthat the Leu 225/Phe 181 sequence difference alone is insufficient toexplain the difference in off-rates (for practical reasons these measure-ments were performed with QNB rather than tiotropium; see Methods).
One of the most interesting features of the M2 and M3 receptors isthe fact that the two highly similar receptors display pronounceddifferences in G-protein coupling specificity. For this reason, theM2/M3 receptor pair has long served as an excellent model systemto identify features contributing to the selectivity of coupling betweenGPCRs and G proteins3. As no simple sequence elements have beenidentified as general determinants of coupling specificity across GPCRfamilies24, it is likely that recognition depends on features such asoverall conformation in addition to specific inter-residue contacts.
The M2 and M3 receptor structures show a significant difference inthe position of the cytoplasmic end of TM5 and of ICL2 (Fig. 4a, b).The highly conserved tyrosine residue at position 5.58 (M3 Tyr2505.58,M2 Tyr2065.58) shows a clear deviation between the two receptors,pointing towards the core of the protein in M2, and away from thereceptor towards the surrounding lipid bilayer in M3. Interestingly,mutagenesis studies have identified a tetrad of residues (‘AALS’ in M3,‘VTIL’ in M2) located on the cytoplasmic end of TM6 that are criticalin determining G-protein coupling selectivity25,26. In both structures,these residues interact directly with TM5 (Fig. 4a), and in the b2
adrenergic receptor–Gs complex27 two of the four correspondingresidues make contact with the carboxy-terminal helix of Gas. M3Tyr 2545.62 at the bottom of TM5 also plays a role in activation ofGq/11 (ref. 28). In the M2 receptor structure, the corresponding residue(Ser 2105.62) is displaced by approximately 4 A relative to Tyr 2545.62 inM3 (Fig. 4a).
When we compared the position of TM5 in the M2 and M3 receptorsto that in other GPCR structures, we found that it is M2-like in all Gi/o-coupled receptors, whereas the two mammalian Gq/11-coupled receptorssolved to date exhibit another conformation (Fig. 4c, d). An importantcaveat here is that these structures have been solved using the T4L fusionstrategy, and we cannot completely exclude the possibility that thisapproach perturbs the conformation of TM5 and TM6. However, in
M3M2
VTIL/AALSmotif
Tyr 2505.58
M3 muscarinic
M2 muscarinic
CXCR4 chemokine
D3 dopamine
H1 histamine
TM6
TM5
M3
H1
M2
D3
CXCR4
TM5
TM6TM1
TM2TM3
TM4
C124/S1683.53
M139/R1834.41
K1273.56
P132/R176ICL2
a b
c
TM6
Tyr 2545.62
Ser 2105.62
Tyr 2105.58
R1713.56
d
TTMTM3TM3TM3M3MTT
8 9 10 118
9
10
11
12
13
14
15
TM3 to TM5 distance (Å)
TM
5 t
o T
M6 d
ista
nce (Å
)
Gq/11-coupled
Gi/o-coupled
Gs-coupled
Squid
rhodopsinGt-coupled
M3 muscarinic (Gq/11)
Squid rhodopsin (Gq/11)
H1 histamine (Gq/11)
M2 muscarinic (Gi/o)
D3 dopamine (Gi/o)
CXCR4 chemokine (Gi/o)
Bovine rhodopsin (Gt)
β2 adrenergic (Gs)
β1 adrenergic (Gs)
A2A adenosine (Gs)
TM5
Figure 4 | G-protein coupling specificity determinants. a, The M3 receptorshows displacement of TM5 relative to its position in M2, and a conservedtyrosine (M3 Tyr 2505.58) adopts different positions in the two receptors. FourTM6 residues near TM5 (AALS in M3, VTIL in M2; boxed) have been shown tobe important coupling specificity determinants. b, ICL2 is also divergentbetween the two structures. Four residues previously implicated as specificitydeterminants25 are shown, with residue numbers for M2 followed by M3. c, Plot
of interhelical distances for crystallographically unique inactive GPCRstructures published to date. Distances were measured between Ca atoms ofTM5 residue 5.62 and TM3 residue 3.54 (x-axis), and TM5 residue 5.62 andTM6 residue 6.37 (y-axis). GPCRs cluster by coupling specificity, althoughsquid rhodopsin is an exception. GPCRs coupling preferentially to Gi/o andthose coupling to the homologous G protein Gt cluster together. d, Structuralalignment of mammalian Gi/o-coupled and Gq/11-coupled receptor structures.
LETTER RESEARCH
2 3 F E B R U A R Y 2 0 1 2 | V O L 4 8 2 | N A T U R E | 5 5 5
Macmillan Publishers Limited. All rights reserved©2012
molecular dynamics simulations of M2 and M3 receptors without T4L,each of the receptors adopts a set of conformations that includes its owncrystallographically observed conformation (Supplementary Fig. 6, 7).These simulations suggest that the observed conformations are unlikelyto be artefacts of the crystallization methodology, though the crystalstructures probably represent only one conformation among manyadopted by the receptors in a biological context.
The structure of the M3 receptor, together with that of the M2receptor7, offers a unique opportunity to directly compare the struc-tural properties of two members of a mammalian GPCR subfamilyendowed with different G-protein coupling selectivities. Examinationof the M3 structure has provided structural evidence of differencesbetween ligand binding sites of mAChR subtypes that could beexploited for the design of more selective therapeutics. Moreover,computational studies have identified a pathway by which theCOPD drug tiotropium may bind to and dissociate from the M3receptor, offering a structural view of an orthosteric GPCR ligandbinding to an experimentally validated allosteric site. This informationshould facilitate the rational design of new muscarinic drugs exhibitingincreased receptor subtype selectivity, potentially improving treatmentfor a wide variety of important clinical disorders.
METHODS SUMMARYThe M3 muscarinic receptor–T4 lysozyme fusion protein was expressed in Sf9insect cells and purified by nickel affinity chromatography followed by Flagantibody affinity chromatography and then size exclusion chromatography. Itwas crystallized using the lipidic cubic phase technique, and diffraction data werecollected at the GM/CA-CAT beamline at the Advanced Photon Source atArgonne National Laboratory. The structure was solved by molecular replacementusing merged data from 76 crystals. All-atom classical molecular dynamics (MD)simulations with explicitly represented lipids and water were performed using theCHARMM force field29 on Anton30. Ligand-binding simulations included noartificial forces. Dissociation studies included a time-varying biasing term thatgradually forces the ligand away from its crystallographic position, but not alongany prespecified pathway or direction. Full details are provided in Methods.
Full Methods and any associated references are available in the online version ofthe paper at www.nature.com/nature.
Received 23 October 2011; accepted 18 January 2012.
1. Loewi, O. Uber humorale ubertragbarkeit der Herznervenwirkung. Pflugers Arch.189, 239–242 (1921).
2. Hulme, E. C., Birdsall, N. J. M. & Buckley, N. J. Muscarinic receptor subtypes. Annu.Rev. Pharmacol. Toxicol. 30, 633–673 (1990).
3. Wess, J. Molecular biology of muscarinic acetylcholine receptors. Crit. Rev.Neurobiol. 10, 69–99 (1996).
4. Caulfield, M. P. & Birdsall, N. J. M. International Union of Pharmacology. XVII.Classification of muscarinic acetylcholine receptors. Pharmacol. Rev. 50, 279–290(1998).
5. Conn, P. J., Jones, C. K. & Lindsley, C. W. Subtype-selective allosteric modulators ofmuscarinic receptors for the treatment of CNS disorders. Trends Pharmacol. Sci.30, 148–155 (2009).
6. Wess, J., Eglen, R. M. & Gautam, D. Muscarinic acetylcholine receptors: mutantmice provide new insights for drug development. Nature Rev. Drug Discov. 6,721–733 (2007).
7. Haga,K.et al. Structureof thehuman M2muscarinicacetylcholine receptorboundto an antagonist. Nature http://dx.doi.org/10.1038/nature10753 (this issue);published online 25 January 2012.
8. Yamada, M. et al. Mice lacking the M3 muscarinic acetylcholine receptor arehypophagic and lean. Nature 410, 207–212 (2001).
9. Poulin, B. et al. The M3-muscarinic receptor regulates learning and memory in areceptor phosphorylation/arrestin-dependent manner. Proc. Natl Acad. Sci. USA107, 9440–9445 (2010).
10. Gautam, D. et al. Neuronal M3 muscarinic acetylcholine receptors are essential forsomatotroph proliferation and normal somatic growth. Proc. Natl Acad. Sci. USA106, 6398–6403 (2009).
11. Wess, J., Han, S.-J., Kim, S.-K., Jacobson, K. A. & Li, J. H. Conformational changesinvolved in G-protein-coupled-receptor activation. Trends Pharmacol. Sci. 29,616–625 (2008).
12. Rosenbaum, D. M. et al. GPCR engineering yields high-resolution structuralinsights into b2-adrenergic receptor function. Science 318, 1266–1273 (2007).
13. Scarselli,M., Li, B., Kim,S.-K.&Wess, J.Multiple residues in the secondextracellularloop are critical for M3 muscarinic acetylcholine receptor activation. J. Biol. Chem.282, 7385–7396 (2007).
14. Barnes, P. J. The pharmacological properties of tiotropium. Chest 117, 63S–66S(2000).
15. Casarosa, P., Kiechle, T., Sieger, P., Pieper, M. & Gantner, F. The constitutive activityof the human muscarinic M3 receptor unmasks differences in the pharmacologyof anticholinergics. J. Pharmacol. Exp. Ther. 333, 201–209 (2010).
16. Bolden, C., Cusack, B. & Richelson, E. Antagonism by antimuscarinic andneuroleptic compounds at the five cloned human muscarinic cholinergicreceptors expressed in Chinese hamster ovary cells. J. Pharmacol. Exp. Ther. 260,576–580 (1992).
17. Ballesteros, J. A. & Weinstein, H. Integrated methods for the construction of three-dimensional models and computational probing of structure-function relations inG protein coupled receptors. Methods Neurosci. 25, 366–428 (1995).
18. Li, B. et al. Rapid identification of functionally critical amino acids in a G protein-coupled receptor. Nature Methods 4, 169–174 (2007).
19. Lebon, G., Langmead, C. J., Tehan, B. G. & Hulme, E. C. Mutagenic mappingsuggests a novel binding mode for selective agonists of M1 muscarinicacetylcholine receptors. Mol. Pharmacol. 75, 331–341 (2009).
20. Drubbisch, V., Lameh, J., Philip, M., Sharma, Y. K. & Sadee, W. Mapping the ligandbinding pocket of the human muscarinic cholinergic receptor Hm1: contributionof tyrosine-82. Pharm. Res. 9, 1644–1647 (1992).
21. Dror, R. O. et al. Pathway and mechanism of drug binding to G-protein-coupledreceptors. Proc. Natl Acad. Sci. USA 108, 13118–13123 (2011).
22. Redka, D. S., Pisterzi, L. F. & Wells, J. W. Binding of orthosteric ligands to theallosteric site of the M2 muscarinic cholinergic receptor. Mol. Pharmacol. 74,834–843 (2008).
23. Valant, C. et al. A novel mechanism of G protein-coupled receptor functionalselectivity. J. Biol. Chem. 283, 29312–29321 (2008).
24. Wong, S. K. F. G protein selectivity is regulated by multiple intracellular regions ofGPCRs. Neurosignals 12, 1–12 (2003).
25. Blin, N., Yun, J. & Wess, J. Mapping of single amino acid residues required forselective activation of Gq by the M3 muscarinic acetylcholine receptor. J. Biol.Chem. 270, 17741–17748 (1995).
26. Liu, J., Conklin, B. R., Blin,N., Yun, J.& Wess, J. Identification of a receptor/G-proteincontact site critical for signaling specificity and G-protein activation. Proc. NatlAcad. Sci. USA 92, 11642–11646 (1995).
27. Rasmussen, S. G. F. et al. Crystal structure of the b2 adrenergic receptor-Gs proteincomplex. Nature 477, 549–555 (2011).
28. Bluml, K., Mutschler, E. & Wess, J. Functional role of a cytoplasmic aromatic aminoacid in muscarinic receptor-mediated activation of phospholipase C. J. Biol. Chem.269, 11537–11541 (1994).
29. MacKerell, A. D. et al. All-atom empirical potential for molecular modeling anddynamics studies of proteins. J. Phys. Chem. B 102, 3586–3616 (1998).
30. Shaw, D. E. et al. Millisecond-scale molecular dynamics simulations on Anton. InProceedingsof theConferenceonHighPerformanceComputing,Networking, Storageand Analysis (ACM Press, 2009); available at http://dl.acm.org/citation.cfm?doid51654059.1654099 (2009).
Supplementary Information is linked to the online version of the paper atwww.nature.com/nature.
Acknowledgements We acknowledge support from National Institutes of HealthgrantsNS028471 (B.K.K.) andGM56169 (W.I.W.), fromtheMathers Foundation (B.K.K.and W.I.W.), and from the National Science Foundation (A.C.K.). This work wassupported in part by the Intramural Research Program, NIDDK, NIH, US Department ofHealth and Human Services. We thank R. Grisshammer and S. Costanzi for advice anddiscussions during various stages of the project, Y. Zhou for carrying out radioligandbinding assays with several M3 receptor–T4 fusion constructs, D. Scarpazza fordeveloping software that enabled forced dissociation simulations, and A. Taube,K. Palmo and D. Borhani for advice related to simulations.
Author Contributions A.C.K cloned, expressed, and purified several M3 receptorcrystallization constructs; developed the purification procedure; performedcrystallization trials, collected diffraction data, solved and refined the structure. J.H.prepared, expressed and characterized various M3 receptor constructs in ligandbinding and functional assays. A.C.P. and D.H.A. designed, performed and analysedMD simulations and assisted with manuscript preparation. D.M.R. assisted in designand characterization of initial M3–T4L fusion constructs. E.R. prepared, expressedand tested the pharmacology and stability of several M3 receptor–T4 fusionconstructs in insect cells. H.F.G. analysed MD simulations and crystallographic dataand assisted with manuscript preparation. T.L. performed binding assays andfunctional experiments together with J.H. P.S.C. developed and prepared neopentylglycol detergents used for purifying the M3 receptor. R.O.D. oversaw, designed andanalysed MD simulations. D.E.S. oversaw MD simulations and analysis. W.I.W.oversaw refinement of the M3 receptor structure, and assisted in analysis ofdiffraction data. J.W. provided advice regarding construct design, protein expressionand project strategy; and oversaw initial insect cell expression and pharmacologicaland functional characterization of M3 receptor constructs. B.K.K. was responsible foroverall project strategy; guided design of crystallization constructs; and assistedwith crystal harvesting and data collection. A.C.K., R.O.D., J.W. and B.K.K. wrote themanuscript.
Author Information Coordinates and structure factors for M3–T4L are deposited in theProtein Data Bank (accession code 4DAJ). Reprints and permissions information isavailable at www.nature.com/reprints. The authors declare no competing financialinterests. Readers are welcome to comment on the online version of this article atwww.nature.com/nature. Correspondence and requests for materials should beaddressed to B.K.K. ([email protected]) or J.W. ([email protected]).
RESEARCH LETTER
5 5 6 | N A T U R E | V O L 4 8 2 | 2 3 F E B R U A R Y 2 0 1 2
Macmillan Publishers Limited. All rights reserved©2012
METHODSExpression and purification of M3 muscarinic receptor. The wild-type M3mAChR contains several long, probably poorly ordered regions, including theextracellular amino-terminal domain and the third intracellular loop, making it achallenging candidate for crystallographic studies. To alleviate this problem, the M3receptor from R. norvegicus was modified to include a TEV protease recognition sitein the N terminus and a hexahistidine tag at the carboxy terminus. Moreover, thethird intracellular loop (residues 260–481) was replaced with T4 lysozyme residues1–161 in a manner described previously12, with two different fusions tested. Thesemodifications are shown in Supplementary Fig. 1, which also shows the finalcrystallization construct.
The pharmacological properties of the construct were tested and compared tothose of the wild-type receptor (Supplementary Fig. 8, Supplementary Table 1; seebelow for methods details). Both constructs showed almost identical affinity forantagonists, while the crystallization construct (M3-crys) showed somewhathigher affinity for the agonist ACh than the wild-type construct. A similar obser-vation has been noted previously in the b2 adrenergic receptor12. Studies withmembranes prepared from transfected COS-7 cells showed that TEV cleavageof M3-crys (to remove most of the N-terminal tail) had no significant effect onligand binding affinities (Supplementary Fig. 9). Moreover, the wild-type receptorand M3-crys, either cleaved with TEV or left uncleaved, showed very similar[3H]QNB dissociation rate kinetics (Supplementary Fig. 10). As expected, thecrystallization construct failed to stimulate agonist-dependent phosphoinositidehydrolysis in transfected COS cells (data not shown), probably because essentialG-protein interacting regions in ICL3 were omitted from the construct and alsobecause the T4 lysozyme fusion protein sterically blocks G-protein association.
The crystallization construct was expressed in Sf9 cells using the baculovirussystem in the presence of 1mM atropine. M3 receptors expressed in Sf9 cells areknown to exhibit functional and pharmacological properties similar to M3 receptorsexpressed in mammalian cells31. Infection was performed at 4 3 106 cells per ml andflasks were shaken at 27 uC for 60 h following infection.
Cells were harvested by centrifugation, then lysed by osmotic shock in thepresence of 1mM tiotropium bromide (PharmaChem), which was present in allsubsequent buffers. Receptor was extracted from cells using a Dounce homogenizerwith a buffer of 0.75 M NaCl, 1% dodecyl maltoside (DDM), 0.03% cholesterolhemisuccinate (CHS), 30 mM HEPES pH 7.5, and 30% glycerol. Iodoacetamide(2 mg ml21) was added to block reactive cysteines at this stage. Nickel-NTA agarosewas added to the solubilized receptor without prior centrifugation, stirred for 2 h,and then washed in batch with 100g spins for 5 min each. Washed resin was pouredinto a glass column, and receptor was eluted in 0.1% DDM, 0.03% CHS, 20 mMHEPES pH 7.5, 0.75 M NaCl and 250 mM imidazole.
Nickel-NTA agarose resin-purified receptor was then loaded by gravity flowover anti-Flag M1 affinity resin. Following extensive washing, detergent wasgradually exchanged over 1.5 h into a buffer in which DDM was replaced with0.01% lauryl maltose neopentyl glycol (MNG), and the NaCl concentration waslowered to 100 mM. MNG has been shown to be more effective at stabilizingmuscarinic receptors than DDM32. Receptor was eluted with 0.2 mg ml21 Flagpeptide and 5 mM EDTA. TEV protease (1:10 w/w) was added and incubatedwith receptor for 1.5 h at room temperature to remove the flexible N-terminal tail.Receptor was then separated from TEV by size exclusion chromatography (SEC)on a Sephadex S200 column (GE Healthcare) in a buffer of 0.01% MNG, 0.001%CHS, 100 mM NaCl and 20 mM HEPES pH 7.5. Tiotropium was added to a finalconcentration of 10mM following SEC. The resulting receptor preparation waspure and monomeric (Supplementary Fig. 11). Purification of unliganded M3receptor was also possible by this procedure, but the resulting preparation waspolydisperse and unsuitable for crystallographic study.Crystallization and data collection. Purified M3 receptor was concentrated to60 mg ml21, then mixed with 1.5 parts by weight of a 10:1 mix of monoolein withcholesterol (Sigma) using the two syringe reconstitution method33. The resultinglipidic cubic phase mix was dispensed in 15 nl drops onto glass plates and overlaidwith 600 nl precipitant solution using a Gryphon LCP robot (Art RobbinsInstruments). Crystals grew after 2–3 days in precipitant solution consisting of27–38% PEG 300, 100 mM HEPES pH 7.5, 1% (w/w) 1,2,3-heptanetriol, and100 mM ammonium phosphate. Typical crystals are shown in SupplementaryFig. 12.
Data collection was performed at Advanced Photon Source GM/CA-CATbeamlines 23ID-B and 23ID-D using a beam size of 5 or 10mm for most crystals.Diffraction quality rapidly decayed following exposure, and wedges of typically 5uwere collected and merged from 76 crystals using HKL200034. Diffraction qualityranged from 3 to 4 A in most cases, with strong anisotropy evident in many frames.Most crystals tested showed evidence of epitaxial twinning, though in most cases oneof the two twins dominated the observed diffraction pattern, allowing processingas a single crystal. A more extensive discussion of the twinning is given below.
Some contamination of diffraction measurements due to the twin-related reflec-tions was unavoidable, leading to slightly poorer merging statistics than is typicalfor data sets collected from many small crystals (Supplementary Table 2). Despitethis, maps were generally of high quality and electron density was easily interpret-able (Supplementary Figs 13, 14), in part due to the availability of non-crystal-lographic symmetry.
Analysis of ,F./,sF. along each of the three reciprocal space axes indicatedthat the diffraction was strong in two directions, and weak in the third direction,along the reciprocal space axis c* (Supplementary Fig. 15). Using ,F./,sF.
greater than 3 as a guideline suggested a resolution cut-off of better than 3.2 Aalong a* and b*, and of 4.0 A along c*. We therefore applied an ellipsoidal trun-cation along these limits, and then applied an overall spherical truncation at 3.4 Adue to low completeness in higher resolution shells. Fortunately, fourfold non-crystallographic symmetry (NCS) allowed for improved map quality with mapsharpening followed by NCS averaging, largely alleviating the effects of anisotropicdiffraction and epitaxial twinning to give highly interpretable maps(Supplementary Figs 13, 14) and allowing details of ligand recognition to be clearlyresolved (Supplementary Table 3).
The structure of the M3 receptor was solved using the structure of the M2muscarinic receptor7 as the search model in Phaser35. The model was improvedthrough iterative refinement in Phenix36 and manual rebuilding in Coot guided byboth NCS averaged and unaveraged maps. NCS restraints were applied in initialrefinement stages, and omitted in final refinement cycles to account for differencesbetween NCS-related copies. The quality of the resulting structure was assessedusing MolProbity37, and figures were prepared using PyMOL38.Epitaxial twinning. Crystals of the M3 receptor showed hallmarks of epitaxialtwinning, such as mixed sharp and split spots, poor indexing, and many unpre-dicted reflections in some frames. In some cases diffraction from two distinctlattices was clearly visible, with a small fraction of reflections exactly superimposedfrom both lattices (Supplementary Fig. 16). In most cases one lattice dominated thediffraction pattern to such an extent that it could be easily processed as a singlecrystal. Intriguingly, the two indexing solutions were not equivalent cells butrather were two enantiomorphic P1 cells (Supplementary Table 2).
As one of these two cells gave significantly better diffraction data than the other,data processing and refinement were only pursued in this case. Within the asym-metric unit, two layers of receptors and two layers of T4 lysozyme are present, buteach of these four layers exhibits a different lattice packing (Supplementary Figs17, 18). The order in which these layers are stacked in the crystal defines a uniquedirection along c, the axis normal to the membrane plane. As P1 is a polar spacegroup, the positive direction along c is uniquely defined, and the two possibleorientations of the stacked layers of membrane relative to the positive directionalong c distinguish the two twin crystal forms.Expression of M3 receptors in COS-7 cells, membrane preparation, and TEVtreatment. COS-7 cells were cultured as described previously39. About 24 h beforetransfections, ,1 3 106 cells were seeded into 100-mm dishes. Cells were trans-fected with 4mg per dish of receptor plasmid DNA using the Lipofectamine Pluskit (Invitrogen), according to the manufacturer’s instructions. The mammalianexpression plasmid coding for the wild-type rat M3 receptor has been describedpreviously40. The coding sequence of the modified M3 receptor construct used forcrystallization studies (M3-crys; see Supplementary Fig. 8, Supplementary Table 1)was inserted into the pcDNA3.1(-) vector. Transfected cells were incubated with1mM atropine for the last 24 h of culture to increase receptor expression levels39.COS-7 cells were harvested ,48 h after transfections, and membranes were pre-pared as described39
Membranes prepared from COS-7 cells transiently expressing M3-crys wereresuspended in TEV protease digestion buffer (50 mM NaCl, 10 mM HEPES pH7.5 and 1 mM EDTA) and incubated overnight with TEV protease (made in ourlaboratory, final concentration 1mM) at 4 uC with rotation. Efficient removal of theN-terminal tail of M3-crys by TEV was confirmed by SDS–PAGE and immuno-blotting using a monoclonal anti-Flag antibody directed against the N terminus ofM3-crys. TEV-treated membranes were resuspended in either buffer A (25 mMsodium phosphate and 5 mM MgCl2, pH 7.4) for radioligand binding studies or insodium potassium phosphate buffer (4 mM Na2HPO4, 1 mM KH2PO4, pH 7.4) for[3H]QNB dissociation assays (see below).Radioligand binding studies. [3H]N-methylscopolamine ([3H]NMS) saturationand competition binding studies were carried out essentially as described prev-iously41. In brief, membrane homogenates prepared from transfected COS-7 cells(,10–20mg of membrane protein per tube) were incubated with the muscarinicantagonist/inverse agonist, [3H]NMS, for 3 h at 22 uC in 0.5 ml of binding buffercontaining 25 mM sodium phosphate and 5 mM MgCl2 (pH 7.4). In saturationbinding assays, we employed six different [3H]NMS concentrations ranging from0.1 to 6 nM. In competition binding assays, we studied the ability of tiotropium,atropine or acetylcholine to interfere with [3H]NMS (0.5 nM) binding.
LETTER RESEARCH
Macmillan Publishers Limited. All rights reserved©2012
Incubations were carried out for 20 h in the case of tiotropium in order to achieveequilibrium binding42 (3 h for all other ligands). Non-specific binding was assessedas binding remaining in the presence of 1mM atropine. Binding reactions wereterminated by rapid filtration over GF/C Brandel filters, followed by three washes(,4 ml per wash) with ice-cold distilled water. The amount of radioactivity thatremained bound to the filters was determined by liquid scintillation spectrometry.Ligand binding data were analysed using the nonlinear curve-fitting programPrism 4.0 (GraphPad Software Inc.).
Atropine sulphate and acetylcholine chloride were from Sigma-Aldrich.Tiotropium bromide was purchased from W&J PharmaChem, Inc. [3H]NMS(specific activity: 85.0 Ci mmol21) was obtained from PerkinElmer Life Sciences.[3H]QNB dissociation rate assays. [3H]QNB (PerkinElmer; specific activity,50.5 Ci mmol21) dissociation rate assays were carried out as described previ-ously43. Measurements were carried out at 37 uC in a total volume of 620ml usinga buffer consisting of 4 mM Na2HPO4 and 1 mM KH2PO4 (pH 7.4). Membranesprepared from transfected COS-7 cells (final protein concentration, 10mg proteinper ml) were prelabelled with 1 nM [3H]QNB for 30 min. Dissociation of thelabelled ligand was initiated by the addition of atropine (final concentration,3mM). Incubations were terminated by filtration through GF/C Brandel fibrefilters that had been pretreated with 0.1% polyethyleneimine, followed by tworinses with ice-cold distilled water. The amount of radioactivity that remainedbound to the filters was determined by liquid scintillation spectrometry.Molecular dynamics. In all simulations, the receptor was embedded in a hydratedlipid bilayer with all atoms, including those in the lipids and water, representedexplicitly. Simulations were performed on Anton30, a special-purpose computerdesigned to accelerate standard MD simulations by orders of magnitude.System set-up and simulation protocol. Simulations of the M2 receptor werebased on the crystal structure of the QNB–M2 complex, and simulations of M3were based on the structure of the tiotropium–M3 complex (chain A). Thesecrystal structures were determined using a T4 lysozyme (T4L) fusion strategy,in which intracellular loop 3 (ICL3) of each receptor was replaced by T4L; theT4L sequence was omitted in our simulations. Residues 6.31–6.33 near the intra-cellular end of TM6 were unresolved in the M3 crystal structure, and residues6.27–6.30 were resolved in an unstructured conformation packed against T4L.Residues 6.27–6.36 were modelled manually as a helical extension of TM6, withside chains then placed using Prime. Hydrogens were added to the crystal struc-tures using Maestro (Schrodinger LLC), as described in previous work44. Alltitratable residues were left in the dominant protonation state at pH 7.0, exceptfor Asp 692.50 in M2 and Asp 1142.50 in M3, which were protonated. Asp 692.50 andAsp 1142.50 correspond to rhodopsin Asp 832.50, which is protonated during theentire photocycle45.
Prepared protein structures were inserted into an equilibrated POPC bilayer asdescribed46. Sodium and chloride ions were added to neutralize the net charge ofthe system and to create a 150 mM solution.
Simulations of the M3 receptor initially measured 80 3 80 3 87 A and con-tained 163 lipid molecules, 26 sodium ions, 41 chloride ions and approximately9,897 water molecules, for a total of ,56,000 atoms. Simulations of the M2receptor initially measured 79 3 79 3 85 A and contained 156 lipid molecules,24 sodium ions, 35 chloride ions and approximately 9,165 water molecules, fora total of ,53,000 atoms. To simulate M2 with tiotropium bound, we removed theco-crystallized ligand, QNB, and docked in tiotropium using Glide (SchrodingerLLC).
All simulations were equilibrated using Anton in the NPT ensemble at 310 K(37 uC) and 1 bar with 5 kcal mol21 A22 harmonic position restraints applied to allnon-hydrogen atoms of the protein and the ligand (except for the tiotropium–M2complex, where the ligand was unrestrained); these restraints were tapered offlinearly over 50 ns. All bond lengths to hydrogen atoms were constrained usingM-SHAKE47. A RESPA integrator48 was used with a time step of 2 fs, and long-rangeelectrostatics were computed every 6 fs. Production simulations were initiatedfrom the final snapshot of the corresponding equilibration runs, with velocitiessampled from the Boltzmann distribution at 310 K, using the same integrationscheme, long-range electrostatics method, temperature and pressure. Van derWaals and short-range electrostatic interactions were cut off at 13.5 A and long-range electrostatic interactions were computed using the k-space Gaussian SplitEwald method49 with a 32 3 32 3 32 grid, s 5 3.33 A, and ss 5 2.33 A.Spontaneous binding of tiotropium and acetylcholine. We performed simula-tions where tiotropium was placed arbitrarily in the bulk solvent (at least 40 Afrom the entrance to the extracellular vestibule) and allowed to diffuse freely untilit associated spontaneously with the M2 or M3 receptor, following methodology asdescribed21. In these simulations (Supplementary Table 4, conditions D and E), theco-crystallized ligand was removed and four tiotropium molecules were placed inthe bulk solvent. A tiotropium molecule bound to the extracellular vestibule atleast once in each simulation. In the longer simulations, tiotropium bound to and
dissociated from the extracellular vestibule multiple times. Tiotropium assumedseveral different poses when bound to the extracellular vestibule of either M2 orM3 (Supplementary Fig. 4). Tiotropium never entered the orthosteric bindingpocket, presumably because the simulations were not of sufficient length.
The fact that tiotropium associated with and dissociated from the vestibulemultiple times, but did not enter the binding pocket, suggests that tiotropiummust traverse a larger energetic barrier to enter the binding pocket of M2 or M3from the extracellular vestibule than to enter the vestibule from bulk solvent. Thiscontrasts with earlier simulations on alprenolol binding to the b2-adrenergicreceptor, in which the largest energetic barrier (by a small margin) was betweenthe bulk solvent and the extracellular vestibule21. This difference probably reflectsthe fact that ligands must pass through a much tighter passageway to enter thebinding pocket of the M2 and M3 receptors from the vestibule than is the case forthe b2-adrenergic receptor. Tiotropium lost the majority of its hydration shell as itentered the vestibule (Supplementary Fig. 19), as observed previously for ligandsbinding to b-adrenergic receptors21.
We followed a similar protocol in a simulation of the M3 receptor in thepresence of the agonist ACh, a smaller molecule which might be expected to bindfaster (Supplementary Table 4, condition F). Indeed, an ACh molecule bound inthe orthosteric binding pocket after 9.5ms and remained there for the remainder ofthe 25-ms simulation. Although ACh quickly passed through the extracellularvestibule en route to the binding pocket, it did not exhibit metastable binding inthe vestibule. ACh exhibited significant mobility in the binding pocket, probablyreflecting the low affinity of the crystallized inactive state for agonists.Forced dissociation of tiotropium. To identify the entire binding/dissociationpathway, we ‘pushed’ tiotropium out of the binding pocket of both the M2 and M3receptors50,51. Production simulations were initiated from configurations of thecorresponding unbiased trajectory. These simulations employed a time-dependentharmonic biasing potential, U(t):
U(t) 5 K k(d 2 d0(t))2
where t is time, k is a force constant in units of kcal mol21 A22, d is the distancebetween the centre-of-mass of the heavy atoms of tiotropium and the centre-of-mass of the protein Ca atoms, and d0(t) varied linearly over 1.0ms, from 9.6 A to33 A for M2 and from 8.6 A to 32 A for M3. This biasing term does not imposeany preferred direction of ligand exit. We performed seven such simulations foreach of M2 and M3, with k 5 5, starting from configurations extracted from thetiotropium bound simulations of M2 and M3. Each initial configuration wasseparated in time by 36 ns. Results were similar across all simulations.Force field parameters. The CHARMM27 parameter set29 with CMAP terms52
and a recently introduced correction to charged side-chain electrostatics53 wasused for all protein molecules and salt ions in conjunction with the CHARMMTIP3P54 water model and a modified CHARMM lipid force field55. Force fieldparameters for tiotropium and QNB were obtained from the CHARMMParamChem web server56, version 0.9.1 b. QNB was simulated in its protonated(ammonium) state. To evaluate the assigned partial charges assigned byParamChem, we performed a quantum mechanical computation of the electrostaticpotential at a collection of points surrounding each ligand (in vacuo at the HF/6-31G* level of theory using MOLPRO57), and compared it to the potentialgenerated by the assigned charges.Analysis protocols. Trajectory snapshots, each containing a record of all atompositions at a particular instant in time, were saved every 180 ps during productionsimulations. Distance measurements were computed using the HiMach parallelanalysis framework58. VMD59 was used to visualize trajectories and to produceFig. 3a and b.
To determine the most common vestibule-bound poses of tiotropium shown inSupplementary Fig. 4, we performed a clustering analysis on the 14.2-ms spontaneousbinding simulation of M2 (Supplementary Table 4, condition D) and the 16.0-msspontaneous binding simulation of M3 (Supplementary Table 4, condition E).We performed k-means clustering on the set of trajectory snapshots in which atiotropium molecule was in the extracellular vestibule, using the positions of atomsindicated in Supplementary Fig. 4c. Clusters representing highly similar poses weremerged.
31. Kukkonen, J. P., Nasman, J., Ojala, P., Oker-Blom, C. & Akerman, K. E. Functionalproperties of muscarinic receptor subtypesHm1, Hm3and Hm5expressed in Sf9cells using the baculovirus expression system. J. Pharmacol. Exp. Ther. 279,593–601 (1996).
32. Chae, P. S. et al. Maltose-neopentyl glycol (MNG) amphiphiles for solubilization,stabilization and crystallization of membrane proteins. Nature Methods 7,1003–1008 (2010).
33. Caffrey, M. & Cherezov, V. Crystallizing membrane proteins using lipidicmesophases. Nature Protocols 4, 706–731 (2009).
RESEARCH LETTER
Macmillan Publishers Limited. All rights reserved©2012
34. Otwinowski, Z. & Minor, W. in Methods Enzymology Vol. 276 (ed. Carter, C. W. Jr)307–326 (Academic, 1997).
35. McCoy, A. J.et al.Phasercrystallographic software. J. Appl. Crystallogr.40, 658–674(2007).
36. Adams, P. D. et al. PHENIX: a comprehensive Python-based system formacromolecular structure solution. Acta Crystallogr. D 66, 213–221 (2010).
37. Davis, I. W., Murray, L. W., Richardson, J. S. & Richardson, D. C. MolProbity:structure validation and all-atom contact analysis for nucleic acids and theircomplexes. Nucleic Acids Res. 32, W615–W619 (2004).
38. Schrodinger, L. L. C.The PyMOL Molecular Graphics System, Version 1.3r1 (2010).39. Ward, S. D., Hamdan, F. F., Bloodworth, L. M. & Wess, J. Conformational changes
that occur during M3 muscarinic acetylcholine receptor activation probed by theuse of an in situ disulfide cross-linking strategy. J. Biol. Chem. 277, 2247–2257(2002).
40. Bonner, T. I., Buckley, N. J., Young, A. C. & Brann, M. R. Identification of a family ofmuscarinic acetylcholine receptor genes. Science 237, 527–532 (1987).
41. Han, S.-J.et al. Pronouncedconformational changes following agonist activation ofthe M3 muscarinic acetylcholine receptor. J. Biol. Chem. 280, 24870–24879(2005).
42. Dowling,M.R.&Charlton, S. J.Quantifying theassociationanddissociation ratesofunlabelled antagonists at the muscarinic M3 receptor. Br. J. Pharmacol. 148,927–937 (2006).
43. Ellis, J., Huyler, J. & Brann, M. R. Allosteric regulation of cloned m1-m5 muscarinicreceptor subtypes. Biochem. Pharmacol. 42, 1927–1932 (1991).
44. Dror, R. O. et al. Identification of two distinct inactive conformations of theb2-adrenergic receptor reconciles structural and biochemical observations. Proc.Natl Acad. Sci. USA 106, 4689–4694 (2009).
45. Fahmy, K. et al. Protonation states of membrane-embedded carboxylic acidgroups in rhodopsin and metarhodopsin II: a Fourier-transform infraredspectroscopy study of site-directed mutants. Proc. Natl Acad. Sci. USA 90,10206–10210 (1993).
46. Rosenbaum, D. M. et al. Structure and function of an irreversible agonist-b2
adrenoceptor complex. Nature 469, 236–240 (2011).
47. Krautler, V., van Gunsteren, W. F. & Hunenberger, P. H. A fast SHAKE algorithm tosolve distance constraint equations for small molecules in molecular dynamicssimulations. J. Comput. Chem. 22, 501–508 (2001).
48. Tuckerman, M., Berne, B. J. & Martyna, G. J. Reversible multiple time scalemolecular dynamics. J. Chem. Phys. 97, 1990–2001 (1992).
49. Shan, Y., Klepeis, J. L., Eastwood, M. P., Dror, R. O. & Shaw, D. E. Gaussian splitEwald: A fast Ewald mesh method for molecular simulation. J. Chem. Phys. 122,54101 (2005).
50. Grubmuller, H., Heymann, B. & Tavan, P. Ligand binding: molecular mechanicscalculation of the streptavidin-biotin rupture force. Science 271, 997–999 (1996).
51. Izrailev, S. et al. Molecular dynamics study of unbinding of the avidin-biotincomplex. Biophys. J. 72, 1568–1581 (1997).
52. Mackerell, A. D. Jr, Feig, M. & Brooks, C. L. III. Extending the treatment of backboneenergetics in protein force fields: limitations of gas-phase quantum mechanics inreproducing protein conformational distributions in molecular dynamicssimulations. J. Comput. Chem. 25, 1400–1415 (2004).
53. Piana, S., Lindorff-Larsen, K. & Shaw, D. E. How robust are protein foldingsimulations with respect to force field parameterization? Biophys. J. 100, L47–L49(2011).
54. Beglov, D. & Roux, B. Finite representation of an infinite bulk system: solventboundary potential for computer simulations. J. Chem. Phys. 100, 9050–9063(1994).
55. Klauda, J. B. et al. Update of the CHARMM all-atom additive force field for lipids:validation on six lipid types. J. Phys. Chem. B 114, 7830–7843 (2010).
56. Vanommeslaeghe, K. et al. CHARMM general force field: a force field for drug-likemolecules compatible with the CHARMM all-atom additive biological force fields.J. Comput. Chem. 31, 671–690 (2010).
57. Werner, H.-J. et al. MOLPRO, version 2010.1 (Cardiff University, UK, 2010).58. Tu, T. et al. A scalable parallel framework for analyzing terascale molecular
dynamics simulation trajectories. InProceedingsof the2008ACM/IEEEConferenceon Supercomputing (ACM Press, 2008); available at http://dl.acm.org/citation.cfm?id51413427 (2008).
59. Humphrey, W., Dalke, A. & Schulten, K. VMD: visual molecular dynamics. J. Mol.Graph. 14, 33–38 (1996).
LETTER RESEARCH
Macmillan Publishers Limited. All rights reserved©2012