Embed Size (px)
Citation preview

Structural Examination of Easel Paintings withOptical Coherence Tomography
PIOTR TARGOWSKI,*,† MAGDALENA IWANICKA,†
LUDMIŁA TYMINSKA-WIDMER,‡ MARCIN SYLWESTRZAK,† ANDEWA A. KWIATKOWSKA†
†Institute of Physics, Nicolaus Copernicus University, ul. Grudziadzka 5,87-100 Torun, Poland, ‡Institute for the Study, Restoration and Conservation of
Cultural Heritage, Nicolaus Copernicus University, ul. Gagarina 7,87-100 Torun, Poland
RECEIVED ON JULY 6, 2009
�w This paper contains enhanced objects available on the Internet at http://pubs.acs.org/acr.
C O N S P E C T U S
Identification of the order, thickness, composition,and possibly the origin of the paint layers form-
ing the structure of a painting, that is, its stratig-raphy, is important in confirming its attribution andhistory as well as planning conservation treatments.The most common method of examination is anal-ysis of a sample collected from the art object, bothvisually with a microscope and instrumentallythrough a variety of sophisticated, modern analyt-ical tools. Because of its invasiveness, however, sampling is less than ideally compatible with conservation ethics; itis severely restricted with respect to the amount of material extirpated from the artwork. Sampling is also rather lim-ited in that it provides only very local information. There is, therefore, a great need for a noninvasive method withsufficient in-depth resolution for resolving the stratigraphy of works of art.
Optical coherence tomography (OCT) is a noninvasive, noncontact method of optical sectioning of partially trans-parent objects, with micrometer-level axial resolution. The method utilizes near-infrared light of low intensity (a fewmilliwatts) to obtain cross-sectional images of various objects; it has been mostly used in medical diagnostics. Throughthe serial collection of many such images, volume information may be extracted. The application of OCT to the exam-ination of art objects has been in development since 2003.
In this Account, we present a short introduction to the technique, briefly discuss the apparatus we use, and pro-vide a paradigm for reading OCT tomograms. Unlike the majority of papers published previously, this Account focuseson one, very specific, use of OCT. We then consider two examples of successful, practical application of the tech-nique. At the request of a conservation studio, the characteristics of inscriptions on two oil paintings, originating fromthe 18th and 19th centuries, were analyzed. In the first case, it was possible to resolve some questions concerningthe history of the work. From an analysis of the positions of the paint layers involved in three inscriptions in rela-tion to other strata of the painting, the order of events in its history was resolved. It was evident that the originaltext had been overpainted and that the other inscriptions were added later, thus providing convincing evidence as tothe painting’s true date of creation. In the second example, a painting was analyzed with the aim of confirming thepossibility of forgery of the artist’s signature, and evidence strongly supporting this supposition is presented.
These two specific examples of successful use of the technique on paintings further demonstrate how OCT may be readily adapt-able to other similar tasks, such as in the fields of forensic or materials science. In a synergistic approach, in which informationis obtained with a variety of noninvasive techniques, OCT is demonstrably effective and offers great potential for furtherdevelopment.
Vol. xxx, No. xx Month XXXX 000 ACCOUNTS OF CHEMICAL RESEARCH Awww.pubs.acs.org/acr10.1021/ar900195d © XXXX American Chemical Society
IntroductionEasel paintings, especially when prepared according to tradi-
tional techniques, are multilayered structures. A support, usu-
ally stretched canvas or a wooden panel, is covered with glue
size, and then primed in order to smooth its surface and to
ensure proper adhesion of the consecutive layers. The com-
position may be outlined in an underdrawing executed by one
of various techniques, and then the opaque paint layers are
applied. To obtain a desirable visual effect, an additional cover
of one or more layers of semitransparent glazes and finally a
transparent varnish may be added. Apart from the obvious
protective function of the varnish, it has a very important effect
on the final appearance of the artwork.1,2 Additionally in
many cases, this primary structure may be modified by alter-
ations introduced by the artists themselves or commissioned
by later owners. Among these, traces of previous renovation
treatments, for example, overpaintings, are particularly impor-
tant to detect. Another separate group of interventions in the
structure of the artwork are various kinds of forgeries, some-
times committed many years or even one or more centuries
ago and having their own history.
For conservation or inventory purposes, it is very impor-
tant to reveal the stratigraphy, that is, the order, thickness,
composition, and possibly the origin, of the layers building up
the painting’s structure. This knowledge is important in con-
firming the attribution and history of the artwork and is also
essential for the planning of future conservation treatments.
For these reasons, the attention of art historians and conser-
vators has long been focused on methods of obtaining such
information. The most common approach has been, and still
largely is, to collect a small sample, embed it in resin, and
then analyze its cross section under the microscope. At
present, in addition to or replacing classical microchemical
analysis,3 a wide range of microspectroscopic methods, for
example, micro-Raman (µRaman), micro-infrared Fourier trans-
form (µFTIR), micro-X-ray fluorescence (µXRF), scanning elec-
tron microscopic energy-dispersive X-ray (SEM-EDX), and
particle-induced X-ray emission (PIXE) spectroscopies, is used
to better understand artwork composition throughout exam-
ination of the sample.4
However, despite the fact that the results obtained in this
way have been and to a large extent still are usually consid-
ered the most unequivocal, there are two disadvantages to
this approach. First, sampling is rightly regarded as invasive,
and so its application is strictly limited by conservation eth-
ics. Usually it is allowed to be performed only within an area
of former damage, where collecting material would have a
negligible impact on the final condition of the artwork. There-
fore, information collected this way must be considered rather
random and not necessarily representative of the object as a
whole. In addition, the results obtained from sampling in the
area of destruction must of necessity be interpreted with
extreme care, since the structure of the object in this very
place could have already been more or less heavily perturbed
by the damage. The second disadvantage of sampling meth-
odologies lies in their local character: the information gained
is always specific to the site of sampling, since the structure of
the painting, especially the thickness of particular layers, may
vary rapidly5 across even fairly small regions.
All of these limitations have long been known, and in
response, alternative noninvasive investigations have gained
significant attention. Paintings are X-rayed to detect alterations
and traces of former compositions covered by later superim-
posed additions. The inspection of paintings by means of UV-
excited fluorescence has also become very popular: not only
may old paint and varnish layers (fluorescent) be distinguished
from new ones (nonfluorescent),6 but the chemical composi-
tion of the varnish may be revealed due to the characteristic
fluorescence exhibited by some of its ingredients.7 Visual
inspection of UV-excited fluorescence may also indicate the
presence of certain pigments in the paint layer.1 Another tech-
nique used for pigment identification is reflectance spectros-
copy in visible light.8 The significant transparency of many
pigments to infrared light permits utilization of IR radiation in
the wavelength range 0.7 to 7 µm9,10 to reveal under-
drawings.
The methods described above allow general diagnoses of
paintings for the purpose of resolving causes of their deteri-
oration and to detect damaged regions as well as areas of
former conservation treatments. Information on the location of
underdrawings, on regions of previous restorations, on the
thickness of paint layers, and on the presence of delamina-
tions can also be obtained through various thermographic
inspection techniques, including pulsed phase thermography
(PPT).10 The identification of delaminations may also be
achieved through air-coupled ultrasound echo detection.11
Holographic interferometry techniques provide information on
bulk structural faults and mechanical discontinuities in a piece
of artwork.12 All these noninvasive methods, as well as mod-
ern structurally resolving ones like XRF (see above) or CT
(computed tomography) either are only sensitive to surface
properties or do not have sufficient spatial resolution to be
useful for structures with an overall thickness of only a frac-
tion of a millimeter: the resulting information comprises an
overlap of that from all different depths.
Structural Examination of Easel Paintings with OCT Targowski et al.
B ACCOUNTS OF CHEMICAL RESEARCH 000 Month XXXX Vol. xxx, No. xx

This Account is devoted to a novel technique, optical coher-
ence tomography (OCT), for high-resolution structural imag-
ing, operational in conservation science since 2003.13 OCT
uses low-power light in the spectral range of 700 to 1500 nm
to probe structure noninvasively from a distance of a few cen-
timeters, in order to provide detailed micrometer-resolved
information on its cross section, and thus stratigraphy, in a
purely optical, noncontact, noninvasive, and nondestructive
way.
The major drawback to practical application of OCT in the
examination of artwork arises from the limited transparency
of the strata examined to the light used. However, layers like
varnishes and glazes, usually semitransparent and thereby
decisive for aesthetic impression, may readily be successfully
tested in this way. In addition, the very high sensitivity of
modern OCT modalities enables the collection of signals from
deeper structures.
Until now, OCT has been employed in the investigation
and conservation of artwork to examine varnish and glaze lay-
ers of easel paintings,14-18 analyze underdrawings,15 exam-
ine historic jades,19 ceramics, and glass objects,20,21 inspect
atmospheric corrosion of stained glass,22 and precisely image
punchwork.23 Another group of applications is related to mon-
itoring various dynamic processes such as the drying of a var-
nish layer,24,25 laser ablation of varnish,26-28 and the tracing
of environmentally induced deformations of paintings on
canvas.29
In this Account, the application of OCT to investigation of
the structure of easel paintings is revisited and extended to
more practical aspects. Using examples of oil paintings from
a conservation studio, it will be shown how information
obtained with OCT may be used to verify their history and
authenticity.
MethodologyThe OCT technique originates from diagnostic medicine30 and
at present is used mostly in ophthalmology for examination
of the human retina, though OCT tomographs are also com-
mercially available for examination of the anterior segment of
the eye and of skin and other tissues. These instruments, as
well as those designed for material science, may be directly
used to examine works of art.
In every OCT instrument, infrared radiation penetrates the
object and is partially reflected at interfaces of layers of dif-
ferent refractive indices, or sometimes scattered from sites of
inhomogeneity in its structure. Returning light is collected, and
the time of propagation from the given depth of the struc-
ture is determined, thus providing a measurement of the opti-
cal path to this structure. However, at the micrometer path
resolution desired, this propagation time cannot be measured
directly and is accomplished instead through a measurement
of interference between the object and reference beams in an
interferometer. Many specific configurations of OCT instru-
mentation are described in detail elsewhere,30 so only a brief
summary of the principle and description of the instrument
used by the authors will be given here.
To explain the general idea of the OCT device, consider the
interferometer (usually of the Michelson type) with the object
to be investigated in one arm and a mirror in the second (ref-
erence) arm. An original beam from the broadband light
source is split into two, often propagated in optic fibers, as
depicted in Figure 1. The object is penetrated by a narrow
beam of light from one of them, some of which is reflected or
scattered back from various elements (1, 2, ..., n) of the struc-
ture and collected in the interferometer. The second beam is
simultaneously back-reflected from a reference mirror. The
beam splitter recombines these beams to allow interference.
If the difference of round trip propagation times in the two
arms of the interferometer is τn for a given structural element
n, the interference signal may be described by the general
formula
where the index r refers to the signal from the reference arm.
In the first line expression, the common assumption that the
(intensity) reflection coefficients R do not depend on the opti-
cal frequency ω is invoked. S(ω) denotes the spectrum of the
light source.
It can be seen in eq 1 that τn appears as its product with
the optical frequency ω. As a result, two approaches to extract-
ing structural information (Rn and τn) from the interferometric
signal are possible. In the first-developed method, time-do-
main OCT (TdOCT), the interference signal is collected by
means of a photodiode and thus integrated over its spectrum.
In this case, the cosine term averages to zero everywhere
except at τ ≈ 0. More precisely, the full width at half-maxi-
mum (FWHM) of the interference signal as a function of τdefines the axial resolution of the OCT instrument. For a Gaus-
sian-shaped light source of central wavelength λcenter and a
spectral bandwidth ∆λFWHM, this width, ∆τFWHM, and therefore
the axial resolution, ∆x, are given by the formulas
I(ω) ) Ir(ω) + ∑n
In(ω) + 2∑n
[√Ir(ω)In(ω) cos(ωτn)]
) S(ω){Rr + ∑n
Rn + 2∑n
[√RrRn cos(ωτn)]} (1)
Structural Examination of Easel Paintings with OCT Targowski et al.
Vol. xxx, No. xx Month XXXX 000 ACCOUNTS OF CHEMICAL RESEARCH C

where both the forward and backward directions of light prop-
agation in the object and the refractive index, nR, of the inves-
tigated region are taken into account in calculating ∆x.
As can be seen from eq 2, the in-depth resolution increases
with increasing bandwidth of the light source. Thus, to achieve
the required axial resolution for these studies, broadband light
sources with ∆λFWHM between 30 and 200 nm are utilized.
Since ∆x quickly increases (i.e., deteriorates) for deeper infra-
red, radiation in the spectral range 800-1050 nm is usually
employed.
In time-domain OCT, the reference mirror is moved grad-
ually, and the interference signal is simultaneously registered
to complete the in-depth scan. When the optical paths match
to within ∆x, an interference signal is detected. Knowing the
position of the mirror, a profile of the internal structure of the
object along the probing beam can be recovered. To recover
complete cross sections, the probing beam is scanned over the
object. By analogy with the usage in ultrasonography, such a
cross-sectional image is called a B-scan, whereas the profile
along a single vertical line is called an A-scan. Different
images are obtained using the full-field modality of the OCT
technique (FF-OCT),15 which produces cross sections in planes
perpendicular to the direction of probing light (C-scans).
Among the various FF-OCT systems available, microscopic
devices (utilizing Linnik31 or Mirau17 configurations) have out-
standing in-plane resolution, at the price, however, of a field
of view limited to a fraction of a millimeter. Moreover, these
systems very often utilize light from the visible range, which,
according to eq 2, also provides better in-depth resolution.17
FF-OCT additionally holds promise for spectroscopic imag-
ing.32
Fourier-domain OCT was developed later33 and differs from
TdOCT in the way the structural information is extracted from
the interferometric signal given by eq 1. In this case, the spec-
tral signal is registered by means of a spectrograph (spectral
OCT), or a very fast-tuned laser is used as a source with a sin-
gle photodiode detector (swept source OCT). In both modali-
ties, the spectrum of the interference signal is analyzed by
means of Fourier transformation, and the components
obtained have frequencies proportional to delay differences τn
and amplitudes proportional to reflectivities Rn.
The advantages of Fourier domain methods lie in the
absence of movable parts in the reference arm, which
increases the acquisition speed 100-fold, and in significantly
higher sensitivity due to the multiplex advantage.34
Another important consequence of eq 1 arises from the fact
that in the interference term, (IrIn)1/2, a weak useful signal In is
multiplied by a strong reference signal Ir. This leads, due to
heterodyne gain, to the very high, shot-noise limited sensitiv-
ity of the method.
In the case studies reported in this Account, a prototype
laboratory-constructed high-resolution spectral OCT imaging
system (tomograph) was employed (Figure 1). Its axial reso-
lution is measured at 4 µm in air. It comprises a broadband
infrared light source (LS, λcenter ) 845 nm, ∆λFWHM ) 107 nm)
made up of two superluminescent diodes coupled together.
The light output, of high spatial coherence (ensuring sensitiv-
ity), is launched into a single-mode optical fiber and passed
through an optical isolator (OI), which protects the source from
back-reflected light. This tomograph employs a fiber-optic
Michelson interferometer, comprising a 50:50 fiber-optic cou-
pler (FC) dividing the light into reference and object arms. The
reference arm includes a polarization controller (PC), which
provides optimal polarization conditions for interference, a
neutral density filter (NDF) for adjusting the light power to
achieve shot-noise-limited detection, a block of glass (DC) act-
ing as a dispersion compensator, and the stationary reference
mirror (RM). The object arm comprises a lens forming a nar-
row probing beam and a transversal scanner (X-Y) responsi-
ble for scanning the beam across the sample. The light beams,
back-reflected from the reference mirror and reflected and or
∆τFWHM ) 8 ln 2∆ωFWHM
and ∆x ) 1nR
2 ln 2π
λcenter2
∆λFWHM(2)
FIGURE 1. OCT tomograph used in this study: LS, light source; OI,optical isolator; FC, fiber coupler; PC, polarization controller; NDF,neutral density filter; DC, dispersion compensator; RM, reference-arm mirror; X-Y, transversal scanner; DG, diffraction grating; SL,spectrograph lens, CCD, linear CCD camera.
Structural Examination of Easel Paintings with OCT Targowski et al.
D ACCOUNTS OF CHEMICAL RESEARCH 000 Month XXXX Vol. xxx, No. xx

backscattered from structural elements of the object, return to
the coupler and interfere.
To extract structural information from the interference sig-
nal, the tomograph is equipped with a custom-designed spec-
trograph employing a fast CCD camera as detector. The
spectrograph comprises a volume-phase holographic grating
(DG) with 1200 grooves/mm and an achromatic lens (SL),
which focuses the spectrum onto a 12-bit single-line CCD cam-
era (2048 pixels, 12-bit A/D conversion). Following Fourier
transformation, the interference signal yields an A-scan, that
is, one line of the cross-sectional image. Moving the beam
across the sample in the X or the Y direction with the trans-
versal scanner (X-Y) enables collection of a B-scan, that is, a
2-D cross-sectional image, while the addition of scanning in
the perpendicular direction (Y or X, respectively) yields com-
plete 3-D information on the spatial structure within seconds.
Cross-sectional images obtained by OCT are usually pre-
sented in a false-color scale: black areas correspond to non-
scattering media, such as air or clear, transparent varnish. Cold
colors (blue and green) indicate low-scattering or reflecting
areas, whereas warm colors (yellow and red) designate high-
scattering or -reflecting regions. More details on mapping the
scattered or reflected intensities with false colors may be
found elsewhere.35
In all tomograms shown here, the incident light path is
from the top, through air. Thus, the first strong line corre-
sponds to the air-painting (i.e., most usually the air-varnish)
interface, while other layers accessible by the light utilized
appear below this. The lowest layer depicted is always the first
nontransparent one in the structure.
It must be emphasized that all distances within an object
are presented in the OCT tomograms as optical ones, with the
assumption inherently made in processing that the photons
are reflected or scattered only once at the structure sensed.
Thus, if a gradual decay of the signal is observed below the
boundary of an opaque layer (see Figure 4a in Results sec-
tion), it means that many multiscattering events occur in this
layer and create a virtual downward elongation of the imaged
stratum. In contrast, if the OCT signal decays rapidly, creat-
ing a narrow trail in a tomogram (see Figure 4b), it indicates
that the layer absorbs light strongly. In neither of these cases,
therefore, is it possible to determine the layer thickness.
Another consequence of the representation of distances as
optical ones is that all of the internal structures of the object
appear vertically stretched by a factor equal to the refractive
index of the material. Consequently, as follows from eq 2, the
axial resolution of the instrument is increased by the same fac-
tor. If the strata in the material examined are not perpendic-
ular to the beam direction, refraction of the incident and
returning light also leads to some additional distortion of the
image. It is possible to correct this effect numerically. How-
ever, in the cases of the tomograms presented in this Account,
while exact image corrections were not performed, the verti-
cal scale bar is adjusted to present what would, assuming a
refractive index of 1.5 and no distortion by refraction, be real
distances. In addition, the vertical scale of all tomograms pre-
sented is expanded with respect to the lateral scale, because
this improves appreciation of the axial structure of the object.
Practical ExamplesIn this contribution, the results of OCT examinations made on
two paintings on canvas of different style and time of origin
are presented. The first depicts a Franciscan monk, Leonard of
Porto Maurizio (1676-1751). In the lower right-hand corner,
the painting bears an inscription (St. Leonard), and this is
paired up with a date (1797) painted in the lower left-hand
corner (Figure 2). It is known36 that Leonard was beatified by
Pope Pius VI in 1796, and proclaimed Saint by Pope Pius IX
in 1867. This history has raised doubts about the origin of the
inscriptions in the painting. If it had been executed in 1797,
Leonard would not yet have been canonized. Thus it was rea-
sonable to suspect that the inscription St. Leonard was added
later.
An inspection of the picture in raking (obliquely incident)
light revealed the existence of another inscription in the back-
ground, located above the date 1797 and hidden under a
thick layer of varnishes and an overpainting. It was not pos-
sible to read particular letters with standard techniques; nei-
ther X-ray nor infrared examination had been helpful.
Fortunately, the inscription was painted quite thickly, and the
canvas and priming layers were thin enough to allow exam-
ination with white-light penetrating the picture from an intense
source placed behind it (see Figure 6a in Results section). The
two-line text could be deciphered as B. Leonardus d.[a?] Mau-rzio. However, it was not possible to determine the position of
the inscription within the stratigraphy of the painting, which
had been restored at least three times. It was therefore nec-
essary more precisely to investigate the structure of the paint-
ing in order to verify the configuration of paint and varnish
layers in the areas of all three inscriptions and thus provide
unambiguous technical information with which to resolve its
history.
The second painting examined dates from the late nineteenth
century and depicts an unknown woman. It is skillfully painted
and signed GioRdi (Figure 3). Routine inspection of UV-excited flu-
orescence of the painting proved the existence of two kinds of
Structural Examination of Easel Paintings with OCT Targowski et al.
Vol. xxx, No. xx Month XXXX 000 ACCOUNTS OF CHEMICAL RESEARCH E

varnish on its surface: primary, fluorescing yellow, and second-
ary, of slightly blue fluorescence. Although it is certain that such
a difference in the color of fluorescence of two varnishes may be
due only to their different composition, visual color impression
alone (i.e., without precise spectroscopic analysis7) is not reli-
able for unambiguous identification of varnishes. However, some
rough indication may be given by conservation practice: old oil-
resin varnishes tend to fluoresce yellow-green, whereas mod-
ern synthetic varnishes develop rather blue fluorescence over
time.
UV examination did not reveal any differences (which usu-
ally lead to the assumption of forgery) between the region of
the signature and its surroundings. It can be seen in Figure 3
that the signature is placed within a strip-like area where the
primary varnish had been removed before the whole paint-
ing (including the area of the signature) was covered with a
different varnish, of rather blue UV-excited fluorescence. The
aim of the OCT examination of the signature was to deter-
mine whether it lies on top of the remains of the original var-
nish (which had been removed), which would imply
intentional forgery.
Results
a. Structural Imaging of Multilayer Paintings. The analy-
sis of the painting Saint Leonard of Porto Maurizio by means
of optical coherence tomography reveals quite a simple pri-
mary structure. In a sample tomogram (Figure 4a), no glaze
layer is seen to be present, but up to four layers of varnish are
revealed. They are distinguishable mostly due to particles of
dirt originally present on the surface of the painting, which
then became trapped under the next layer of varnish.37 The
signal from light scattered by these particles forms a line of
dots in the tomogram, marking the location of the interface
between the surface of the painting and the subsequent lay-
ers of varnish. Had the interface line in the tomogram been
more continuous and better pronounced, reflection due to the
difference in refractive indices would have been indicated.
The signal from scattering at the upper interface of the pri-
mary, most probably original, varnish layer (yellow arrows in
the figure) is quite continuous, and the strongest of all those
originating from interfaces between the varnish layers. This
suggests that the painting was well dried, even weathered and
not cleaned, before revarnishing. Such a structure is quite
commonly present in OCT tomograms of varnish layers and
may imply that such varnishes belong to different chronolog-
ical phases.
FIGURE 2. Saint Leonard of Porto Maurizio, picture from theFranciscan Church of St. Bonaventure in Pakosc, Poland, oil oncanvas, 121 × 84 cm2, photography in front illumination, taken byMagdalena Iwanicka and used with permission. Circles mark theregions in which the tomograms shown in Figure 4 were taken.Rectangles mark the regions of the inscriptions investigated:tomograms shown in figures indicated.
FIGURE 3. Upper panels, Portrait of an unknown woman, oil oncanvas, 41.5 × 30 cm2, photography in front illumination (VIS) andof UV-excited fluorescence (UV); photo by W. Grzesik and used withpermission. Lower panels: area of signature.
Structural Examination of Easel Paintings with OCT Targowski et al.
F ACCOUNTS OF CHEMICAL RESEARCH 000 Month XXXX Vol. xxx, No. xx

The opaque paint layer (green arrows) in the area of this
tomogram absorbs the probing light moderately, and some
residual multiscattering is present. In the next cross section
(Figure 4b), the original paint layer (green arrows) is more
absorbing, due to its different pigment composition, and thus
visible as a narrow line. On the right-hand side, it is appar-
ently covered by another layer of paint. It is clear that this
paint layer, which is partially permeable to IR light, lies on at
least three layers of varnish, and the original paint layer con-
tinues underneath. Such an OCT image is characteristic for
overpainting onto the surface of the picture. The practice of
this kind of renovation was quite common in the past.
A similar situation is shown in Figure 4c, but the pigments
in this overpainting absorb probing light strongly, and only
traces of subsequent layers are visible. If only the part of this
image marked with a green rectangle were analyzed sepa-
rately, the image would suggest a nontransparent primary
paint layer. However, detailed inspection in relation to the
unaltered structures visible in Figure 4c outside the area of the
overpainting, clearly indicates that, at the boundary between
FIGURE 5. OCT examination of inscriptions from Saint Leonard of Porto Maurizio: (a) first digit 7 from date 1797 (image width 9.3 mm); (b)letter S from the text St. Leonard. (image width: 7 mm). Letters are located between arrows; see text for details. Bars indicate real distances inmedia of refractive index 1.5.
�w Flow-through OCT movies of the first digit 7 from date 1797 and letter S from the text St. Leonard are available.
FIGURE 4. OCT tomograms from Saint Leonard of Porto Maurizio: (a) multilayer varnish (image width 7 mm); (b) semitransparentoverpainting (image width 7 mm); (c) opaque overpainting (image width 12.3 mm). Yellow arrows indicate the surface of the primary varnishlayer; green arrows indicate the primary opaque paint layer; circles show boundaries between original and overpainted areas; rectangleindicates a region in which the overpainting is completely opaque; see text for details. The bars indicate real distances in media of refractiveindex 1.5.
Structural Examination of Easel Paintings with OCT Targowski et al.
Vol. xxx, No. xx Month XXXX 000 ACCOUNTS OF CHEMICAL RESEARCH G
the two areas (circles), the paint layers do not match and that
the original layer (green arrows) extends underneath, simi-
larly to that in Figure 4b.
Analyses of the kind described above may provide conser-
vators with helpful information, which is especially important
for the prospective removal of secondary layers to be carried
out with the intention of preserving the original ones.
b. Analysis of Inscriptions and Artists’ Signatures. A
similar analysis applies to signatures and other inscriptions.
The order of layers provides significant information on the
painting’s history and helps in understanding its origin. The
painting Saint Leonard of Porto Maurizio is unsigned, as is
often found in artworks commissioned by convents and
painted by members of the community. As follows from the
examination of the whole painting, sample results of which
are shown in Figure 4, it was overpainted to a great extent at
least twice and revarnished at least three times. This condi-
tion must be taken into account when the properties of the
inscriptions are examined.
In this picture, two texts are visible at present. One, 1797,
refers to the possible year of its creation, the other, St.Leonard., to the person depicted. Whereas the date is barely
legible, and thus unfortunately not possible to reproduce here,
the Saint’s name is very clearly visible. Examination with the
aid of OCT reveals a different localization of the two inscrip-
tions within the stratigraphy of the painting. The date (Figure
5a, between arrows) is visible in the tomogram as a bright
strip under the varnish and possibly under a semitranspar-
ent, thin overpainting covering all of the area under investi-
gation. The exact position of the date within the structure is
not entirely clear. It may be painted on top of the primary var-
nish (some traces of a transparent layer are visible under-
neath), but there is no doubt that the layer containing the date
belongs to a deep stratum of the structure.
The second inscription (see letter S from St. Leonard, Fig-
ure 5b, between arrows) is painted on top of the thick coat-
ing of varnish covering the original black background which
absorbs probing light strongly, so that only its upper inter-
face is visible. The text St. Leonard must therefore be consid-
ered to have been added later, probably during the last
renovation around the middle of the nineteenth century as an
alteration commemorating Leonard’s canonization.
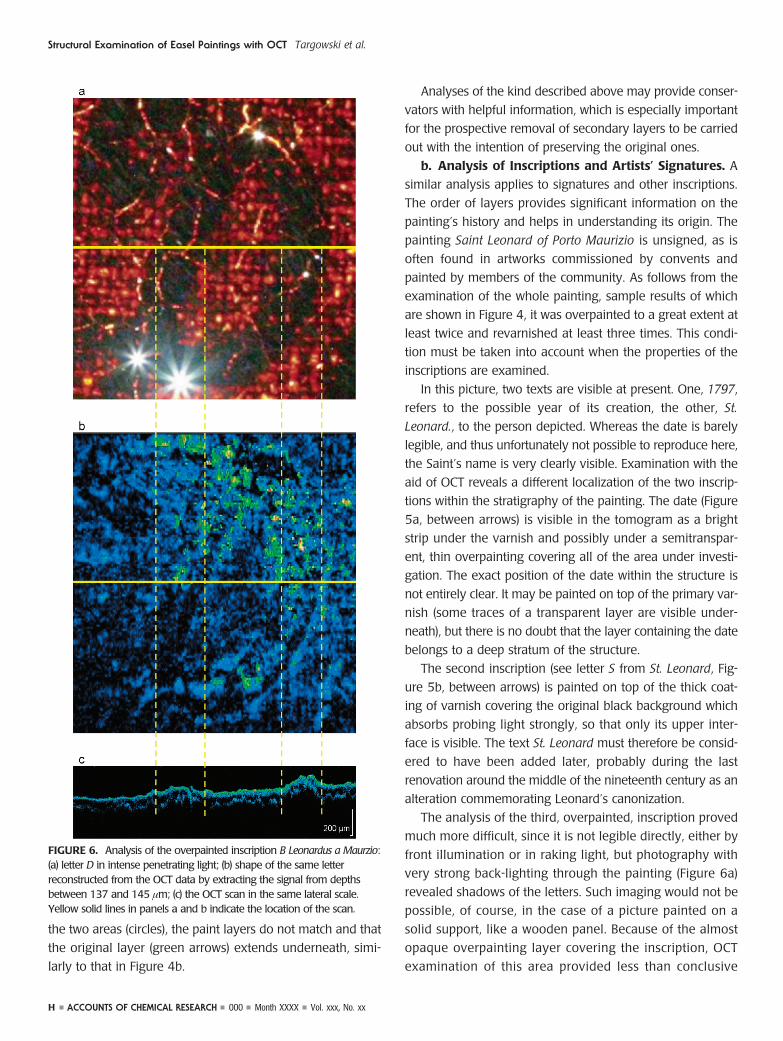
The analysis of the third, overpainted, inscription proved
much more difficult, since it is not legible directly, either by
front illumination or in raking light, but photography with
very strong back-lighting through the painting (Figure 6a)
revealed shadows of the letters. Such imaging would not be
possible, of course, in the case of a picture painted on a
solid support, like a wooden panel. Because of the almost
opaque overpainting layer covering the inscription, OCT
examination of this area provided less than conclusive
FIGURE 6. Analysis of the overpainted inscription B Leonardus a Maurzio:(a) letter D in intense penetrating light; (b) shape of the same letterreconstructed from the OCT data by extracting the signal from depthsbetween 137 and 145 µm; (c) the OCT scan in the same lateral scale.Yellow solid lines in panels a and b indicate the location of the scan.
Structural Examination of Easel Paintings with OCT Targowski et al.
H ACCOUNTS OF CHEMICAL RESEARCH 000 Month XXXX Vol. xxx, No. xx

direct results. The deciphering of the letters from 3-D OCT
was, nevertheless, possible (Figure 6b) by adding together
signals from defined depths beneath the surface and pre-
senting them in a false-color scale, a procedure that had
previously been tested and proved27 on model paintings. In
the present case, the greatest legibility was obtained by
visualization of shadows of the thick letters, that is, by col-
lecting signal from underneath the paint layer (137-145 µm). It should be emphasized that, since this technique
utilizes scattered light, it is not limited to paintings on trans-
parent supports. Moreover, careful inspection of this OCT
tomogram (Figure 6c) leads to the conclusion that the whole
area of investigation is, as expected, covered by the over-
painting, with a continuous layer of varnishes underneath.
It is important to note that, in the tomogram, the layer of
varnishes in areas that correspond to cross sections of the
letter D is visually similar to that in the surrounding back-
ground; no shadows cast by the opaque paint of the inscrip-
tion are present. Thus, the different transparency of the
structure, which made it possible to obtain an image from
Figure 6a, is not induced by the top layers of the painting.
This means that the inscription must be located underneath
the subsequent layer of varnish. However, it is not visible
as a separate stratum. This effect may be explained by the
strong absorption of light in the thick body of this paint
(confirmed by inspection of the image in Figure 6a), which,
together with signal loss in the overpainting located on the
painting surface, renders it impossible to see much of any-
thing below the varnish layer.
Taken together, the detailed conclusions concerning the
inscriptions in this picture lead to the supposition that the work
may have been painted at some time in the year after
Leonard’s beatification in 1796. At that time, the picture car-
ried the inscription B. Leonardus d.[a?] Maurzio, with both the
date and the caption covered by a thick multiple layer of var-
nishing. Subsequently, after canonization, the original inscrip-
tion was painted over and a new, updated, one added. The
date was left visible, possibly even emphasized by overpaint-
ing it.
In the second case study, Portrait of an unknown wom-an, the OCT examination shows two layers of varnish
(Figure 7): a clear lower layer and a more scattering upper
one. This confirms the results of the inspection of the paint-
ing’s surface by UV-excited fluorescence (Figure 3), which
had revealed the existence of two different kinds of var-
nish. The primary, probably original, varnish had been par-
tially removed, but its residue is clearly seen in Figure 7.
There is no doubt that the signature lies on top of the pri-
mary layer of varnish, because the thin opaque paint layer
of the signature (between arrows in Figure 7) is located at
precisely the same level as the interface between the two
varnishes. Moreover, although the paint layer of the signa-
ture obstructs deeper penetration of the beam, some traces
of the original paint layer (marked with green arrows in Fig-
ure 7) are visible underneath at a distance corresponding
to the thickness of the primary varnish in the proximity.
This analysis suggests that the signature is a forgery: it
leads to the strong suspicion that removal of the original
varnish, of yellow UV-excited fluorescence, was intentional,
and carried out in order to create the impression that the
forged signature was a genuine original one placed directly
on the paint layer before any varnishing.
SummaryThe aim of this Account has been to show, using examples of
studies of original paintings, the potential of optical coher-
ence tomography for solving real problems arising in art con-
servation studios. The investigation of inscriptions on oil
paintings was specifically discussed. For two examples of such
paintings, it has been demonstrated that examination by OCT
permits the localization of particular paint layers within the
stratigraphy of the thin structure of the paintings. If this struc-
ture is transparent enough to the infrared light used for the
examination, OCT may constitute the optimal method of
choice for cross-sectional examination because of its nonin-
vasiveness, which allows its unrestricted use even in such sen-
sitive areas as those of the artist’s signature. Despite the very
specific subject of the studies reported here, it is evident that
FIGURE 7. OCT tomogram from Portrait of an unknown woman taken over the letter d of the signature (located between red arrows). Greenarrows indicate the primary, opaque paint layer. To the right, three layers of varnish are visible over an opaque paint layer. Bars indicatereal distances in media of refractive index 1.5.
Structural Examination of Easel Paintings with OCT Targowski et al.
Vol. xxx, No. xx Month XXXX 000 ACCOUNTS OF CHEMICAL RESEARCH I
the kind of approach described in this Account may easily be
adaptable to other appropriately similar tasks in forensic or
materials science.
In the authors’ opinion, the most promising approach is a
synergistic one in which the information gained by means of
various different noninvasive methods is combined. Among
these methods, OCT shows great potential for further appli-
cation and development.
The authors are grateful to Dr. Robert Dale for critical reading
of the manuscript and a number of useful comments. This work
was supported by Polish Government Research Grants through
the years 2008-2011. M.I., E.A.K., and M.S. gratefully acknowl-
edge additional support from the European Social Fund and the
Polish Government within their Integrated Regional Develop-
ment Operational Program, Action 2.6, under the project
“Stypendia dla doktorantow 2008/2009 - ZPORR” of the Kuya-
vian-Pomeranian Voivodship. M.I. additionally acknowledges
support from the Foundation for Polish Science within the Ven-
tures Program cofinanced by Operational Programme Innova-
tive Economy within the European Regional Development
Fund.
BIOGRAPHICAL INFORMATION
Piotr Targowski is a Professor of Optics and Informatics in theInstitute of Physics of the Nicolaus Copernicus University.
Magdalena Iwanicka is a Ph.D. student in the Institute for theStudy, Restoration and Conservation of Cultural Heritage of theNicolaus Copernicus University and a Foundation of Polish Sci-ence scholar.
Ludmiła Tyminska-Widmer is an assistant lecturer at the Insti-tute for the Study, Restoration and Conservation of Cultural Her-itage of the Nicolaus Copernicus University.
Marcin Sylwestrzak is a Ph.D. student in the Institute of Phys-ics of the Nicolaus Copernicus University.
Ewa A. Kwiatkowska is a Ph.D. student in the Institute of Phys-ics of the Nicolaus Copernicus University.
REFERENCES1 de la Rie, E. R. The influence of varnishes on the appearance of paintings. Stud.
Conserv. 1987, 32, 1–13.2 Berns, R. S.; de la Rie, E. R. Exploring the optical properties of picture varnishes
using imaging techniques. Stud. Conserv. 2003, 48, 73–82.3 Plesters, J. Cross-sections and chemical analysis of paint samples. Stud. Conserv.
1956, 2, 110–157.4 van der Weerd, J. Microspectroscopic analysis of traditional oil paint, Ph.D. Thesis,
FOM Institute for Atomic and Molecular Physics, Amsterdam, 2002http://www.amolf.nl/publications/theses/after-2000/ (accessed 07/03/2009).
5 Rouba, B.; Karaszkiewicz, P.; Tyminska-Widmer, L.; Iwanicka, M.; Gora, M.;Kwiatkowska, E.; Targowski, P. Optical coherence tomography for non-destructiveinvestigations of structure of objects of art. Presented at the 9th InternationalConference on Non Destructive Testing of Art, Jerusalem, Israel, May 25-30,2008, http://www.ndt.net/article/art2008/papers/143Targowski.pdf (accessed 07/03/2009).
6 de la Rie, E. R. Fluorescence of paint and varnish layers, Part I, II, III. Stud. Conserv.1982, 17, 1-7; 65-69; 102-108.
7 Thoury, M.; Elias, M.; Frigerio, J. M.; Barthou, C. Nondestructive varnishidentification by ultraviolet fluorescence spectroscopy. Appl. Spectrosc. 2007, 61,1275–1282, 10.1366/000370207783292064.
8 Dupuis, G.; Elias, M.; Simonot, L. Pigment identification by fiber-optics diffusereflectance spectroscopy. Appl. Spectrosc. 2002, 56, 1329–1336,10.1366/000370202760354803.
9 Van Asperen de Boer, J. Infrared reflectography: A method for the examination ofpaintings. Appl. Opt. 1968, 7, 1711–1714.
10 Gavrilov, D.; Ibarra-Castanedo, C.; Maeva, E.; Grube, O.; Maldague, X.; Maev, R. G.Infrared methods in noninvasive inspection of artwork. Presented at 9th InternationalConference on NDT of Art, Jerusalem, Israel, May 25-30, 2008, http://www.ndt.net/article/art2008/papers/040Gavrilov.pdf (accessed 07/03/2009).
11 Maev, R. G.; Gavrilov, D.; Maeva, A.; Vodyanoy, I. Modern non-destructive physicalmethods for paintings testing and evaluation. Presented at 9th InternationalConference on Non Destructive Testing of Art, Jerusalem, Israel, May 25-30,2008, http://www.ndt.net/article/art2008/papers/042Maev.pdf (accessed 07/03/2009).
12 Tornari, V. Optical and digital holographic interferometry applied in art conservationstructural diagnosis. e-Preserv. Sci. 2006, 3, 51–57.
13 Complete list of papers on application of OCT to examination of artwork may befound at http://www.oct4art.eu (accessed 07/03/2009).
14 Targowski, P.; Rouba, B.; Wojtkowski, M.; Kowalczyk, A. The application of opticalcoherence tomography to non-destructive examination of museum objects. Stud.Conserv. 2004, 49, 107–114.
15 Liang, H.; Cid, M.; Cucu, R.; Dobre, G.; Podoleanu, A.; Pedro, J.; Saunders, D. En-face optical coherence tomography-a novel application of non-invasive imaging toart conservation. Opt. Express 2005, 13, 6133–6144, 10.1364/OPEX.13.006133.
16 Arecchi, T.; Bellini, M.; Corsi, C.; Fontana, R.; Materazzi, M.; Pezzati, L.; Tortora, A.A new tool for painting diagnostics: Optical coherence tomography. Opt. Spectrosc.2006, 101, 23–26, 10.1134/S0030400X06070058.
17 Latour, G.; Georges, G.; Siozade, L.; Deumie, C.; Echard, J. P. Study of varnishlayers with optical coherence tomography in both visible and infrared domains. Proc.SPIE 2009, 7391, 73910J, 10.1117/12.827856.
18 Latour, G.; Moreau, J.; Elias, M.; Frigerio, J.-M. Optical Coherence Tomography:non-destructive imaging and spectral information of pigments. Proc. SPIE 2007,6618, 661806, 10.1117/12.726084.
19 Yang, M. L.; Lu, C. W.; Hsu, I. J.; Yang, C. C. The use of optical coherencetomography for monitoring the subsurface morphologies of archaic jades.Archaeometry 2004, 46, 171-182, 10.1111/j.1475-4754.2004.00151.x.
20 Yang, M.-L.; Winkler, A. M.; Barton, J. K.; B., V. P. Using optical coherencetomography to examine the subsurface morphology of Chinese glazes.Archaeometry 2008, 51, 808–821.
21 Liang, H.; Peric, B.; Hughes, M.; Podoleanu, A. G.; Spring, M.; Roehrs, S. Opticalcoherence tomography in archaeological and conservation science - a newemerging field. Proc. SPIE 2008, 7139, 713915, 10.1117/12.819499.
22 Kunicki-Goldfinger, J.; Targowski, P.; Gora, M.; Karaszkiewicz, P.; Dzierzanowski, P.Characterization of glass surface morphology by optical coherence tomography.Stud. Conserv. 2009, 54, 117–128.
23 Adler, D. C.; Stenger, J.; Gorczynska, I.; Lie, H.; Hensick, T.; Spronk, R.; Wolohojian,S.; Khandekar, N.; Jiang, J. Y.; Barry, S. Comparison of three-dimensional opticalcoherence tomography and high resolution photography for art conservation studies.Opt. Express 2007, 15, 15972–15986, 10.1364/OE.15.015972.
24 Liang, H.; Cid, M.; Cucu, R.; Dobre, G.; Kudimov, B.; Pedro, J.; Saunders, D.; Cupitt,J.; Podoleanu, A. Optical coherence tomography: A non-invasive technique appliedto painting conservation of paintings. Proc. SPIE 2005, 5857, 261–269.
25 Targowski, P.; Gora, M.; Wojtkowski, M. Optical coherence tomography for artworkdiagnostics. Laser Chem. 2006, 2006, 1–11, 10.1155/2006/35373. http://www.hindawi.com/journals/lc/2006/035373.abs.html, (accessed 07/03/2009).
26 Gora, M.; Targowski, P.; Rycyk, A.; Marczak, J. Varnish ablation control by opticalcoherence tomography. Laser Chem. 2006, 2006, 1–7, 10.1155/2006/10647.http://www.hindawi.com/journals/lc/2006/010647.abs.html, (accessed 07/03/2009).
27 Targowski, P.; Rouba, B.; Gora, M.; Tyminska-Widmer, L.; Marczak, J.; Kowalczyk,A. Optical coherence tomography in art diagnostic and restoration. Appl. Phys. A:Mater. Sci. Process. 2008, 92, 1–9, 10.1007/s00339-008-4446-x.
28 Gora, M.; Targowski, P.; Kowalczyk, A.; Marczak, J.; Rycyk, A. Fast spectral opticalcoherence tomography for monitoring of varnish ablation process. In Lasers in theConservation of Artworks, LACONA VII Proceedings, Madrid, Spain, Sept. 17-21,2007; Castilleo, M., Ed.; Taylor & Francis Group: London, 2008; pp 23-26.
29 Targowski, P.; Gora, M.; Bajraszewski, T.; Szkulmowski, M.; Rouba, B.; Łekawa-Wysłouch, T.; Tyminska, L. Optical coherence tomography for tracking canvas
Structural Examination of Easel Paintings with OCT Targowski et al.
J ACCOUNTS OF CHEMICAL RESEARCH 000 Month XXXX Vol. xxx, No. xx

deformation. Laser Chem. 2006, 2006, DOI: 10.1155/2006/93658, http://www.hindawi.com/journals/lc/2006/093658.abs.html (accessed 07/03/2009).
30 Optical Coherence Tomography: Technology and Applications; Drexler, W., Fujimoto,J. G., Eds.; Springer-Verlag: Berlin, Heidelberg, New York, 2008.
31 Dubois, A.; Grieve, K.; Moneron, G.; Lecaque, R.; Vabre, L.; Boccara, C. Ultrahigh-resolution full-field optical coherence tomography. Appl. Opt. 2004, 43, 2874–2883.
32 Dubois, A.; Moreau, J.; Boccara, C. Spectroscopic ultrahigh-resolution full-fieldoptical coherence microscopy. Opt. Express 2008, 16, 17082–17091, 10.1364/OE.16.017082.
33 Fercher, A. F. Optical coherence tomography. J. Biomed. Opt. 1996, 1, 157–173,10.1117/12.231361.
34 Leitgeb, R.; Hitzenberger, C. K.; Fercher, A. F. Performance of Fourier domain vs.time domain optical coherence tomography. Opt. Express 2003, 11, 889–894.
35 Sylwestrzak, M.; Kwiatkowska, E. A.; Karaszkiewicz, P.; Iwanicka, M.; Targowski, P.Application of graphically oriented programming to imaging of structure deteriorationof historic glass by optical coherence tomography. Proc. SPIE 2009, 7391, 739109,10.1117/12.827520.
36 Bihl, M. St Leonard of Port Maurice. The Catholic Encyclopedia 1910, Vol. 9, http://www.newadvent.org/cathen/09178c.htm (accessed 07/03/2009).
37 Stifter, D.; Sanchis Dufau, A. D.; Breuer, E.; Wiesauer, K.; Burgholzer, P.;Hoglinger, O.; Gotzinger, E.; Pircher, M.; Hitzenberger, C. K. Polarisation-sensitive optical coherence tomography for material characterisation andtesting. Insight - Non-Destruct. Test. Cond. Monit 2005, 47, 209–212,10.1784/insi.47.4.209.63154.
Structural Examination of Easel Paintings with OCT Targowski et al.
Vol. xxx, No. xx Month XXXX 000 ACCOUNTS OF CHEMICAL RESEARCH K