Embed Size (px)
Citation preview
RESEARCH ARTICLE
Jingming ZHENG, Xiuhai ZHAO, Chunyu ZHANG
Structural diversity of forest communities on BaihuashanMountain, Beijing
E Higher Education Press and Springer-Verlag 2008
Abstract The structural diversity of forests on Baihua-
shanMountain, Beijing, was surveyed by a plotless methodcombined with branch and leaf coverage estimation in the
different layers. New structural indices were constructed,
calculated and compared among different communities.
On the basis of previous work, structural diversity of forest
communities at the stand level was described by a vertical
complexity index and a horizontal heterogeneity index.
From a correlational analysis among the new indices and
other commonly used biodiversity indices, we concludedthat the new indices are closely related to a tree height
inequality index and the Shannon-Wiener index of the tree
and shrub layer, which indicated that the new indices were
good at indicating structural diversity in the different for-
ests on Baihuashan Mountain. The results show that, in
natural forests, structural diversity of pioneer communities
is much lower than in late successive communities. In plan-
tations, structural diversity is determined by the stage ofdevelopment and tree species. Tending would increase hori-
zontal heterogeneity and decrease vertical complexity.
Keywords structural diversity, Baihuashan Mountain,
forests, tending
1 Introduction
Structure and diversity of forest communities form the
basis from which we can understand the ecosystem func-
tions of forests and carry on sustainable forest manage-
ment. The results of many micro-scale studies show that
communities with high spatial heterogeneity contain more
animal and plant species and that this diversity is oftenclosely the related to diversity of micro-habitats, espe-
cially in the forests (MacArthur and MacArthur, 1961;
Gao et al., 1992). At the same time, the structure of the
forest community is correlated with many functional
characteristics of the forest, such as interception of pre-
cipitation, modification of the micro-climate, promotion of
tree growth and enhancement of community stability
(O’Hara et al., 1996; Chen et al., 1997). However, it is not
easy to distinguish definitely between spatial structure and
species biodiversity in plant communities, since both affect
some ecological processes simultaneously. Furthermore,
community structures change over the course of forest
development according to modern forest ecology. There-
fore, structural diversity of a community can be regarded
as a criterion for dividing developmental stages as well as a
substitute for species diversity in a forest community
(Kohm and Franklin, 1996; Oliver and Larson, 1996).
Given this knowledge, a corresponding ecosystem manage-
ment strategy could be designed to enhance the develop-
ment of forest stand structures, promote biodiversity and
upgrade the provision of ecosystem services by the forest
(Lahde et al., 1999; Bordelon et al., 2000). In short, the
study of structural diversity of forest communities deserves
strong support in both theoretical ecology and ecosystem
management practices.
For our study, we surveyed the structural diversity of
forests on Baihuashan Mountain, Beijing, by means of a
plotless method combined with estimates of branch and
leaf coverage in different layers. Structural diversity indi-
ces were amended on the basis of previous works (Zheng
and Luo, 2003) and calculated for each forest community
for comparison and analysis of the differences among
various communities in order to provide theoretical sup-
port for forest management in this region.
2 Methods
2.1 Natural conditions in study area
The Baihuashan Mountain at the northern end of the
Taihang Mountains is situated between 39u499–39u539N,
115u309–115u389E west of Beijing, China. The elevation of
Translated from Journal of Beijing Forestry University, 2007, 29(1):7–13 [译自: 北京林业大学学报]
Jingming ZHENG (*), Xiuhai ZHAO, Chunyu ZHANGKey Laboratory for Silviculture and Conservation of theMinistry ofEducation, Beijing Forestry University, Beijing 100083, ChinaE-mail: [email protected]
Front. For. China 2008, 3(2): 213–218DOI 10.1007/s11461-008-0034-7
the main body of the mountain is relatively high and the
ridges stretch very far. The highest peak is 2035 m. The
region has a typical monsoon climate with an average
temperature of 210uC during the coldest month and
21uC during the hottest month. The annual precipitation
in this region is over 700 mm, with most of it occurring in
June, July and August. Parent rock material of
Baihuashan Mountain is lava which erupted during the
Mesozoic and Jurassic eras. Andesite is common. There
are three main soil types in the region.Meadow soils occur
in the area above 1900 m elevation, brown soils are
between 1200–1900 m and cinnamon soils are found
below 1200 m elevation (Pan, 1988).
Although the original vegetation in the region is a typ-
ical temperate deciduous broad-leaved forest, the present
forests are composed of secondary forests and plantations
because of long-term human activities. Major plant com-
munities in the natural forests are dominated by Betula
platyphylla,Quercus wantaishanica andPopulus davidiana.
Plantations consist largely of Larix principis-rupprechtii,
Pinus tabulaeformis, etc. (Liu and Ren, 1992).
3 Study method
3.1 Field survey
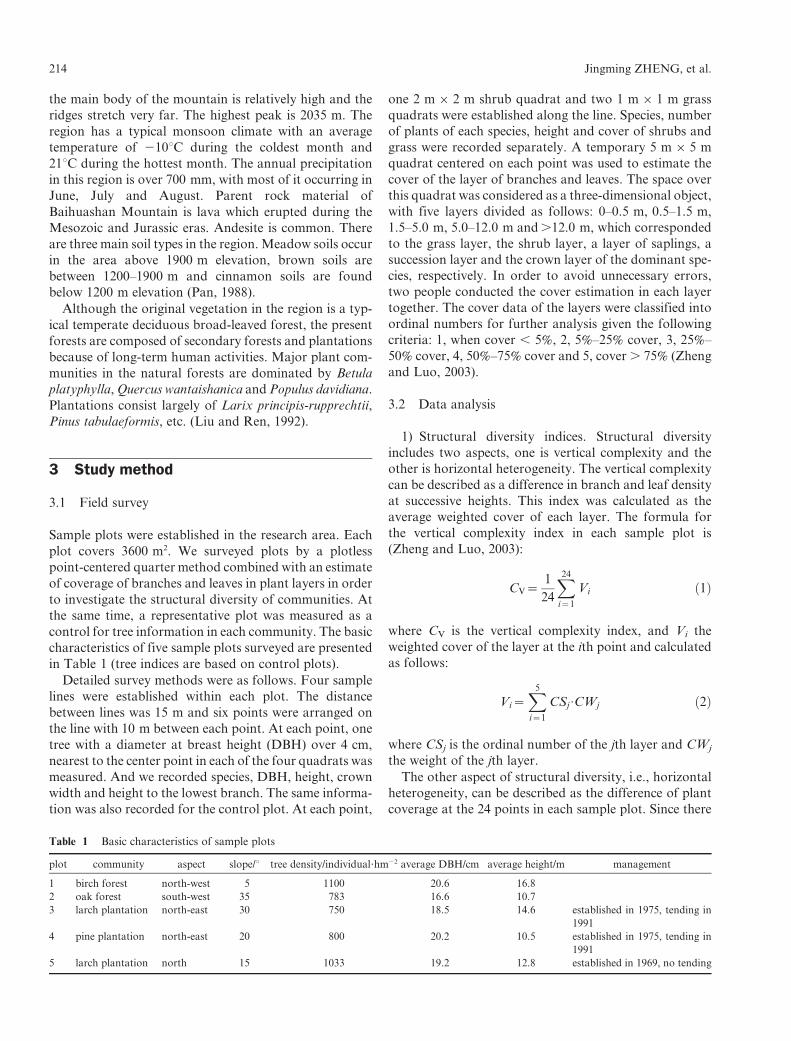
Sample plots were established in the research area. Each
plot covers 3600 m2. We surveyed plots by a plotless
point-centered quarter method combined with an estimate
of coverage of branches and leaves in plant layers in order
to investigate the structural diversity of communities. At
the same time, a representative plot was measured as a
control for tree information in each community. The basic
characteristics of five sample plots surveyed are presented
in Table 1 (tree indices are based on control plots).
Detailed survey methods were as follows. Four sample
lines were established within each plot. The distance
between lines was 15 m and six points were arranged on
the line with 10 m between each point. At each point, one
tree with a diameter at breast height (DBH) over 4 cm,
nearest to the center point in each of the four quadrats was
measured. And we recorded species, DBH, height, crown
width and height to the lowest branch. The same informa-
tion was also recorded for the control plot. At each point,
one 2 m6 2 m shrub quadrat and two 1 m6 1 m grass
quadrats were established along the line. Species, number
of plants of each species, height and cover of shrubs and
grass were recorded separately. A temporary 5 m6 5 m
quadrat centered on each point was used to estimate the
cover of the layer of branches and leaves. The space over
this quadrat was considered as a three-dimensional object,
with five layers divided as follows: 0–0.5 m, 0.5–1.5 m,
1.5–5.0 m, 5.0–12.0 m and.12.0 m, which corresponded
to the grass layer, the shrub layer, a layer of saplings, a
succession layer and the crown layer of the dominant spe-
cies, respectively. In order to avoid unnecessary errors,
two people conducted the cover estimation in each layer
together. The cover data of the layers were classified into
ordinal numbers for further analysis given the following
criteria: 1, when cover , 5%, 2, 5%–25% cover, 3, 25%–
50% cover, 4, 50%–75% cover and 5, cover. 75% (Zheng
and Luo, 2003).
3.2 Data analysis
1) Structural diversity indices. Structural diversity
includes two aspects, one is vertical complexity and the
other is horizontal heterogeneity. The vertical complexity
can be described as a difference in branch and leaf density
at successive heights. This index was calculated as the
average weighted cover of each layer. The formula for
the vertical complexity index in each sample plot is
(Zheng and Luo, 2003):
CV~1
24
X24i~1
Vi ð1Þ
where CV is the vertical complexity index, and Vi the
weighted cover of the layer at the ith point and calculated
as follows:
Vi~X5i~1
CSj:CWj ð2Þ
where CSj is the ordinal number of the jth layer and CWj
the weight of the jth layer.
The other aspect of structural diversity, i.e., horizontal
heterogeneity, can be described as the difference of plant
coverage at the 24 points in each sample plot. Since there
Table 1 Basic characteristics of sample plots
plot community aspect slope/u tree density/individual?hm22 average DBH/cm average height/m management
1 birch forest north-west 5 1100 20.6 16.8
2 oak forest south-west 35 783 16.6 10.7
3 larch plantation north-east 30 750 18.5 14.6 established in 1975, tending in
1991
4 pine plantation north-east 20 800 20.2 10.5 established in 1975, tending in
1991
5 larch plantation north 15 1033 19.2 12.8 established in 1969, no tending
214 Jingming ZHENG, et al.
were five layers at each point, similar to five attributes and
each attribute had 24 pieces of information in one plot, the
horizontal heterogeneity index could be calculated as the
difference in the average layer cover between two points
(total number of pairs: C224~276). For our study we
defined the difference index as a Euclidean distance, cal-
culated as (Zhang, 2005):
CH~1
C224
X24i~1
djk ð3Þ
where CH is the horizontal heterogeneity index, djk the
Euclidean distance between points j and k and is calcu-
lated as:
djk~
ffiffiffiffiffiffiffiffiffiffiffiffiffiffiffiffiffiffiffiffiffiffiffiffiffiffiffiffiffiX5i~1
(xij{xik)2
vuut ð4Þ
where xij and xik are the ordinal numbers between jth
point and kth point with five different layers each.
2) Other biodiversity indices commonly used in the lit-
erature are the Shannon-Wiener index and the Gini index.
We calculated the Shannon-Wiener index for species divers-
ity of the shrub and grass layers as follows (Ma, 1994):
H~{X
Pi: lnPi ð5Þ
where H is the Shannon-Wiener index and Pi the ratio of
the number of individuals of the ith species to the total
number of individuals.
We used the Gini index to describe the inequality of tree
heights in the sample plot. The Gini index is the average
difference of an attribute between two individuals in a plot.
The Gini index ranges between 0 and 1. This index proved
to be effective in describing tree height diversity in a forest
community (Wiener and Solbrig, 1984; Dixon et al., 1987;
Latham et al., 1998). The formula for the Gini index is:
G~1
Pni~1
Xi(n{1)
Xni~1
(2i{n{1)Xi ð6Þ
where G is the Gini index, Xi height of the ith tree, i the
index of tree height ordered from the bottom up and n is the
number of trees in the plot.
The Gini index is one of the most successfully used
indices for plant height inequality. We used it to show
the inequality of tree height in one sample plot, i.e., as
tree height diversity.
All indices were calculated with EXCEL and the data
analyzed by SPSS 11.0.
4 Results
4.1 Structural diversity of natural forests and
plantations
Previous studies have shown that the point-centered quar-
ter method, combined with an estimation method for cov-
erage, is useful in evaluating the effect of anthropogenic
disturbance to forest structures (Zheng and Luo, 2003).
The estimation of layer coverage is a qualitative method
used in the evaluation of forest structures and habitat
quality in the landscape (Lahde et al., 1999; Drapeau et
al., 2000). We have used this method to describe the struc-
ture of forest communities for the purpose of an easy
forest survey and for management evaluation. The for-
mula of indices in this paper have been amended on the
basis of our previous studies (Zheng and Luo, 2003).
We take sample plot 2 as an example to show how the
structural diversity indices were calculated. After briefly
surveying the height of layers of the different forest com-
munities in BaihuaMountain, we found that the height of
three layers, i.e., the major crown layer of the dominant
tree species, the shrub layer and grass, were similar in the
different natural forests. So, we decided to divide layers
into five fixed height classes (see 3.1), representing crown,
succession layer, sapling layer, shrub layer and grass layer,
respectively. According to equation (1),CV was calculated
with different weights of the layers, where the weight was
the ratio of layer height to average tree height in the plot.
The length of the highest layer was the difference in height
between the tallest tree and the lowest limit of this layer to
emphasize different dominant trees in each community.
After summing the weighted layers of 24 covers, we
obtained its average as the vertical complexity index of
plot 2, i.e., 4.294. The calculation of the horizontal het-
erogeneity index was also based on the ordinal numbers of
the cover layer. According to equations (3) and (4), the
Euclidean distances of 276 point pairs were calculated
(data omitted from Table 2). The average of the distance
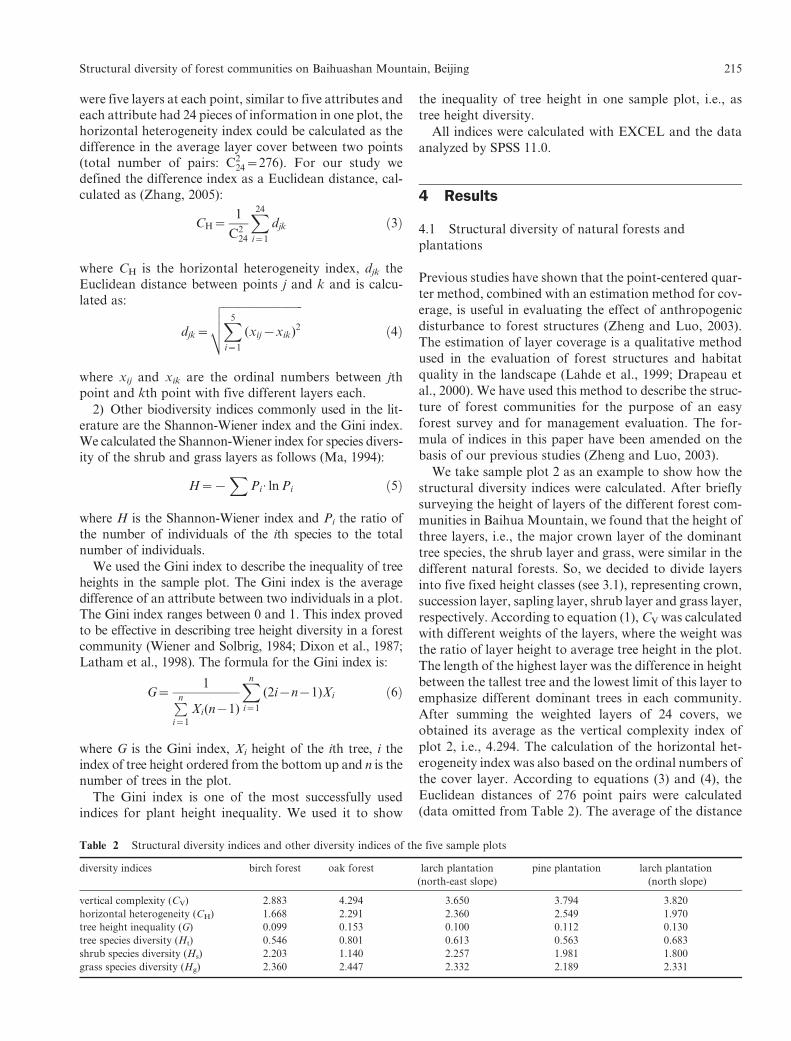
Table 2 Structural diversity indices and other diversity indices of the five sample plots
diversity indices birch forest oak forest larch plantation
(north-east slope)
pine plantation larch plantation
(north slope)
vertical complexity (CV) 2.883 4.294 3.650 3.794 3.820
horizontal heterogeneity (CH) 1.668 2.291 2.360 2.549 1.970
tree height inequality (G) 0.099 0.153 0.100 0.112 0.130
tree species diversity (Ht) 0.546 0.801 0.613 0.563 0.683
shrub species diversity (Hs) 2.203 1.140 2.257 1.981 1.800
grass species diversity (Hg) 2.360 2.447 2.332 2.189 2.331
Structural diversity of forest communities on Baihuashan Mountain, Beijing 215
was used as the horizontal heterogeneity index, which was
2.291, of plot 2.
The structural diversity indices of the other four plots
surveyed were calculated as explained earlier. The results
are shown in Table 2.
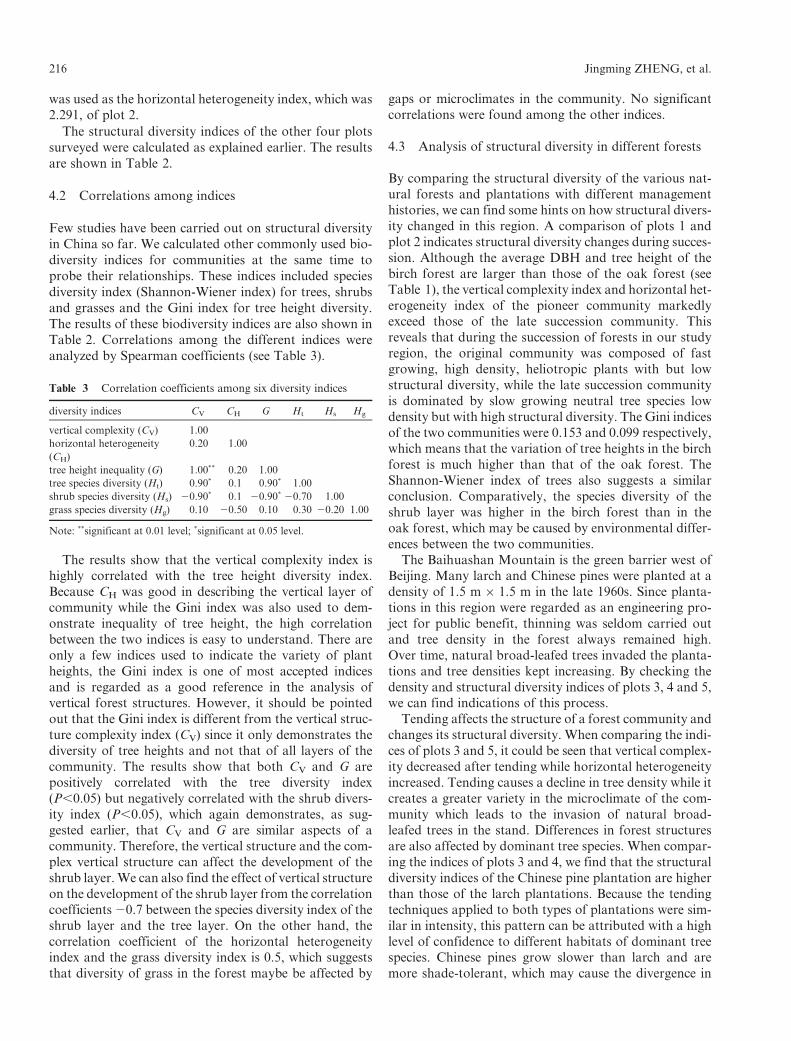
4.2 Correlations among indices
Few studies have been carried out on structural diversity
in China so far. We calculated other commonly used bio-
diversity indices for communities at the same time to
probe their relationships. These indices included species
diversity index (Shannon-Wiener index) for trees, shrubs
and grasses and the Gini index for tree height diversity.
The results of these biodiversity indices are also shown in
Table 2. Correlations among the different indices were
analyzed by Spearman coefficients (see Table 3).
The results show that the vertical complexity index ishighly correlated with the tree height diversity index.
Because CH was good in describing the vertical layer of
community while the Gini index was also used to dem-
onstrate inequality of tree height, the high correlation
between the two indices is easy to understand. There are
only a few indices used to indicate the variety of plant
heights, the Gini index is one of most accepted indices
and is regarded as a good reference in the analysis ofvertical forest structures. However, it should be pointed
out that the Gini index is different from the vertical struc-
ture complexity index (CV) since it only demonstrates the
diversity of tree heights and not that of all layers of the
community. The results show that both CV and G are
positively correlated with the tree diversity index
(P,0.05) but negatively correlated with the shrub divers-
ity index (P,0.05), which again demonstrates, as sug-gested earlier, that CV and G are similar aspects of a
community. Therefore, the vertical structure and the com-
plex vertical structure can affect the development of the
shrub layer.We can also find the effect of vertical structure
on the development of the shrub layer from the correlation
coefficients20.7 between the species diversity index of the
shrub layer and the tree layer. On the other hand, the
correlation coefficient of the horizontal heterogeneityindex and the grass diversity index is 0.5, which suggests
that diversity of grass in the forest maybe be affected by
gaps or microclimates in the community. No significant
correlations were found among the other indices.
4.3 Analysis of structural diversity in different forests
By comparing the structural diversity of the various nat-ural forests and plantations with different management
histories, we can find some hints on how structural divers-
ity changed in this region. A comparison of plots 1 and
plot 2 indicates structural diversity changes during succes-
sion. Although the average DBH and tree height of the
birch forest are larger than those of the oak forest (see
Table 1), the vertical complexity index and horizontal het-
erogeneity index of the pioneer community markedlyexceed those of the late succession community. This
reveals that during the succession of forests in our study
region, the original community was composed of fast
growing, high density, heliotropic plants with but low
structural diversity, while the late succession community
is dominated by slow growing neutral tree species low
density but with high structural diversity. The Gini indices
of the two communities were 0.153 and 0.099 respectively,which means that the variation of tree heights in the birch
forest is much higher than that of the oak forest. The
Shannon-Wiener index of trees also suggests a similar
conclusion. Comparatively, the species diversity of the
shrub layer was higher in the birch forest than in the
oak forest, which may be caused by environmental differ-
ences between the two communities.
The Baihuashan Mountain is the green barrier west ofBeijing. Many larch and Chinese pines were planted at a
density of 1.5 m6 1.5 m in the late 1960s. Since planta-
tions in this region were regarded as an engineering pro-
ject for public benefit, thinning was seldom carried out
and tree density in the forest always remained high.
Over time, natural broad-leafed trees invaded the planta-
tions and tree densities kept increasing. By checking the
density and structural diversity indices of plots 3, 4 and 5,we can find indications of this process.
Tending affects the structure of a forest community and
changes its structural diversity. When comparing the indi-
ces of plots 3 and 5, it could be seen that vertical complex-
ity decreased after tending while horizontal heterogeneity
increased. Tending causes a decline in tree density while it
creates a greater variety in the microclimate of the com-
munity which leads to the invasion of natural broad-leafed trees in the stand. Differences in forest structures
are also affected by dominant tree species. When compar-
ing the indices of plots 3 and 4, we find that the structural
diversity indices of the Chinese pine plantation are higher
than those of the larch plantations. Because the tending
techniques applied to both types of plantations were sim-
ilar in intensity, this pattern can be attributed with a high
level of confidence to different habitats of dominant treespecies. Chinese pines grow slower than larch and are
more shade-tolerant, which may cause the divergence in
Table 3 Correlation coefficients among six diversity indices
diversity indices CV CH G Ht Hs Hg
vertical complexity (CV) 1.00
horizontal heterogeneity
(CH)
0.20 1.00
tree height inequality (G) 1.00** 0.20 1.00
tree species diversity (Ht) 0.90* 0.1 0.90* 1.00
shrub species diversity (Hs) 20.90* 0.1 20.90* 20.70 1.00
grass species diversity (Hg) 0.10 20.50 0.10 0.30 20.20 1.00
Note: **significant at 0.01 level; *significant at 0.05 level.
216 Jingming ZHENG, et al.
differentiation time of trees and stand pattern formation
with high initial tree density. Within the same devel-
opmental period, the Chinese pine plantation was apt to
produce a more complex structure than the larch planta-
tions. Considering CV, CH and G indices together, we con-
cluded that plantations can produce relative high structural
diversity similar to natural pioneer communities given suf-
ficient time and tending. However, their structural diversity
still cannot be as high as that of late succession communit-
ies. The stability of late succession communities is often
regarded as high as the spatial heterogeneity within it.
However, a comparison of the structural diversity among
plantations and natural communities indicates that tending
can increase horizontal heterogeneity while decreasing ver-
tical complexity. An increase in horizontal heterogeneity
only does not mean structural optimization and enhance-
ment of stability in a forest community.
5 Discussion
There are many advantages using estimation of layer cov-
erage as the basis for the calculation of structural diversity
indices as we have done. Diversity indices of branches and
leaves are useful in evaluating bird habitats (MacArthur
and MacArthur, 1961). Leaf density at different height
layers has greater effect on insects than do plant identities
in different layers in forest (Gao et al., 1992).
Communities with complex vertical structures can play
more important roles in soil and water conservation
through interception of precipitation (Chen et al., 1997).
Thus, by comparing species diversity indices that can only
indicate a small aspect of a forest structure, layer cov-
erage-based structural diversity indices illustrate the struc-
ture of forest communities more thoroughly. Previous
studies on structural diversity in the Changbai
Mountains in northeastern China show that structural
diversity indices could be used to distinguish the difference
in structures between the original and secondary forests.
These indices are better than species diversity indices in
describing the change of structural diversity by human
activities (Luo et al., 1997; Zheng and Luo, 2003). In this
study, we have validated the methods in northern China.
With a typical plot of 600 m2 as control, our point-cen-
tered quarter method (24 points) combined with coverage
estimation of layers was used to survey the structure of
forest communities on the Baihuashan Mountain. The
survey area and number of points met the requirements
of our research in biodiversity of forest communities in the
region (Pan, 1988; Liu and Ren, 1992). Our results of
community similarity indices between the two methods
also validated our new method (calculations omitted).
Studies in forest structures before focused on tree height
division and coverage of different life forms (Chen et al.,
1997; Zang et al., 2001; Song et al., 2003), with little
attention paid to horizontal heterogeneity. However, gaps
and micro-habitats in forest are important characteristics at
the stand level. Ignoring these would surely lead to an
incomplete description of community structures (Franklin,
1994). Furthermore, in previous studies, vertical layers were
often divided in a way of fixed length, which were suspected
not reflect natural plant layer patterns because different
communities have various layers in addition to the effect
of community composition on the number of species (Zhi,
2001).We have divided the layers in a way that, as closely as
possible, simulates nature, and we use information of cov-
erage, not species, to construct the structural diversity indi-
ceswhich improve the general and comparative applicability
of the method. Of course, our division of the layers is also
related to the stage of forest developmental. Each stage is
characterized by its own unique structure, which was pre-
sented in the new theory of forest stand dynamics (Kohm
and Franklin, 1996; Oliver and Larson, 1996). When divid-
ing the layers in different forest communities, we should take
community and its developmental stage into consideration
to find a suitable way. Because of variable regional vegeta-
tion conditions and labor requirements for surveys, detailed
studies should be conducted in the future.
Acknowledgements Our study was part of a project in forest restorationin Beijing suburbs, funded by the Beijing Education Committee (JD-100220648). The study was also funded by the Key PrinciplesConstructions program among Universities in Beijing. We thank Mr.Jiuzhong WANG of Baihuashan Mountain Nature Reserve for his greatefforts.
References
Bordelon M A, Mcallister D C, Holloway R (2000). Sustainableforestry: Oregon style. J For, 75(1): 49–54
Chen XD, Li X G,Wang J X (1997). The plant community highnessclass construction of Yangzi River shelter forest in Guansi RiverValley, Mianyang City. Acta Phytoecol Sin, 21(4): 376–385 (inChinese)
Dixon P M, Weiner J, Mitchell-Olds T, Woodley R (1987).Bootstrapping the Gini coefficient of inequality. Ecology, 68(6):1548–1551
Drapeau P, Leduc A, Giroux J, Savard J L, Bergeron Y, Vickery W L(2000). Landscape-scale disturbances and changes in bird commu-nities of boreal mixed-wood forests. Ecol Monogr, 70(3): 423–444
Franklin J F (1994). Ecological science: a conceptual basis forFEMAT. J For, 92(4): 50–56
Gao B J. Zhang Z Z, Li Z Y (1992). Study on the influence of theclosed forest on the structure, diversity and stability of insectcommunity. Acta Ecol Sin, 12(1): 1–7 (in Chinese)
Kohm A K, Franklin J F (1996). Creating a Forestry for the 21stCentury–The Science of Ecosystem Management. Washington DC: Island Press, 1–30
Lahde E, Laiho O, Norokorpi Y (1999). Diversity-oriented silvicul-tures in boreal zone of Europe. For EcolManage, 118(2): 223–243
Latham P A, Zuuring H R, Cobel D W (1998). A method for quan-tifying vertical forest structure. For Ecol Manage, 104(1): 157–170
Liu M W, Ren X W (1992). Plant interspecific correlation and avegetation numerical classification of Mount Baihua in Beijing.J Beijing For Univ, 14(4): 77–84 (in Chinese)
Structural diversity of forest communities on Baihuashan Mountain, Beijing 217
Luo J C, Wang Q S, Mu C C, Wang X P (1997). Plant diversity ofPinus koraiensis forests under disturbance in ChangbaiMountains of China. Sci Silv Sin, 33: 498–503 (in Chinese)
Ma K P (1994). Measuring methods for community diversity. In:Biodiversity Committee of Chinese Academy of Sciences,eds.Principles and Methodologies of Biodiversity Studies.Beijing: Chinese Science and Technology Press, 141–165 (inChinese)
Macarthur R H, Macarthur G W (1961). On bird species diversity.Ecology, 42: 594–498
O’Hara K L, Latham P A, Hessburg P (1996). A structural clas-sification for inland northwest forest vegetation. Western J ApplFor, 11: 97–102
Oliver D C, Larson C L (1996). Forest Stands Dynamics. Oxford:John Wiley & Sons, Inc, 77–89
Pan J H (1988). Study on forest environmental gradients and plantcommunities in Baihuashan, Beijing. Acta Phytoecol Geobot Sin,12: 22–30 (in Chinese)
Song P, Hong W, Wu C Z, Fan H L, Chen R, Qian LW, Zhu H, TuY H (2003). Highness class structure of Castanopsis fargesii sec-ondary forest in the middle subtropics. Chin J Appl Environ Biol,9(5): 460–465 (in Chinese)
Weiner J, Solbrig O (1984). The mean and measurement of sizehierarchies in plant populations. Oecologia, 61(2): 334–336
Zang R G, Yang Y C, Jiang Y X (2001). Community structure andtree species diversity characteristics in a tropical montane rainforest in Bawangling Nature Reserve, Hainan Island. ActaPhytoecol Sin, 25(3): 270–275 (in Chinese)
Zhang J T (2005). Quantitative Ecology. Beijing: Science Press, 23–35Zheng J M, Luo J C (2003). Structural diversity of broadleaved-
Korean pine forest in Changbai Mountain. Biodiver Sci, 11(4):295–302 (in Chinese)
Zhi S (2001). Discussion on some issues in ‘‘Community structureand tree species diversity characteristics in a tropical montanerain forest in Bawangling Nature Reserve, Hainan Island’’.Acta Phytoecol Sin, 25(3): 381–384 (in Chinese)
218 Jingming ZHENG, et al.