Embed Size (px)
Citation preview
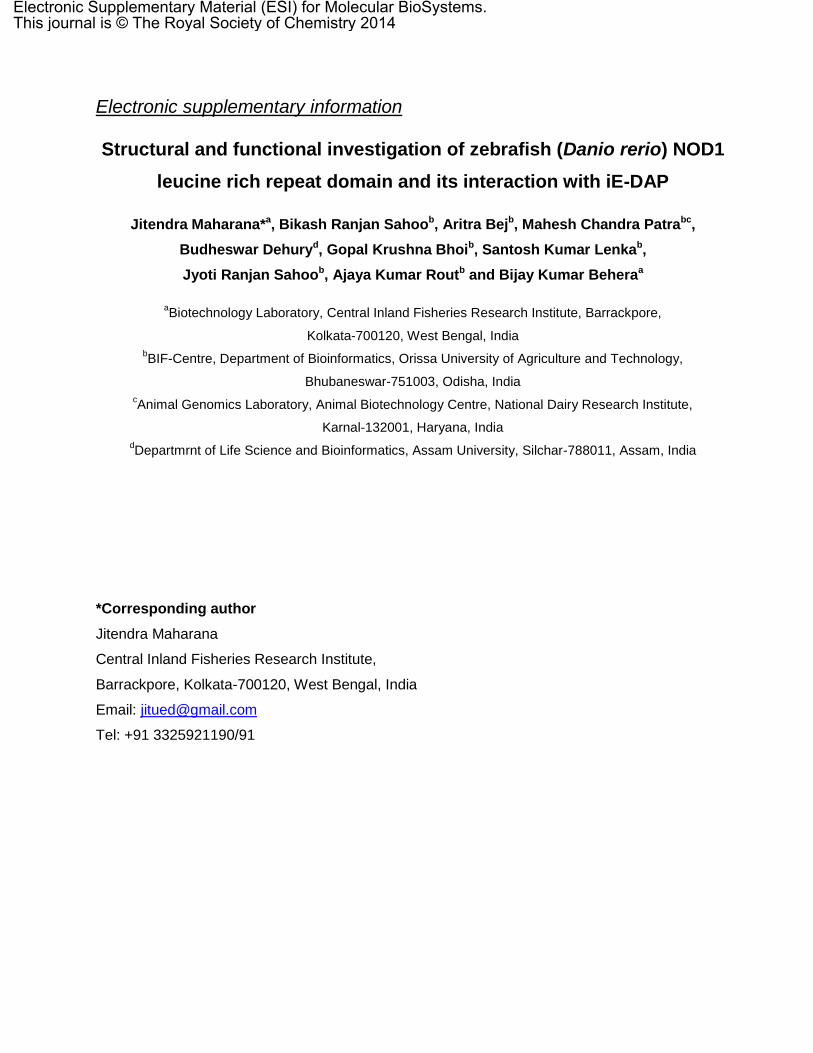
Electronic supplementary information
Structural and functional investigation of zebrafish (Danio rerio) NOD1
leucine rich repeat domain and its interaction with iE-DAP
Jitendra Maharana*a, Bikash Ranjan Sahoob, Aritra Bejb, Mahesh Chandra Patrabc,
Budheswar Dehuryd, Gopal Krushna Bhoib, Santosh Kumar Lenkab,
Jyoti Ranjan Sahoob, Ajaya Kumar Routb and Bijay Kumar Beheraa
aBiotechnology Laboratory, Central Inland Fisheries Research Institute, Barrackpore,
Kolkata-700120, West Bengal, India
bBIF-Centre, Department of Bioinformatics, Orissa University of Agriculture and Technology,
Bhubaneswar-751003, Odisha, India
cAnimal Genomics Laboratory, Animal Biotechnology Centre, National Dairy Research Institute,
Karnal-132001, Haryana, India
dDepartmrnt of Life Science and Bioinformatics, Assam University, Silchar-788011, Assam, India
*Corresponding author
Jitendra Maharana
Central Inland Fisheries Research Institute,
Barrackpore, Kolkata-700120, West Bengal, India
Email: [email protected]
Tel: +91 3325921190/91
Electronic Supplementary Material (ESI) for Molecular BioSystems.This journal is © The Royal Society of Chemistry 2014
Supplementary figures
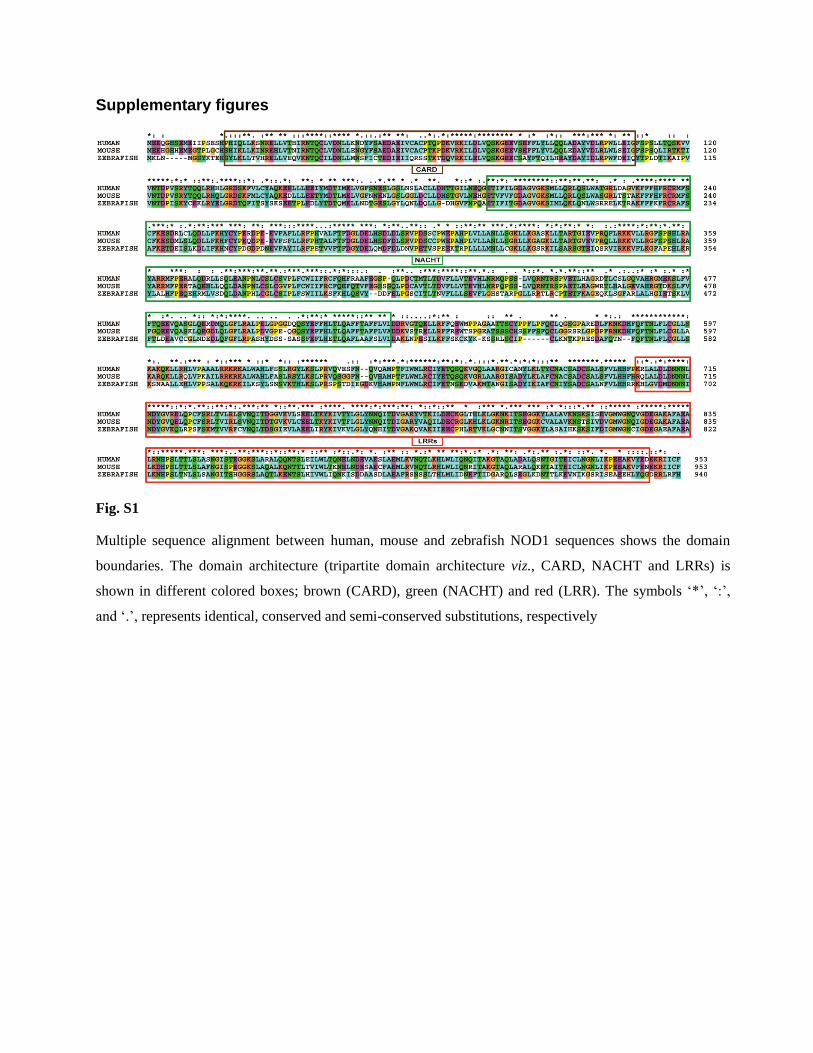
Fig. S1
Multiple sequence alignment between human, mouse and zebrafish NOD1 sequences shows the domain
boundaries. The domain architecture (tripartite domain architecture viz., CARD, NACHT and LRRs) is
shown in different colored boxes; brown (CARD), green (NACHT) and red (LRR). The symbols ‘*’, ‘:’,
and ‘.’, represents identical, conserved and semi-conserved substitutions, respectively
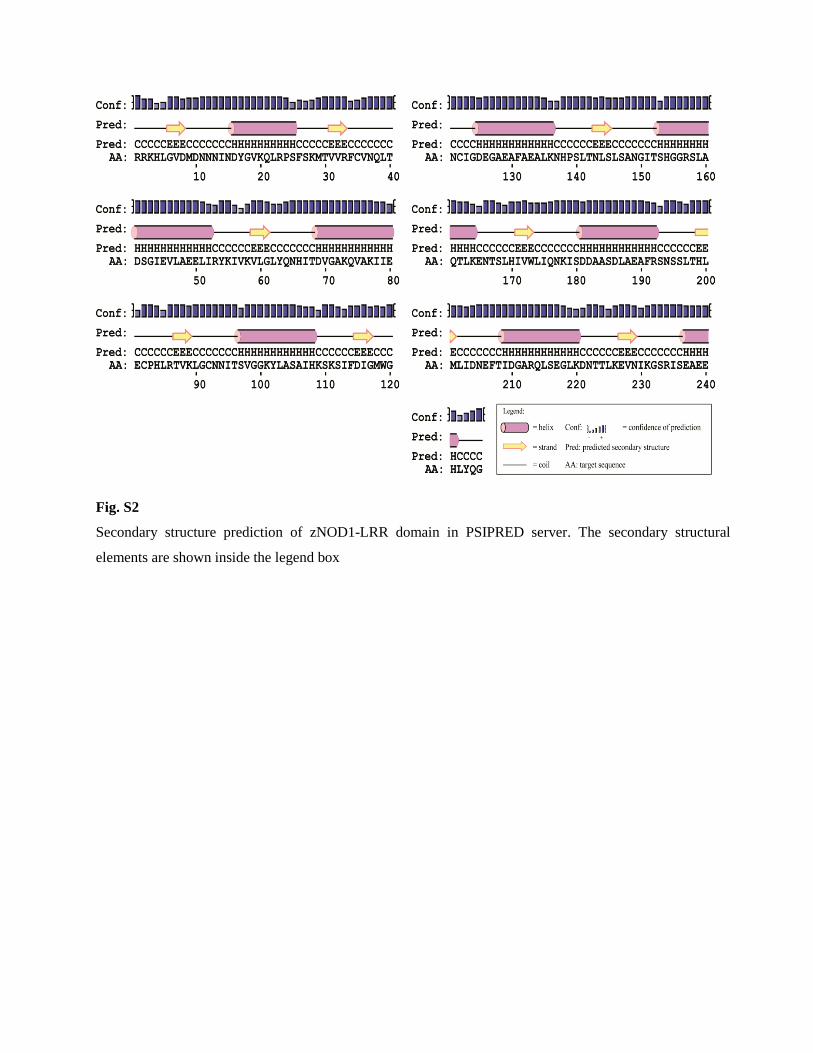
Fig. S2
Secondary structure prediction of zNOD1-LRR domain in PSIPRED server. The secondary structural
elements are shown inside the legend box
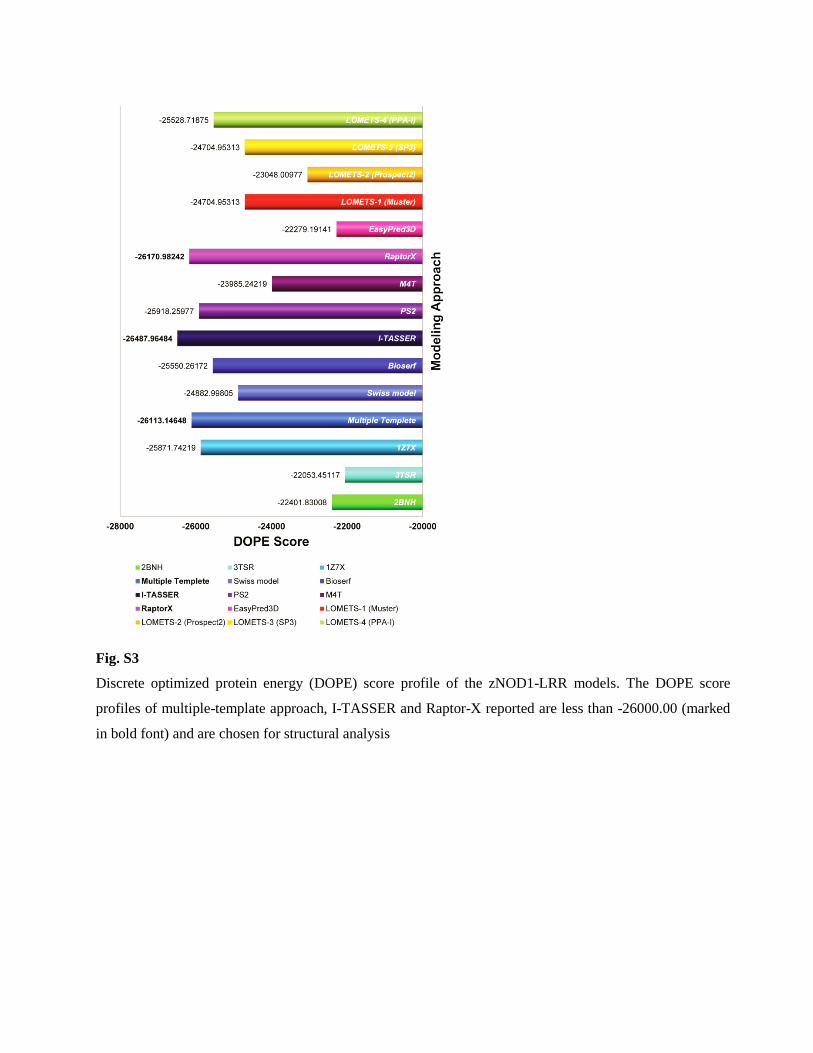
Fig. S3
Discrete optimized protein energy (DOPE) score profile of the zNOD1-LRR models. The DOPE score
profiles of multiple-template approach, I-TASSER and Raptor-X reported are less than -26000.00 (marked
in bold font) and are chosen for structural analysis
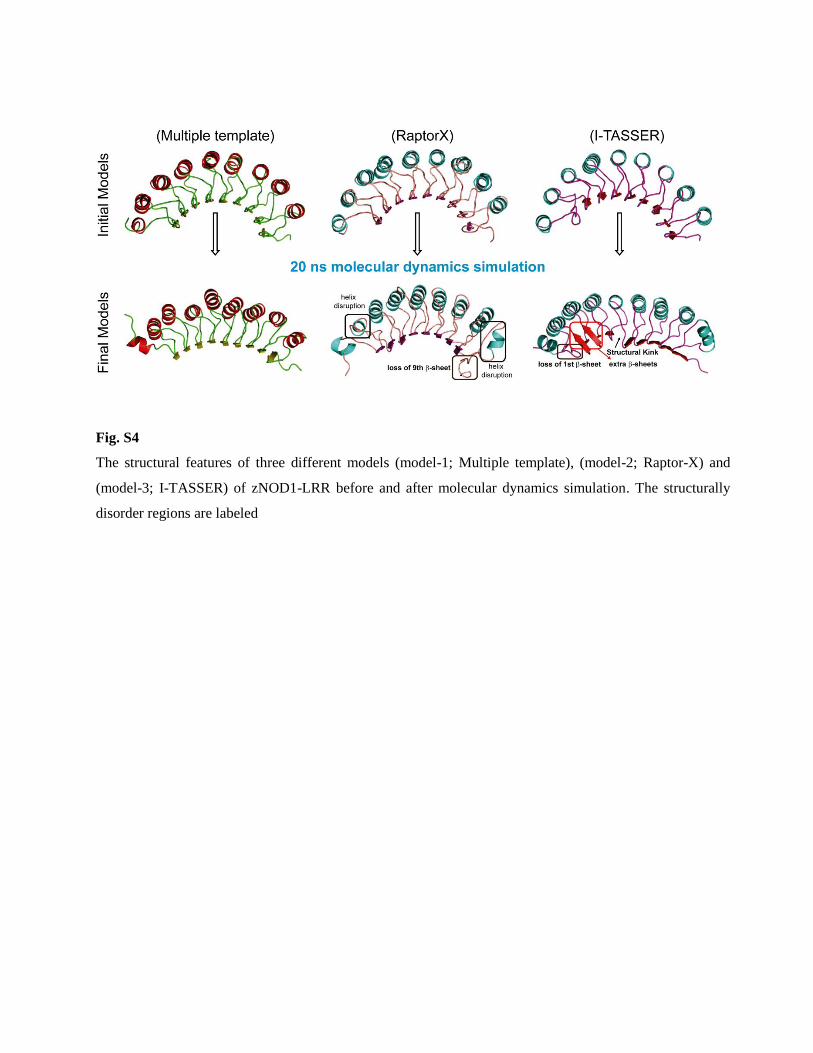
Fig. S4
The structural features of three different models (model-1; Multiple template), (model-2; Raptor-X) and
(model-3; I-TASSER) of zNOD1-LRR before and after molecular dynamics simulation. The structurally
disorder regions are labeled
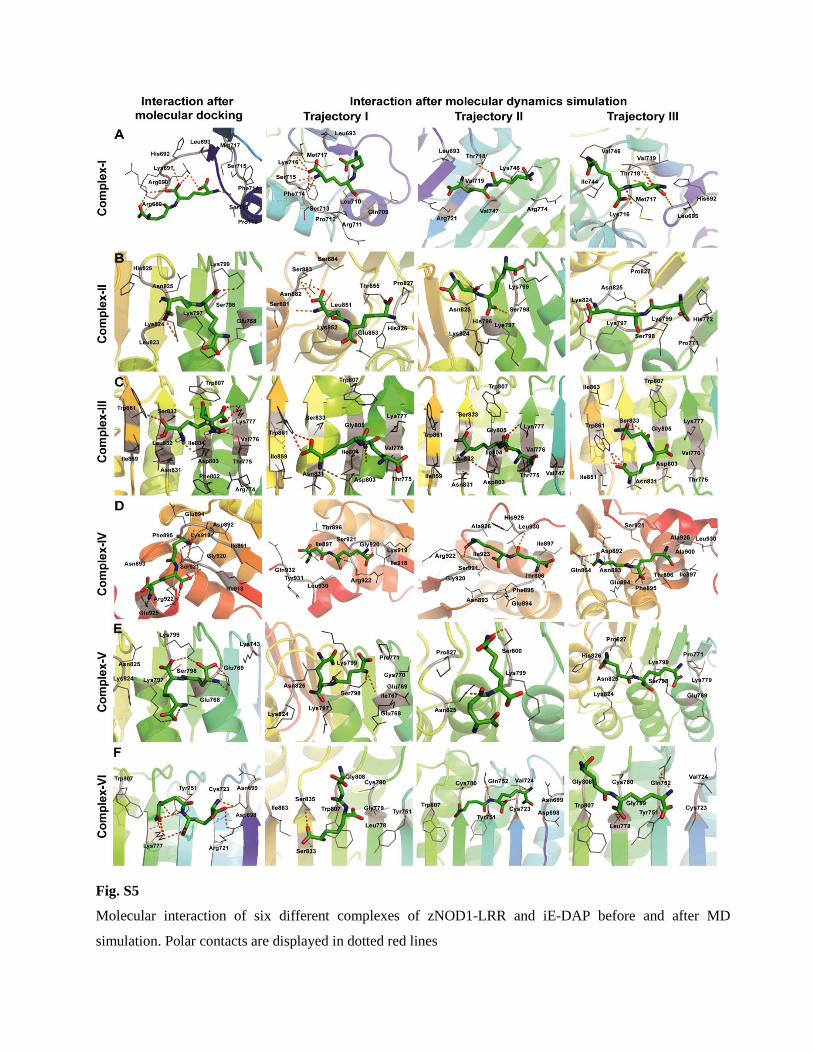
Fig. S5
Molecular interaction of six different complexes of zNOD1-LRR and iE-DAP before and after MD
simulation. Polar contacts are displayed in dotted red lines
Supplementary tables
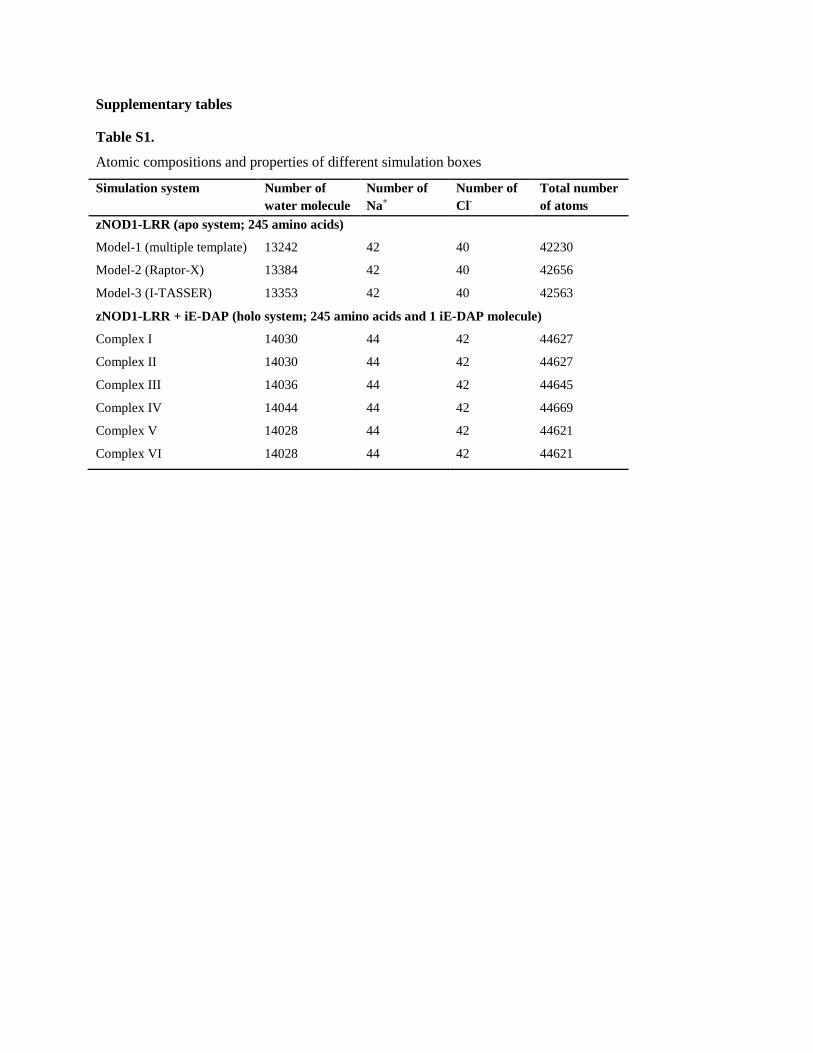
Table S1.
Atomic compositions and properties of different simulation boxes
Simulation system Number of
water molecule
Number of
Na+
Number of
Cl-
Total number
of atoms
zNOD1-LRR (apo system; 245 amino acids)
Model-1 (multiple template) 13242 42 40 42230
Model-2 (Raptor-X) 13384 42 40 42656
Model-3 (I-TASSER) 13353 42 40 42563
zNOD1-LRR + iE-DAP (holo system; 245 amino acids and 1 iE-DAP molecule)
Complex I 14030 44 42 44627
Complex II 14030 44 42 44627
Complex III 14036 44 42 44645
Complex IV 14044 44 42 44669
Complex V 14028 44 42 44621
Complex VI 14028 44 42 44621
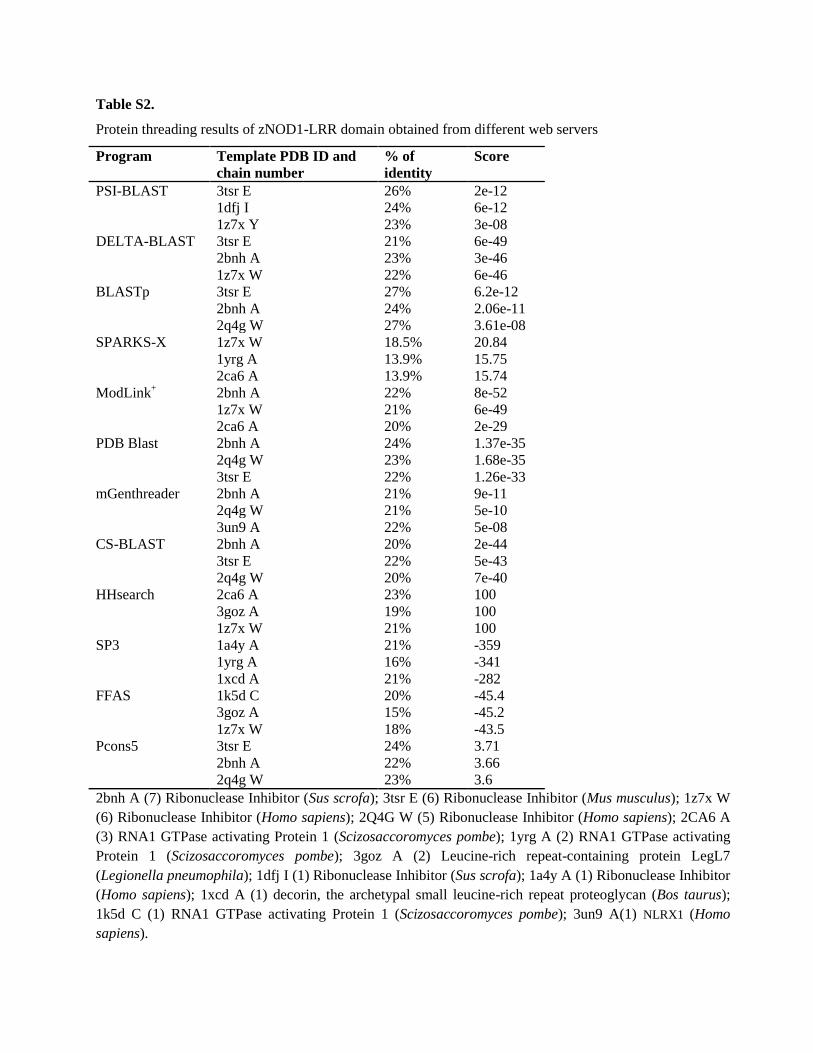
Table S2.
Protein threading results of zNOD1-LRR domain obtained from different web servers
Program Template PDB ID and
chain number
% of
identity
Score
PSI-BLAST 3tsr E 26% 2e-12
1dfj I 24% 6e-12
1z7x Y 23% 3e-08
DELTA-BLAST 3tsr E 21% 6e-49
2bnh A 23% 3e-46
1z7x W 22% 6e-46
BLASTp 3tsr E 27% 6.2e-12
2bnh A 24% 2.06e-11
2q4g W 27% 3.61e-08
SPARKS-X 1z7x W 18.5% 20.84
1yrg A 13.9% 15.75
2ca6 A 13.9% 15.74
ModLink+ 2bnh A 22% 8e-52
1z7x W 21% 6e-49
2ca6 A 20% 2e-29
PDB Blast 2bnh A 24% 1.37e-35
2q4g W 23% 1.68e-35
3tsr E 22% 1.26e-33
mGenthreader 2bnh A 21% 9e-11
2q4g W 21% 5e-10
3un9 A 22% 5e-08
CS-BLAST 2bnh A 20% 2e-44
3tsr E 22% 5e-43
2q4g W 20% 7e-40
HHsearch 2ca6 A 23% 100
3goz A 19% 100
1z7x W 21% 100
SP3 1a4y A 21% -359
1yrg A 16% -341
1xcd A 21% -282
FFAS 1k5d C 20% -45.4
3goz A 15% -45.2
1z7x W 18% -43.5
Pcons5 3tsr E 24% 3.71
2bnh A 22% 3.66
2q4g W 23% 3.6
2bnh A (7) Ribonuclease Inhibitor (Sus scrofa); 3tsr E (6) Ribonuclease Inhibitor (Mus musculus); 1z7x W
(6) Ribonuclease Inhibitor (Homo sapiens); 2Q4G W (5) Ribonuclease Inhibitor (Homo sapiens); 2CA6 A
(3) RNA1 GTPase activating Protein 1 (Scizosaccoromyces pombe); 1yrg A (2) RNA1 GTPase activating
Protein 1 (Scizosaccoromyces pombe); 3goz A (2) Leucine-rich repeat-containing protein LegL7
(Legionella pneumophila); 1dfj I (1) Ribonuclease Inhibitor (Sus scrofa); 1a4y A (1) Ribonuclease Inhibitor
(Homo sapiens); 1xcd A (1) decorin, the archetypal small leucine-rich repeat proteoglycan (Bos taurus);
1k5d C (1) RNA1 GTPase activating Protein 1 (Scizosaccoromyces pombe); 3un9 A(1) NLRX1 (Homo
sapiens).
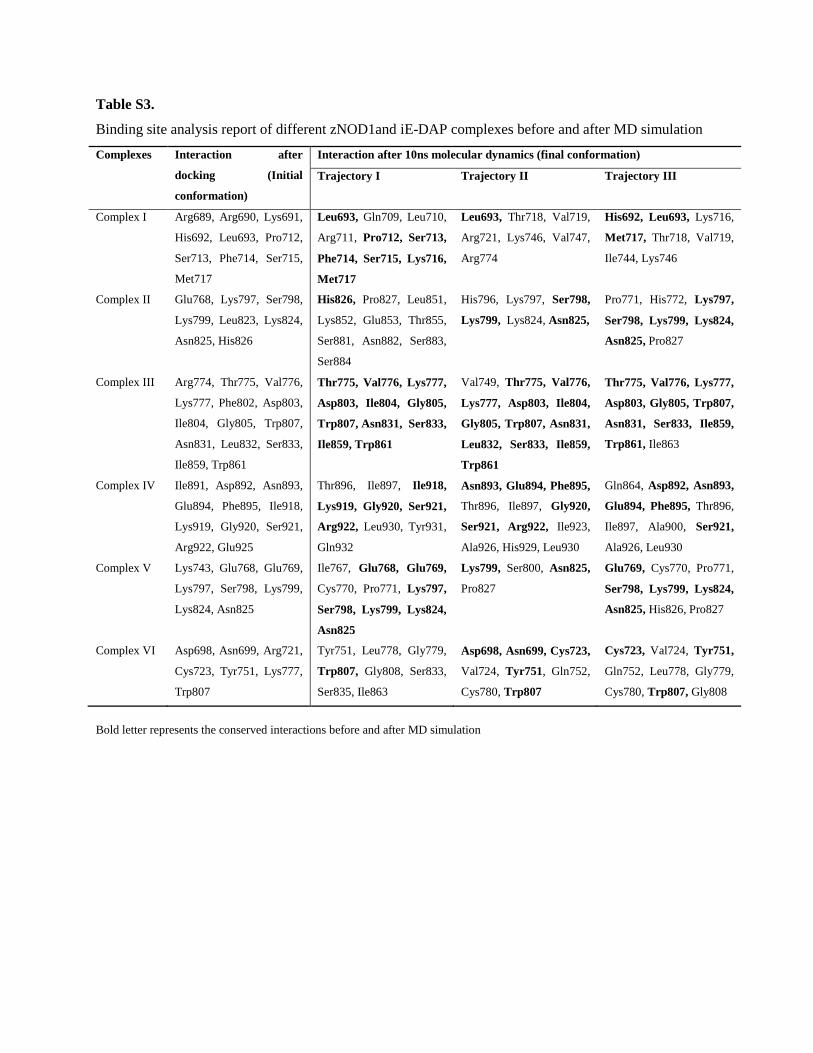
Table S3.
Binding site analysis report of different zNOD1and iE-DAP complexes before and after MD simulation
Complexes Interaction after
docking (Initial
conformation)
Interaction after 10ns molecular dynamics (final conformation)
Trajectory I Trajectory II Trajectory III
Complex I Arg689, Arg690, Lys691,
His692, Leu693, Pro712,
Ser713, Phe714, Ser715,
Met717
Leu693, Gln709, Leu710,
Arg711, Pro712, Ser713,
Phe714, Ser715, Lys716,
Met717
Leu693, Thr718, Val719,
Arg721, Lys746, Val747,
Arg774
His692, Leu693, Lys716,
Met717, Thr718, Val719,
Ile744, Lys746
Complex II Glu768, Lys797, Ser798,
Lys799, Leu823, Lys824,
Asn825, His826
His826, Pro827, Leu851,
Lys852, Glu853, Thr855,
Ser881, Asn882, Ser883,
Ser884
His796, Lys797, Ser798,
Lys799, Lys824, Asn825,
Pro771, His772, Lys797,
Ser798, Lys799, Lys824,
Asn825, Pro827
Complex III Arg774, Thr775, Val776,
Lys777, Phe802, Asp803,
Ile804, Gly805, Trp807,
Asn831, Leu832, Ser833,
Ile859, Trp861
Thr775, Val776, Lys777,
Asp803, Ile804, Gly805,
Trp807, Asn831, Ser833,
Ile859, Trp861
Val749, Thr775, Val776,
Lys777, Asp803, Ile804,
Gly805, Trp807, Asn831,
Leu832, Ser833, Ile859,
Trp861
Thr775, Val776, Lys777,
Asp803, Gly805, Trp807,
Asn831, Ser833, Ile859,
Trp861, Ile863
Complex IV Ile891, Asp892, Asn893,
Glu894, Phe895, Ile918,
Lys919, Gly920, Ser921,
Arg922, Glu925
Thr896, Ile897, Ile918,
Lys919, Gly920, Ser921,
Arg922, Leu930, Tyr931,
Gln932
Asn893, Glu894, Phe895,
Thr896, Ile897, Gly920,
Ser921, Arg922, Ile923,
Ala926, His929, Leu930
Gln864, Asp892, Asn893,
Glu894, Phe895, Thr896,
Ile897, Ala900, Ser921,
Ala926, Leu930
Complex V Lys743, Glu768, Glu769,
Lys797, Ser798, Lys799,
Lys824, Asn825
Ile767, Glu768, Glu769,
Cys770, Pro771, Lys797,
Ser798, Lys799, Lys824,
Asn825
Lys799, Ser800, Asn825,
Pro827
Glu769, Cys770, Pro771,
Ser798, Lys799, Lys824,
Asn825, His826, Pro827
Complex VI Asp698, Asn699, Arg721,
Cys723, Tyr751, Lys777,
Trp807
Tyr751, Leu778, Gly779,
Trp807, Gly808, Ser833,
Ser835, Ile863
Asp698, Asn699, Cys723,
Val724, Tyr751, Gln752,
Cys780, Trp807
Cys723, Val724, Tyr751,
Gln752, Leu778, Gly779,
Cys780, Trp807, Gly808
Bold letter represents the conserved interactions before and after MD simulation