Embed Size (px)
Citation preview
STRUCTURAL AND CATALYTIC PROPERTIES OF DNA/RNA-HEME COMPLEXES
by
Lester Chi-Heng Poon
B.Sc., University of British Columbia 2008
THESIS SUBMITTED IN PARTIAL FULFILLMENT OF THE REQUIREMENTS FOR THE DEGREE OF
MASTER OF SCIENCE
In the Department of Molecular Biology and Biochemistry
© Lester Chi-Heng Poon 2011 SIMON FRASER UNIVERSITY
Summer 2011
All rights reserved. However, in accordance with the Copyright Act of Canada, this work
may be reproduced, without authorization, under the conditions for Fair Dealing. Therefore, limited reproduction of this work for the purposes of private study, research,
criticism, review and news reporting is likely to be in accordance with the law, particularly if cited appropriately.

ii
Approval
Name: Lester Chi-Heng Poon
Degree: Master of Science
Title of Thesis: Structural and catalytic properties of DNA/RNA-heme
complexes
Examining Committee:
Chair: Dr. Mark Brockman Associate Professor of Molecular Biology and Biochemistry,
SFU
___________________________________________
Dr. Dipankar Sen
Senior Supervisor
Professor of Molecular Biology and Biochemistry, SFU
___________________________________________
Dr. Lisa Craig
Supervisor
Associate Professor of Molecular Biology and Biochemistry,
SFU
___________________________________________
Dr. Erika Plettner
Supervisor
Associate Professor of Chemistry, SFU
___________________________________________
Dr. Peter Unrau
Internal Examiner
Associate Professor of Molecular Biology and Biochemistry,
SFU
Date Defended/Approved: ___________________________________________
Last revision: Spring 09
Declaration of Partial Copyright Licence The author, whose copyright is declared on the title page of this work, has granted to Simon Fraser University the right to lend this thesis, project or extended essay to users of the Simon Fraser University Library, and to make partial or single copies only for such users or in response to a request from the library of any other university, or other educational institution, on its own behalf or for one of its users.
The author has further granted permission to Simon Fraser University to keep or make a digital copy for use in its circulating collection (currently available to the public at the “Institutional Repository” link of the SFU Library website <www.lib.sfu.ca> at: <http://ir.lib.sfu.ca/handle/1892/112>) and, without changing the content, to translate the thesis/project or extended essays, if technically possible, to any medium or format for the purpose of preservation of the digital work.
The author has further agreed that permission for multiple copying of this work for scholarly purposes may be granted by either the author or the Dean of Graduate Studies.
It is understood that copying or publication of this work for financial gain shall not be allowed without the author’s written permission.
Permission for public performance, or limited permission for private scholarly use, of any multimedia materials forming part of this work, may have been granted by the author. This information may be found on the separately catalogued multimedia material and in the signed Partial Copyright Licence.
While licensing SFU to permit the above uses, the author retains copyright in the thesis, project or extended essays, including the right to change the work for subsequent purposes, including editing and publishing the work in whole or in part, and licensing other parties, as the author may desire.
The original Partial Copyright Licence attesting to these terms, and signed by this author, may be found in the original bound copy of this work, retained in the Simon Fraser University Archive.
Simon Fraser University Library Burnaby, BC, Canada
iii
Abstract
DNA and RNA G-quadruplexes have been shown to catalyze 1-electron oxidation
reactions when bound to heme. In this work, we set out to explore the fundamental
nature of G-quadruplexes that allow for heme binding, and the potential of nucleoheme
complexes in catalyzing other heme-related enzymatic reactions. A combination of
spectroscopic and gel-based tools was used to observe structural features of nucleoheme
complexes. We determined that the in vitro selected heme apatamer, PS2.M, is highly
polymorphic and predominantly parallel-stranded. The ability of many parallel G-
quadruplexes to bind heme and perform peroxidase reactions led us to believe that some
nucleoheme complexes may be capable of catalyzing oxygen transfer or 2-electron
oxidation reactions. By using gas chromatography and high performance liquid
chromatography analysis, we determined that nucleoheme complexes were capable of
oxidizing electron-rich substrates: thioanisole, indole, and styrene. This discovery has
expanded our understanding of the catalytic repertoire of nucleic acids, which leads to
questions about the consequences and potential of this catalytic ability.
Keywords: Guanine (G)-quadruplex; Heme; Oxidation reaction; DNAzyme; Ribozyme

iv
Dedication
To my loving family and Iris for your unflinching support. I will always be grateful for
all the sacrifices all of you have made. To Nancy, Lucy and Sammy for being the greatest
piggies a person could ever want.

v
Acknowledgements
I would like to express my deepest gratitude to Dr. Dipankar Sen for his support,
guidance, and inspiration over the years. I thank my supervisory committee members,
Dr. Lisa Craig and Dr. Erika Plettner for their advice and valuable insight. I thank Dr.
Peter Unrau for being my internal examiner and for his well-timed humour. I thank Dr.
Mark Brockman for taking the time from his busy schedule to chair my defence.
I would like to express my special gratitude to all past, present, and honoury
members of the Sen laboratory. I shall always be grateful for your friendship.
I would like to thank all members of the CTEF group for their help and friendship
throughout the years. I would like to specifically thank Dr. Neil Branda and Dr. Byron
Gates for their mentorship. I owe a substantial portion of my research to the CTEF
group.
I would like to thank Dr. Andrew Bennet and Dr. Frédéric Pio for their helpful
collaborations. I wish to thank Dr. Regine Gries and Hongwen Chen for their time and
expertise. I would also like to extend thanks to the laboratories of Dr. Gerhard Gries, Dr.
Robert Britton and Dr. Robert Young.
Special thanks to friends and staff in the MBB and Chemistry departments for the
helpful hallway discussions and their support.
Finally, I would like to thank my family for their committment, support and
patience.

vi
Table of Contents
Approval .......................................................................................................................................... ii
Abstract .......................................................................................................................................... iii
Dedication ....................................................................................................................................... iv
Acknowledgements .......................................................................................................................... v
Table of Contents ............................................................................................................................ vi
List of Figures .............................................................................................................................. viii
List of Tables .................................................................................................................................... x
List of Abbreviations ....................................................................................................................... xi
1: Introduction ................................................................................................................................ 1
1.1 Nucleic acids ........................................................................................................................... 1
1.1.1 Fundamentals of guanine-quadruplexes ..................................................................... 2 1.1.2 Factors that stabilize G-quadruplexes ........................................................................ 4
1.2 Peroxidases and monooxygenases: enzymes that catalyze oxidation reactions ...................... 8
1.2.1 Key structural differences between peroxidases and monooxygenases that
lead to different mechanisms of Compound I formation ......................................... 11 1.2.2 Key structural differences between peroxidases and monoxygenases that
lead to 1- or 2-electron oxidation ............................................................................. 17 1.2.3 Catalytic antibodies that perform peroxidase reactions............................................ 24
1.3 A guanine-rich aptamer with peroxidase activity when bound to heme ............................... 26
2: Folding studies of the active PS2.M species ........................................................................... 31
2.1 Introduction ........................................................................................................................... 31
2.2 Materials and methods .......................................................................................................... 32
2.2.1 Materials ................................................................................................................... 32 2.2.2 Purifying nucleic acids using polyacrylamide gel .................................................... 32 2.2.3 Radiolabelling DNA by phosphorylation with γ-
32P-ATP ....................................... 34
2.2.4 Native gels of G-quadruplexes under varying conditions ........................................ 36 2.2.5 Verification of degradation of oligonucleotides ....................................................... 39 2.2.6 Circular dichroism spectroscopy of PS2.M under varying conditions ..................... 40 2.2.7 Dimethyl sulfate protection assay of G-quadruplex forming
oligonucleotides ....................................................................................................... 42 2.2.8 Kinetics of 2,2'-azino-bis(3-ethylbenzthiazoline-6-sulphonic acid) (ABTS)
oxidation at 4ºC and 21ºC ........................................................................................ 45 2.2.9 Measuring binding constants between hemin and G-quadruplex forming
oligonucleotides at 4ºC and 21ºC. ............................................................................ 47 2.2.10 Measuring the pKa values of various water-hemin complexes ................................ 48
2.3 Results and discussion ........................................................................................................... 50
2.3.1 Structural analysis of G-quadruplexes with native gels under various
conditions ................................................................................................................. 50
vii
2.3.2 Investigation of the structure of PS2.M in various conditions using circular
dichroism spectroscopy ............................................................................................ 57 2.3.3 Using a methylation protection assay to probe the folding of PS2.M ...................... 63 2.3.4 Investigating the peroxidase active species of PS2.M by observing the
kinetics of ABTS oxidation at 4ºC and 21ºC ........................................................... 68 2.3.5 Studies to determine the pKa values of water-hemin complexes in the
presence of various DNA oligonucleotides. ............................................................. 71
2.4 Chapter conclusion ................................................................................................................ 74
3: Exploration of a new catalytic property of nucleoheme complexes ..................................... 77
3.1 Introduction ........................................................................................................................... 77
3.2 Materials and methods .......................................................................................................... 79
3.2.1 Materials ................................................................................................................... 79 3.2.2 Time course of thioanisole sulfoxidation ................................................................. 79 3.2.3 Source of the oxygen in thioanisole sulfoxide ......................................................... 81 3.2.4 Stereochemistry of thioanisole sulfoxidation ........................................................... 81 3.2.5 Para substituted thioanisole sulfoxidation ................................................................ 82 3.2.6 Hammett analysis of thioanisole sulfoxidation ........................................................ 83 3.2.7 Thioanisole sulfoxidation by various DNA and RNA sequences ............................ 83 3.2.8 Indole oxidation reactions ........................................................................................ 84 3.2.9 Indigo cuvette image protocol .................................................................................. 84 3.2.10 Time course of styrene oxidation ............................................................................. 85 3.2.11 Source of the oxygen atom in styrene oxide ............................................................ 86
3.3 Results and discussion ........................................................................................................... 87
3.3.1 Catalyzing the oxidation of thioanisole to thioanisole sulfoxide ............................. 87 3.3.2 Determining the source of the oxygen atom in thioanisole sulfoxide, the
oxidation product of thioanisole ............................................................................... 88 3.3.3 Probing the active site of the PS2.M-heme complex by investigating the
enantioselectivity of the enzyme .............................................................................. 92 3.3.4 Hammett analysis of thioanisole sulfoxidation as catalyzed by PS2.M-heme ......... 94 3.3.5 Investigating the general ability of G-quadruplex-heme complexes in
catalyzing the sulfoxidation of thioanisole ............................................................... 99 3.3.6 Catalyzing the 2-electron oxidation of indole ........................................................ 101 3.3.7 Investigating the general ability of G-quadruplex-heme complexes in
catalyzing the oxidation of indole .......................................................................... 106 3.3.8 Catalyzing the 2-electron oxidation of styrene ....................................................... 108 3.3.9 Determining the source of the oxygen atom in styrene oxide, a product of
styrene oxidation .................................................................................................... 110
3.4 Chapter conclusion .............................................................................................................. 112
4: Conclusion and outlook ......................................................................................................... 115
Reference List ............................................................................................................................. 120

viii
List of Figures
Figure 1.1: The key stabilizing and bonding features of a guanine-quartet. ..................................... 4
Figure 1.2: Cation localization within a guanine-quadruplex. .......................................................... 7
Figure 1.3: The catalytic cycle of cytochrome P450 monooxygenase. ............................................ 9
Figure 1.4: The pull-push effect in the heterolytic cleavage of the O-O bond. .............................. 13
Figure 1.5: The classical peroxidase mechanism of Compound I formation by heterolytic
cleavage of hydrogen peroxide inside the active site of peroxidases, such as
horseradish peroxidase or cytochrome c peroxidase. ................................................... 15
Figure 1.6: The different paths for substrate access to the heme cofactor in peroxidases
and in P450s. ................................................................................................................ 19
Figure 1.7: Probing the active site of peroxidases and P450s by using a suicide substrate
to covalently attach to the heme molecule inside the enzyme. .................................... 22
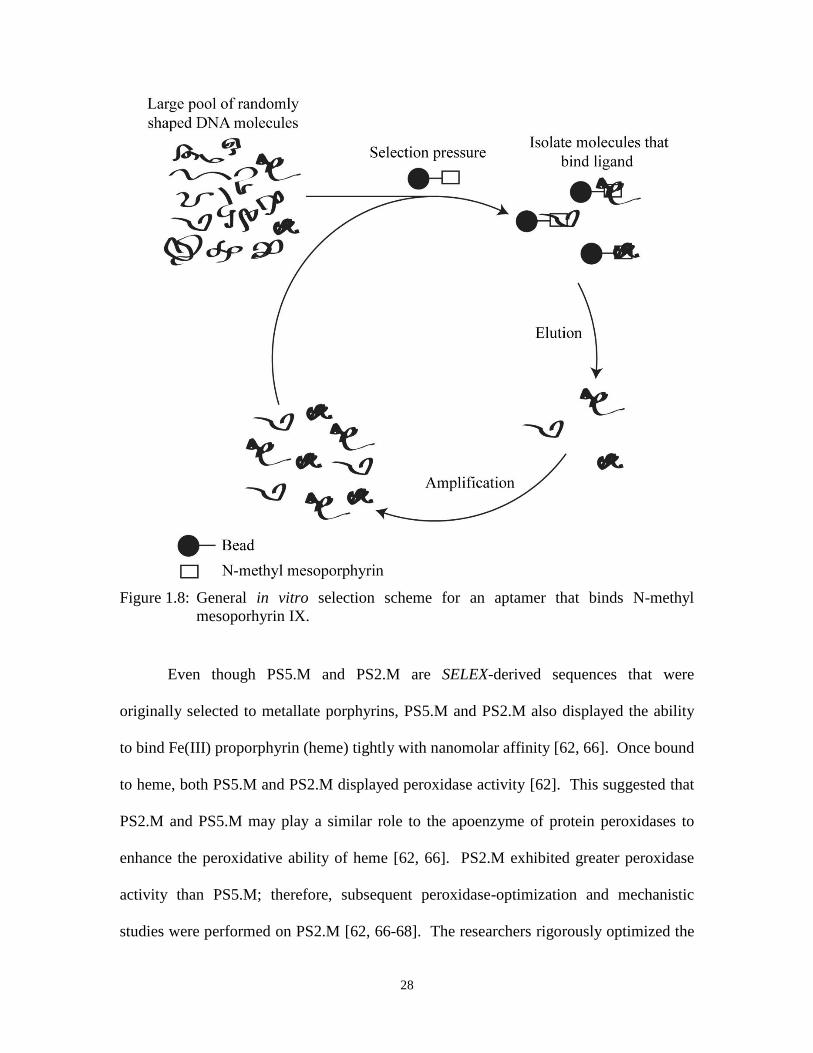
Figure 1.8: General in vitro selection scheme for an aptamer that binds N-methyl
mesoporhyrin IX. ......................................................................................................... 28
Figure 2.1: Analysis of the folding pattern of G-quadruplex forming sequences in various
conditions by polyacrylamide gel electrophoresis. ...................................................... 52
Figure 2.2: The effects of increasing DNA concentration on the structure of G-quadruplex
forming oligonucleotides. ............................................................................................ 55
Figure 2.3: The relationship between the structure of PS2.M and various conditions. .................. 57
Figure 2.4: CD spectra of PS2.M, a G-quadruplex-forming oligonucleotide that has
peroxidase activity when bound to heme. .................................................................... 58
Figure 2.5: CD spectra of PS2.M in the presence of several salt conditions. ................................. 61
Figure 2.6: Scheme of PS2.M folding in the presence of potassium ions. ..................................... 62
Figure 2.7: Guanine specific reaction with dimethylsulfate. .......................................................... 64
Figure 2.8: Methylation protection assay to probe the structure of PS2.M. ................................... 66
Figure 2.9: Kinetics of ABTS oxidation by G-quadruplex-forming oligonucleotides in the
presence of hemin at 4ºC and 21ºC. ............................................................................. 69
Figure 2.10:Acid-alkaline transition of water molecules bound to the ferric iron of heme ........... 72
Figure 2.11:Plots of ratios of absorbance at 355 nm and 404 nm over a range of pH
values to determine the pKa values of water-hemin complexes. .................................. 74
Figure 3.1: Scheme of the two possible oxygen transfer mechanisms. .......................................... 78
Figure 3.2: Time course study of thioanisole oxidation by PS2.M-heme complex. ....................... 88
ix
Figure 3.3: Determining the source of the oxygen atom in the final oxidation product,
thioanisole sulfoxide by GC-MS. ................................................................................. 89
Figure 3.4: A scheme of the possible origin of the oxygen atom in the PS2.M-heme
catalyzed oxidation of thioanisole to thioanisole sulfoxide. ........................................ 90
Figure 3.5: Enantioselectivity of the PS2.M-heme complex was determined by chiral
HPLC of the thioanisole oxidation product. ................................................................. 93
Figure 3.6: The transition state and intermediate of two possible thioanisole sulfoxidation
routes. ........................................................................................................................... 96
Figure 3.7: Hammett analysis of the PS2.M-heme catalyzed oxygen transfer reaction of
thioanisole substrates. .................................................................................................. 97
Figure 3.8: The sulfoxidation of thioanisole catalyzed by G-quadruplex-heme complexes. ....... 100
Figure 3.9: PS2.M-heme catalyzed oxygen transfer to indole. ..................................................... 102
Figure 3.10:The products identified from the oxidation of indole by PS2.M-heme. ................... 105
Figure 3.11:The oxidation of indole catalyzed by G-quadruplex-heme complexes. .................... 107
Figure 3.12:PS2.M-heme catalyzed 2-electron oxidation of styrene. .......................................... 109
Figure 3.13:GC-MS data of H218
O2 experiments for styrene oxidation. ...................................... 111
Figure 3.14:The structure of Fe(III) heme docked, using the Autodock program, upon the
NMR-derived solution structure of a G-quadruplex formed by the Bcl-2 DNA
oligomer. .................................................................................................................... 114
Figure 4.1: A proposed structure of the complex formed by heme binding to PS2.M. ................ 117
x
List of Tables
Table 2.1: DNA sequences. ........................................................................................................... 32
Table 2.2: Binding constants of various G-quadruplex-forming oligonucleotides ....................... 71
Table 3.1: DNA and RNA sequencesa,b
......................................................................................... 79
Table 3.2: The identities of masses from the ionization of thioanisole. ........................................ 91
Table 3.3: Table of the identities and the masses of peaks labelled in Figure 3.9. ..................... 103
Table 3.4: The identities of masses from the ionization of styrene oxide. .................................. 112
xi
List of Abbreviations
A Adenosine
ABTS 2,2‟-azinobis(3-ethylbenzothiozoline)-6-sulfonic acid
ATP Adenosine triphosphate
bp Base pair
C Cytidine
CD Circular dichroism
Cs Cesium
DMF Dimethyl formamide
DMS Dimethylsulfate
DMSO Dimethylsulfoxide
DNA Deoxyribonucleic acid
ds (prefix) Double stranded
EDTA Ethylenediaminetetraacetate
Fe Iron
FID Flame ionization detector
G Guanine
GC Gas chromatography
H-bonding Hydrogen-bonding
HEPES 4-(2-hydroxyethyl)-1-piperazineethanesulfonic acid
xii
HPLC High performance liquid chromatography
KCl Potassium chloride
LC Liquid chromatography
Li Lithium
MS Mass spectrometer
NaCl Sodium chloride
NH4OH Ammonium hydroxide
NMM N-methyl mesoporphrin IX
OAc Acetate
P450 Cytochrome P450 monooxygenase
r (prefix) RNA
RNA Ribonucleic acid
SELEX Systematic evolution of ligands by exponential enrichment
T Thymidine
TE Tris-EDTA
TEMED Tetramethylethylenediamine
Tris Tris(hydroxymethyl)aminomethane
UV Ultraviolet
1
1: Introduction
1.1 Nucleic acids
In the age of genomics, sometimes it is easy to forget that the complexities of
genetics are the result of a simple code composed of four chemical building blocks. Prior
to the understanding that nucleic acids, specifically deoxyribonucleic acids (DNA), were
responsible for housing genetic information, it was thought that nucleic acids were too
chemically simple to serve as genetic material. Since the chemical diversity of nucleic
acids derives from only a few canonical nitrogenous bases, it was postulated that protein
was the polymer that stored genetic information [1]. Proteins in contrast to nucleic acids
contain a wealth of chemical functionalities which allow proteins to be efficient catalysts,
but would this complexity make protein the ideal carrier of genetic material?
The extensive amount of functionalities that proteins provide makes them an ideal
building block for enzyme creation. Despite the diversity of functionalities that proteins
exhibit, they lack the key chemical stability and simplicity seen in nucleic acids. DNA is
an ideal chemical vessel to house the genetic code because it is chemically stable and has
only four different building blocks, which make DNA much simpler to replicate with
high fidelity and high frequency.
The fact that DNA was the biopolymer that stored genetic information was not
always evident. Individuals in the scientific community believed that the genetic code
was fabricated by amino acids until the Avery–MacLeod–McCarty experiment. In the
2
late 1930‟s and early 1940‟s, it was discovered that bacterial virulence was able to be
transferred from one strain of bacteria to another [2]. Avery and colleagues took this
discovery a step further and attempted to discover the biopolymer that was responsible
for the transformation; thus, this would also show the identity of the biopolymer
responsible for containing the genetic code. Through careful purification and
preparation, Avery and colleagues were able to separate DNA from the other contents of
the bacteria. They found that the DNA alone from infectious strains of bacteria was
capable of transforming non-infectious bacterial strains to infectious bacterial strains [3].
1.1.1 Fundamentals of guanine-quadruplexes
Around this time, there was a lot of momentum building for research in the field
of nucleic acids, as the structure of double stranded DNA was recently determined to be a
right-handed double helix [4]. The discovery of the DNA double helix was a major
milestone in science, specifically for nucleic acids research. The structural determination
of DNA has not only inspired researchers, but has permeated the public consciousness.
As a result, when we think about DNA, we typically think about the B-type helix of DNA
and none of the other secondary and tertiary structures that DNA also forms. However,
as the field of molecular biology matured, there has been an increased interest in the
minute structural fluctuations along the double helix and the other structures formed by
nucleic acids.
Recently, a bright light has been shone on one specific DNA formation known as
telomeres. The 2009 Nobel Prize in Physiology or Medicine was awarded to Dr.
Elizabeth Blackburn, Dr. Carol Greider, and Dr. Jack Szostak for their discovery and
characterization of telomeres and telomerase, the enzyme that adds the telomeric
3
sequence to the ends of chromosomes [5]. Telomeres are structures that serve as the caps
at the ends of the chromosomes that keep the integrity of the chromosomes intact [6].
Telomeres have also been associated with the aging process and the longevity of cells [7].
The length of the telomere shortens with each successive cell division, acting like an
internal clock for the cell [7]. Shortening of the telomeres to a critical length results in
cell death [7]. The sequence of the telomeres from different organisms have shown a
large abundance of guanines, which has major implications on the folding of the
secondary structure of the telomeric ends [6]. These higher ordered structures are
thought to be guanine-quadruplexes (G-quadruplexes), as determined by in vitro studies
[8, 9].
More recently, non-telomeric sequences that may form G-quadruplexes have been
of increasing interest for researchers [10, 11]. Huppert and Balasubramanian showed that
there are close to 400,000 putative G-quadruplex sequences in the human genome, which
is roughly 1 in every 10,000 bases [12]. The prevalence of possible G-quadruplex-
forming sequences is even more striking in promoter regions of the human genome, with
over 40% of promoter regions containing sequences that could form G-quadruplexes
[10]. In addition, some of the promoters that have been postulated to contain putative G-
quadruplex sequences have also been identified to control the expression of proto-
oncogenes, like the promoter of c-MYC and BCL-2 [13]. Hurley and colleagues
suppressed the expression of c-MYC with a known G-quadruplex-stabilizing porphyrin-
derivative, 5,10,15,20-tetrakis(N-methyl-4-pyridyl)-porphyrin [13]. These results by
Hurley and colleagues have ignited interest in developing therapeutics for cancer
treatment with compounds that interact with G-quadruplexes [11].

4
The G-quadruplex is a structure formed by multiple guanine-quartets (G-quartets).
Gellert et al. used crystallographic methods to demonstrate that guanosine
monophosphate monomers were capable of self assembly to form a tetrameric
arrangement that they called G-quartets, depicted in Figure 1.1 [14]. There have been a
variety of techniques used to detect and analyze G-quadruplexes, ranging from circular
dichroism, infrared, and nuclear magnetic resonance spectroscopy to X-ray fiber and
crystal diffraction studies [15-18].
Figure 1.1: The key stabilizing and bonding features of a guanine-quartet.
1.1.2 Factors that stabilize G-quadruplexes
The factors that stabilize G-quadruplexes are similar to those that stabilize DNA
duplexes, such as base stacking and hydrogen bonding (H-bonding). A G-quadruplex is a
highly stable structure formed from multiple G-quartets stacked upon each other. The
“stacking force” that is vital in both duplex and quadruplex formation is a summation of
several forces. Since the bases of nucleic acids are non-polar entities, they will self-
associate to limit their interaction with water. The stability of the association of nuclear

5
bases with each other is the result of hydrophobic, electrostatic, and van der Waals forces
[19, 20].
Not unlike the stacking observed between adjacent bases in DNA duplexes, the
geometry of G-quartet stacks are heterogeneous along the length of the G-quadruplex
[21]. The G-quartets at the two ends of the quadruplex exhibit the greatest degree of
geometric heterogeneity as compared to the uniform quartets in the middle of the G-
quadruplex. The linker regions, the nucleotides between the tracts of guanines involved
in G-quartet formation, restrict the position of the guanosines which causes the G-
quartets at both ends of the stacks to tilt from the core of the G-quadruplex. As a result;
the linkers between guanine tracts play an important role in determining the positioning
of the G-quartets [21]. In addition, the G-quartets at the core of the quadruplex tend to be
more planar and are less heterogeneous [21].
Within the G-quartets are four guanines Hoogsteen hydrogen (H)-bonded to each
other, as depicted in Figure 1.1 [22]. This involves the N1 position acting as a hydrogen
bond donor to the exocyclic oxygen at the sixth position of the adjacent guanine in the
quartet. Also, the exocyclic amino group at the C2 position acts as a hydrogen bond
donor to the nitrogen at the seventh position of the adjacent base. Since these interactions
repeat around the quartet, there is a total of eight H-bonds. The eight H-bonds between
four guanines give greater stability than the three H-bonds between a guanine-cytosine
base pair, as there are 2 H-bonds per base in a G-quartet compared to 1.5 H-bonds per
base in a GC base pair.
Aside from the number of H-bonds per base between a duplex and quadruplex,
the individual H-bonds between these two motifs are different. Each H-bond in a G-
6
quadruplex is about double the energy of an H-bond in a duplex [23]. Simulation studies
showed that a guanine-guanine paired through Hoogsteen H-bonding causes a
redistribution of electron density that strengthens additional H-bonds [23]. This
cooperative behavior of H-bonding is called resonance-assisted hydrogen-bonding [23].
This energy of bonding is further increased with the addition of metal cations in
the centre of the G-quartet [15]. Since the G-quartet brings several oxygen atoms within
close proximity of each other, a cation is needed to stabilize the electronically
unfavourable cyclic arrangement of oxygens through cation-dipole interactions between
the cation and the C6 exocyclic oxygen atoms of guanines [24]. The cations can be either
monovalent or divalent; the stability of the G-quadruplex due to cation interactions is
dependent on the radii of the ion and its hydration sphere [25]. As a result, lithium (Li+)
is too small and cesium (Cs+) is too large to stabilize the negative polarity at the core of a
G-quadruplex [24]. The two most studied cations for G-quadruplex stabilization are
potassium (K+) and sodium (Na
+) ions because they tend to cause the greatest stability in
G-quadruplexes [25].
As depicted in Figure 1.2, the K+ ions are larger than the Na
+ ions and fit in
between two G-quartets, while Na+ ions fit much closer to the plane of a G-quartet. K
+
ions have been experimentally demonstrated to have a greater stabilizing effect on G-
quadruplexes than Na+ ions. The stability that K
+ ions afford G-quadruplexes as
compared to Na+ ions can be seen in the difference in melting temperature between K
+
and Na+ stabilized G-quadruplexes, 8ºC for the oligomer derived from the human
telomeric sequence and 30ºC for the thrombin aptamer [26]. This higher stability
afforded by K+ ions is primarily driven by the relative ease of dehydrating K
+ ions as

7
compared to Na+ ions [27]. The combination of H-bonding, base stacking and cation
interactions help guanine-rich DNA and RNA form stable G-quadruplex structures.
Figure 1.2: Cation localization within a guanine-quadruplex.
8
1.2 Peroxidases and monooxygenases: enzymes that catalyze oxidation
reactions
Heme is a ubiquitous cofactor found in enzymes that have a wide variety of
functions. Heme-enzymes have abilities ranging from diatomic gas sensing to reduction-
oxidation reactions. The heme-enzymes that perform reduction-oxidation reactions are
some of the most widely studied and characterized enzymes [28]. Even within this group
of enzymes that perform redox reactions there are multiple subgroups that span a wide
range of oxidative functions. However, despite the wealth of knowledge accumulated for
these enzymes, there are still many unresolved mysteries. Two closely related groups of
heme-containing enzymes are the peroxidases, which perform 1-electron oxidation
reactions and the monooxygenases, which perform 2-electron oxidations [29]. The 1-
electron oxidation reactions involve a single electron abstraction from the reducing
substrate, while the 2-electron oxidation reactions involve an oxygen atom insertion into
the substrate.
Even though there is a difference of oxidative power between the two groups of
oxidative enzymes, the reactive intermediate with a high oxidation-potential for both
groups of enzymes is the same. The famed Compound I intermediate is believed to be
the reactive species for both peroxidases and monooxygenases. At the heart of
peroxidases and monooxygenases lies a heme cofactor, protoporphyrin IX containing
ferric iron (3+ oxidation state). Ferric heme is oxidized by peroxides in the case of
peroxidases and by molecular oxygen in the case of monoxygenases, to a higher oxidized
species called Compound I. In the case of P450 monooxygenases, several accessory
proteins are needed to transfer electrons to aid in the formation of Compound I. As
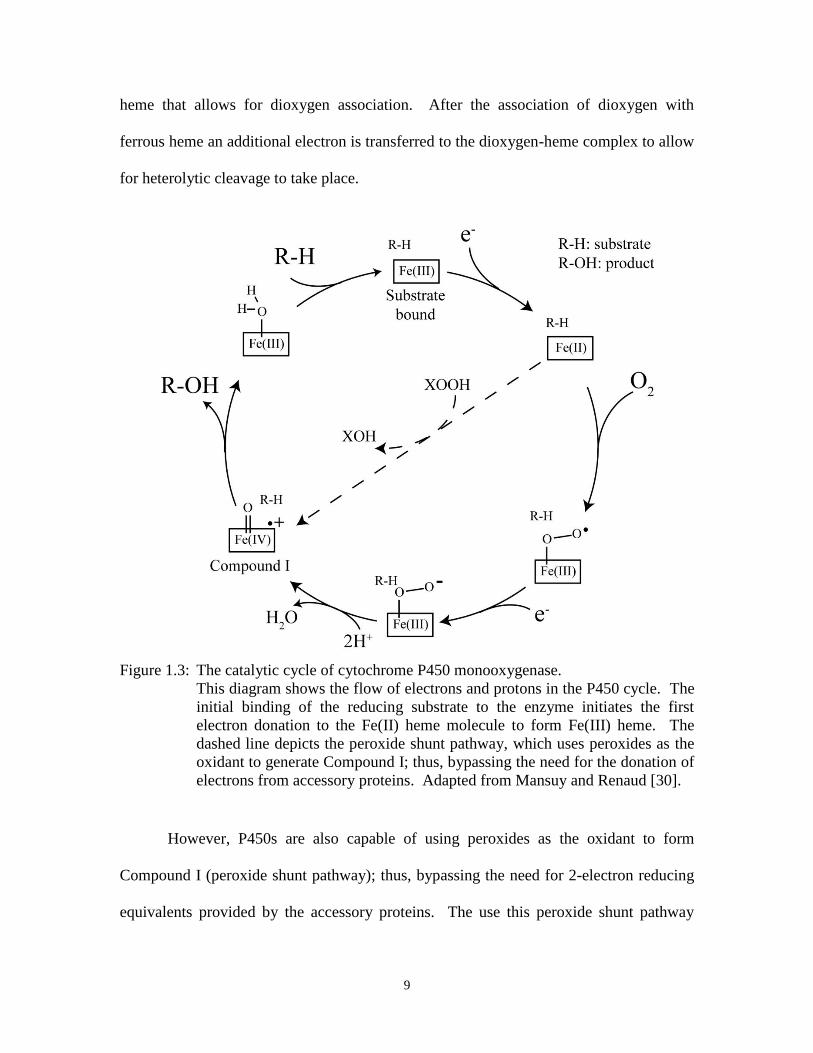
depicted in Figure 1.3, first there is an 1-electron reduction of Fe(III) heme to Fe(II)
9
heme that allows for dioxygen association. After the association of dioxygen with
ferrous heme an additional electron is transferred to the dioxygen-heme complex to allow
for heterolytic cleavage to take place.
Figure 1.3: The catalytic cycle of cytochrome P450 monooxygenase.
This diagram shows the flow of electrons and protons in the P450 cycle. The
initial binding of the reducing substrate to the enzyme initiates the first
electron donation to the Fe(II) heme molecule to form Fe(III) heme. The
dashed line depicts the peroxide shunt pathway, which uses peroxides as the
oxidant to generate Compound I; thus, bypassing the need for the donation of
electrons from accessory proteins. Adapted from Mansuy and Renaud [30].
However, P450s are also capable of using peroxides as the oxidant to form
Compound I (peroxide shunt pathway); thus, bypassing the need for 2-electron reducing
equivalents provided by the accessory proteins. The use this peroxide shunt pathway
10
allows researchers to study the activated Compound I species of P450 monooxygenases
and their ability to catalyze oxidation reactions without the need for accessory proteins.
This activated oxo-iron species contains an iron with a formal oxidation state of +5.
However, an electron is donated from the porphyrin to form Fe(IV) with a radical cation
delocalized on the porphyrin or in the case of cytochrome c peroxidase, an oxidized
equivalent is located on an amino acid residue (tyrosine) of the apoprotein.
As previously stated, the natural substrates, or the known compounds that the
enzymes encounter in their native systems, used as an oxidant to form Compound I for
peroxidases and monooxygenases are chemically different. However, some P450
enzymes found in Sphingomonas paucimobilis and Bacillus subtilis, have been
discovered that primarily use hydrogen peroxide as the oxidizing agent to form
Compound I [31]. These P450 enzymes have thus been termed peroxygenases instead of
monooxygenases. In addition to these natural peroxygenases, natural monooxygenases,
such as cytochrome P450s, are capable of using peroxides as an oxygen donor to form
Compound I. However, for monooxygenases the use of peroxides as the heme oxidant is
a slower process than activation by dioxygen. Once Compound I is formed,
monooxygenases catalyze oxygen transfer (2-electron oxidation) reactions, such as the
hydroxylation of camphor, and monooxygenases are also capable of 1-electron oxidation
reactions.
This array of oxidative activity is not limited to monooxygenases, as peroxidases
that naturally catalyze 1-electron oxidation reactions are also capable of performing other
oxidative catalysis. There are peroxidases that perform 2-electron oxidations as their
primary function in nature, such as chloroperoxidases that oxidize chloride to
11
hypochlorous acid [28, 29]. However, the majority of peroxidases do not perform
oxygen transfer reactions as their primary function. Instead, most peroxidases can be fed
with specific non-natural, electron rich substrates to force oxygen transfer to take place.
These non-natural substrates are compounds that the enzyme does not encounter in
nature. These reactions require electron-rich substrates, and proceed slower than if they
were catalyzed by the oxidatively more powerful monooxygenases, horseradish
peroxidase oxidizes styrene 200 times slower than P450s [32].
Once activated by hydrogen peroxide to form Compound I, peroxidases are
capable of inserting oxygen from hydrogen peroxide through the oxo-iron heme
intermediate to the substrate. These substrates are electron rich, such as styrene, as
compared to the substrates that monooxygenases are capable of oxidizing, such as
camphor [28, 29]. Even though substrates for most 2-electron oxidation reactions are not
the natural substrate for peroxidases, peroxidases still show a certain degree of specificity
towards these non-natural substrates [28, 29]. The natural substrates/reactions are those
that the enzyme catalyzes in nature. This means that not all peroxidases can perform the
same oxygen transfer reactions to the same substrates, and that the peroxidases that
catalyze the 2-electron oxidation of the same substrate may not produce the same
products. The ability to differentiate between substrates is largely attributed to the active
site of the peroxidase.
1.2.1 Key structural differences between peroxidases and monooxygenases that
lead to different mechanisms of Compound I formation
Detailed analyses of crystal structures from peroxidases and P450s have shed
light on some key structural differences that affect the catalysis performed by peroxidases

12
and monooxygenases. There are two sides in the active site of heme-enzymes, the
proximal and distal sites, which is separated by the heme molecule. The distal site is
where the reducing substrate and the oxidant come in contact with the heme molecule.
The proximal site houses an axial ligand that coordinates the iron of the heme molecule.
The obvious difference between classical peroxidases and classical
monooxygenases is the proximal ligand that coordinates the iron atom of the heme
molecule. The proximal ligand or the fifth ligand of classical peroxidases is a histidine,
whereas P450 enzymes contain a cysteine. The cysteine side chain contains a thiol
functionality that is electron rich. As compared to the nitrogen in histidine, the thiol
moiety is more capable of providing electron density to the iron atom in heme; therefore,
the thiol has a stronger electron “push” effect.
The push effect is important in the cleavage of the bond between the oxygen
atoms in the hydrogen peroxide molecule. The rate of hydrogen peroxide cleavage was
reduced 5 orders of magnitude when the proximal histidine was mutated to leucine in
cytochrome c peroxidase [33]. To further aid in the heterolytic cleavage of hydrogen
peroxide, a proton is delivered to the terminal oxygen to “pull” apart the peroxide bond
by creating a better leaving group. As depicted in Figure 1.4, the pull-push effect helps
peroxidases to form the reactive oxo-iron species, Compound I [34].
13
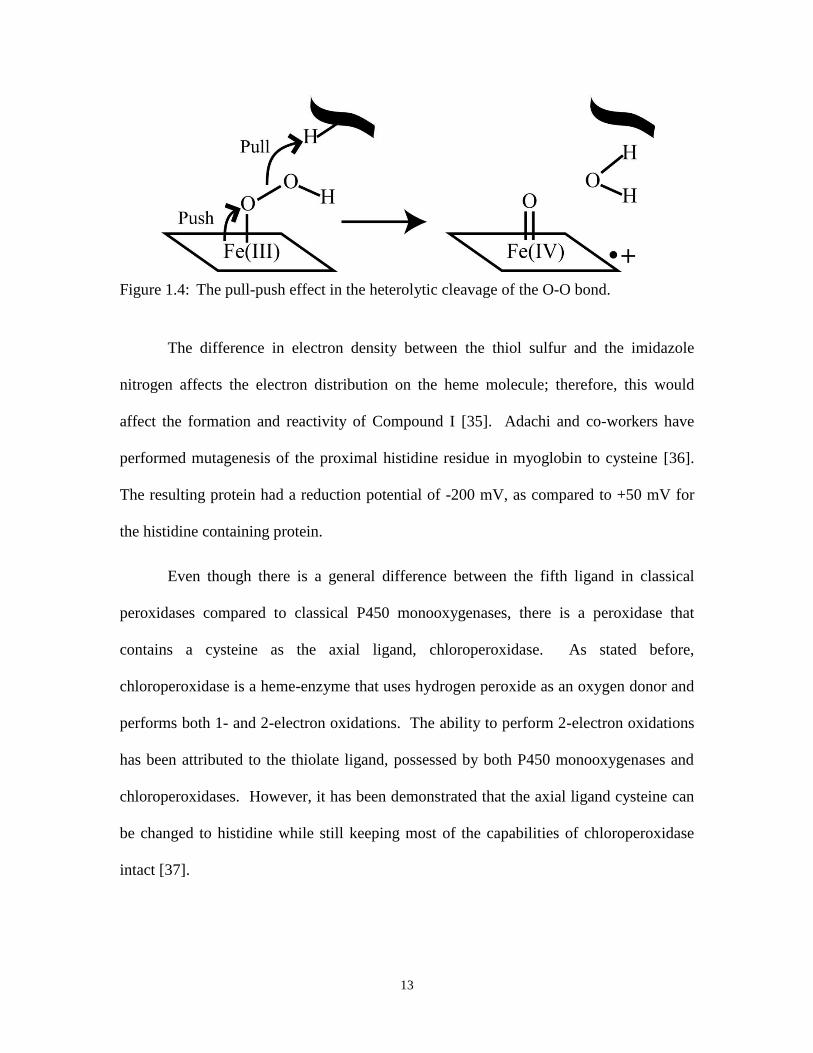
Figure 1.4: The pull-push effect in the heterolytic cleavage of the O-O bond.
The difference in electron density between the thiol sulfur and the imidazole
nitrogen affects the electron distribution on the heme molecule; therefore, this would
affect the formation and reactivity of Compound I [35]. Adachi and co-workers have
performed mutagenesis of the proximal histidine residue in myoglobin to cysteine [36].
The resulting protein had a reduction potential of -200 mV, as compared to +50 mV for
the histidine containing protein.
Even though there is a general difference between the fifth ligand in classical
peroxidases compared to classical P450 monooxygenases, there is a peroxidase that
contains a cysteine as the axial ligand, chloroperoxidase. As stated before,
chloroperoxidase is a heme-enzyme that uses hydrogen peroxide as an oxygen donor and
performs both 1- and 2-electron oxidations. The ability to perform 2-electron oxidations
has been attributed to the thiolate ligand, possessed by both P450 monooxygenases and
chloroperoxidases. However, it has been demonstrated that the axial ligand cysteine can
be changed to histidine while still keeping most of the capabilities of chloroperoxidase
intact [37].

14
The interchangeability of the axial ligand between histidine and cysteine suggests
that the only requirement for the proximal ligand is an electron rich functionality and that
the ligand‟s identity may not be as important. This further suggests that the proximal
environment of the heme molecule in heme-enzymes may not be the ultimate determining
factor for the degree of substrate oxidation and the type of substrates accepted by the
enzyme. As a result, several groups propose that the distal pocket may contain residues
that are responsible for the selectivity of the enzyme for both the reducing and oxidizing
substrate.
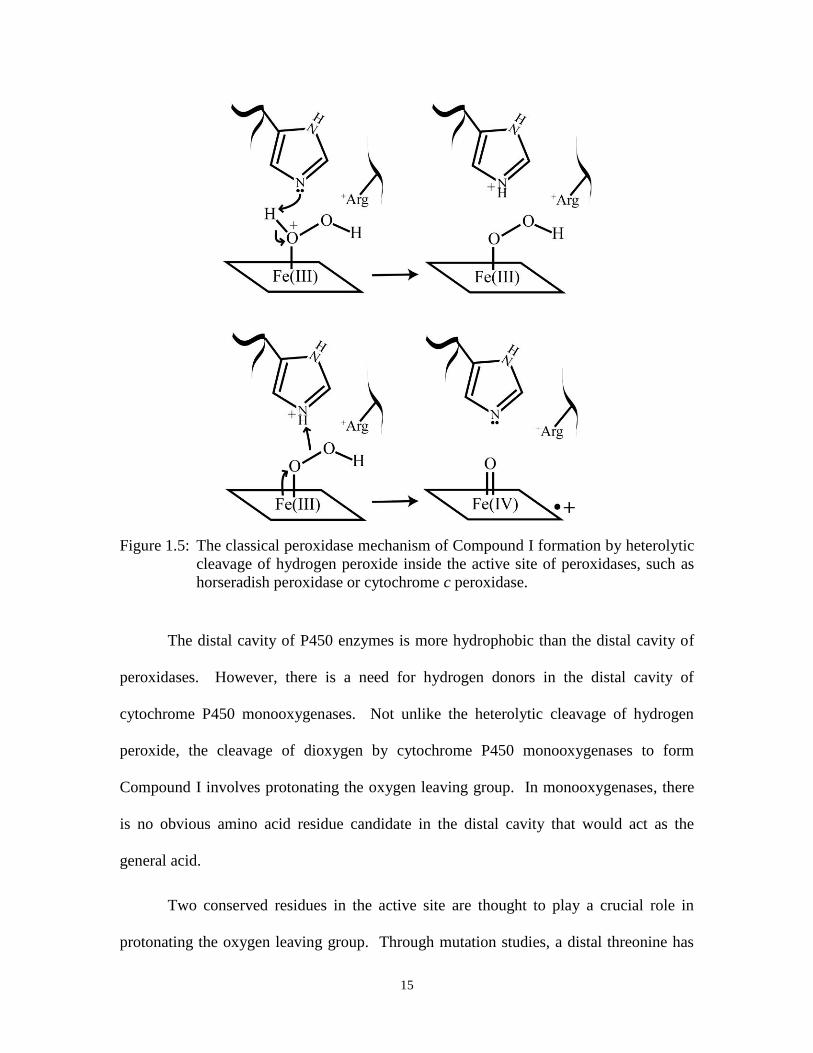
The importance of several distal residues is evident as they are necessary for the
heterolytic cleavage of hydrogen peroxide. As depicted in Figure 1.5, a histidine residue
in the distal cavity of the active site acts as a general acid-base catalyst that protonates the
terminal oxygen of the heme-peroxide species to promote heterolytic cleavage of the
peroxide bond [29]. This residue is highly conserved in classical peroxidases [38]. In the
case of chloroperoxidases, the histidine residue is replaced by a glutamate residue and
plays a similar role as an acid-base catalyst [39].
Another key player in the distal pocket is an arginine side chain that is situated
right above the plane of the heme cofactor. The arginine residue has been proposed to
help assist in the formation of Compound I by stabilizing the negative charge build-up on
the leaving oxygen group during heterolytic cleavage [40]. When the arginine residue
was mutated to a leucine residue, the catalytic rate for the heterolytic cleavage of
hydrogen peroxide was reduced by 55-fold. In contrast, P450 monooxygenases lack the
distal machinery of classical peroxidases; as a result, P450s are much less efficient in
catalyzing the heterolytic cleavage of hydrogen peroxide to form Compound I [41].
15
Figure 1.5: The classical peroxidase mechanism of Compound I formation by heterolytic
cleavage of hydrogen peroxide inside the active site of peroxidases, such as
horseradish peroxidase or cytochrome c peroxidase.
The distal cavity of P450 enzymes is more hydrophobic than the distal cavity of
peroxidases. However, there is a need for hydrogen donors in the distal cavity of
cytochrome P450 monooxygenases. Not unlike the heterolytic cleavage of hydrogen
peroxide, the cleavage of dioxygen by cytochrome P450 monooxygenases to form
Compound I involves protonating the oxygen leaving group. In monooxygenases, there
is no obvious amino acid residue candidate in the distal cavity that would act as the
general acid.
Two conserved residues in the active site are thought to play a crucial role in
protonating the oxygen leaving group. Through mutation studies, a distal threonine has
16
been suggested to either directly protonate the leaving group or indirectly protonate the
leaving group through a relay of ordered water molecules between a conserved threonine
and a glutamic acid residue [42]. Furthermore, Gerber and Sligar proposed that an
aspartic acid is important for leaving group protonation by shuttling a hydrogen in the
ordered water molecule network [43]. The mutation of the aspartic acid residue to an
asparagine residue decreases the rate of catalysis by an order of magnitude.
The data obtained from X-ray crystal structures shows only one hydrophilic
residue, a threonine, in the distal cavity of P450 camphor monoxygenases (P450cam) that
is within 5 Å of the heme molecule. However, to complicate matters some P450s have an
alanine in place of the threonine. Much of the problem stems from the static nature of the
structures obtained from X-ray crystal structures. The active site of P450
monooxygenases and peroxygenases is more flexible than classical peroxidases;
therefore, the binding of both oxidants and reductants causes slight changes in the
structure of P450 enzymes.
For instance, when P450cam crystals are soaked in adamantane, a poor substrate,
for an extended period of time, the helix that contains the threonine residue is shifted 1.1
Å away from the oxygen binding site. This movement is most likely a result of
accommodating a water molecule in the position of the threonine. The mutation of the
threonine residue to an alanine causes a similar distortion of the helix and a water
molecule takes the place of threonine [44]. However, this change eliminates the control
that the threonine residue imposed on the entry and positioning of the water molecule.
The threonine to alanine mutant causes a slower Compound I formation and the reduction
of the ferryl oxygen to form water and hydrogen peroxide.
17
Most of these observations are from studies of cytochrome P450cam, but crystal
structures of several other P450 enzymes show that few cytochromes P450 share exactly
the same residues in the distal active site [45]. P450s are very numerous in nature and
accept a wide range of substrates; therefore, the differences in distal site residues between
P450s are required to accommodate the different preferred substrates. Even though the
exact residues involved in Compound I formation may be different between P450s, it
remains necessary that the different P450s need to protonate the distal oxygen of the
dioxygen-heme complex to form a better leaving group.
1.2.2 Key structural differences between peroxidases and monoxygenases that lead
to 1- or 2-electron oxidation
Despite the differences in active site residues between peroxidases and
monooxygenases/peroxygenases, both sets of enzymes arrive at a common reactive
intermediate called Compound I. Despite the formation of a similar reactive species,
peroxidases and monooxygenases/peroxygenases perform two distinct oxidative
reactions. Monoxygenases and peroxygenases perform 2-electron oxidation reactions by
inserting an oxygen atom into a substrate, while classical peroxidases perform 1-electron
oxidation reactions by abstracting a single electron from the substrate to create a radical
species.
Despite the differences in the natural reactions that peroxidases and
monooxygenases perform on their natural substrates, there is functional overlap between
these two groups of enzymes. Peroxidases are capable of performing some 2-electron
oxidation reactions, while monooxygenases and peroxygenases are capable of performing
some 1-electron oxidation reactions [28, 29]. Even though these oxidative enzymes have
18
the capability to perform a spectrum of oxidation reactions, they are most efficient at
catalyzing their respective “natural” reactions and perform other oxidative reactions
much less efficiently [28, 29].
As previously stated, both the 1- and 2-electron oxidations of substrates require
the formation of the reactive Compound I species. One of the major differences between
these two sets of enzymes is the mechanism of Compound I formation: peroxidases and
peroxygenases use hydrogen peroxide as the oxidant, while monooxygenases use
molecular oxygen as the oxidant. However, once Compound I is formed, the oxidized
heme species does not distinguish between substrates for 1- or 2-electron oxidation
reactions. So why and how do peroxidases and monooxygenases perform two different
oxidation reactions? This is a very intriguing question and the answer was at first not
obvious to researchers.
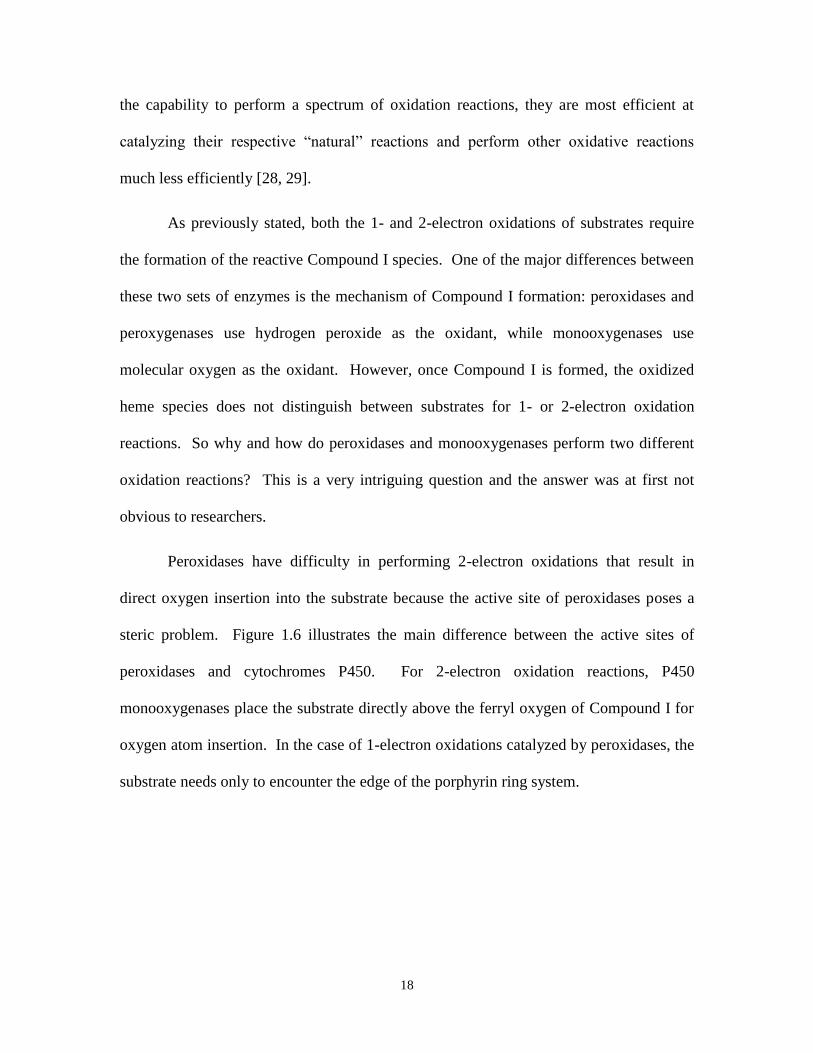
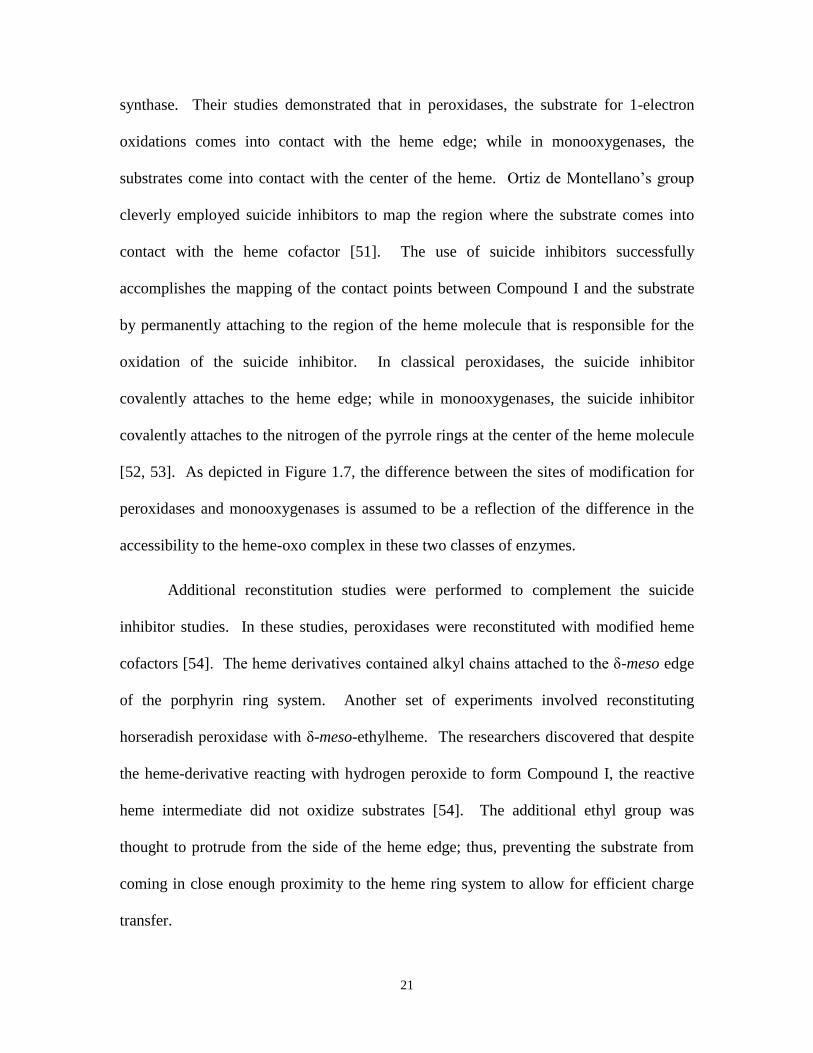
Peroxidases have difficulty in performing 2-electron oxidations that result in
direct oxygen insertion into the substrate because the active site of peroxidases poses a
steric problem. Figure 1.6 illustrates the main difference between the active sites of
peroxidases and cytochromes P450. For 2-electron oxidation reactions, P450
monooxygenases place the substrate directly above the ferryl oxygen of Compound I for
oxygen atom insertion. In the case of 1-electron oxidations catalyzed by peroxidases, the
substrate needs only to encounter the edge of the porphyrin ring system.
19
Figure 1.6: The different paths for substrate access to the heme cofactor in peroxidases
and in P450s. Adapted from Poulos’ review [45]
The requirement for the substrate to come in contact with Compound I in a certain
position is not obvious from the crystal structures of different peroxidases and
monooxygenases. The structures determined by X-ray crystallography of P450cam do not
show a clear channel between the exterior of the protein and the center of the heme
cofactor [46]. When the substrate-bound and substrate-free crystal structures were
compared to each other, there was almost no change in the overall structure of the
enzyme [46]. As a result, it was thought to be unlikely that allosteric effects of the
substrate binding controlled the channel for substrate entry.
As a result, researchers believe that the dynamic fluctuations of the active site
residues of P450s are responsible for creating a substrate access tunnel. Evidence to
support this claim stems from comparisons between the substrate-free and the substrate-
bound crystal structures of P450cam that showed higher thermal motion in the residues
that form the opening of the active site when the substrate is not bound [47]. A study
using a large inhibitor to force the substrate access route to open demonstrated that

20
several phenylalanine and tyrosine residues change conformations to accommodate the
long alkyl chain of the inhibitor [48].
The enzyme inhibitor structure does not provide direct evidence of a substrate
access channel or the thermal motion of key residues that may form the substrate access
channel. It has not been possible to obtain a crystal structure of cytochrome P450cam with
an open substrate access channel. Fortunately for the research community, the crystal
structure of cytochrome P450BM-3, a fatty acid hydroxylase from Bacillus megaterium,
does have a wide open substrate access channel [49]. As a result, P450BM-3 presents the
model monooxygenase for the substrate access channel between the solvent and the ferryl
oxygen at the center of the heme molecule.
In contrast, classical peroxidases are believed to possess very restricted active
sites that do not allow for direct substrate access to the ferryl oxygen. The heme cofactor
is located near the surface of the protein and thus the edge of the heme is exposed to the
solvent. These insights were induced from the crystal structures of peroxidases, such as
the crystal structure of prostaglandin H (PGH) synthase [50]. In PGH synthase, the heme
moiety is found near the surface of the protein and the edge of the heme is completely
exposed to the solvent. It is actually very easy to dissociate the heme group from the
enzyme during the purification process of PGH synthase [28, 29]. Even though the heme
edge is exposed to the solvent, there are residues above the ferryl oxygen that restrict the
direct access of reducing substrates.
Ortiz de Montellano‟s group has performed many chemical studies that provide
further interesting insights into the solvent exposure of the heme cofactor [51]. Their
results complement the crystal structures of peroxidases, such as the structure of PGH
21
synthase. Their studies demonstrated that in peroxidases, the substrate for 1-electron
oxidations comes into contact with the heme edge; while in monooxygenases, the
substrates come into contact with the center of the heme. Ortiz de Montellano‟s group
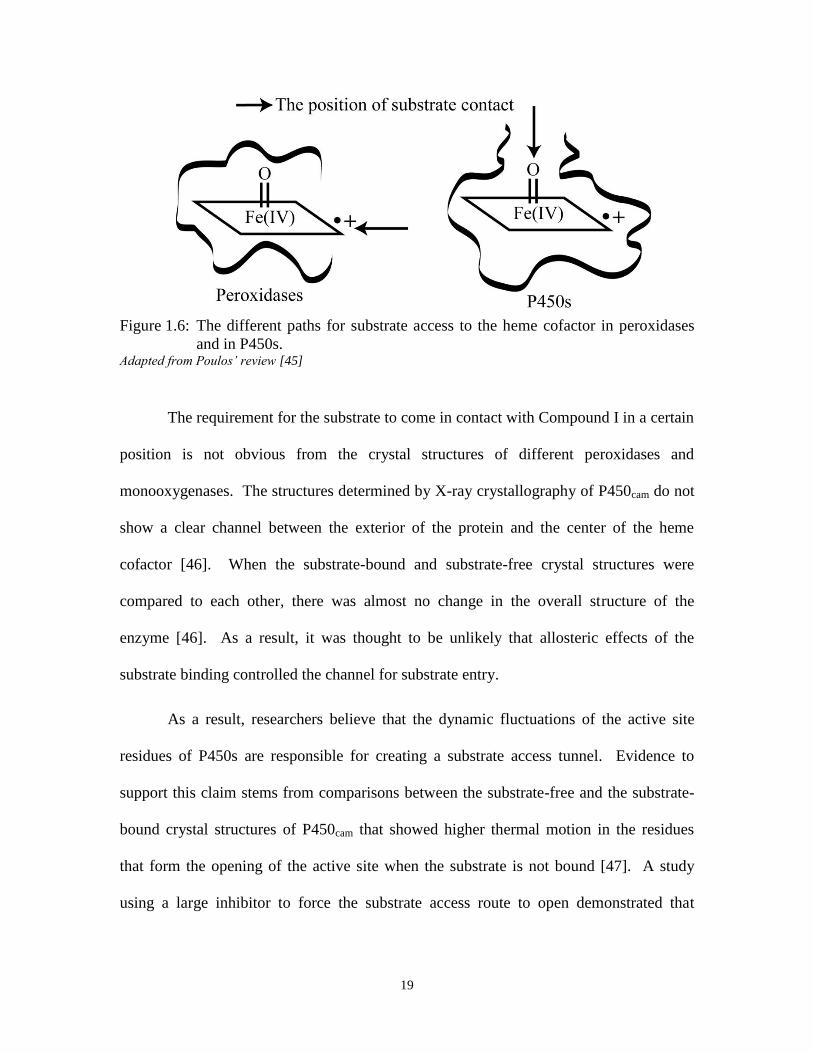
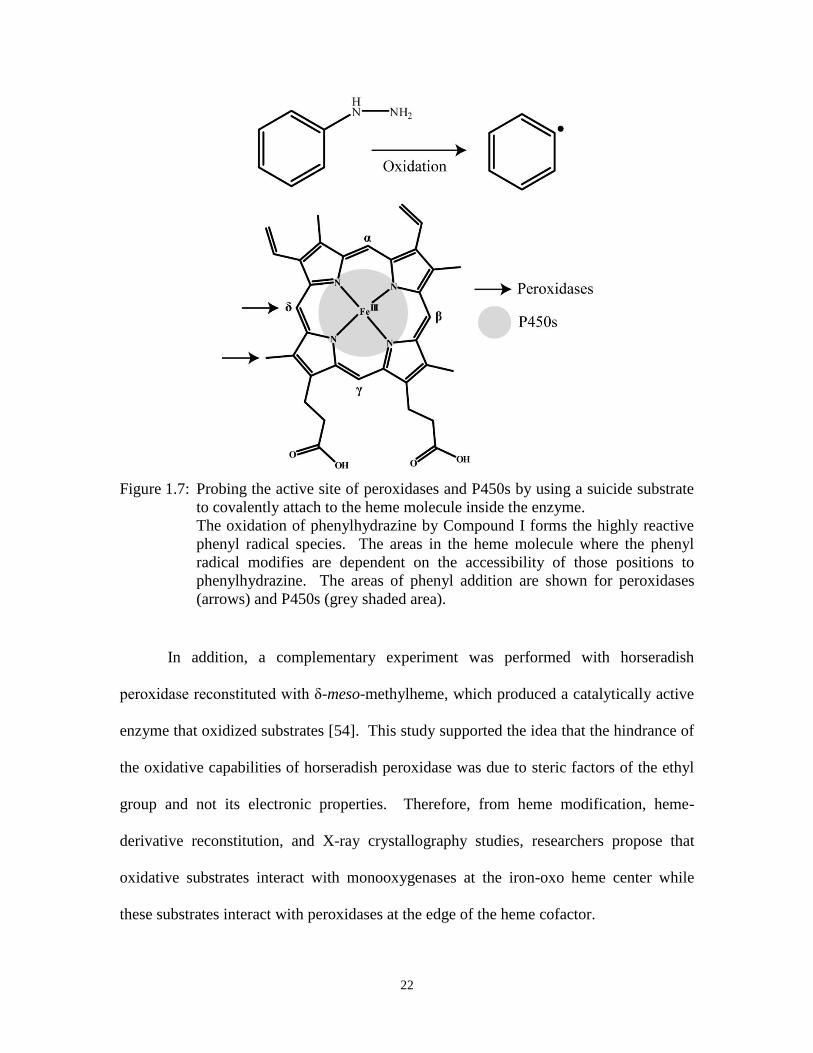
cleverly employed suicide inhibitors to map the region where the substrate comes into
contact with the heme cofactor [51]. The use of suicide inhibitors successfully
accomplishes the mapping of the contact points between Compound I and the substrate
by permanently attaching to the region of the heme molecule that is responsible for the
oxidation of the suicide inhibitor. In classical peroxidases, the suicide inhibitor
covalently attaches to the heme edge; while in monooxygenases, the suicide inhibitor
covalently attaches to the nitrogen of the pyrrole rings at the center of the heme molecule
[52, 53]. As depicted in Figure 1.7, the difference between the sites of modification for
peroxidases and monooxygenases is assumed to be a reflection of the difference in the
accessibility to the heme-oxo complex in these two classes of enzymes.
Additional reconstitution studies were performed to complement the suicide
inhibitor studies. In these studies, peroxidases were reconstituted with modified heme
cofactors [54]. The heme derivatives contained alkyl chains attached to the δ-meso edge
of the porphyrin ring system. Another set of experiments involved reconstituting
horseradish peroxidase with δ-meso-ethylheme. The researchers discovered that despite
the heme-derivative reacting with hydrogen peroxide to form Compound I, the reactive
heme intermediate did not oxidize substrates [54]. The additional ethyl group was
thought to protrude from the side of the heme edge; thus, preventing the substrate from
coming in close enough proximity to the heme ring system to allow for efficient charge
transfer.
22
Figure 1.7: Probing the active site of peroxidases and P450s by using a suicide substrate
to covalently attach to the heme molecule inside the enzyme.
The oxidation of phenylhydrazine by Compound I forms the highly reactive
phenyl radical species. The areas in the heme molecule where the phenyl
radical modifies are dependent on the accessibility of those positions to
phenylhydrazine. The areas of phenyl addition are shown for peroxidases
(arrows) and P450s (grey shaded area).
In addition, a complementary experiment was performed with horseradish
peroxidase reconstituted with δ-meso-methylheme, which produced a catalytically active
enzyme that oxidized substrates [54]. This study supported the idea that the hindrance of
the oxidative capabilities of horseradish peroxidase was due to steric factors of the ethyl
group and not its electronic properties. Therefore, from heme modification, heme-
derivative reconstitution, and X-ray crystallography studies, researchers propose that
oxidative substrates interact with monooxygenases at the iron-oxo heme center while
these substrates interact with peroxidases at the edge of the heme cofactor.
23
The difficulty for peroxidases to transfer the ferryl oxygen to the substrate has
been attributed to the restricted distal site above the oxygen atom of Compound I. Thus,
substrates can only come into contact with the heme edge in classical peroxidases; as
depicted in Figure 1.6. Mutational studies of peroxidases have demonstrated that the
removal of amino acid residues with bulky side chains can enable or enhance the 2-
electron oxidation capability of classical peroxidases. Miller et al. have demonstrated
that by mutating the tryptophan residue in the distal cavity of the active site to an alanine
residue, the mutant is capable of a larger array of 2-electron oxidation reactions [55].
The mutant cytochrome c peroxidase enzyme was shown to be even capable of catalyzing
the epoxidation of styrene. More importantly, Miller et al. demonstrated that the epoxide
oxygen atom was primarily derived from hydrogen peroxide, most likely via the
Compound I species [55]. Similar results for horseradish peroxidase were obtained when
the phenylalanine residue in the similar location as the tryptophan residue in cytochrome
c peroxidase was mutated to a leucine residue [56].
Aside from the ability to perform 2-electron oxidations, the mutant peroxidases
with enlarged distal cavities also catalyzed 1-electron oxidation reactions at a faster rate
[55, 56]. This was also assumed to be the result of a less restricted access route to the
heme cofactor. However, in the case of horseradish peroxidase, the mutation of the
phenylalanine residue to a leucine residue also decreased the substrate specificity of the
enzyme [56]. This example demonstrates the trade-off between the substrate specificity
of the enzyme and the raw processing power of the enzyme.
24
1.2.3 Catalytic antibodies that perform peroxidase reactions
Aside from natural peroxidases and their derivatives, an intriguing class of non-
natural protein enzymes can also perform peroxidase-like reactions. Catalytic antibodies
or abzymes are antibodies that have catalytic properties. These enzymes were not
naturally evolved to contain the same complex catalytic machinery as their natural
enzyme counterparts. Instead, abzymes are produced from eliciting the humoral immune
response to generate antibodies that specifically bind “transition state” analogue
molecules [57]. Peter Schultz and colleagues pioneered the use of transition state mimics
to generate numerous abzymes that catalyze a wide variety of chemistries [57]. One
particular abzyme was found to be both a ferrochelatase-mimic and a peroxidase-mimic
[58, 59].
Originally, the abzyme was specifically selected for its ability to bind a transition
state analogue for the metallation of porphyrins. The transition state analogue, N-methyl
mesoporphyrin, mimics the puckered geometry of the transition state of the porphryin
molecule during the metallation process [58]. This ferrochelatase-mimic catalyzed the
insertion of Zn(II) and Cu(II) into mesoporphyrin at comparable rates to the natural
ferrochelatase [58]. Also, this group determined that Fe(III) mesoporphyrin was a potent
inhibitor of the porphyrin metallation reaction [58].
The ability of this catalytic antibody to bind Fe(III) mesoporphyrin led to their
subsequent studies of the peroxidase activity of the abzyme-Fe(III) mesoporphyrin
complex [59]. This abzyme complex was capable of catalyzing several peroxidation
reactions, including the oxidation of ABTS (2,2‟-azinobis(3-ethylbenzothiozoline)-6-
sulfonic acid) [59]. The studies of the peroxidative capabilities of abzymes demonstrated

25
that a protein, not naturally evolved to have the same machinery as a peroxidase, could
catalyze peroxidase reactions and porphyrin metallation.
The work of Peter Schultz‟s group inspired our lab to pose similar questions about
DNA/RNA. Specifically, if DNA/RNA molecules could be selected to bind a transition
state analogue and if these DNA/RNA molecules could perform catalysis?
26
1.3 A guanine-rich aptamer with peroxidase activity when bound to
heme
For several decades we have known that both RNA and DNA are capable of
catalysis. Nature has provided several examples of enzymes composed primarily of RNA
(ribozymes), while all DNA based enzymes (DNAzymes) have been artificially evolved
in laboratories. The catalytic ability of both RNA and DNA is a topic of great interest
because RNA is considered a key molecule in a hypothetical model used to explain the
origin of life on Earth, known as the “RNA world” [60]. Walter Gilbert has described
RNA as an ideal scaffold for the development of life, due to its powerful features of
recombination and mutation [60].
Due to these theories, there has been a huge push to discover new ribozymes and
DNAzymes either synthetically or naturally [61]. DNA is sometimes used as a surrogate
for RNA because DNA is cheaper to synthesize and chemically more stable than RNA.
Since DNA is also chemically similar to RNA, it is assumed that any catalysis performed
by DNA is also possible for RNA. When comparing proteins to nucleic acids, it is
evident that nucleic acids do not possess the same wealth of functional groups as
proteins. Many see cofactors as a solution to this chemically complex problem; even in
present day organisms, many protein enzymes use cofactors to boost their already vast
chemical repertoire.
One such DNAzyme that performs catalysis when bound to a cofactor is PS2.M
[62]. PS2.M is an artificial DNAzyme that was rationally designed from a parent
sequence that was originally selected by using SELEX (Systematic Evolution of Ligands
by Exponential Enrichment) [63]. This in vitro selection technique, SELEX, allows us to
27
condense Darwinian selection into a manageable amount of time, as depicted in Figure
1.8. Selection pressure is placed on a large initial pool of varying sequences of nucleic
acids that form a variety of different shapes. It is assumed that there are molecules within
this large pool that can perform the desired task. The sequences that survive the selection
process are carried through to subsequent rounds and enriched. This iterative process is
repeated until several dominant species of nucleic acids have taken over the initial pool.
Using this approach the DNA molecules were selected for their ability to bind N-methyl
mesoporphyrin (NMM), NMM is a transition state analogue for porphyrin metallation
[63, 64]. Li et al. demonstrated that several sequences that they obtained from the in
vitro selection process were indeed aptamers, a nucleic acid molecule that can
specifically bind a ligand, for NMM [63]. Further studies by Li et al. demonstrated that
clones PS2 and PS5 were capable of metallating porphyrins [64].
The parent oligonucleotides, PS2 and PS5, were truncated down to the minimal
sequences that were needed for NMM binding as defined by foot printing and mapping
studies [63]. These truncated species were also capable of metallating porphyrins, in the
case of PS5.ST1, a truncated version of PS5, it enhanced the rate of porphyrin metallation
over the uncatalyzed rate by 1400-fold [64]. Further modification of the shortened
porphyrin metallating DNAzymes through rationale design produced two
oligonucleotides, PS2.M, 18-nucleotides long and PS5.M, 24-nucleotides long [65].
These shortened DNAzymes were both superior porphyrin metallating catalysts than their
parent sequences, PS5.M had a 37%-enhanced porphyrin metallating rate as compared to
PS5.ST1 [62].
28
Figure 1.8: General in vitro selection scheme for an aptamer that binds N-methyl
mesoporhyrin IX.
Even though PS5.M and PS2.M are SELEX-derived sequences that were
originally selected to metallate porphyrins, PS5.M and PS2.M also displayed the ability
to bind Fe(III) proporphyrin (heme) tightly with nanomolar affinity [62, 66]. Once bound
to heme, both PS5.M and PS2.M displayed peroxidase activity [62]. This suggested that
PS2.M and PS5.M may play a similar role to the apoenzyme of protein peroxidases to
enhance the peroxidative ability of heme [62, 66]. PS2.M exhibited greater peroxidase
activity than PS5.M; therefore, subsequent peroxidase-optimization and mechanistic
studies were performed on PS2.M [62, 66-68]. The researchers rigorously optimized the
29
peroxidase activity of PS2.M-heme by modifying several conditions, such as potassium
concentration, sodium concentration, pH, buffering agent, and detergent concentration
[62, 66, 67].
At optimized conditions for peroxidase activity of PS2.M-hemin complex,
Travascio et al. monitored the peroxidation of 2,2'-azino-bis(3-ethylbenzthiazoline-6-
sulphonic acid) (ABTS) to ABTS•+
radical by PS2.M-hemin [66]. The oxidation of
ABTS by H2O2 is readily monitored by UV-Vis spectroscopy, as the ABTS•+
radical
cation exhibits an absorption maximum at 414 nm. In these studies ABTS was used in
excess relative to the enzyme (10,000 times) and its oxidation is very fast; therefore, it
was possible to measure the formation of Compound I by the reduction of H2O2 from the
production of the ABTS•+
radical cation [66]. From such studies, the KM value of H2O2-
PS2.M binding was found to be 3 mM and the second-order rate constant was measured
to be ~1 X 10⁴ M
-1•s
-1[66]. More surprisingly, Klibanov and collegues have reported that
PS2.M-heme is capable of oxidizing certain substrates more efficiently than even protein
peroxidases [69].
Structural investigation of PS2.M with DMS protection assays and cation assays
have shown that this molecule forms a G-quadruplex [64, 70]. From the sequence of
PS2.M, an 18-nucleotide long DNA with the following sequence, 5‟-GTG GGT AGG
GCG GGT TGG, one can notice that there are multiple tracts of guanines, which suggest
the formation of G-quadruplexes. As a result of the highly stable nature of G-
quadruplexes, these motifs form the core of the PS2.M structure. Furthermore, since both
RNA and DNA can form G-quadruplexes, the ribonucleotide counterpart (rPS2.M) of
PS2.M has similar heme binding properties as PS2.M despite the different structural
30
properties between DNA and RNA [66]. This particular G-quadruplex formed by PS2.M
plays a large role in its heme binding ability and subsequent peroxidase activity.
Two methods of enhancing the peroxidase activity of heme have been proposed
for PS2.M [66, 67]. The first method involves PS2.M or rPS2.M protecting the bound
heme molecule from oxidative damage by the reactive Compound I species [66]. The
second method is linked to the alkaline transition of the water molecule coordinated to
heme iron at the sixth position [67]. Paola et al. demonstrated that when PS2.M is bound
to heme, it favors the water molecule over the formation of a hydroxide molecule [67].
The water molecule, as compared to the hydroxide molecule, at the sixth position
exchanges more readily with hydrogen peroxide to form Compound I [67].
After the initial discovery that PS2.M-heme was effectively a peroxidase, many
groups have developed novel uses for PS2.M. These applications were primarily for
detection purposes, such as, the detection of lead concentration, single nucleotide
polymorphisms, telomerase activity and cancer markers [71-76]. Studies from Willner‟s
laboratory primarily used a modified version of PS2.M, called CatG4 [71-75].
In recent years, multiple groups have demonstrated that many G-quadruplexes
when bound to heme have peroxidase activity comparable to PS2.M-heme [77-80]. As a
result, we would like to understand how PS2.M and other G-quadruplexes bind heme and
how these nucleoheme complexes catalyze peroxidase reactions. Also, the research
conducted by Klibanov and colleagues demonstrated that PS2.M-heme is very
promiscuous and is capable of accepting a variety of substrates for 1-electron oxidation
reactions. In this work, we investigated if this promiscuity of PS2.M-heme would allow
it to catalyze 2-electron oxidation reactions of various electron rich substrates.
31
2: Folding studies of the active PS2.M species
2.1 Introduction
After discovering the versatility of PS2.M as a catalyst, it has become a more
attractive enzyme for structural studies. As a result, several groups have probed the
structure of PS2.M, and have produced contrasting results [68, 70, 79, 81, 82]. The most
conflicting results stem from research from our group and a report by Majhi et al. [70,
81]. Previous research from our group had predicted a model for PS2.M as an anti-
parallel intramolecular G-quadruplex [70]. In contrast, Majhi et al. have reported that
PS2.M forms a parallel intermolecular G-quadruplex [81]. We attribute these
dramatically different results to the different methodologies and conditions applied to the
samples. In this work, we aim to determine the active G-quadruplex sturcture that binds
heme and subsequently performs peroxidase activity from a potential mixture of different
G-quadruplexes species.
32
2.2 Materials and methods
2.2.1 Materials
All DNA was purchased from Integrated DNA Technologies, Inc. The sequences
of all DNAs and RNAs are given in Table 3.1. All nucleic acids were purified by
preparative gel electrophoresis, eluted, ethanol precipitated, and then stored dissolved in
TE buffer [10 mM Tris, pH 7.5, and 0.1 mM ethylenediaminetetraacetate (EDTA)] as
decribed in section 2.2.2. All chemicals were purchased from Sigma-Aldrich, unless
specified otherwise. Hemin was purchased from Porphyrin Products (Logan, Utah).
Table 2.1: DNA sequences.
Name Sequence
SS18 5‟-AAT ACG ACT CAC TAT ACT-3‟
PS2.M 5‟-GTG GGT AGG GCG GGT TGG-3‟
CatG4 5‟-TGG GTA GGG CGG GTT GGG AAA-3‟
PS2.M_mut 5‟-TGG GTA GGG CGG GTT GGG-3‟
2.2.2 Purifying nucleic acids using polyacrylamide gel
We dissolved DNA and RNA pellets with tris(hydroxymethyl)aminomethane-
ethylenediaminetetraacetic acid (Tris-EDTA or TE) buffer (10 mM Tris, pH 7.5; 0.1 mM
EDTA) to make 1 mM stock solutions. We mixed 20 µL of 1 mM nucleic acids stock
with 20 µL denaturing gel buffer solution with dye (99% formamide , 1 mM Tris-Cl, pH
7.5, 1 mM EDTA, 0.05% bromophenol blue, and 0.05% xylene cyanol). We heated the
samples at 95ºC for 3 minutes and placed them on ice. We loaded the samples on a 10%
denaturing polyacrylamide gel (45 mM Tris-borate; 1 mM EDTA, ~8 M urea) that was
20-25 cm in length. We placed a metal plate on the gel plate to evenly distribute the heat
generated from electrophoresis. We ran the samples at 25-30 W or enough power so that
33
the gel reached 50ºC-55ºC on a Pharmacia ECPS 3000-150 electrophoresis power supply.
We stopped the electrophoresis process when the bromophenol blue band migrated 10-15
cm from the bottom of the well at the top of the gel.
We visualized the nucleic acid band of interest using the UV shadowing
technique. Briefly, we placed the gel on a plastic wrap over a UV-fluorescent thin-layer
chromatography plate. We then exposed the gel to 254 nm UV light (UVGL-58
Mineralight® LAMP) to locate the nucleic acid band, which we marked and excised from
the gel.
Subsequently, we crushed the gel piece and soaked it in 10 mL of TE buffer, and
left it overnight at 4ºC to allow for the DNA/RNA to diffuse from the gel pieces. We
filtered the gel pieces from the solution using a 0.2 µm filter (Acrodisc® Syringe Filters,
PALL Corp.) attached to a 10 mL syringe (Luer-LokTM
).
Then we concentrated the DNA/RNA by using the 2-butanol extraction
procedure. Briefly, we added an equal volume of 2-butanol to the nucleic acid solution
and then vigorously shook and vortexed the contents. We removed the organic layer
(top) and performed several cycles of extraction to reduce the solution volume to ~1 mL.
We separated the concentrated nucleic acid solution into three 300 µL aliquots before
ethanol precipitation.
We further purified the 300 µL nucleic acid solution by ethanol precipitation. We
added 30 µL of 3 M sodium acetate (NaOAc) and 2.5 volumes of cold ethanol to the
nucleic acid solution and vortexed the mixture. Subsequently, we centrifuged the
solution at 16,000 g for 30-60 minutes in an Eppendorf 5415D at a temperature of 4ºC.
We removed the aqueous supernatant carefully, as not disturb the nucleic acid pellet.
34
Afterwards, we washed the pellet with 500 µL of cold 70% ethanol. Then we
redissolved the pellet in TE buffer and we combined the contents from all of the aliquots
to make up a 100 µL nucleic acid stock solution. We stored all nucleic acid stock
solutions at -20ºC, unless otherwise specified.
2.2.3 Radiolabelling DNA by phosphorylation with γ-32
P-ATP
We purified oligonucleotides as previously described in section 2.2.2. We
prepared 10 µM oligonucleotide solutions by diluting aliquots of stock oligonucleotide
solutions with TE buffer. We combined 5 µL of 10 µM DNA solution with 2 µL T4
Kinase buffer from New England Biolabs Inc. (10X) and 10 µL of ddH2O. After the γ-
32P-ATP stock was thawed, we added 2 µL of T4 Polynucleotide Kinase from New
England Biolabs Inc. (10,000 units/mL) and 1 µL of γ-32
P-ATP from PerkinElmer (33
µL; 185 Mbq; 6000 Ci/mmol) to the mixture. The mixture was vortexed and incubated at
37ºC for 30-60 minutes. In order to stop the reaction we added 1 µL of 0.5 M EDTA to
the reaction mixture and vortexed the contents.
We isolated the radiolabelled pellet by ethanol precipitation; briefly, we added 2
µL of 3 M NaOAc and 60 µL of cold ethanol to the arrested kinase reaction mixture. We
placed the ethanol mixture in an ice bath for 10 minutes before we incubated it in dry ice
until the aqueous solution was gel-like in viscosity. Then we centrifuged the ethanol
mixture in 4ºC at 16,000 g for 45-60 minutes.
We carefully placed the centrifuged samples on ice to keep the pellet from
dissolving into the ethanol/water mixture. We carefully removed the ethanol-aqueous
layer and washed the radiolabelled pellet with 100 µL of 90% cold ethanol. After the

35
DNA pellet was dried, we dissolved it in 10 µL of denaturing gel buffer solution with dye
and loaded it on a 10% denaturing gel.
We performed gel purification as previously described to separate the
radiolabelled oligonucleotide from unincorporated γ-32
P-ATP. We used X-ray film (Blue
XB X-OMAT, Kodak Film) to visualize the band of the radiolabelled DNA. Briefly, we
wrapped the gel in Saran wrap and placed a piece of X-ray film on top of the area of the
gel that contained the radiolabelled DNA band. We exposed the X-ray film to the
radiolabelled DNA band for less than 10 seconds, meanwhile we placed marks at the
interface between the X-ray film and the gel.
We developed The X-ray film with a Kodak X-OMAT 1000A Processor. We
then lined-up the exposed film markings with the corresponding markings on the gel. We
marked the radiolabelled DNA band and excised it from the gel. We crushed the gel
piece and soaked it in 500 µL of TE buffer, unless otherwise specified, for over 16 hours
at 4ºC.
We centrifuged the gel pieces at 16,000 g for 3 minutes and removed 400 µL of
the supernatant. We lyophilized the solution by using a Labconco Centrivap console,
which left a DNA and buffer salt pellet which we redissolved in 20 µL of ddH2O.
Then we ethanol precipitated the radiolabelled DNA by adding 2 µL of 3 M
NaOAc and ~2.5 volumes (60 µL) of cold ethanol. We treated the ethanol mixtures as
described previously; briefly, and we then cooled and centrifuged the samples. We
discarded the supernatant and washed the radiolabelled DNA pellet with 90% cold
ethanol. Subsequently, we dissolved the DNA salt pellet in 20 µL of TE buffer and
stored it at -20ºC.

36
2.2.4 Native gels of G-quadruplexes under varying conditions
2.2.4.1 Native gels that were composed of different salt conditions and ran in different
temperature conditions
We prepared the samples under optimal folding potassium conditions prior to
analysis on native gels with varying salt and temperature conditions. We prepared a 2X
DNA solution and 2X folding buffer. We dissolved quantities of 0.04, 0.4 and 2 nmol of
DNA with an adequate amount of radiolabelled DNA tracer in 18 µL of TE buffer to
form the desired 2X DNA solutions (0.2, 20, and 100 µM DNA). We heated the samples
at 95ºC for 3 minutes and placed them in an ice bath for 5 minutes.
We added 20 µL of 2X folding buffer (80 mM TrisOAc, pH 7.5; 50 mM KCl;
0.1% [w/v] Triton X-100) to the 2X DNA solution and incubated at room temperature
(~21ºC) for 30 minutes. Afterwards, we split the sample into two 19 µL aliquots and 1
µL of either hemin (hemin was dissolved in dimethylsulfoxide (DMSO)) or DMSO was
added to the sample to compare the structure of the DNA in the presence or absence of
hemin. We added a hemin concentration to the mixture to give a 1:1 final molar ratio
between DNA and hemin.
The final 20 µL samples contained 0.1-50 µM DNA, 0.1-50 µM hemin, 40 mM
TrisOAc (pH 7.5), 25 mM KCl, 0.05% Triton X-100, 5% DMSO, ~0.5X TE buffer.
After adding hemin or DMSO we incubated the mixture at 21ºC for 30 minutes. We
added 20 µL of loading buffer for the non-denaturing gels with dye (0.05% bromophenol
blue, 0.05% xylene cyanol, 15% Ficoll) to each mixture and vortexed the samples.
We prepared two gels for each salt concentration and DNA concentration
condition; we placed one gel was placed in 4ºC and another in 21ºC. Briefly, we

37
prepared 60 mL of 20% polyacrylamide gel solution with 40 mM Tris-acetate (TrisOAc),
0, 5 or 25 mM KCl, and 5 mM EDTA. We polymerized the gel by the addition of 0.1
volume of 10% ammonium persulfate and 0.0004 volume of tetramethylethylenediamine
(TEMED).
We separated each DMSO and hemin containing sample into two 15 µL aliquots
and loaded into gels placed in both 4ºC and 21ºC; we also saved a 10 µL aliquot for
future testing. We also loaded a 10 base pair ladder in each gel for size references (10 bp
DNA ladder from Invitrogen). We ran the 25 mM KCl 4ºC gel at 3 W and the 21ºC gel
at 1 W for 24 hours. While we ran the 5 mM KCl gels at the same wattage for both
temperature conditions for 8 hours. The bromophenol blue marker for the above
mentioned gels migrated 15 cm from the bottom of the well at the top of the gel.
Once adequate time had passed to allow for the migration of the bromophenol
blue marker, we covered the gel with Saran wrap. We then exposed the gels to
phosphorous screens (Amersham Biosciences) for various times (1-48 hours) to gain
multiple exposures of the gels. The exposures were performed in 4ºC to limit the
diffusion of the DNA bands in the gels. We scanned the phosphorous screens on a
Molecular Dynamics Typhoon 9410 Variable Mode Imager to visualize the radiolabelled
bands on the gel. We analyzed the gel images using either ImageQuant 5.2 or ImageJ.
2.2.4.2 Native gels of varying DNA concentrations in different temperature conditions
We treated all samples and gels with the same methods as the section above.
Briefly, we combined a 2X DNA solution with a 2X buffer solution (80 mM TrisOAc
(pH 7.5), 50 mM KCl, 0.1% Triton X-100, and 2% DMSO) and incubated over 30
minutes in 21ºC. The final volume of the solution was 20 µL with 40 mM TrisOAc (pH
38
7.5), 25 mM KCl, 0.05% Triton X-100, 1% DMSO, and ~0.5X TE buffer. The final
concentrations of DNA covered a wide range: 0.1, 0.5, 2.5, 10 and 50 µM.
We added 20 µL of gel loading buffer for native gels to each sample, and
subsequently the samples were split into two aliquots. We prepared two native gels, as
previously described in section 2.2.4.1, with contents of 20% polyacrylamide, 40 mM
TrisOAc, 25 mM KCl, and 5 mM EDTA. We placed one gel in 4ºC and the other in
21ºC.
For each DNA sequence, we loaded 20 µL of each sample containing a range of
concentrations into both the gel in 4ºC and the gel in 21ºC. The 4ºC gel was run at 3 W
and the 21ºC gel was run at 1 W for 24 hours; the bromophenol blue marker migrated 15
cm from the bottom of the well at the top of the gel. After sufficient time had passed to
allow for the migration of the bromophenol blue marker, we covered the gel with Saran
wrap. Then we exposed the gels to phosphorous screens for various times (1-48 hours) to
gain multiple exposures of the gels. We performed the exposures at 4ºC to limit the
diffusion of the DNA bands in the gels. We scanned the phosphorous screens on a
Typhoon 9410 Imager to visualize the radiolabelled bands on the gel.
We quantified the different species, reflected by the different bands in a sample
lane, using either ImageQuant 5.2 or ImageJ. Briefly, we drew a rectangle enclosing
each band to designate an area on the gel to calculate the number of dark pixels in the
band. We then compared the density of dark pixels within each designated band to the
total number of dark pixels in each lane. We used this form of calculation to normalize
the amount of radiolabelled DNA loaded in each well. We then plotted the percentage of
39
each band compared to the quantity of all DNA species over a range of DNA
concentrations.
2.2.5 Verification of degradation of oligonucleotides
We aliquoted 10 µL from the samples mentioned in section 2.2.4.1 for further
analysis. One such analysis was to check if the oligonucleotides had degraded over time.
WE prepared a 60 mL denaturing gel solution with 20% polyacrylamide, 40 mM
TrisOAc (pH 7.5), 5 mM EDTA and 50% [w/v] urea.
In addition, we added 10 µL of denaturing gel buffer solution with dye to the
samples. Prior to loading the samples into the gel, we heated the samples at 95ºC for 3
minutes and placed them directly in an ice bath for 5 minutes. We ran the denaturing gel
at >25 W, until the glass plate in contact with the gel reached 50-55ºC; we placed a metal
plate behind the glass plates to allow for uniform heat distribution in the gel. The
electrophoresis process took ~2 hours or the time it took the bromophenol blue marker to
migrate 15 cm from the bottom of the well at the top of the gel.
After we waited a sufficient time to allow for the migration of the bromophenol
blue marker, we covered the gel with Saran wrap. Then we exposed the gels to phosphor
image screens for various times (1-48 hours) to gain multiple exposures of a gel. We
performed the exposures in -20ºC to limit the diffusion of the DNA bands in the gels.
We scanned The phosphor image screens on a Typhoon 9410 Imager to visualize the
radiolabelled bands on the gel. We analyzed the gel images using either ImageQuant 5.2
or ImageJ.
40
2.2.6 Circular dichroism spectroscopy of PS2.M under varying conditions
2.2.6.1 Changing the concentration of DNA in fixed buffer solutions
We prepared a 2X DNA solution and various 2X folding buffers. We dissolved
quantities of 0.2, 0.5, and 5 nmol of DNA in TE buffer to form the desired 2X DNA
solutions (0.2, 10, and 100 µM DNA). For a final concentration of 50 µM and 10 µM of
DNA, we prepared 2X DNA solutions of 100 µM and 10 µM of DNA, respectively by
dissolving the above amount of DNA in 49 µL of TE buffer. We prepared the 2X DNA
solution of 0.2 µM DNA by dissolving the above amount of DNA in 980 µL of TE
buffer.
Note the volumes were different between the 0.2 µM sample from the other two
larger DNA concentration samples (100 µM and 10 µM). In order to get sufficient
absorption from all DNA samples, the cuvette pathlength needs to be longer for the
sample with low DNA concentration than the two larger DNA concentration samples.
Therefore, we placed the low DNA concentration sample in a larger quartz cuvette that
required a minimum of 2000 µL.
We heated the DNA samples at ~100ºC with boiling water for 3 minutes and then
cooled them in an ice bath for 5 minutes. We added 50 µL of 2X folding buffer (80 mM
TrisOAc, pH 7.5; 50 mM KCl; 0.1% Triton X-100) for the two higher 2X DNA
concentration samples (100 µM and 10 µM) and 1000 µL of the 2X folding buffer to the
low 2X DNA concentration sample (0.1 µM). We incubated all DNA solutions
combined with folding buffer solution at room temperature (~21ºC) for 30 minutes.
Afterwards, we added 1 µL or 20 µL of either hemin (hemin was dissolved in
DMSO) or DMSO to the samples to compare the structures of the DNA in the presence
41
or absence of hemin. We added 1 µL of 50 mM or 5 mM hemin to the two larger DNA
concentration samples to make up the solution to 100 µL. We prepared the hemin stock
solutions by dissolving a specific amount of hemin in DMSO. We added 20 µL of 100
µM hemin to the smaller DNA concentration sample to make up the solution to 2000 µL.
The hemin concentration that we added to the mixture resulted in a 1:10 final ratio
DNA:hemin concentration. The 50 µM DNA samples had a final ratio of DNA to hemin
of 1:3.
The 100 µL (50 and 5 µM DNA) and 2000 µL (0.1 µM) samples contained 0.1-50
µM DNA, 1-150 µM hemin, 40 mM TrisOAc (pH 7.5), 25 mM KCl, 0.05% Triton X-
100, 5% DMSO, ~0.5X TE buffer. After adding hemin or DMSO, we incubated the
mixture at 21ºC for 30 minutes.
Subsequently, we analyzed samples in a Jasco J-810 CD spectropolarimeter. We
placed the 50 and 5 µM DNA samples in 0.05 cm path length cuvettes while the 0.1 µM
sample was placed in a 1 cm path length cuvette. We programmed the scan settings for
all samples to scan between 230 nm – 320 nm at a rate of 500 nm/min. We accumulated
the spectrum for each sample from the average of 10 scans.
We analyzed the data for all samples using Spectra Manager from Jasco. We
corrected all DNA samples for the absorbance of the buffer. We subtracted the spectra of
the DNA samples that we incubated with hemin from the spectra of a hemin only
reference sample. We subtracted the spectra of the DNA only samples from the spectra
of a DMSO reference sample. The hemin only and DMSO only reference samples
contained 0-150 µM hemin, 40 mM TrisOAc (pH 7.5), 25 mM KCl, 0.05% Triton X-100,
5% DMSO, ~0.5X TE buffer.

42
2.2.6.2 Observing the changes in PS2.M folding in various salt conditions
We prepared a 2X DNA solution and various 2X folding buffers as previously
described in section 2.2.6.1. Briefly, we dissolved 1 nmol of DNA in 50 µL of TE buffer
to form the desired 2X DNA solutions. We heated the samples at ~100ºC with boiling
water for 3 minutes and then cooled them in an ice bath for 5 minutes. We added 50 µL
of 2X folding buffers with different salts and varying salt concentrations (80 mM
TrisOAc, pH 7.5; 0-100 mM KCl or 0-800 mM NaCl; 0.1% Triton X-100; 2% DMSO) to
the 2X DNA solutions and incubated them in room temperature (~21ºC) for 30 minutes.
The final 100 µL samples contained 10 µM DNA, 40 mM TrisOAc (pH 7.5), 0-50 mM
KCl or 0-400 mM NaCl, 0.05% Triton X-100, 1% DMSO, 0.5X TE buffer.
Subsequently, we analyzed the samples with a Jasco J-810 CD
spectropolarimeter. We placed the samples in 0.05 cm pathlength cuvettes. We
programmed the scan settings for all samples to scan between 230 nm – 320 nm at a rate
of 500 nm/min. We accumulated the spectrum for each sample from the average of 10
scans. We subtracted the spectra of the DNA samples from the spectra of reference
samples that contained no DNA and only 40 mM TrisOAc (pH 7.5), 0-50 mM KCl or 0-
400 mM NaCl, 0.05% Triton X-100, 1% DMSO, 0.5X TE buffer. The values obtained
were given as deg, these values were converted to molar ellipticity. We converted deg to
molar ellipticity by multiplying the deg value by the pathlength of the cuvette (in cm) and
dividing by the concentration of DNA in the sample (in dmol•cm-3
).
2.2.7 Dimethyl sulfate protection assay of G-quadruplex forming oligonucleotides
We prepared Samples as detailed in section 2.2.4.1. Briefly, we prepared samples
with 0.1 µM and 50 µM of DNA in a buffer of 40 mM TrisOAc (pH 7.5), 25 mM KCl,
43
0.05% Triton X-100, 5% DMSO, ~0.5X TE buffer. The samples either contained no
hemin or 1:1 molar ratio hemin and DNA. As described previously, we split the samples
into 2 aliquots and placed one in 4ºC and another in 21ºC.
After we incubated the samples for an adequate amount of time, roughly for 30
minutes, were treated them with dimethyl sulphate (DMS). The DMS reaction scheme is
depicted in Figure 2.7. We added 2 μL of 2% DMS (dissolved in distilled-deionized
water) and 3 μL of 200 mM Li cacodylate (final Li cacodylate concentration was 25 mM)
to each 20 µL sample. For the non-DMS treated samples, we added 2 μL of water instead
of DMS. We incubated the samples for 30 mins at 21°C and 40 mins at 4°C. We added
2 μL of 25% [v/v] 2-mercaptoethanol to the DMS treated samples to stop the reaction.
We loaded the samples in gels and ran them at the same temperatures as they were
incubated in.
We prepared and ran the gels with the same method described in section 2.2.4.
After we ran the gels for an adequate amount of time, we excised the species of interest
from the gel. We employed the dip-and-dot method to visualize and mark the
radiolabelled DNA band. Briefly, we wrapped the gel in Saran wrap. We marked dots
on the gel and placed a trace amount of γ-32
P-ATP at every mark by puncturing the dots
with a needle dipped in γ-32
P-ATP.
After we marked the gels with the dip-and-dot procedure, we wrapped the gel in
another layer of Saran wrap before exposing it to phosphorous screens for 1-2 hours at
4ºC. We scanned the phosphorous screens on a Typhoon 9410 Imager to visualize both
the radiolabelled bands and premade marks on the gel. We analyzed the gel images with
either ImageQuant 5.2 or ImageJ. We used an image of the gel from the exposure to
44
mark the desired bands/species on the gel. Were excised the desired products from the
gel and crushed the gel pieces and soaked them in 430 µL of TE buffer. We suspended
the crushed gel pieces in TE buffer for 16-24 hours at 4ºC.
We centrifuged the gel pieces at 16,000 g for 3 minutes and removed 400 µL of
the supernatant. We lyophilized the solution, leaving a DNA and buffer salt pellet which
we redissolved in 20 µL of ddH2O. Then we ethanol precipitated the DNA product by
adding 2 µL of 3 M NaOAc and ~2.5 volumes (60 µL) of cold ethanol. We treated the
ethanol mixtures as described in previous sections; briefly, we cooled and centrifuged the
samples. We discarded the supernatant and washed the radiolabelled DNA pellet with
90% cold ethanol.
WE redissolved The pellet in 100 µL of 10% [v/v] piperidine and heated it at
90ºC for 30 minutes. After the piperidine treatment, we removed the piperidine by
lyophilisation. In order to remove any residual piperidine after the first lyophilization,
we redissolved the sample in 50 µL of ddH2O and lyophilized again; we repeated this
process once more.
We ran the samples, G-ladders, and 10 base pair ladders on a 15% denaturing gel
(0.5X TBE and 50% [w/v] urea). We prepared the G-ladders a day prior to running the
gel. Briefly, we prepared 20 μL of 2 μM DNA with trace amounts of radiolabelled DNA
and heated this at 95ºC for 3 minutes and placed it in an ice bath for 5 minutes. We
treated the G-ladder for each individual DNA sequence with DMS as described above. In
order to stop the DMS reaction, we added 4 μL of stop solution (1.5 mM NaOAc and 7%
[v/v] 2-mercaptoethanol) to each sample.

45
We ethanol precipitated the G-ladder samples by adding 60 μL of ethanol and
treated them as previously described. Briefly, after we cooled the samples to a gel-like
consistency we centrifuged them and removed the supernatant. We washed the DNA
pellet with 90% ethanol before treating the pellets with piperidine.
We redissolved the pellets in 100 µL of 10% [v/v] piperidine and heated at 90ºC
for 30 minutes. After the piperidine treatment, we removed the piperidine by
lyophilisation. In order to remove any residual piperidine after the intial lyophilisation
step, we redissolved the sample in 50 µL of ddH2O and lyophilized again; we repeated
this process once more.
Subsequently, we dissolved the dried pellets in denaturing gel buffer with dyes.
We ran the samples on a 15% denaturing gel at 40-60 W or at a power that sufficiently
heated the gel to 55ºC until the bromophenol blue marker had migrated 15 cm from the
bottom of the well. Then we covered the gel with Saran wrap and exposed it to a
phosphorous screen for various times (2-4 days) to gain multiple exposures of the gels.
We performed the exposures at -20ºC to limit the diffusion of the DNA bands in the gels.
We scanned the phosphorous screens on a Typhoon 9410 Imager and analyzed the
images using either ImageQuant 5.2 or ImageJ software.
2.2.8 Kinetics of 2,2'-azino-bis(3-ethylbenzthiazoline-6-sulphonic acid) (ABTS)
oxidation at 4ºC and 21ºC
The final volume of all samples was 1 mL. Initially, we dissolved 2 nmol DNA in
760 µL of TE buffer to make a 2X DNA solution. We heated the 2X DNA solution in
boiling water at 100ºC for 3 minutes before cooling in an ice bath for 5 minutes.
46
We separated the 2X DNA solution into two 380 µL aliquots and added 500 µL
of 2X ABTS oxidation buffer to each aliquot. We incubated one aliquot at 4ºC and the
other at 21ºC for 30 minutes. The 2X ABTS oxidation buffer contained 100 mM 4-(2-
hydroxyethyl)-1-piperazineethanesulfonic acid pH adjusted with ammonium hydroxide
(HEPES-NH4OH), pH 8.0, 40 mM KCl, 0.1% Triton X-100, and 2% DMSO.
Then we added 10 µL of 10 µM hemin to all aliquots and incubated for an
additional 30 minutes in their respective temperatures (4ºC or 21ºC) for a final hemin
concentration of 0.1 µM. Note, when we added the 10 µM hemin to the sample in the
cold room (4ºC), the we placed hemin in a warm water bath to prevent the DMSO from
freezing. We added 100 µL of 50 mM ABTS to all samples before initiating the reaction
with H2O2. We allowed all samples to mix for 5 minutes after the addition of ABTS and
then transferred them into a 1 mL cuvette.
We used a Varian Cary Bio 300 UV-Vis Spectrophotometer to measure the
oxidation of ABTS to ABTS•+
radical. We used the Kinetics program from Cary UV
Win software package to follow the formation of the radical, which has an increased
absorbance at 414 nm (ε414 nm = 31,100 M-1
cm-1
) compared to the unoxidized ABTS. We
placed the cuvettes in the sample holder, which we held at the temperature that the
samples were incubated at, during the initial processes. After 5 minutes in the sample
holder to make sure the solution obtained the desired temperature, we used the sample as
the reference point or the absorbance at time 0 prior to the addition of H2O2.
After we corrected the samples for the background absorbance at 414 nm, we
used 10 µL of H2O2 (varying concentrations) to initiate the reaction. We performed the
initiation process very quickly (within 10 seconds) to maintain constant temperature. We

47
measured the absorption of the final reaction mixture (1 µM DNA, 0.1 µM hemin, 0-12
mM H2O2, 5 mM ABTS, 50 mM HEPES-NH4OH (pH 8.0), 20 mM KCl, 0.05% Triton
X-100, and 2% DMSO) at 414 nm over 30 minutes or until a plateau of the absorbance at
414 nm was reached. We obtained the initial rate of ABTS oxidation from the initial
slopes of absorbance over time graphs. We plotted the initial rate values against the
concentration of H2O2 used in each reaction.
2.2.9 Measuring binding constants between hemin and G-quadruplex forming
oligonucleotides at 4ºC and 21ºC.
We prepared a 2X DNA solution and a 2X folding buffer. We dissolved a
sufficient amount of non-radiolabelled DNA and radiolabelled DNA tracer in 490 µL of
TE buffer to form the desired 2X DNA solutions. We heated the samples at 100ºC for 3
minutes and then cooled them in an ice bath for 5 minutes.
We prepared a 2X folding buffer with 100 mM TrisOAc (pH 7.5), 50 mM KCl,
2% DMSO, and 0.1% Triton X-100. We added 500 µL of 2X buffer solution to each 2X
DNA solution and the mixture was incubated at 4 º C or 21 º C for 30 minutes.
Afterwards, we added 10 µL of 50 µM hemin dissolved in DMSO to the mixture for final
concentrations of 0.5 µM hemin, 0 – 5 µM DNA, 50 mM TrisOAc (pH 7.5), 25 mM KCl,
0.05% Triton X-100, and ~2 % DMSO. We incubated the samples for an additional 30
minutes at 4ºC or 21ºC.
We placed the samples in 1 mL cuvettes and loaded in a Cary 300 Bio UV-
Visible Spectrophotomer. We obtained the spectra for each sample (200 nm – 800 nm)
using the Spectrum program from the Cary UV Win software package. We compared
each sample to a reference sample which contained the same buffer as the sample with

48
TE buffer and DMSO added in place of DNA and hemin. We subtracted the spectrum of
each sample against their relative reference samples. We plotted the peak absorbance
values over a range of DNA concentrations.
We obtained the Kd value from fitting the data to the above equation, obtained
from Wang et al. [84]. Where A represents the absorbance of the soret peak; Amax
represents the maximum absorbance when heme is completely bound by DNA; A0
represents the minimum absorbance when heme is free in solution; H0 represents the total
concentration of hemin. The above equation was derived from the equilibrium equation
for hemin-DNA dissociation.
2.2.10 Measuring the pKa values of various water-hemin complexes
We prepared various buffering components at 1 M concentrations to span a pH
range of 3-10: glycine-HCl (2.5, 3, 3.5, 4), sodium acetate (4, 4.5, 5, 5.5), sodium
phosphate (5.5, 6, 6.5, 7, 7.5, 8.0), Tris-HCl (8, 8.5, 9.0), and glycine-NaOH (8.5, 9.0,
9.5, 10). We prepared a 2X buffer for each pH with 100 mM buffer solution, 50 mM
KCl, 2% DMSO, and 0.1% Triton X-100.
We dissolved 3 nmol of DNA in 10 µL of TE buffer, and then heated at 95ºC for
3 minutes and then cooled in an ice bath for 5 minutes. The solution was made up to 490
µL with the addition of ddH2O. We added the 2X buffer solution to the DNA solution
and the mixture was incubated at 21ºC for 30 minutes.

49
Afterward, we added 10 µL of 50 µM hemin dissolved in DMSO to the mixture
for final concentrations of 0.5 µM hemin, 3 µM DNA, 50 mM buffer, 25 mM KCl,
0.05% Triton X-100, and ~2 % DMSO. We incubated the samples for an additional 30
minutes at 21ºC.
We placed the samples in a 1 mL cuvette and loaded in a Cary 300 Bio UV-
Visible Spectrophotomer. Wre obtained the spectra for each sample (200 nm – 800 nm)
using the Spectrum program from the Cary UV Win software package. We compared
each sample to a reference sample, which contained the same buffer as the sample with
TE buffer, and DMSO added in place of DNA and hemin. We subtracted the spectrum of
each sample against their relative reference samples. We compared the absorbance at
355 nm to the absorbance at 404 nm. We plotted the ratio between 355 nm and 404 nm
over the corresponding pH values.
We obtained the pKa value from fitting the data to the equation below; where A
represents the ratio between the absorbance at 355 nm and 404 nm; Amax represents the
maximum ratio value where heme is completely bound by hydroxide molecules; Amin
represents the minimum ratio value where heme is completely bound to water molecules.
The above equation was derived from the Henderson-Hasselbalch equation.
50
2.3 Results and discussion
2.3.1 Structural analysis of G-quadruplexes with native gels under various
conditions
The controversy of the folded species of PS2.M was the initial motivator for our
structural studies of PS2.M [70, 81]. Lee et al. proposed that PS2.M would fold into an
anti-parallel G-quadruplex and Majhi et al. proposed that PS2.M would fold into a
parallel intermolecular G-quadruplex [70, 81]. As a result, we wanted to determine the
folded structure of PS2.M under optimal heme-binding and peroxidase conditions.
We began by verifying the results of the two conditions that provided the two
conflicting proposed-models of PS2.M [70, 81]. Since non-denaturing gels provided the
primary evidence for both structures, we continued using this method of analysis. The
conditions that varied between the two sets of experiments, such as temperature, salt
conditions, and DNA concentration were rigorously tested for the folding of PS2.M.
In addition, numerous studies employed the peroxidase activity of PS2.M-heme
complex in various detection strategies; however, these studies used a modified version
of PS2.M, called CatG4 [71-76]. Since both PS2.M and CatG4 are capable of binding
heme and catalyzing peroxidase reactions, we wanted to compare the folding of CatG4 to
PS2.M as well.
All the native gels shown in Figure 2.1 demonstrate that the G-quadruplexes
formed by all the oligonucleotides examined are polymorphic in nature. In addition to
presence of multiple bands in the PS2.M lanes, PS2.M also seems to form intramolecular
and intermolecular species, denoted by an asterisk (*). As a result, the anti-parallel

51
intramolecular G-quadruplex structure proposed in Lee et al. and the parallel
intermolecular G-quadruplex structure proposed Majhi et al. may both exist [70, 81].
In the case of the intramolecular species, the faster mobility bands compared to
the SS18 control, were verified to be compact structures of the parent sequences and not
degradation products. The results from the denaturing gel in panel Di demonstrates that
after heat and urea denaturation of the various oligonucleotides, there is only one species
in each lane. The addition of heme during the incubation process does not appear to
cause any visible DNA degradation products.
The hemin-containing and no-hemin lanes for each oligonucleotide differ in band
patterning in all conditions except for the low DNA concentration gels. In the low DNA
concentration gels (panel A), the hemin-containing lanes for PS2.M, PS2.M_mut and
CatG4 at 0.1 µM DNA concentration (panel A) look exactly the same as the no-hemin
lanes. In panel B and C, there is a visible difference between the no-hemin and hemin-
containing lanes. The reason no difference is observed for the low DNA concentration
gels can be attributed to the small concentration of hemin in those samples (0.1 µM
hemin).

52
Figure 2.1: Analysis of the folding pattern of G-quadruplex forming sequences in various
conditions by polyacrylamide gel electrophoresis.
All samples were composed of 40 mM TrisOAc (pH 7.5), 25 mM KCl,
0.05%, Triton X-100, 5% DMSO, ~0.5X TE buffer, and 1:1 ratio of DNA to
heme. All gels contain 40 mM TrisOAc, 0, 5 or 25 mM KCl, and 5 mM
EDTA and 20% polyacrylamide. The amount of DNA in each set of samples
was 0.1 µM (A), 10 µM (B), and 50 µM (C and D). The gel in panel Di
contained an additional ~ 8 M urea.
The KCl concentration in each set of gels was 0 mM (D), 25 mM (A and C),
and 5 mM (B). For all panels (A-C) except for panel D, one image represents
the gel experiment at 4ºC (i) and other image represents the gel experiment at
21ºC (ii).
In the case of panel D, all electrophoresis experiments were performed at
21ºC. Also for panel D, one gel image represents denaturing conditions (i)
and the other represents non-denaturing conditions (ii).
Each gel experiment contains a specific set of oligonucleotides, as denoted in
the figure: SS18, PS2.M, PS2.M_mut, and CatG4. SS18 is a 18-nucleotide
non-G-quadruplex forming single stranded oligonucleotide. PS2.M is an 18-
nucleotide DNA-aptamer for heme that was selected using SELEX [63, 64].
PS2.M_mut has the same general sequence as PS2.M, but a single G has been
moved from the 5‟-end to the 3‟-end. CatG4 is a DNA-aptamer for heme that
was rationally designed from PS2.M. The – and + signs denote samples that
either contained DMSO (no hemin) or hemin.
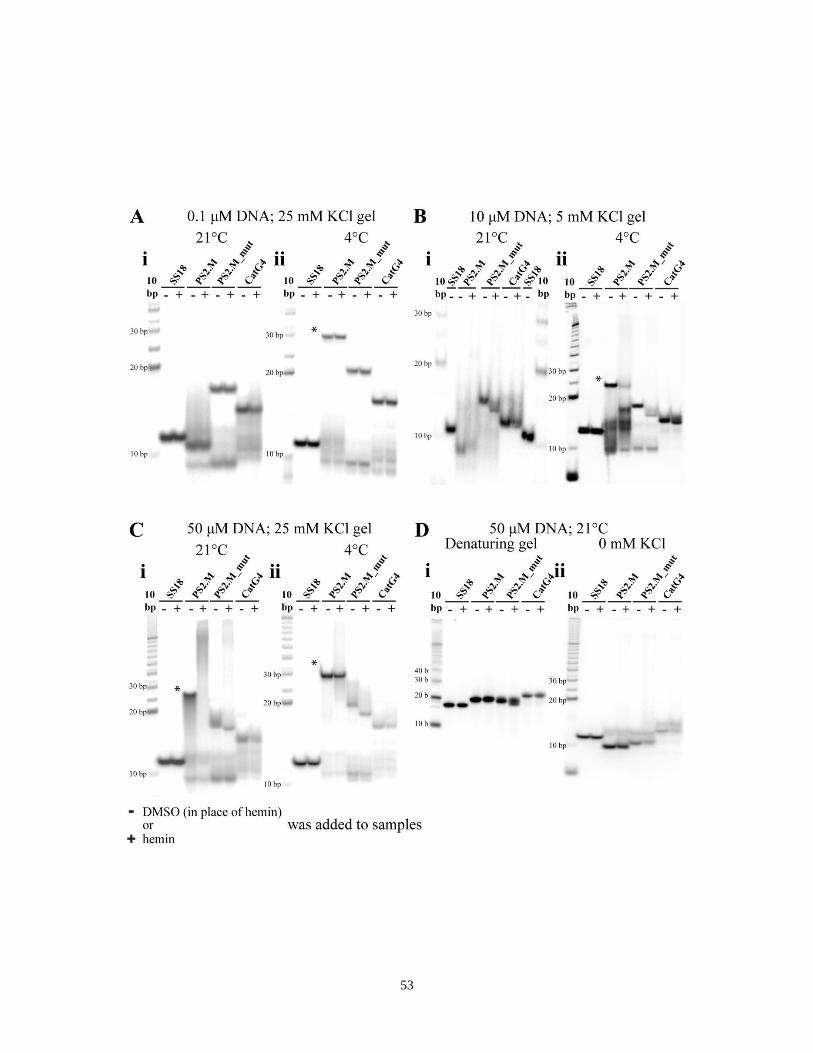
53
54
All hemin-containing samples contained 1:1 ratio of DNA to hemin. The binding
constant of PS2.M has been previously reported by Travascio et al. to be sub-0.5 µM. In
order to bind > 90% of the PS2.M, it was not adequate to use a 1:1 ratio of hemin to
DNA for 0.1 µM PS2.M samples [62]. The binding constants for both PS2.M_mut and
CatG4 also have been determined to be around the same magnitude as PS2.M; therefore,
a 1:1 ratio of hemin to DNA for 0.1 µM PS2.M_mut and CatG4 samples is not sufficient
to form complexes with hemin. As a result, the low DNA concentration gels do not show
a difference between the non-hemin and hemin-containing samples.
From the gel images in panels A-C, the structures of PS2.M_mut and CatG4 do
not seem to change much at different salt concentrations or at different DNA
concentrations. This can be seen in the similar mobility products for PS2.M_mut and
CatG4 in the different conditions.
In contrast, the structures formed by PS2.M seem to be more sensitive to changes
in DNA concentration, KCl concentration, and temperature than PS2.M_mut and CatG4
samples. The distribution of different folding species of PS2.M varies significantly from
one condition to another; where one condition only contains bands formed by
intramolecular species and another condition where a slow mobility product (marked
with *) appears.
Intramolecular folded species are present in all gel conditions; this can be
observed from the bands that have migrated faster than the 18-nucleotide long single
stranded non-G-quadruplex-forming control, SS18. The formation of intermolecular
species by PS2.M is evident in the high DNA concentration and 4ºC samples denoted by
an asterisks (*) in Figure 2.1 and by „2‟ in Figure 2.2. This slow mobility product

55
migrates roughly the same distance as the 30 base pair band in the 10 base pair ladder.
These gel experiments demonstrate that at lower concentrations of DNA, PS2.M favours
intramolecular-folded structures. At high DNA concentrations, low temperature
conditions, and high KCl concentrations, the formation of intermolecular folded
structures by PS2.M becomes apparent.
Figure 2.2: The effects of increasing DNA concentration on the structure of G-
quadruplex forming oligonucleotides.
All gels contain 40 mM Tris-acetate (TrisOAc), 25 mM KCl, and 5 mM
EDTA, and 20% polyacrylamide. All samples were composed of 40 mM
TrisOAc (pH 7.5), 25 mM KCl, 0.05% Triton X-100, 5% DMSO, ~0.5X TE
buffer. Concentrations of DNA in each gel included 0.1 µM, 0.5 µM, 2.5
µM, 10 µM, and 50 µM. A) Ran gel in 21ºC. B) Ran gel in 4 ºC. C) Graph
of results from gel A. D) Graph of results from gel B. The graphs depict the
changes of bands 1 and 2 as a result of increasing DNA concentration. The
amount of each band was plotted as a percentage of the total amount of DNA.
◊ represents band 1 and ■ represents band 2.

56
The effect of increasing DNA concentration on the relative proportions of
intermolecular and intramolecular species can be seen in Figure 2.2. As the amount of
DNA is increased, there is an increase in the amount of the intermolecular species. The
increase in intermolecular structures is attributed to shifts in equilibrium concentrations
of the various conformers in response to the addition of single-stranded DNA. This can
be seen in both the 4ºC and the 21ºC conditions; however, in 4ºC, the amount of
intermolecular species starts as a greater proportion of the total DNA for the low DNA
concentrations.
In both Figure 2.1 and Figure 2.2, the 4ºC conditions promote the formation of
intermolecular species. Intermolecular species form under low temperature conditions
because the unfavorable entropic contribution when multiple strands of DNA come
together is diminshed [85, 86]. Conversely, the formation of an intermolecular species is
enthalpically favored because of the increase in the amount of bonds formed. Therefore,
at low temperature conditions, the unfavorable entropic contribution is minimized and
offset by the favorable enthalpic contributions of multiple strands of DNA coming
together to form a G-quadruplex.
The other crucial factor in determining the folding of PS2.M is the salt condition.
It was previously determined that PS2.M can form a G-quadruplex [64]. The abundance
and type of metal cations in solution have significant effects on G-quadruplex formation
[25]. In Figure 2.1, gel Dii is a 21ºC non-denaturing gel that contains no KCl and 50 µM
DNA samples. In the absence of KCl in the gel, the slow mobility band, equivalent to 30
base pairs, does not form because intermolecular/multimeric G-quadruplexes have a

57
greater need for cations to neutralize the very high negative charge density at the core of
the G-quadruplex.
A diagram of the relationship between the folded structure of PS2.M and the
solution conditions is depicted in Figure 2.3.
Figure 2.3: The relationship between the structure of PS2.M and various conditions.
2.3.2 Investigation of the structure of PS2.M in various conditions using circular
dichroism spectroscopy
Circular dichroism spectroscopy has been a useful investigative tool for the study
of G-quadruplexes. By using both CD spectroscopy and gel electrophoresis, a number of
structural features of G-quadruplexes can be observed, including the number of strands
and the strand polarity.
In Figure 2.4, samples with 0.1 µM, 5 µM and 50 µM PS2.M in 25 mM KCl were
analyzed by CD spectroscopy. Panel D contains all the spectra of SS18 non-G-
quadruplex-forming oligonucleotides for all the different conditions analyzed in
experiments presented in panels A through C. All SS18 samples give similar spectra
after normalizing the ellipticity value for the concentration of DNA in each sample. The
traces for the SS18 samples with hemin show no difference when compared to the
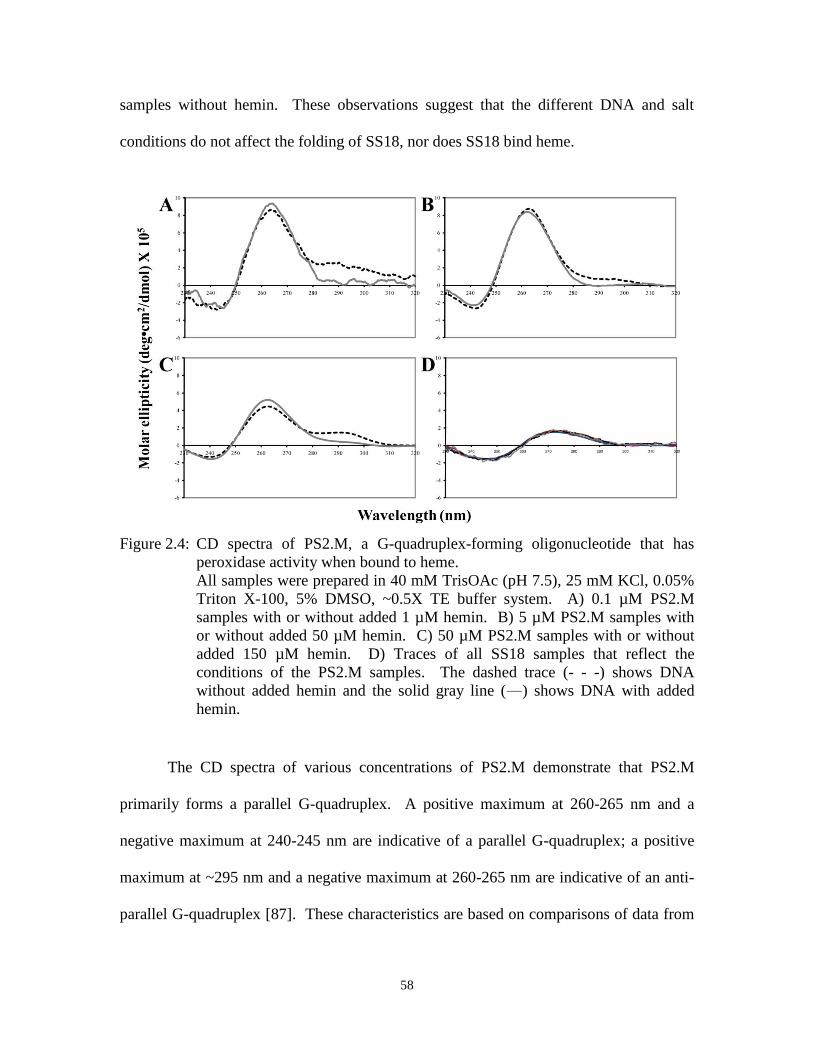
58
samples without hemin. These observations suggest that the different DNA and salt
conditions do not affect the folding of SS18, nor does SS18 bind heme.
Figure 2.4: CD spectra of PS2.M, a G-quadruplex-forming oligonucleotide that has
peroxidase activity when bound to heme.
All samples were prepared in 40 mM TrisOAc (pH 7.5), 25 mM KCl, 0.05%
Triton X-100, 5% DMSO, ~0.5X TE buffer system. A) 0.1 µM PS2.M
samples with or without added 1 µM hemin. B) 5 µM PS2.M samples with
or without added 50 µM hemin. C) 50 µM PS2.M samples with or without
added 150 µM hemin. D) Traces of all SS18 samples that reflect the
conditions of the PS2.M samples. The dashed trace (- - -) shows DNA
without added hemin and the solid gray line (―) shows DNA with added
hemin.
The CD spectra of various concentrations of PS2.M demonstrate that PS2.M
primarily forms a parallel G-quadruplex. A positive maximum at 260-265 nm and a
negative maximum at 240-245 nm are indicative of a parallel G-quadruplex; a positive
maximum at ~295 nm and a negative maximum at 260-265 nm are indicative of an anti-
parallel G-quadruplex [87]. These characteristics are based on comparisons of data from

59
known G-quadruplexes and their strand orientations with their corresponding CD spectra
[87]. However, all the samples without added hemin show a small shoulder around the
295 nm region which is indicative of an anti-parallel G-quadruplex.
This shoulder at 295 nm is most likely the result of a heterogeneous mixture of G-
quadruplexes, where the dominant species is parallel, but some anti-parallel species exist
in smaller quantities. It is unlikely that the 295 nm shoulder would exist due to the
formation of a hybrid G-quadruplex structure with strands that are both parallel and anti-
parallel to each other because the shoulder would lie closer to 270 nm [88]. When excess
hemin was added to all PS2.M samples, the small shoulder at 295 nm decreased, which
we attribute to hemin promoting PS2.M to fold into parallel G-quadruplexes from anti-
parallel G-quadruplexes [78].
The CD spectra from panels A and B are very similar, which suggests that the
mixture of species in 0.1 µM and 5 µM PS2.M samples may be similar as well.
However, the 50 µM PS2.M sample shows a difference in the intensity of the positive
265 nm peak and negative 245 nm peak than the 0.1 µM and 5 µM PS2.M samples.
From the gels in Figure 2.2, one can notice that there is a change in the amount of
intermolecular species as a function of PS2.M concentration. As a result, the lower
intensity of the peaks in the CD spectrum of the 50 µM PS2.M samples may be the result
of PS2.M folding into intermolecular G-quadruplexes. However, Lin et al. reported that
an increase in intermolecular parallel G-quadruplexes causes an increase in the intensity
of the peaks at 265 nm and 245 nm [89].
The discrepancy in results above may have several explanations. The intensity
was normalized for the concentration of single stranded PS2.M and not the concentration
60
of tetrameric G-quadruplexes. Each tetrameric G-quadruplex requires four strands of
DNA. The formation of tetrameric G-quadruplexes as compared to monomeric G-
quadruplexes would reduce the effective amount of G-quadruplexes in the solution. The
concentration of the tetrameric G-quadruplex is a quarter of the concentration of total
single-stranded DNA. As a result, the molar ellipticity values for the high DNA
concentration samples would be 4-fold larger as well. Another explanation stems from
the empirical nature of CD spectroscopy for G-quadruplex investigation. The
interpretation of the optical properties from CD spectra is quite controversial; therefore,
hyperchromicity of a peak in one case may not be the same in another case [90, 91].
In addition to observing the changes in G-quadruplex strand polarity over several
DNA concentrations, we also observed the impact of different monovalent cations on G-
quadruplex formation by PS2.M. The use of either KCl or NaCl to stabilize the G-
quadruplexes formed by PS2.M caused ethier parallel-stranded or anti-parallel-stranded
G-quadruplexes to form. Figure 2.5 demonstrates that KCl concentrations of >10 mM
lead to PS2.M forming a parallel G-quadruplex whereas NaCl promotes an anti-parallel
G-quadruplex formation by PS2.M.
A similar cation specific effect was observed when an oligonucleotide derived
from tandem repeats of the human telomeric sequence was exposed to either Na+ or K
+
[92, 93]. However, despite the similarity in response of PS2.M and an oligonucleotide
from the human telomeric sequence to the same cationic species, there is no definitive
rule that dictates the specific strand orientation of a given G-quadruplex in response to
different cations [25].
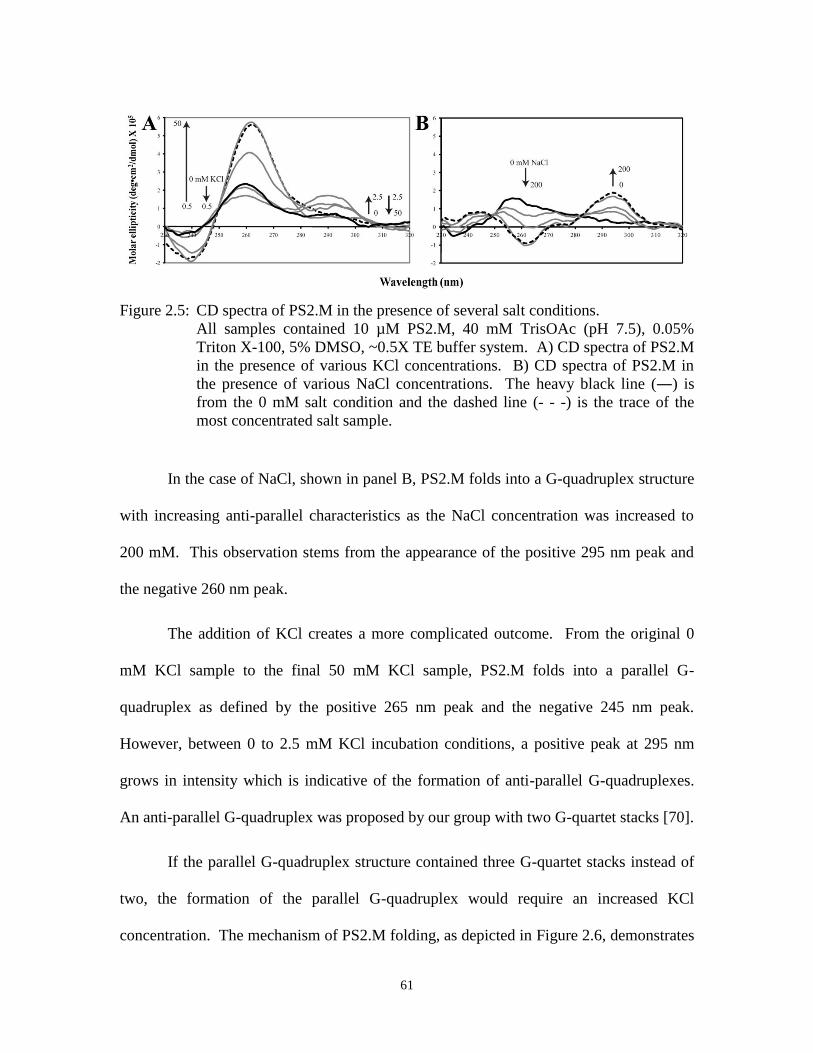
61
Figure 2.5: CD spectra of PS2.M in the presence of several salt conditions.
All samples contained 10 µM PS2.M, 40 mM TrisOAc (pH 7.5), 0.05%
Triton X-100, 5% DMSO, ~0.5X TE buffer system. A) CD spectra of PS2.M
in the presence of various KCl concentrations. B) CD spectra of PS2.M in
the presence of various NaCl concentrations. The heavy black line (―) is
from the 0 mM salt condition and the dashed line (- - -) is the trace of the
most concentrated salt sample.
In the case of NaCl, shown in panel B, PS2.M folds into a G-quadruplex structure
with increasing anti-parallel characteristics as the NaCl concentration was increased to
200 mM. This observation stems from the appearance of the positive 295 nm peak and
the negative 260 nm peak.
The addition of KCl creates a more complicated outcome. From the original 0
mM KCl sample to the final 50 mM KCl sample, PS2.M folds into a parallel G-
quadruplex as defined by the positive 265 nm peak and the negative 245 nm peak.
However, between 0 to 2.5 mM KCl incubation conditions, a positive peak at 295 nm
grows in intensity which is indicative of the formation of anti-parallel G-quadruplexes.
An anti-parallel G-quadruplex was proposed by our group with two G-quartet stacks [70].
If the parallel G-quadruplex structure contained three G-quartet stacks instead of
two, the formation of the parallel G-quadruplex would require an increased KCl
concentration. The mechanism of PS2.M folding, as depicted in Figure 2.6, demonstrates

62
that the anti-parallel-stranded structure on the left folds quicker because there is only a
single potassium ion that is needed to stabilize the formation of two G-quartets. The
parallel-stranded structure on the right requires two potassium ions to form a G-
quadruplex with three G-quartet stacks; therefore, it is a slower folding pathway.
Even though PS2.M can fold into an anti-parallel G-quadruplex, Travascio et al.
have demonstrated that PS2.M is not an active peroxidase in anti-parallel G-quadruplex
folding conditions, KCl concentrations lower than 5 mM or in NaCl conditions [62].
Along with evidence from other groups, the anti-parallel G-quadruplexes are thought to
be poor peroxidase enzymes, most likely due to their poor heme binding ability [78-80].
Figure 2.6: Scheme of PS2.M folding in the presence of potassium ions.
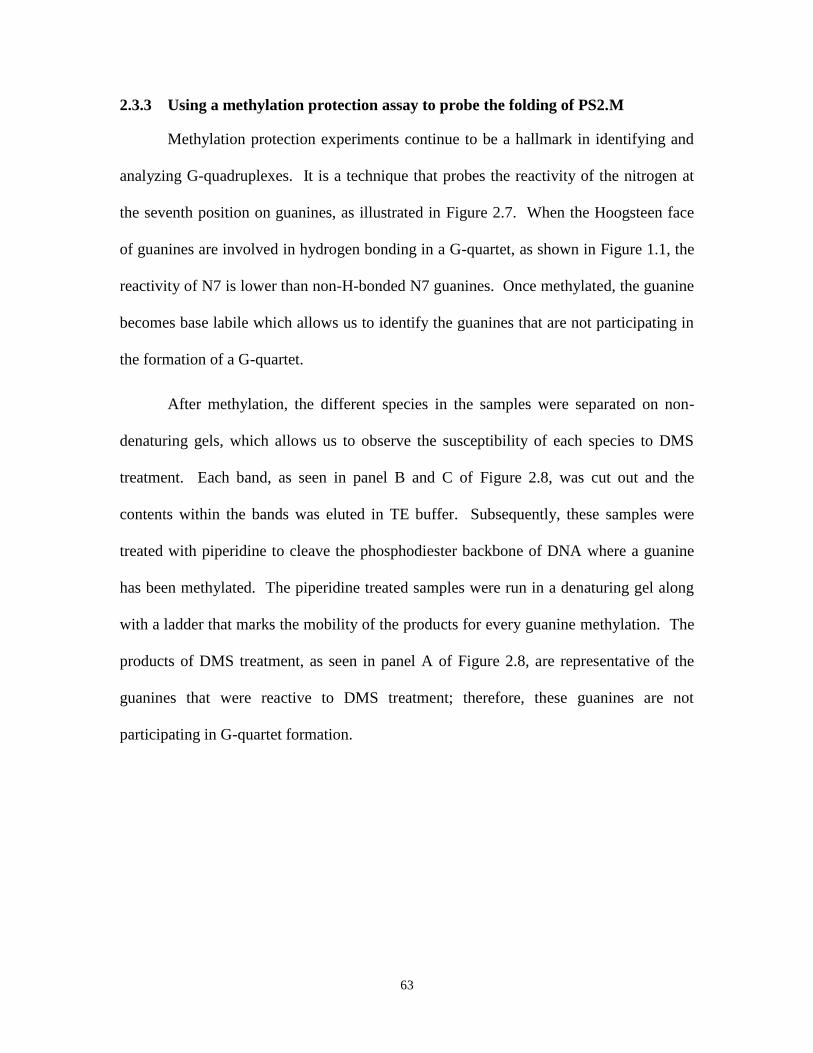
63
2.3.3 Using a methylation protection assay to probe the folding of PS2.M
Methylation protection experiments continue to be a hallmark in identifying and
analyzing G-quadruplexes. It is a technique that probes the reactivity of the nitrogen at
the seventh position on guanines, as illustrated in Figure 2.7. When the Hoogsteen face
of guanines are involved in hydrogen bonding in a G-quartet, as shown in Figure 1.1, the
reactivity of N7 is lower than non-H-bonded N7 guanines. Once methylated, the guanine
becomes base labile which allows us to identify the guanines that are not participating in
the formation of a G-quartet.
After methylation, the different species in the samples were separated on non-
denaturing gels, which allows us to observe the susceptibility of each species to DMS
treatment. Each band, as seen in panel B and C of Figure 2.8, was cut out and the
contents within the bands was eluted in TE buffer. Subsequently, these samples were
treated with piperidine to cleave the phosphodiester backbone of DNA where a guanine
has been methylated. The piperidine treated samples were run in a denaturing gel along
with a ladder that marks the mobility of the products for every guanine methylation. The
products of DMS treatment, as seen in panel A of Figure 2.8, are representative of the
guanines that were reactive to DMS treatment; therefore, these guanines are not
participating in G-quartet formation.
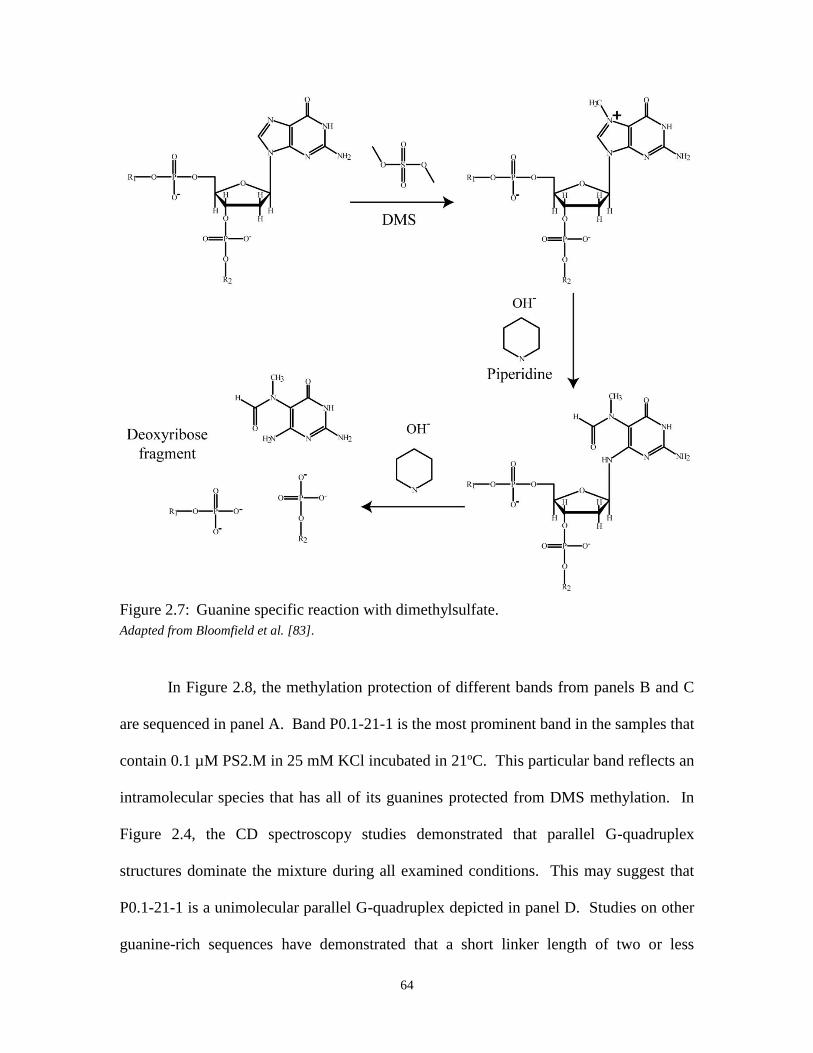
64
Figure 2.7: Guanine specific reaction with dimethylsulfate.
Adapted from Bloomfield et al. [83].
In Figure 2.8, the methylation protection of different bands from panels B and C
are sequenced in panel A. Band P0.1-21-1 is the most prominent band in the samples that
contain 0.1 µM PS2.M in 25 mM KCl incubated in 21ºC. This particular band reflects an
intramolecular species that has all of its guanines protected from DMS methylation. In
Figure 2.4, the CD spectroscopy studies demonstrated that parallel G-quadruplex
structures dominate the mixture during all examined conditions. This may suggest that
P0.1-21-1 is a unimolecular parallel G-quadruplex depicted in panel D. Studies on other
guanine-rich sequences have demonstrated that a short linker length of two or less
65
nucleotides between G-tracts favor the formation of a parallel unimolecular G-quadruplex
[94, 95]. In PS2.M‟s case, the linker lengths are either 1 or 2 nucleotides; therefore, it is
highly probable that PS2.M folds into an intramolecular parallel G-quadruplex.
Band P0.1-21-2 on the other hand does not show complete protection from DMS
methylation. Guanines 1, 5, 10 and 12, all demonstrate increased reactivity towards
DMS which suggests that these guanines are located on the loops in the G-quadruplex
structure. This reactivity pattern is the same as previous results from our lab and two
possible models were described to explain those results [70]. Both models were anti-
parallel unimolecular G-quadruplex structures, and the difference between the two
models involves a diagonal loop in place of a lateral loop.
Band P0.1-21-2 is less than 10% of the total DNA in the solution which may
explain the presence of a small shoulder at 295 nm in the CD spectra of PS2.M samples.
However, another model that fits the methylation protection patterning is a parallel
unimolecular G-quadruplex that contains loops with 3 and 2 nucleotides seen in Figure
2.8. Since the results from CD spectroscopy show that the majority of the G-
quadruplexes in the PS2.M samples are parallel-stranded, it is reasonable to suggest that
the species in band P0.1-21-2 is parallel-stranded as well.
In the case of the intermolecular species that reside in the slow migrating bands,
P0.1-4-1, P50-21-1 and P50-4-1, these may all represent the same species. All species
from the slow migrating bands were not reactive to DMS. The mobility of the band
suggests that the species within it are intermolecular G-quadruplexes. Since all guanines
are non-reactive to DMS, this suggests that all guanines participate in G-quartet
formation.
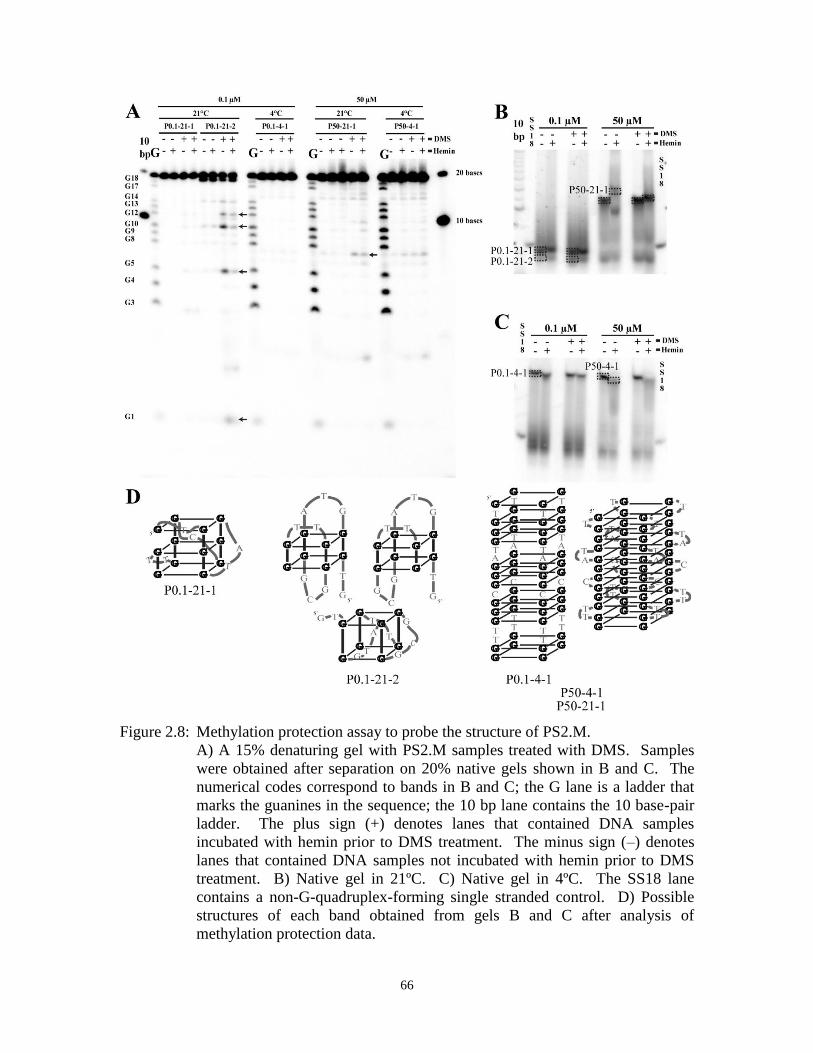
66
Figure 2.8: Methylation protection assay to probe the structure of PS2.M.
A) A 15% denaturing gel with PS2.M samples treated with DMS. Samples
were obtained after separation on 20% native gels shown in B and C. The
numerical codes correspond to bands in B and C; the G lane is a ladder that
marks the guanines in the sequence; the 10 bp lane contains the 10 base-pair
ladder. The plus sign (+) denotes lanes that contained DNA samples
incubated with hemin prior to DMS treatment. The minus sign (–) denotes
lanes that contained DNA samples not incubated with hemin prior to DMS
treatment. B) Native gel in 21ºC. C) Native gel in 4ºC. The SS18 lane
contains a non-G-quadruplex-forming single stranded control. D) Possible
structures of each band obtained from gels B and C after analysis of
methylation protection data.
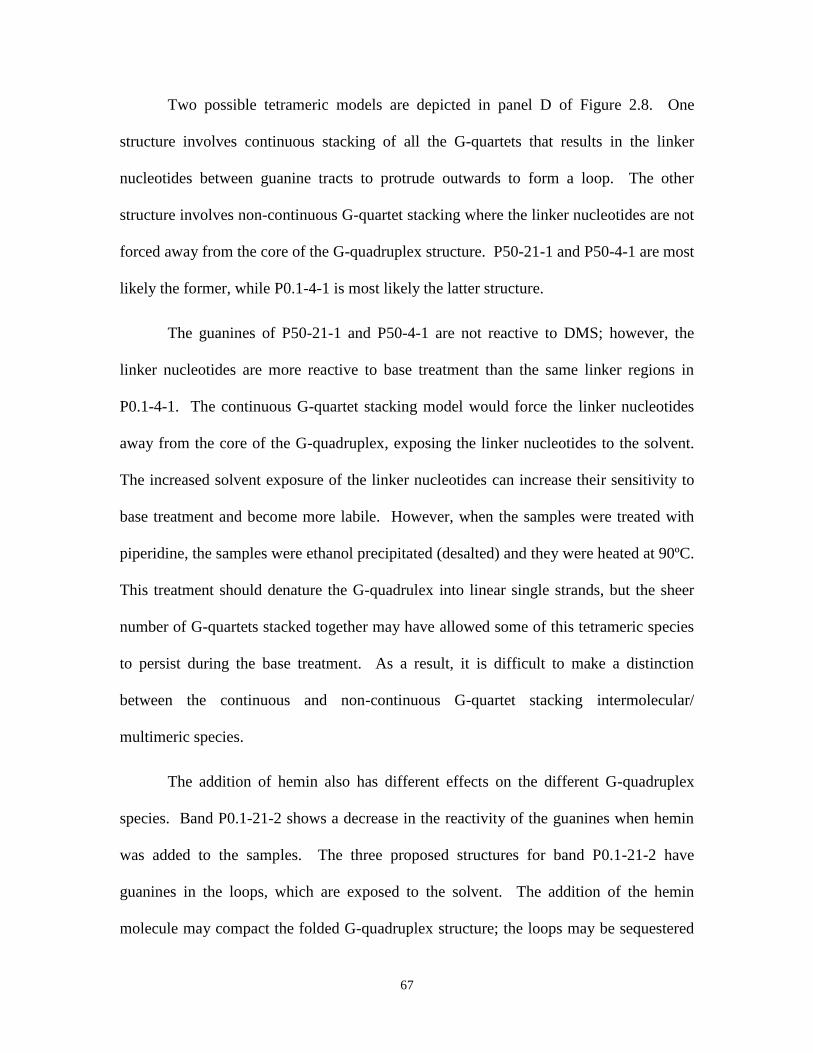
67
Two possible tetrameric models are depicted in panel D of Figure 2.8. One
structure involves continuous stacking of all the G-quartets that results in the linker
nucleotides between guanine tracts to protrude outwards to form a loop. The other
structure involves non-continuous G-quartet stacking where the linker nucleotides are not
forced away from the core of the G-quadruplex structure. P50-21-1 and P50-4-1 are most
likely the former, while P0.1-4-1 is most likely the latter structure.
The guanines of P50-21-1 and P50-4-1 are not reactive to DMS; however, the
linker nucleotides are more reactive to base treatment than the same linker regions in
P0.1-4-1. The continuous G-quartet stacking model would force the linker nucleotides
away from the core of the G-quadruplex, exposing the linker nucleotides to the solvent.
The increased solvent exposure of the linker nucleotides can increase their sensitivity to
base treatment and become more labile. However, when the samples were treated with
piperidine, the samples were ethanol precipitated (desalted) and they were heated at 90ºC.
This treatment should denature the G-quadrulex into linear single strands, but the sheer
number of G-quartets stacked together may have allowed some of this tetrameric species
to persist during the base treatment. As a result, it is difficult to make a distinction
between the continuous and non-continuous G-quartet stacking intermolecular/
multimeric species.
The addition of hemin also has different effects on the different G-quadruplex
species. Band P0.1-21-2 shows a decrease in the reactivity of the guanines when hemin
was added to the samples. The three proposed structures for band P0.1-21-2 have
guanines in the loops, which are exposed to the solvent. The addition of the hemin
molecule may compact the folded G-quadruplex structure; the loops may be sequestered

68
within the grooves of the backbone of the G-quadruplex, which reduces the reactivity of
the guanines to DMS. In contrast, for band P50-21-1, the intermolecular species at 21°C
has the opposite effect when hemin was added to the samples. The reactivity of the
linker regions increased with the addition of hemin. When hemin was added to the
samples, the linkers became more exposed to solvent because the hemin molecule may
have compacted the structure of the non-continuous tetrameric G-quadruplex to the
continuous tetrameric G-quadruplex. These results demonstrate that hemin may play a
role in the overall folding of PS2.M, perhaps via an induced fit model as opposed to a
lock and key model.
2.3.4 Investigating the peroxidase active species of PS2.M by observing the kinetics
of ABTS oxidation at 4ºC and 21ºC
In order to investigate the structure formed by PS2.M that catalyzes peroxidase
reactions when bound to heme, we compared the ability of PS2.M-heme complex to
oxidize ABTS at 4ºC and 21ºC. For all G-quadruplex-forming oligonucleotides
presented in Figure 2.9, the initial rates for ABTS oxidation were greater for samples in
21ºC than in 4ºC. The inset in panel C shows the initial rates of ABTS oxidation by
SS18, a non-G-quadruplex-forming oligonucleotide control, which oxidizes ABTS at a
much slower rate than the G-quadruplex-forming oligonucleotide samples.
From the gel experiments presented in Figure 2.1, the band patterning for
PS2.M_mut and CatG4 changes less over a range of DNA concentrations, KCl
concentrations and temperature conditions than PS2.M. The PS2.M folding pattern
changes drastically from a predominantly intramolecular/unimolecular structure to a
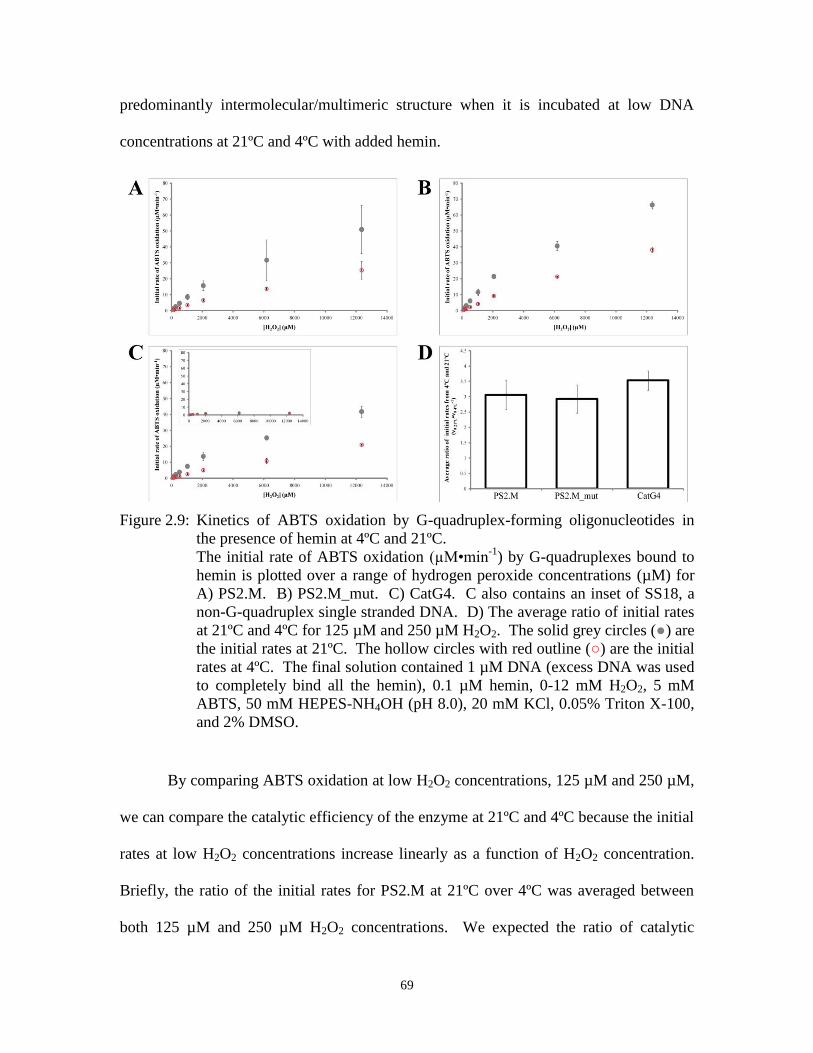
69
predominantly intermolecular/multimeric structure when it is incubated at low DNA
concentrations at 21ºC and 4ºC with added hemin.
Figure 2.9: Kinetics of ABTS oxidation by G-quadruplex-forming oligonucleotides in
the presence of hemin at 4ºC and 21ºC.
The initial rate of ABTS oxidation (µM•min-1
) by G-quadruplexes bound to
hemin is plotted over a range of hydrogen peroxide concentrations (µM) for
A) PS2.M. B) PS2.M_mut. C) CatG4. C also contains an inset of SS18, a
non-G-quadruplex single stranded DNA. D) The average ratio of initial rates
at 21ºC and 4ºC for 125 µM and 250 µM H2O2. The solid grey circles (●) are
the initial rates at 21ºC. The hollow circles with red outline (○) are the initial
rates at 4ºC. The final solution contained 1 µM DNA (excess DNA was used
to completely bind all the hemin), 0.1 µM hemin, 0-12 mM H2O2, 5 mM
ABTS, 50 mM HEPES-NH4OH (pH 8.0), 20 mM KCl, 0.05% Triton X-100,
and 2% DMSO.
By comparing ABTS oxidation at low H2O2 concentrations, 125 µM and 250 µM,
we can compare the catalytic efficiency of the enzyme at 21ºC and 4ºC because the initial
rates at low H2O2 concentrations increase linearly as a function of H2O2 concentration.
Briefly, the ratio of the initial rates for PS2.M at 21ºC over 4ºC was averaged between
both 125 µM and 250 µM H2O2 concentrations. We expected the ratio of catalytic

70
efficiencies between reactions at 21ºC and 4ºC for PS2.M and the other two DNAzymes
(PS2.M_mut and CatG4) to be different because there is a larger change in the mixture of
structures that is formed by PS2.M than the other two DNAzymes.
Panel D of Figure 2.9, shows the initial rate ratio of ABTS oxidation at 21ºC and
4ºC between PS2.M, PS2.M_mut and CatG4 to be statistically similar. The ratios were
3.1±0.5, 2.9±0.5, and 3.5±0.3 for PS2.M, PS2.M_mut and CatG4 respectively.
Generally, a 10ºC decrease in temperature causes a 2-fold decrease in the reaction rate;
therefore, a roughly 3-fold decrease in the reaction rate is reasonable for a drop in
temperature from 21ºC and 4ºC. Since there is no statistical difference between the
temperature-dependent-ratio of reaction rates between PS2.M and the other two
DNAzymes, this suggests that the amount of catalytically active species in PS2.M
samples is the same at 21ºC and 4ºC.
In Figure 2.1, the gels clearly show a substantial difference in PS2.M band
patterning between the PS2.M lanes in 21ºC and 4ºC, which would suggest a difference
in the distribution of structures formed by PS2.M at the two temperature conditions.
However, it is possible that both tetrameric G-quadruplexes and monomeric G-
quadruplexes formed by PS2.M are capable of binding heme. Other studies have
demonstrated that multimeric and unimolecular parallel G-quadruplexes have peroxidase-
like activity when bound to heme [79, 80, 82]. Therefore, as long as there is the same
number of heme-bound complexes at 21ºC and 4ºC, there would be the same number of
catalytically active species as well.
The amount of DNA in the different solutions is 10-fold greater than the amount
of heme molecules; however, when PS2.M folds into a tetrameric species there would
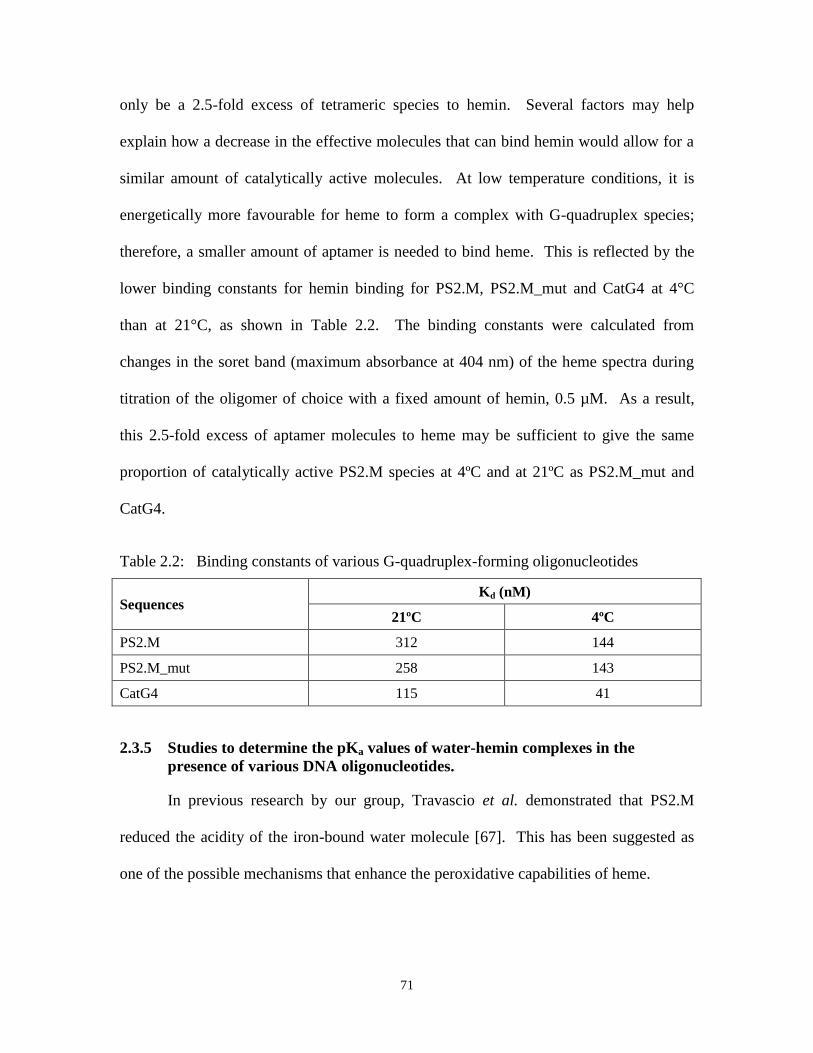
71
only be a 2.5-fold excess of tetrameric species to hemin. Several factors may help
explain how a decrease in the effective molecules that can bind hemin would allow for a
similar amount of catalytically active molecules. At low temperature conditions, it is
energetically more favourable for heme to form a complex with G-quadruplex species;
therefore, a smaller amount of aptamer is needed to bind heme. This is reflected by the
lower binding constants for hemin binding for PS2.M, PS2.M_mut and CatG4 at 4°C
than at 21°C, as shown in Table 2.2. The binding constants were calculated from
changes in the soret band (maximum absorbance at 404 nm) of the heme spectra during
titration of the oligomer of choice with a fixed amount of hemin, 0.5 µM. As a result,
this 2.5-fold excess of aptamer molecules to heme may be sufficient to give the same
proportion of catalytically active PS2.M species at 4ºC and at 21ºC as PS2.M_mut and
CatG4.
Table 2.2: Binding constants of various G-quadruplex-forming oligonucleotides
Sequences Kd (nM)
21ºC 4ºC
PS2.M 312 144
PS2.M_mut 258 143
CatG4 115 41
2.3.5 Studies to determine the pKa values of water-hemin complexes in the
presence of various DNA oligonucleotides.
In previous research by our group, Travascio et al. demonstrated that PS2.M
reduced the acidity of the iron-bound water molecule [67]. This has been suggested as
one of the possible mechanisms that enhance the peroxidative capabilities of heme.
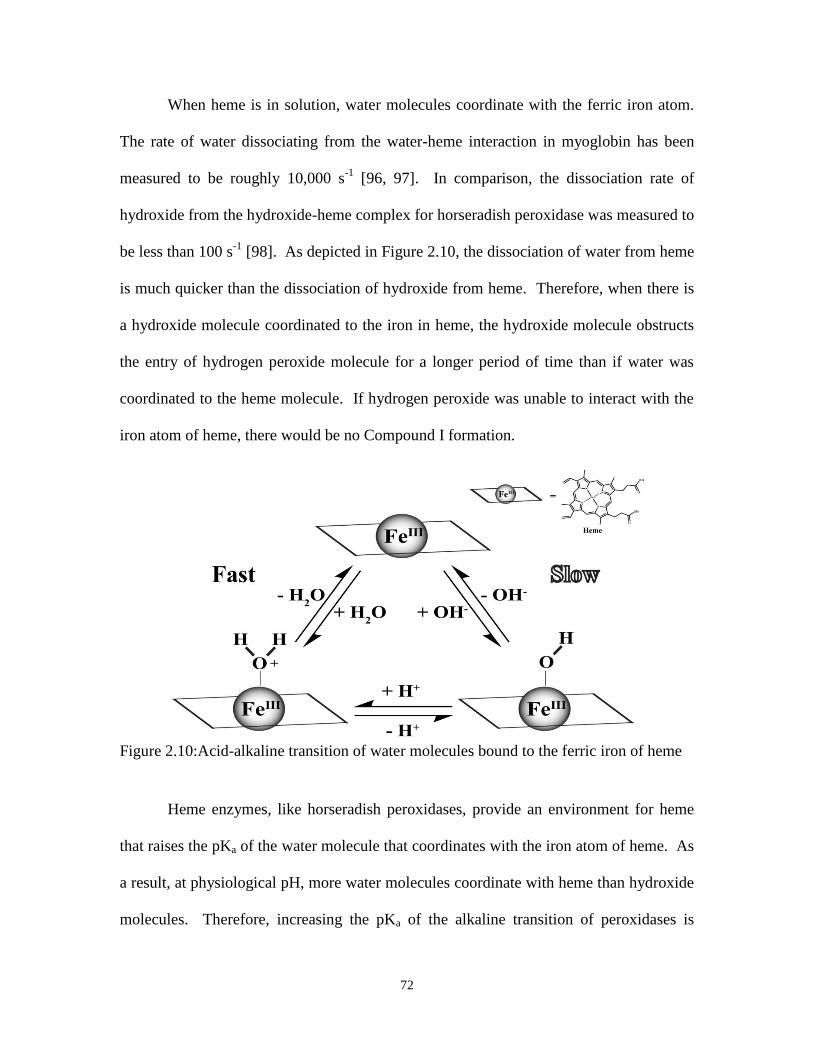
72
When heme is in solution, water molecules coordinate with the ferric iron atom.
The rate of water dissociating from the water-heme interaction in myoglobin has been
measured to be roughly 10,000 s-1
[96, 97]. In comparison, the dissociation rate of
hydroxide from the hydroxide-heme complex for horseradish peroxidase was measured to
be less than 100 s-1
[98]. As depicted in Figure 2.10, the dissociation of water from heme
is much quicker than the dissociation of hydroxide from heme. Therefore, when there is
a hydroxide molecule coordinated to the iron in heme, the hydroxide molecule obstructs
the entry of hydrogen peroxide molecule for a longer period of time than if water was
coordinated to the heme molecule. If hydrogen peroxide was unable to interact with the
iron atom of heme, there would be no Compound I formation.
Figure 2.10:Acid-alkaline transition of water molecules bound to the ferric iron of heme
Heme enzymes, like horseradish peroxidases, provide an environment for heme
that raises the pKa of the water molecule that coordinates with the iron atom of heme. As
a result, at physiological pH, more water molecules coordinate with heme than hydroxide
molecules. Therefore, increasing the pKa of the alkaline transition of peroxidases is
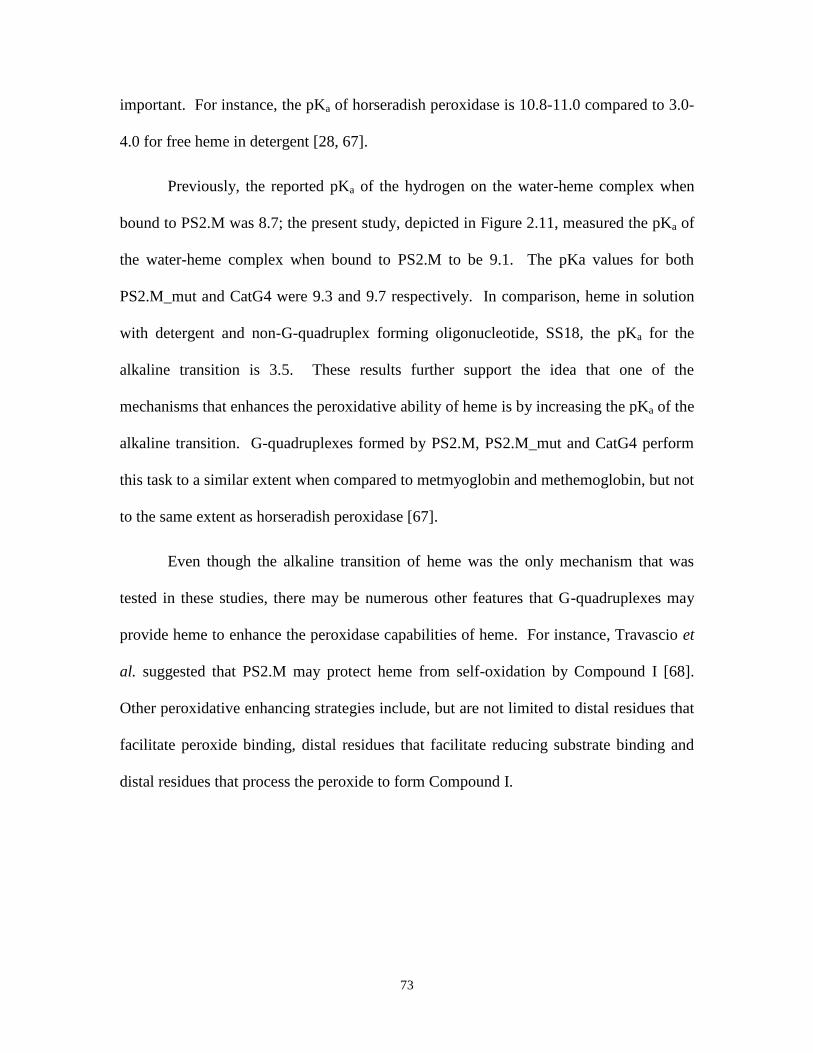
73
important. For instance, the pKa of horseradish peroxidase is 10.8-11.0 compared to 3.0-
4.0 for free heme in detergent [28, 67].
Previously, the reported pKa of the hydrogen on the water-heme complex when
bound to PS2.M was 8.7; the present study, depicted in Figure 2.11, measured the pKa of
the water-heme complex when bound to PS2.M to be 9.1. The pKa values for both
PS2.M_mut and CatG4 were 9.3 and 9.7 respectively. In comparison, heme in solution
with detergent and non-G-quadruplex forming oligonucleotide, SS18, the pKa for the
alkaline transition is 3.5. These results further support the idea that one of the
mechanisms that enhances the peroxidative ability of heme is by increasing the pKa of the
alkaline transition. G-quadruplexes formed by PS2.M, PS2.M_mut and CatG4 perform
this task to a similar extent when compared to metmyoglobin and methemoglobin, but not
to the same extent as horseradish peroxidase [67].
Even though the alkaline transition of heme was the only mechanism that was
tested in these studies, there may be numerous other features that G-quadruplexes may
provide heme to enhance the peroxidase capabilities of heme. For instance, Travascio et
al. suggested that PS2.M may protect heme from self-oxidation by Compound I [68].
Other peroxidative enhancing strategies include, but are not limited to distal residues that
facilitate peroxide binding, distal residues that facilitate reducing substrate binding and
distal residues that process the peroxide to form Compound I.
74
Figure 2.11:Plots of ratios of absorbance at 355 nm and 404 nm over a range of pH
values to determine the pKa values of water-hemin complexes.
Graphs to determine the pKa values of water-hemin complexes in the
presence of A) PS2.M, B) PS2.M_mut, C) CatG4 and D) SS18. SS18 is a
non-G-quadruplex-forming oligonucleotide control. The inset in panel A
contains a table of experimentally obtained pKa values. The final solution
contained 0.5 µM hemin, 3 µM DNA, 50 mM buffer, 25 mM KCl, 0.05%
Triton X-100, and ~2 % DMSO.
2.4 Chapter conclusion
In our structural studies, we have attempted to elucidate the structure of the active
species of PS2.M that is capable of binding heme and providing enhanced peroxidative
catalysis. Different groups have provided evidence for possible structures formed by
PS2.M, we brought clarity to these results by thoroughly investigating the folding of
PS2.M under various conditions [70, 81].
PS2.M folds in a highly polymorphic manner and forms multiple types of G-
quadruplexes. In order to form G-quadruplexes, monovalent cations are required to

75
neutralize the concentrated negative dipoles of oxygen atoms. PS2.M varies in its G-
quadruplex strand orientation in the presence of specific monovalent cations.
In sodium, PS2.M folds into antiparallel G-quadruplexes; while in potassium,
PS2.M begins by folding into anti-parallel G-quadruplex structures, but parallel G-
quarduplexes are favoured when the concentration of KCl is >2.5 mM KCl. The anti-
parallel G-quadruplex structure formed by PS2.M folds in lower amounts of KCl because
it has only two G-quartets to stabilize as compared to the proposed parallel G-quadruplex
structure that contains three G-quartets.
These structural features were supported by methylation protection studies that
demonstrated the existence of complete DMS-protected species and partially DMS-
protected species. In addition to the intramolecular G-quadruplex species, multimeric G-
quadruplexes also exist in the mixture. All guanines in the multimeric species participate
in forming G-quartets, which increases the amount of bonds formed as compared to
intramolecular G-quadruplexes. The proposed tetrameric G-quadruplexes are
enthalpically favoured; however, the assembly of a multiple component structure is
entropically unfavourable. As a result, decreasing the temperature of the environment
minimizes the entropic component and favours the formation of the tetrameric G-
quadruplex. In addition to the change in temperature, the increase in monomer
concentration also increases the amount of tetramer formation by shifting the equilibrium
towards the formation of the tetrameric G-quadruplex.
In the midst of elucidating the complex folding pattern of PS2.M, we also
attempted to identify the structure that binds heme and enhances the peroxidative ability
of heme. The comparison of ABTS oxidation at both 4ºC and 21ºC for PS2.M and the
76
other G-quadruplex and non-G-quadruplex forming oligonucleotides showed that the
proportion of catalytic species was the same for all G-quadruplex-forming
oligonucleotides at 4ºC and 21ºC. Since non-denaturing gels show that the folded
structures of PS2.M are more temperature sensitive than the other G-quadruplex-forming
sequences, the above results demonstrate that there is the same amount of catalytically
active species in the PS2.M samples at 4ºC and 21ºC. This suggests that the peroxidative
activity may be generated by either a common structure of similar concentration that exist
in both temperature conditions or that the structures that form in different proportions in
the two temperature conditions can bind heme equally in solution. The latter reasoning is
more likely, as many G-quadruplexes of different shapes and sizes have been
demonstrated to have peroxidative ability when bound to heme [78-80].
The reason for the enhanced peroxidative ability afforded by G-quadruplexes to
heme may be explained by the alkaline transition of the water-heme complex. All three
G-quadruplex-forming oligonucleotides, PS2.M, PS2.M_mut, and CatG4 reduce the
acidity of the complex. The increased pKa of the water-heme complex when bound to G-
quadruplexes means that the hydroxide-heme complex is small in quantity at
physiological pH. The water-heme complex dissociates faster than the hydroxide-heme
complex; therefore, Compound I formation is less impeded under conditions favouring
the water-heme complex than the hydroxide-heme complex.
77
3: Exploration of a new catalytic property of
nucleoheme complexes
3.1 Introduction
Peroxidases catalyze 1-electron oxidation reactions, but numerous peroxidases
can also perform some 2-electron oxidation reactions as well [99, 100]. However,
peroxidases require hydrogen peroxide (peroxygenation) to form the iron-oxo species,
whereas, monooxygenases such as cytochrome P450 can activate molecular oxygen
(monooxygenation) to form the same higher energy species called Compound I [99, 100].
Once Compound I is formed, two distinct mechanisms for 2-electron oxidation
can proceed. These two mechanisms are depicted in Figure 3.1, one route follows the
direct transfer of oxygen to the substrate; thus, using both oxidizing equivalents of
oxygen simultaneously to perform a 2-electron oxidation [99]. In this mechanism
Compound I, Fe(IV) with one oxidizing equivalent delocalized on the porphyrin ring is
directly reduced to its resting state, Fe(III) [99]. The second mechanism involves two
successive 1-electron oxidations taking place to return Compound I back to Fe(III) [99].
In this mechanism the oxygen is transferred via Compound II, Fe(IV), to return to its
resting state [99]. There is evidence for both mechanisms, but the latter oxygen rebound
mechanism is favored in the cytochrome P450 community [99].
Since protein peroxidises are capable of 2-electron oxidations, we wanted to
examine if PS2.M-hemin was capable of a similar function. Peroxygenase activity was
investigated using three classic 2-electron oxidation substrates: thioanisole, indole, and

78
styrene. Furthermore, it has been demonstrated that many DNA G-quadruplexes are
capable of catalyzing the 1-electron oxidation of ABTS [77]. We would like to
determine if other DNA and RNA oligonucleotides that fold into G-quadruplexes can
catalyze 2-electron oxidation reactions as well. The particular 2-electron oxidation
reaction of interest is characterized by transfer of an oxygen atom from hydrogen
peroxide, via Compound I, to the substrate. The following chapter contains published
results from our various studies [101].
Figure 3.1: Scheme of the two possible oxygen transfer mechanisms.
Once Fe (III) heme is activated by hydrogen peroxide to form Compound I,
there are two routes that can lead to oxygen transfer to the substrate (R). The
direct oxygen insertion mechanism is depicted by the dashed lines (- - -) and
the oxygen rebound mechanism is depicted by the scaled lines (|||||).

79
3.2 Materials and methods
3.2.1 Materials
All DNA was purchased from Integrated DNA Technologies, Inc. All RNA was
purchased from University Core DNA Services (University of Calgary). The sequences
of all DNAs and RNAs are given in Table 3.1. All nucleic acids were purified by
preparative gel electrophoresis, eluted, ethanol precipitated, and then stored dissolved in
TE buffer [10 mM Tris, pH 7.5, and 0.1 mM ethylenediaminetetraacetate (EDTA)], as
described in section 2.2.2. All chemicals were purchased from Sigma-Aldrich, unless
specified otherwise. Hemin was purchased from Porphyrin Products (Logan, Utah).
Hydrogen peroxide-18
O2 was purchased from Icon Isotopes (Summit, New Jersey).
Table 3.1: DNA and RNA sequencesa,b
Name Sequence
dsDNA 5‟-TTT AGT CGA CCT CGC CCC CGC TGC CAT AGT GAC ACA-3‟
3‟-AAA TCA GCT GGA GCG GGG GCG ACG GTA TCA CTG TGT-5‟
SS18 5‟-AAT ACG ACT CAC TAT ACT-3‟
rSS18 5‟-AAU ACG ACU CAC UAU ACU-3‟
PS2.M 5‟-GTG GGT AGG GCG GGT TGG-3‟
rPS2.M 5‟-GUG GGU AGG GCG GGU UGG-3‟
CatG4 5‟-TGG GTA GGG CGG GTT GGG AAA-3‟
Hum4 5‟-TTA GGG TTA GGG TTA GGG TTA GGG-3‟
rHum4 5‟-UUA GGG UUA GGG UUA GGG UUA GGG-3‟
c-Myc 5‟-TGA GGG TGG GGA GGG TGG GGA A-3‟
Bcl-2 5‟-GGG CGC GGG AGG AAG GGG GCG GG-3‟
aRNA has a “r” prefix
bDouble stranded DNA has a “ds” prefix
3.2.2 Time course of thioanisole sulfoxidation
We added 32 µL of 100 µM DNA and 10 µL of 100 µM hemin in DMF to 500
µL of 2X buffer containing 80 mM HEPES-NH4OH (pH 8.0), 40 mM KCl, 0.1% Triton
80
X-100, 2% DMF in a 1.5 mL glass vial. We added ddH2O to make up the volume to 980
µL. We incubated the solution for 5 minutes in room temperature to allow for aptamer-
hemin binding if binding is possible. We added 10 µL of 20 mM thioanisole dissolved in
DMF to the mixture and vortexed the reaction mixture.
Prior to the start of the reaction we removed a 99 µL aliquot for time 0 and treated
it as described later. We initiated the reaction by the addition of 9 µL 100 mM H2O2.
We incubated The 900 µL volume containing 0.2 mM thioanisole, 1 µM hemin in DMF,
3 µM DNA, 1 mM H2O2, and buffer (40 mM HEPES-NH4OH (pH 8.0), 20 mM KCl,
0.05% Triton X-100, 3% DMF) at room temperature.
We removed 95 µL aliquots of the reaction mixture at 0, 15 s, 30 s, 1 min, 2 min,
5 min, and 30 min after initiation of the reaction. We added 5 µL of 1 mM benzophenone
as an internal standard to each aliquot prior to addition of CH2Cl2. We added 200 µL
CH2Cl2 to quench the reaction and to extract the contents of the reaction mixture.
We analyzed the organic layer by gas chromatography on a Hewlett Packard
Model 5890 system equipped with a flame ionization detector. We employed a DB-5MS
column (0.32 mm i.d. x 50 m) for the analysis. We programmed the column temperature
to rise 20°C/min from 80°C to 300°C and to hold at 300°C for 4 min. We quantified the
sulfide and the sulfoxide using standard curves with benzophenone as the internal
standard.
The retention times of the components were as follows: thioanisole, 4.8 min;
thioanisole sulfoxide, 6.8 min; benzophenone, 9.0 min. We established the identity of the
thioanisole sulfoxide peak by elution with commercially available thioanisole sulfoxide
(methyl phenyl sulfoxide) by gas-chromatography.
81
3.2.3 Source of the oxygen in thioanisole sulfoxide
We prepared reaction mixture as described above, in section 3.2.2. However, we
initiated reaction mixtures with PS2.M with either H216
O2 or H218
O2. The SS18 negative
control reaction contained H216
O2.
We took 95 µL aliquots after 2 and 4 hours; we added 5 µL 1 mM benzophenone
as an internal standard. We quenched the reactions with 200 µL CH2Cl2 and analyzed the
organic layer with a Varian 3800 gas chromatograph equipped with a Varian Saturn 2000
ion trap. We determined the percentage of 18
O incorporation by the integration of the
contents in the H218
O2 reaction with a m/z of 142 compared to the m/z of both 140 and
142.
3.2.4 Stereochemistry of thioanisole sulfoxidation
We prepared the reaction mixture as described above, in section 3.2.2 with the
exception that we scaled the reaction mixture up to 2 mL. We quenched the reaction at 4
hours with 4 mL CH2Cl2 and removed the organic layer. We determined the ratio of the
sulfoxide enantiomers by chiral-phase high-pressure liquid chromatography. We dried
down and redissolved the samples in 500 µL hexanes.
We analyzed the samples on an Agilent 1200 series HPLC system with a Chiracel
OD column (0.46 cm i.d. x 25 cm, Daicel Chemical Industries, Ltd.). We monitored the
eluents at 254 nm with a variable wavelength detector. We eluted the column
isocratically at a flow rate of 1 mL/min with 95:5 hexanes:isopropanol for 35 min.
Fruetel et al. previously identified the S- and R- sulfoxide enantiomers [102]. The
retention times of the S and R sulfoxide enatiomer were 21.9 min and 28.8 min
respectively.

82
3.2.5 Para substituted thioanisole sulfoxidation
We used the procedure described above in section 3.2.2. The para-substituted
substrates include 4-chlorothioanisole, 4-nitrothioanisole, 4-methoxythioanisole, and 4-
methylthioanisole. We analyzed Samples extracted with CH2Cl2 by GC/FID as described
above. We used a different column temperature program for the analysis of some para-
substituted thioanisole reactions.
For 4-chlorothioanisole: we programmed the column temperature to rise
20°C/min from 120°C to 300°C and to hold at 300°C for 4 min. For 4-nitrothioanisole
and 4-methylthioanisole: we programmed the column temperature to rise 20°C/min from
100°C to 300°C and to hold at 300°C for 4 min. For 4-methoxythioanisole: we
programmed the column temperature to rise 10°C/min from 100°C to 230°C, then we
ramped up the temperature to 300°C at 70°C/min and held it at 300°C for 4 min.
The retention times of the components for the 4-chlorothioanisole reactions were
as follows: 4-chlorothioanisole, 4.7 min; 4-chlorothioanisole sulfoxide, 6.3 min;
benzophenone, 7.1 min. The retention times of the components for the 4-nitrothioanisole
and 4-methylthioanisole reactions were as follows: 4-methylthioanisole, 4.8 min; 4-
methylthioanisole sulfoxide, 6.8 min; 4-nitrothioanisole, 7.6 min; benzophenone, 8.0
min; 4-nitrothioanisole sulfoxide, 8.8 min. The retention times of the components for the
4-methoxythioanisole reactions were as follows: 4-methoxythioanisole, 7.8 min; 4-
methoxythioanisole sulfoxide, 11.5 min; benzophenone, 11.8 min.
We established the identity of the sulfoxide peaks by the analysis of 15 second
samples with a Varian 3800 gas chromatograph equipped with a Varian Saturn 2000 ion
83
trap. We determined the initial rates of each reaction by the conversion of the sulfide
over the initial 15 seconds.
3.2.6 Hammett analysis of thioanisole sulfoxidation
We obtained the substituent coefficient (ζ and ζ+) values for para-substituted
thioanisole from Issac‟s Physical Organic Chemistry [103]. The plot of log (V) versus ζ
or ζ+ is a linear relationship where the slope of the graph provides the reaction constant ρ.
The V value is the ratio between the initial rate of the production of the p-thioanisole
sulfoxide and the initial rate of the production of the thioanisole sulfoxide under the same
conditions discussed in section 3.2.5. We obtained the values for the different parameters
from fitting the data to the Hammett equation.
3.2.7 Thioanisole sulfoxidation by various DNA and RNA sequences
We followed the procedure described above, in section 3.2.2. Most reactions
contained the same nucleic acid concentration as described above (3 µM). Exceptions
included the Hum4 and rHum4 reaction mixtures, which contained 120 µM DNA or
RNA by the addition of 24 µL of 5 mM DNA or RNA to make up the 1 mL reaction
mixture. We performed The dsDNA and SS18 control reactions with both 3 µM and 120
µM single or double stranded DNA. We took Aliquots of the reaction mixture at 0 min, 2
min and 30 min and treated them as described above.
84
3.2.8 Indole oxidation reactions
Final concentrations of all components in the reaction mixture were: hydrogen
peroxide (1 mM), indole (1 mM), DNA (25 µM) and hemin (10 µM) in the reaction
buffer (40 mM HEPES-NH4OH (pH 8.1), 20 mM KCl, 0.05% Triton X-100, 1% DMF).
At specified times, we added 95 µL of reaction mixture to 5 µL of 1 mM benzophenone
standard and then immediately froze this on dry ice to stop the reaction.
We then thawed samples and ran them on HPLC for analysis. We performed the
analysis with a Zorbax Eclipse 3.0 X 50 mm, 1.8 micron, octadecylsilane column, using
gradients of ddH2O (A) and CH3CN (B). 0-1 min: 85% A; 1-5.33 min: program from
85% to 10% A; 5.33-7 min: program from 10% to 0% A; 7-10 min: hold at 0% A. We
made Traces at 255 nm for peak detection, and recorded online spectra (200 to 800 nm)
using the G1315B DAD (Agilent 1100 series). Characterization of products was done by
HPLC/MS analysis and comparing the A255 traces detected with a G2315C DAD SL
(Agilent 1200 series) with mass peaks detected on a 6210 Time-of-flight LC/MS (Agilent
1200 series).
3.2.9 Indigo cuvette image protocol
We carried out each reaction out on a 500 μL scale. Reactions consisted of indole
(2 mM), DNA (25 μM), and Fe(III) heme (10 μM) in I-oxidation buffer. A we added 5
μL volume of hydrogen peroxide (100 mM) to specific cuvettes for a final hydrogen
peroxide concentration of 1 mM, and not to other cuvettes, and mixed the contents. After
approximately 5 min, the blue color reached saturation; we then set up the cuvettes on a
white light box for photography. We adjusted the brightness and contrast for the images
with Adobe Photoshop CS5.
85
3.2.10 Time course of styrene oxidation
We added 25 µL of 1 mM DNA and 10 µL of 1 mM hemin in DMF to 500 µL of
2X buffer containing 80 mM HEPES-NH4OH (pH 8.0), 40 mM KCl, 0.1% Triton X-
100, 2% DMF in a 1.5 mL glass vial. We added ddH2O to make up the volume to 980
µL. We incubated the solution for 5 minutes at room temperature to allow for aptamer-
hemin binding if binding is possible. We added 10 µL of 1 M styrene in DMF to the
mixture and the reaction mixture was vortexed.
Prior to the start of the reaction we removed a 99 µL aliquot for time 0 and treated
it as described later. We initiated the reaction by the addition of 9 µL 100 mM H2O2.
We incubated the 900 µL volume containing 10 mM styrene, 10 µM hemin in DMF, 25
µM DNA, 1 mM H2O2, and buffer (40 mM HEPES-NH4OH (pH 8.0), 20 mM KCl,
0.05% Triton X-100, 2% DMF) at room temperature.
We removed 95 µL Aliquots of the reaction mixture at 0, 15 s, 1 min, 5 min, and
30 min after initiation of reaction. We added 5 µL of 0.33 mM benzophenone as an
internal standard to each aliquot prior to addition of CH2Cl2. We added 200 µL CH2Cl2
to quench the reaction and to extract the contents of the reaction mixture.
We analyzed the organic layer by gas chromatography on a Hewlett Packard
Model 5890 system equipped with a flame ionization detector. We employed a DB-5MS
column (0.25 mm i.d. x 50 m) for the analysis. We programmed the column temperature
to rise 5°C/min from 80°C to 120°C, increase from 120°C to 300°C at 30°C/min and hold
at 300°C for 4 min. We quantified the epoxide and the aldehyde using standard curves
with benzophenone as the internal standard.

86
The retention times of the components were as follows: styrene, 4.3 min;
phenylacetaldehyde, 6.8 min; styrene oxide, 7.2 min; benzophenone, 13.7 min. We
established the identities of the epoxide and aldehyde peaks by elution with commercially
available phenylacetaldehyde and styrene oxide by gas-chromatography.
3.2.11 Source of the oxygen atom in styrene oxide
We prepared reaction mixture as described above, in section 3.2.10. However, we
initiated the reaction mixtures with PS2.M with either H216
O2 or H218
O2. The SS18
negative control reaction contained H216
O2. We took 95 µL aliquots after 15 and 30
minutes.
We quenched the reactions with 200 µL CH2Cl2 and analyzed the organic layer
with a Varian 3800 gas chromatograph equipped with a Varian Saturn 2000 ion trap. We
employed a DB-5MS column (0.25 mm i.d. x 50 m) for the analysis.
We programmed the column temperature to hold at 50°C for 2 minutes, increase
from 50°C to 130°C at 5°C/min, then increase from 130°C to 280°C at 30°C/min. The
retention times of the components were as follows: styrene, 12.1 min; benzaldehyde, 14.5
min; phenylacetaldehyde, 17.3 min; styrene oxide, 18.1 min.
We established the identities of all peaks by elution with commercially available
styrene, benzaldehyde, phenylacetaldehyde and styrene oxide by gas-chromatography.
We determined the percentage of 18
O incorporation in styrene oxide by the integration of
the contents in the H218
O2 reaction with a m/z of 121 compared to the m/z of 121 and
119.
87
3.3 Results and discussion
3.3.1 Catalyzing the oxidation of thioanisole to thioanisole sulfoxide
Having shown that PS2.M was capable of catalyzing a single electron transfer,
we were interested in investigating if PS2.M-heme was capable of any of the other
known activities of heme proteins, such as catalyzing the mechanistically more complex
2-electron oxidations. First, we chose to test if PS2.M-heme could oxidize thioanisole, a
widely used test substrate for oxygen transfer reactions [55, 102, 104-109].
PS2.M-heme was activated with 1 mM H2O2, under solution conditions for
PS2.M-heme‟s peroxidase activity [62]. Analysis over a 30 minute period, at 21ºC,
showed the production of the thioanisole sulfoxide product in the PS2.M-heme solutions
but not in the control solutions containing Fe(III) heme and the non-G-quadruplex-
forming oligonucleotide, SS18. Figure 3.2 plots the time courses for two sets of
experiments.
The SS18/Fe(III) heme solution does not generate any detectable amount of the
product. Whereas the calculated turnover rate of 3.5 s-1
for PS2.M-heme complex (initial
rate of 3.5 μM•s-1
catalyzed by 1.0 μM PS2.M-heme) compares favourably with those of
classical peroxidases: myeloperoxidase, 4 s-1
; lactoperoxidase, 0.1 s-1
; HRP, 0.05 s-1
[107,
109, 110]. As a result, we have demonstrated that PS2.M-heme is capable of catalyzing
the 2-electron oxidation of thioanisole to thioanisole sulfoxide.
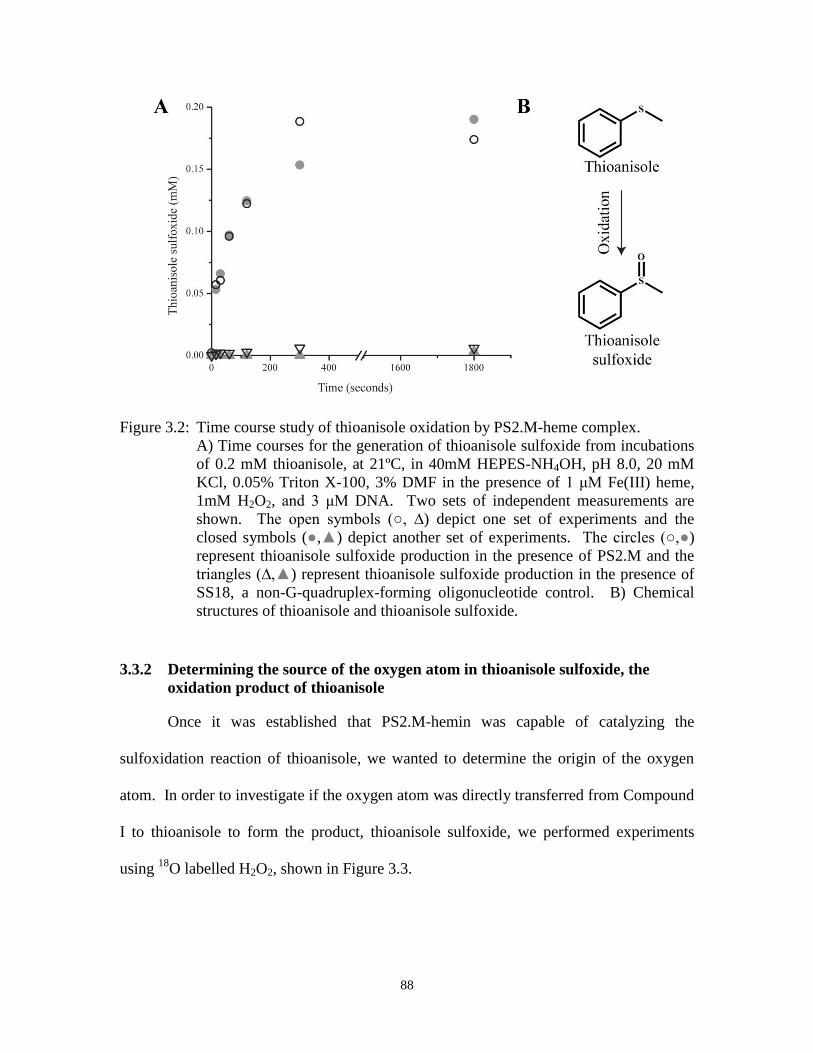
88
Figure 3.2: Time course study of thioanisole oxidation by PS2.M-heme complex.
A) Time courses for the generation of thioanisole sulfoxide from incubations
of 0.2 mM thioanisole, at 21ºC, in 40mM HEPES-NH4OH, pH 8.0, 20 mM
KCl, 0.05% Triton X-100, 3% DMF in the presence of 1 μM Fe(III) heme,
1mM H2O2, and 3 μM DNA. Two sets of independent measurements are
shown. The open symbols (○, ∆) depict one set of experiments and the
closed symbols (●,▲) depict another set of experiments. The circles (○,●)
represent thioanisole sulfoxide production in the presence of PS2.M and the
triangles (∆,▲) represent thioanisole sulfoxide production in the presence of
SS18, a non-G-quadruplex-forming oligonucleotide control. B) Chemical
structures of thioanisole and thioanisole sulfoxide.
3.3.2 Determining the source of the oxygen atom in thioanisole sulfoxide, the
oxidation product of thioanisole
Once it was established that PS2.M-hemin was capable of catalyzing the
sulfoxidation reaction of thioanisole, we wanted to determine the origin of the oxygen
atom. In order to investigate if the oxygen atom was directly transferred from Compound
I to thioanisole to form the product, thioanisole sulfoxide, we performed experiments
using 18
O labelled H2O2, shown in Figure 3.3.
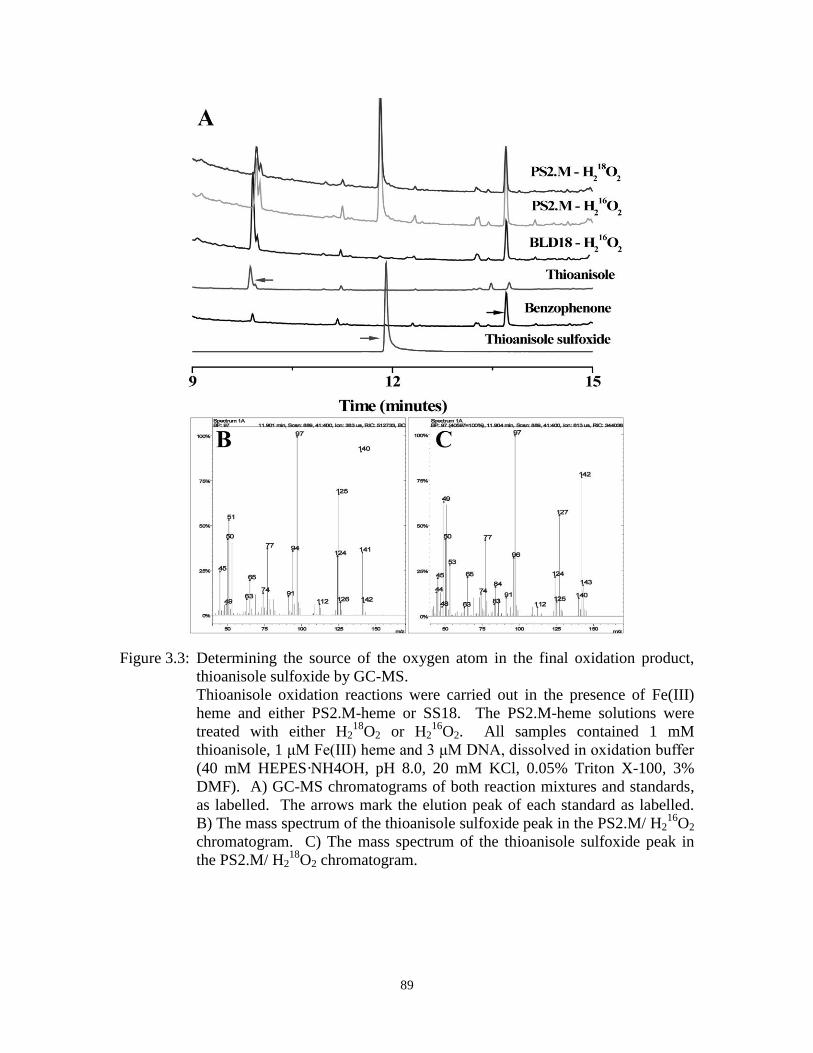
89
Figure 3.3: Determining the source of the oxygen atom in the final oxidation product,
thioanisole sulfoxide by GC-MS.
Thioanisole oxidation reactions were carried out in the presence of Fe(III)
heme and either PS2.M-heme or SS18. The PS2.M-heme solutions were
treated with either H218
O2 or H216
O2. All samples contained 1 mM
thioanisole, 1 μM Fe(III) heme and 3 μM DNA, dissolved in oxidation buffer
(40 mM HEPES·NH4OH, pH 8.0, 20 mM KCl, 0.05% Triton X-100, 3%
DMF). A) GC-MS chromatograms of both reaction mixtures and standards,
as labelled. The arrows mark the elution peak of each standard as labelled.
B) The mass spectrum of the thioanisole sulfoxide peak in the PS2.M/ H216
O2
chromatogram. C) The mass spectrum of the thioanisole sulfoxide peak in
the PS2.M/ H218
O2 chromatogram.
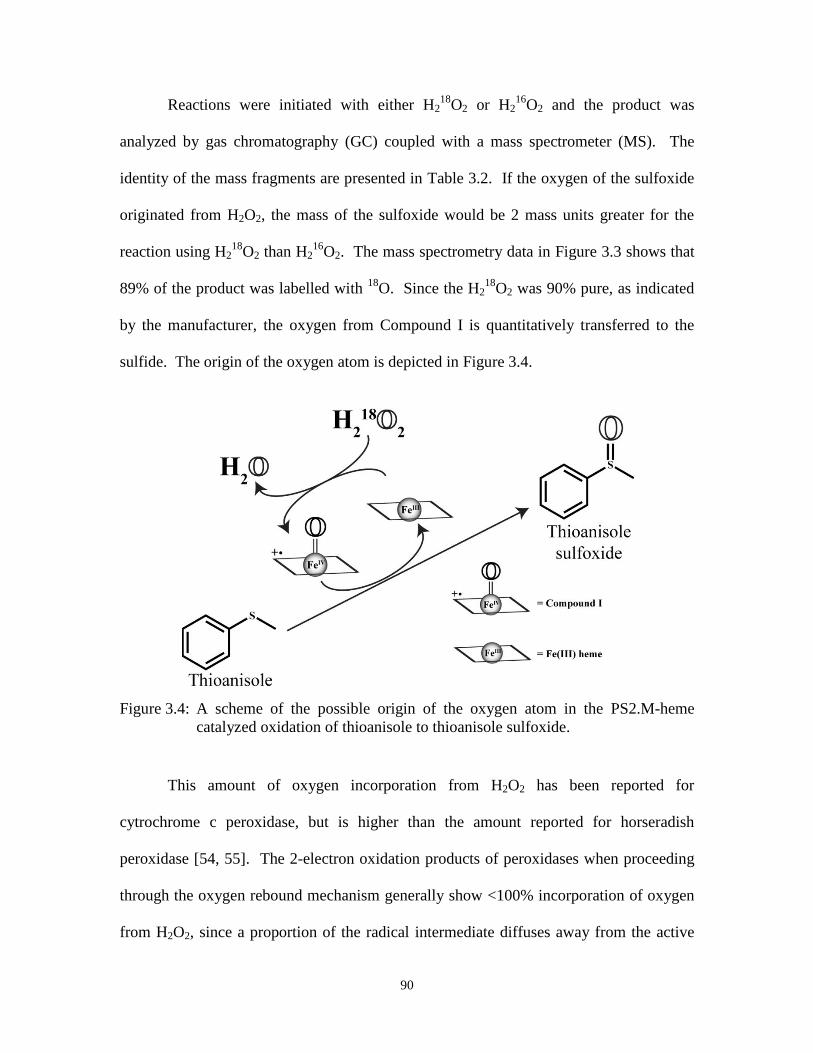
90
Reactions were initiated with either H218
O2 or H216
O2 and the product was
analyzed by gas chromatography (GC) coupled with a mass spectrometer (MS). The
identity of the mass fragments are presented in Table 3.2. If the oxygen of the sulfoxide
originated from H2O2, the mass of the sulfoxide would be 2 mass units greater for the
reaction using H218
O2 than H216
O2. The mass spectrometry data in Figure 3.3 shows that
89% of the product was labelled with 18
O. Since the H218
O2 was 90% pure, as indicated
by the manufacturer, the oxygen from Compound I is quantitatively transferred to the
sulfide. The origin of the oxygen atom is depicted in Figure 3.4.
Figure 3.4: A scheme of the possible origin of the oxygen atom in the PS2.M-heme
catalyzed oxidation of thioanisole to thioanisole sulfoxide.
This amount of oxygen incorporation from H2O2 has been reported for
cytrochrome c peroxidase, but is higher than the amount reported for horseradish
peroxidase [54, 55]. The 2-electron oxidation products of peroxidases when proceeding
through the oxygen rebound mechanism generally show <100% incorporation of oxygen
from H2O2, since a proportion of the radical intermediate diffuses away from the active
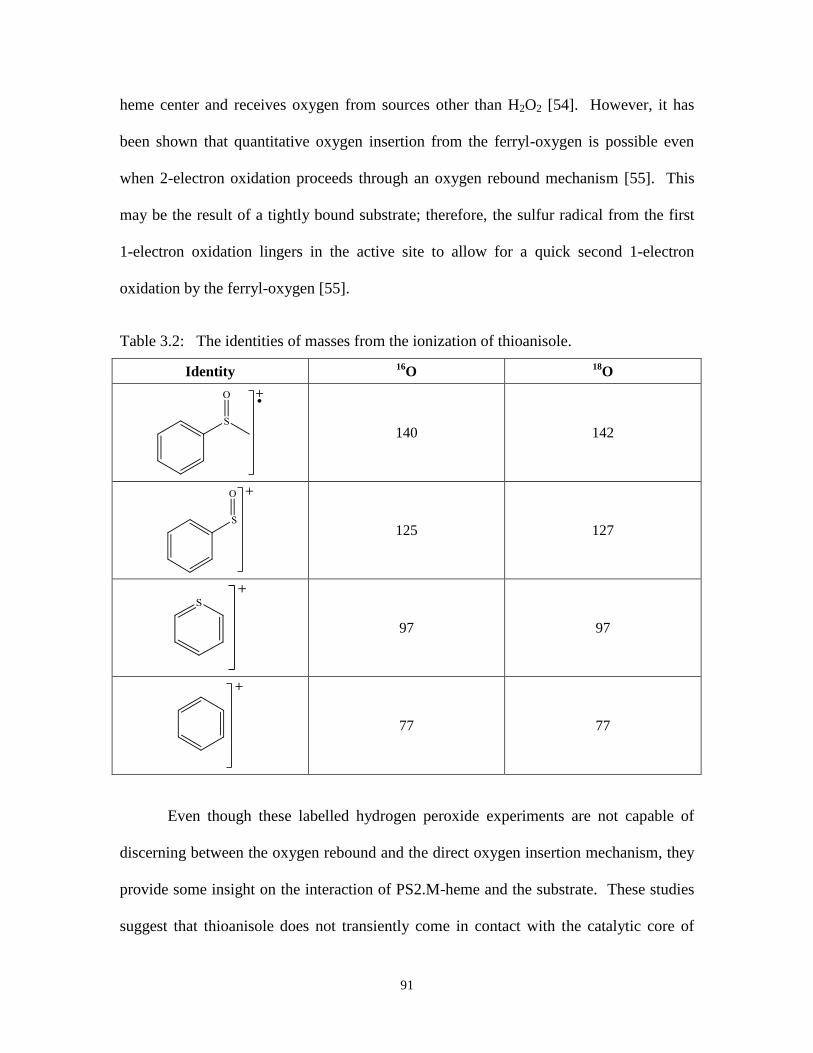
91
heme center and receives oxygen from sources other than H2O2 [54]. However, it has
been shown that quantitative oxygen insertion from the ferryl-oxygen is possible even
when 2-electron oxidation proceeds through an oxygen rebound mechanism [55]. This
may be the result of a tightly bound substrate; therefore, the sulfur radical from the first
1-electron oxidation lingers in the active site to allow for a quick second 1-electron
oxidation by the ferryl-oxygen [55].
Table 3.2: The identities of masses from the ionization of thioanisole.
Identity 16
O 18
O
140 142
125 127
97 97
77 77
Even though these labelled hydrogen peroxide experiments are not capable of
discerning between the oxygen rebound and the direct oxygen insertion mechanism, they
provide some insight on the interaction of PS2.M-heme and the substrate. These studies
suggest that thioanisole does not transiently come in contact with the catalytic core of

92
PS2.M-heme, but must be positioned near the ferryl-oxygen for enough time for
quantitative oxygen atom transfer to take place.
3.3.3 Probing the active site of the PS2.M-heme complex by investigating the
enantioselectivity of the enzyme
In order to investigate the possible structure of the PS2.M-hemin active site, we
examined the enantioselectivity of PS2.M-hemin complex. Most native peroxidases
when tasked with the 2-electron oxidation of thioanisole demonstrate a preference for the
production of a particular enantiomer. Lactoperoxidase, chloroperoxidase and
myeloperoxidase favour the formation of the (R)-sulfoxide, while horseradish peroxidase
and Coprinus cinereus peroxidase favour the (S)-sulfoxide [111].
The absolute configuration of the sulfoxide product of the PS2.M-heme catalyzed
thioanisole sulfoxidation reaction was determined by high performance liquid
chromatography (HPLC) using a chiral column following a protocol from Ortiz de
Montellano‟s research [102]. From the HPLC data in Figure 3.5, we compared the
proportion of thioanisole sulfoxide enantiomers produced from two separate PS2.M-heme
reaction mixtures with commercially obtained thioanisole sulfoxide. Both reaction
mixtures produced a 50:50 mixture of thioanisole sulfoxide enantiomers, matching the
distribution in the commercially obtained thioanisole sulfoxide.

93
Figure 3.5: Enantioselectivity of the PS2.M-heme complex was determined by chiral
HPLC of the thioanisole oxidation product.
A) HPLC chromatograms of thioanisole oxidation reactions and standards.
All reaction mixtures contained 1 mM H2O2, 1 mM thioanisole, 1 μM Fe(III)
heme and 3 μM DNA (PS2.M) dissolved in oxidation buffer (40 mM
HEPES-NH4OH, pH 8.0, 20 mM KCl, 0.05% Triton X-100, 3% DMF). The
standards were diluted in DMF and dissolved in hexane. The arrows mark
the elution peaks of thioanisole and DMF. The trace of the thioanisole
sulfoxide standard are marked for the elution peaks of both the (S)- and (R)-
enantiomers. B) Chemical structures of the enantiomers of thioanisole
sulfoxide.
Since PS2.M-hemin catalyzed the formation of a racemic mixture of thioanisole
sulfoxide, the active site of PS2.M-hemin is most likely in an “open” conformation or the
binding site for thianosole above the heme is large enough to accommodate both binding
modes of thianosole. This is possible if the heme cofactor stacks on the ends of parallel
G-quadruplexes; therefore, the active site does not contain residues that restrict the entry
of thioanisole. Klibanov and colleagues have reported that PS2.M-heme lacks
stereospecificity in its peroxidase activity; it is interesting to note that a lack of
stereoselectivity is also a feature of its catalysis of the more complex oxygen transfer

94
reaction [69]. In the case of protein peroxidases, cytochrome c peroxidase gave similar
results to PS2.M-heme in the amount of 18
O incorporation in the product from H218
O2 and
the ratio of enantiomers of the final products [55].
3.3.4 Hammett analysis of thioanisole sulfoxidation as catalyzed by PS2.M-heme
A Hammett analysis was conducted to further elucidate the mechanism of
thioanisole sulfoxidation as catalyzed by PS2.M-heme. In a Hammett analysis, one
investigates the degree of negative or positive charge build-up during the formation of the
rate limiting transition state or intermediate species. This is accomplished by measuring
the initial rates for the sulfoxidation of para-substituted thioanisole with electron donating
or electron withdrawing groups relative to the sulfoxidation of thioansiole.
Subsequently, these figures are plotted against the substituent constants for the
para-substituents, which are values from empirical measurements of the degree of
electron donating or withdrawing ability of each functional group. The slope (ρ) of the
correlation between log[(initial rate of p-thioanisole)/(initial rate of thioanisole)] values
and the respective substituent constants (ζ or ζ+) gives insight into the charge build-up
during the transition state [103]. If ρ is a negative value, it means that the electron-
donating substituents increase the rate of the reaction by stabilizing a positively charged
transition state. Whereas a positive ρ value indicates that electron-withdrawing
substituents increase the rate of the reaction by stabilizing a negatively charged transition
state.
In addition, the comparison between ζ and ζ+ values also gives considerable
insight into the mechanism of the reaction. The electron donating or withdrawing nature
95
of a substituent is due to a combination of effects, the inductive and resonance effects as
seen in panel C of Figure 3.7. The ζ value correlates more favourably to reactions where
the charge build-up is at a location where the substituent does not directly withdraw or
donate electrons through resonance. The ζ+ value puts greater weight to the resonance
effect and correlates more favourably to reactions where a substituent directly withdraws
or donates electrons to the reaction center through the resonance effect.
In the case of thioanisole, there are two main mechanisms that have been
proposed by the peroxidase community, the oxygen rebound mechanism and direct
oxygen insertion mechanism [28]. In Figure 3.6, one of the differences between the
oxygen rebound mechanism and the direct oxygen insertion mechanism can be seen by
comparing the transition state and the intermediate species of the two mechanisms. The
direct oxygen insertion mechanism involves a transition state where there is a positive
charge build-up at the sulfur atom. In comparison, if thioanisole sulfoxidation proceeds
through the oxygen rebound mechanism, the sulfur goes through a sulfenium radical
cation intermediate with a permanent positive charge on the sulfur atom. This permanent
charge can be directly affected by a para-substituent on thioanisole through the resonance
effect; therefore, the oxygen rebound mechanism should correlate more favourably with
ζ+ values than ζ values.

96
Figure 3.6: The transition state and intermediate of two possible thioanisole sulfoxidation
routes.
The ρ value using ζ is -0.96±0.12 and gives a good correlation (R2 = 0.96), while
ζ+ plot gives an equally good correlation (R
2 = 0.97) with a ρ value of -0.7±0.07 as seen
in panel A and B of Figure 3.7. These values are consistent with a build-up of positive
charge in the transition state or in the intermediate species. Also shown in panel B of
Figure 3.7 is a fit that excludes the most electron-donating substituent for the ζ+ plot (ρ =
-0.81±0.05; R2 = 0.99). The correlations between both the ζ
+ and ζ substituent constants
with the initial rates of the para-substituted substrates are not significantly different. The
omission of the most electron-donating substituent improves the fit for the ζ+ plot.
However, there is no significant difference between the correlations of all the fits;
therefore, the Hammett studies that were performed were not sufficient to discern
between the oxygen rebound and the direct oxygen insertion mechanism.

97
Figure 3.7: Hammett analysis of the PS2.M-heme catalyzed oxygen transfer reaction of
thioanisole substrates.
Hammett plots for oxidation rates of various para-substituted thioanisoles.
Log V (where V = the ratio obtained from the initial rate of para-substituted
thioanisole oxidation over the initial rate of thioanisole oxidation) is plotted
against the substituent constants ζ (A) and ζ+ (B). The data shown are the
average of duplicate determinations, and the errors shown are the N - 1
standard deviations rather than the differences from the average. The
uninterrupted line in either plot shows the best fit to all five data points. The
dashed line in the ζ+ plot (B) shows the best fit for four data points, excluding
that for p-methoxythioanisole. C) Illustrations of p-methyl anisole and the
two effects that affect the stabilization of transition states and intermediates.
The lack of additional points that correspond to highly electron-donating and
highly electron-withdrawing substituents may have made distinguishing between the two
above mechanisms difficult. This is particularly true for substitutents that contain a lone
pair of electrons that can directly contribute to the stabilization of the sulfenium cation
through resonance.
98
In panel A of Figure 3.7, the methyl substituent point is above the fit and other
stronger electron-donating substituents may continue this trend. When points for strong
electron-donating groups are above the fit for ζ values, this is indicative of a possible
better fit with ζ+ values. However, we were unable to test the effects of stronger
electron-donating substituents because they tend to contain heteroatoms that can be
oxidized by PS2.M-heme. Another pitfall of substituents that increase the rate of
sulfoxidation, is the difficulty in measuring the initial rates of the reaction because the
reaction takes place too quickly to be measured by our current extraction method. Hence,
our use of Hammett analysis to discern between the oxygen rebound mechanism and the
direct oxygen insertion mechanism was a worthy venture that could have used some
refinement.

99
3.3.5 Investigating the general ability of G-quadruplex-heme complexes in
catalyzing the sulfoxidation of thioanisole
Finally, the ability to catalyze the sulfoxidation of thioanisole was examined for a
variety of G-quadruplex and non-G-quadruplex-forming oligonucleotides. Several G-
quadruplexes are derived from biological sequences that represent parts of promoter
regions and telomeric ends [112]. It has been previously reported that many proposed
biologically relevant G-quadruplexes are capable of performing peroxidase function
when bound to heme [77, 79].
The ability of G-quadruplexes to perform the function of heme protein
apoenzymes, led us to evaluate if the G-quadruplexes formed by telomeric ends and
oncogene promoters could catalyze the 2-electron oxidation of thioanisole. All G-
quadruplexes tested were capable of oxidizing the sulfur substrate to the sulfoxide
product, as seen in Figure 3.8. The comparable peroxygenation activity of many G-
quadruplexes from biologically relevant sequences to PS2.M and CatG4 demonstrates an
underlying function of G-quadruplexes to catalyze oxidation reactions. These results
suggest that when bound to heme, G-quadruplexes in vivo may cause oxidative damage to
surrounding DNA by 1- or 2-electron oxidations. Furthermore, the RNA version of
PS2.M, rPS2.M, also demonstrated peroxygenase activity. This is not surprising since
rPS2.M is also able to catalyze the 1-electron oxidation of ABTS [66]. Nonetheless, the
ability to catalyze 2-electron oxidation reactions adds to the growing list of catalysis
performed by RNA.

100
Figure 3.8: The sulfoxidation of thioanisole catalyzed by G-quadruplex-heme complexes.
The histogram shows the conversion (in %) of thioanisole to thioanisole
sulfoxide after 2 min of incubation in the presence of different DNAand RNA
oligonucleotides, as well as a double-stranded DNA control (all sequences
shown in Table 3.1). CatG4 has a slightly modified sequence but the same
heme-binding properties as PS2.M [71]. Hum4 represents a four-repeat
human telomeric DNA sequence, rHum4 represents an RNA version of
Hum4, and c-Myc and Bcl-2 represent single-stranded G-rich DNAs from the
respective oncogene promoters [112]. The reactions contain 0.2 mM
thioanisole, at 21ºC, in 40mM HEPES-NH4OH, pH 8.0, 20 mM KCl, 0.05%
Triton X-100, 3% DMF in the presence of 1 μM Fe(III) heme, 1mM H2O2,
and 3 μM DNA (with the exception that the Hum4 and rHum4 solutions
contained 120 μM DNA/RNA to ensure >90% binding of the heme to the
DNA/RNA). The SS18 and dsDNA controls were tried with both 3 and 120
μM DNA, and no difference was found in the outcome.
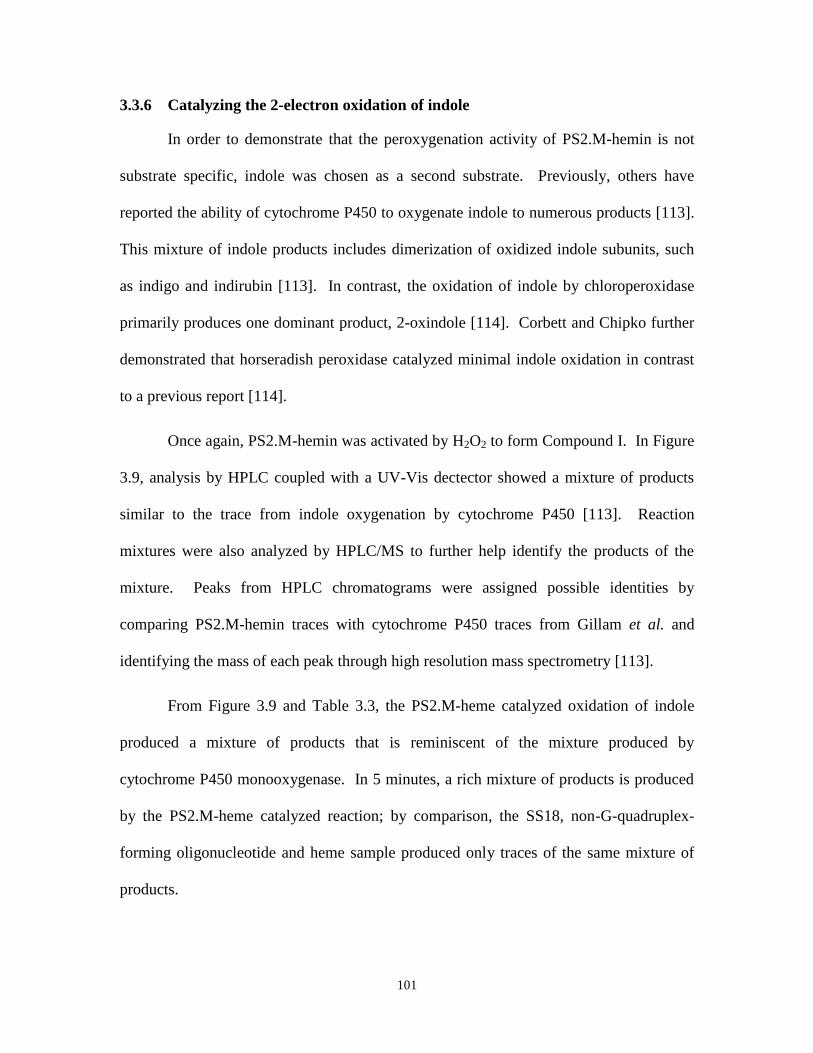
101
3.3.6 Catalyzing the 2-electron oxidation of indole
In order to demonstrate that the peroxygenation activity of PS2.M-hemin is not
substrate specific, indole was chosen as a second substrate. Previously, others have
reported the ability of cytochrome P450 to oxygenate indole to numerous products [113].
This mixture of indole products includes dimerization of oxidized indole subunits, such
as indigo and indirubin [113]. In contrast, the oxidation of indole by chloroperoxidase
primarily produces one dominant product, 2-oxindole [114]. Corbett and Chipko further
demonstrated that horseradish peroxidase catalyzed minimal indole oxidation in contrast
to a previous report [114].
Once again, PS2.M-hemin was activated by H2O2 to form Compound I. In Figure
3.9, analysis by HPLC coupled with a UV-Vis dectector showed a mixture of products
similar to the trace from indole oxygenation by cytochrome P450 [113]. Reaction
mixtures were also analyzed by HPLC/MS to further help identify the products of the
mixture. Peaks from HPLC chromatograms were assigned possible identities by
comparing PS2.M-hemin traces with cytochrome P450 traces from Gillam et al. and
identifying the mass of each peak through high resolution mass spectrometry [113].
From Figure 3.9 and Table 3.3, the PS2.M-heme catalyzed oxidation of indole
produced a mixture of products that is reminiscent of the mixture produced by
cytochrome P450 monooxygenase. In 5 minutes, a rich mixture of products is produced
by the PS2.M-heme catalyzed reaction; by comparison, the SS18, non-G-quadruplex-
forming oligonucleotide and heme sample produced only traces of the same mixture of
products.
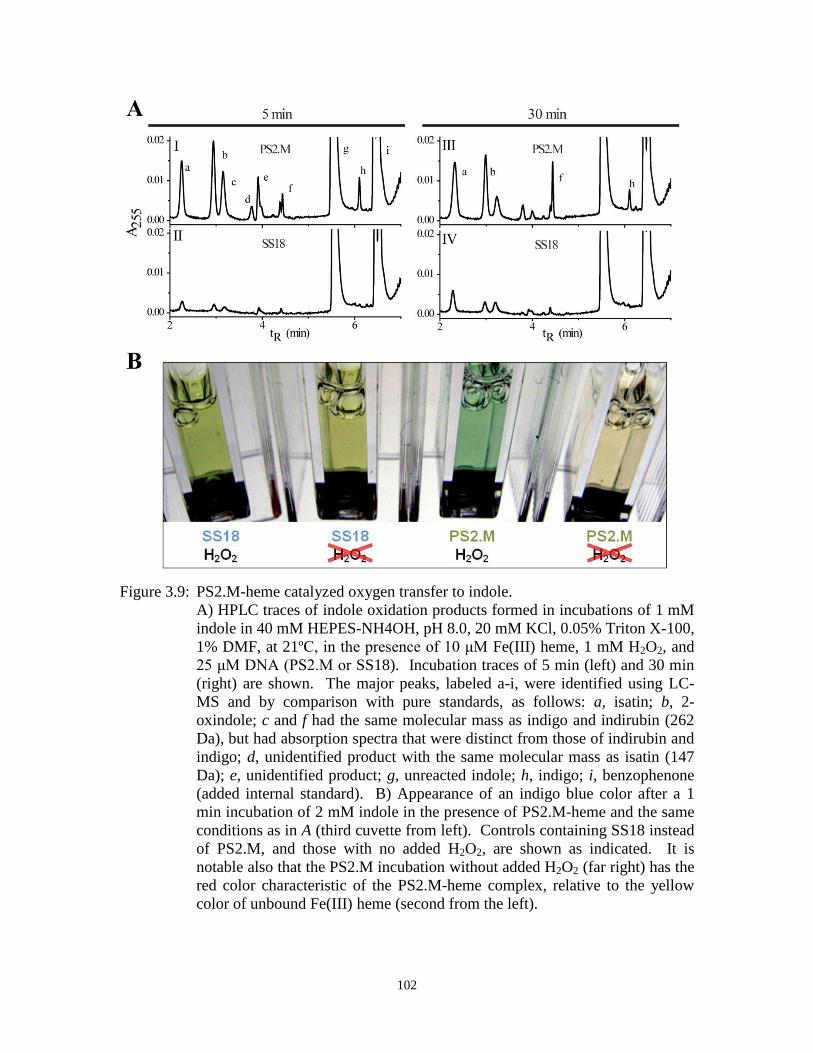
102
Figure 3.9: PS2.M-heme catalyzed oxygen transfer to indole.
A) HPLC traces of indole oxidation products formed in incubations of 1 mM
indole in 40 mM HEPES-NH4OH, pH 8.0, 20 mM KCl, 0.05% Triton X-100,
1% DMF, at 21ºC, in the presence of 10 μM Fe(III) heme, 1 mM H2O2, and
25 μM DNA (PS2.M or SS18). Incubation traces of 5 min (left) and 30 min
(right) are shown. The major peaks, labeled a-i, were identified using LC-
MS and by comparison with pure standards, as follows: a, isatin; b, 2-
oxindole; c and f had the same molecular mass as indigo and indirubin (262
Da), but had absorption spectra that were distinct from those of indirubin and
indigo; d, unidentified product with the same molecular mass as isatin (147
Da); e, unidentified product; g, unreacted indole; h, indigo; i, benzophenone
(added internal standard). B) Appearance of an indigo blue color after a 1
min incubation of 2 mM indole in the presence of PS2.M-heme and the same
conditions as in A (third cuvette from left). Controls containing SS18 instead
of PS2.M, and those with no added H2O2, are shown as indicated. It is
notable also that the PS2.M incubation without added H2O2 (far right) has the
red color characteristic of the PS2.M-heme complex, relative to the yellow
color of unbound Fe(III) heme (second from the left).

103
The major products identified (Table 3.3) include isatin (a in Figure 3.9), 2-
oxindole (b), indigo (g), and indigoid products (c and f, each with the mass of indigo and
indirubin, 262Da), whose absorption spectra differ from those of indirubin and indigo.
Table 3.3: Table of the identities and the masses of peaks labelled in Figure 3.9.
Peak Retention time
(mins)
Mass (g/mol) Known identity
a 2.298 147.04 Isatin
b 2.987 133.06 Oxindole
c 3.220 262.08 Isomer of indigo
d 3.805 147.04 Isomer of isatin
e 4.010 unknown
f 4.460 262.08 Isomer of indigo
g 5.560 117.06 Indole
h 6.152 262.08 Indigo
i 6.512 182.08 Benzophenone (internal standard)
These results demonstrate that PS2.M-hemin is capable of catalyzing the
peroxygenation of indole to give rise to similar products as the monooxygenation of
indole by cytochrome P450. This may be attributed to the “open” nature of the PS2.M-
hemin active site, which also caused the formation of racemic products for the
sulfoxidation of thioansiole.
In addition to the formation of a mixture of products, it is also interesting that the
relative yield of products changes over time. After 30 minutes of incubation, the relative
yield of the products at 30 minutes differs from the relative yield at 5 minutes, this may
be due to the air oxidation of the initial products.
Another notable result, in earlier time points, oxindole and isatin peaks are
roughly 10 times greater for PS2.M-heme catalyzed mixtures than reaction mixtures

104
containing heme and SS18. However, this ratio decreases over time, which may indicate
that the amount of H2O2 in the PS2.M mixture may have depleted. Since PS2.M binds
heme to allow for Compound I formation, the DNA apoenzyme is also exposed to the
possibility of oxidative damage which results in a decrease of PS2.M-hemin complex.
The heme (with SS18 in the solution) catalyzed oxidation or the direct H2O2 oxidation of
indole are slower reactions than the PS2.M-heme catalyzed reaction. As the H2O2
concentration decreases and while the PS2.M-heme enzyme is destroyed by oxidative
damage, the accelerated rate of indole oxidation by PS2.M-heme is greatly reduced or
eliminated altogether. A combination of these factors and others may be responsible for
the decrease in the rate of products produced overtime by PS2.M-heme catalyzed
reaction.
Despite the smaller difference for indole oxidation between SS18 and PS2.M
containing samples when compared to the sulfoxidation of thioanisole, the visual
difference of the reaction mixtures between the catalyzed and uncatalyzed reactions are
quite striking. Figure 3.9B shows that within 1 min of the incubation of indole with
PS2.M-heme and H2O2, the reaction mixture develops a blue color that we attribute to the
production of indigo. Both SS18 samples, containing H2O2 or not containing H2O2, do
not generate the same intense blue colour as the PS2.M-heme sample with H2O2. The
known products of indole oxidation are illustrated in Figure 3.10. In addition the PS2.M-
heme sample without H2O2 is red, as compared to the yellowish hue of the SS18 samples,
presumably because the redish hue is indicative of PS2.M binding to heme and forming a
complex.
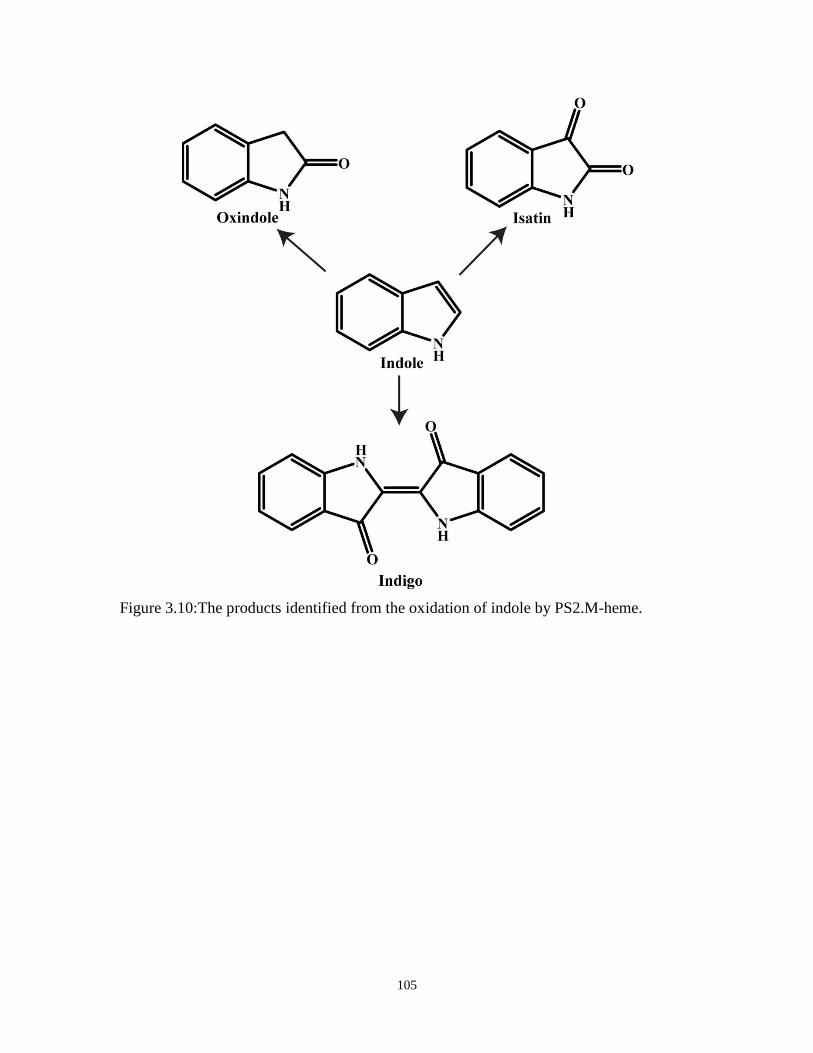
105
Figure 3.10:The products identified from the oxidation of indole by PS2.M-heme.

106
3.3.7 Investigating the general ability of G-quadruplex-heme complexes in
catalyzing the oxidation of indole
As with the sulfoxidation of thioanisole, the ability to catalyze the oxidation of
indole was examined for a variety of G-quadruplex and non-G-quadruplex-forming
sequences. Several G-quadruplexes are derived from biological sequences that are part
of promoter regions and telomeric ends [112]. Many of these proposed biologically
relevant G-quadruplexes have been shown to be capable of catalyzing the 1-electron
oxidation of ABTS and we have reported their ability to catalyze the 2-electron oxidation
of thioanisole [77, 79]. The ability of G-quadruplexes to perform the function of heme
protein apoenzymes, led us to evaluate if the G-quadruplexes formed by telomeric ends
and oncogene promoters could catalyze the 2-electron oxidation of indole.
All G-quadruplexes tested were capable of oxidizing indole to a mixture of
products. The primary products produced were 2-oxindole and isatin, their production is
displayed graphically in Figure 3.11. The comparable peroxygenation activity of many
G-quadruplexes from biologically relevant sequences to PS2.M and CatG4 further
cements the underlying ability of G-quadruplexes to bind heme and catalyze 2-electron
oxidations. Since many of these telomeric and promoter sequences form G-quadruplexes
in vitro, these results further suggest that there may be a possible oxidative role for G-
quadruplexes in vivo. Furthermore, the RNA version of PS2.M and Hum4, rPS2.M and
rHum4, also demonstrated the ability to oxidize indole, as they did with thioanisole.

107
Figure 3.11:The oxidation of indole catalyzed by G-quadruplex-heme complexes.
A histogram showing yields of the two major indole oxidation products (2-
oxindole and isatin) in the presence of 1 mM H2O2, 1 mM indole, 10 μM
Fe(III) heme and 25 μM DNA (black) /RNA (red), dissolved in I-oxidation
buffer (40 mM HEPES·NH4OH, pH 8.0, 20 mM KCl, 0.05% Triton X-100,
and 1% DMF) at 21°C. The data represent 5-minute reactions in all cases;
the yields of isatin and 2-oxindole are both normalized relative to the yields
from PS2.M-heme. The isatin data is depicted by the black bars and the 2-
oxindole data is depicted by the white bars with black outline. The r prefix
denotes RNA, while the other names are of DNA oligonucleotides. The
sequences of all oligonucleotides are in Table 3.1.

108
3.3.8 Catalyzing the 2-electron oxidation of styrene
An epoxidation reaction is a relatively challenging oxidation reaction due to the
relatively higher redox potential of alkenes compared to heteroatoms [115]. A classical
peroxidase, such as horseradish peroxidase, poorly catalyzes the epoxidation of styrene
[55, 56]. P450 monooxygenases and nonclassical peroxidases (such as chloroperoxidase)
show more efficient catalysis of styrene epoxidation than classical peroxidases
(chloroperoxidase has kcat values of 0.1-4.0 s-1
and the P450 enzymes show comparable
values) [32]. The oxidation of styrene produces the expected styrene oxide product,
phenylacetaldehyde (formed by a hydrogen rearrangement); furthermore, some enzymes
generate benzaldehyde using an unknown mechanism [105].
Figure 3.12A shows that PS2.M-heme catalyzes the formation of two main
products which, upon mass identification by mass spectrometry and comparison with
standards, can be identified as styrene oxide and phenylacetaldehyde. A very small
amount of benzaldehyde (relative to yields of styrene oxide and phenylacetaldehyde)
could also be detected by GC-MS in the 30 minute PS2.M-heme incubation.
The measured initial rate for phenylacetaldehyde production was ~1.7 μM•s-1
and
for styrene oxide production was ~0.4 μM•s-1
(per 10 µM of enzyme). As with
thioanisole sulfoxidation, PS2.M-heme appears to be a superior catalyst for styrene
oxidation relative to the classical peroxidases [55, 56]. In addition, the reaction of
PS2.M-heme with styrene in this system proceeds only for a short time (∼1 min), owing
to the likely destruction of the heme cofactor. Similar observations have also been made
with a number of heme enzymes [116]. The radical intermediate that is generated for
epoxide and aldehyde formation is attached to the ferryl oxygen of Compound I and will

109
form a covalent bond with the nitrogens in the pyrrole rings, resulting in the inactivation
of the enzyme.
Figure 3.12:PS2.M-heme catalyzed 2-electron oxidation of styrene.
A) Chromatographs from GC-MS show the production of
phenylacetaldehyde (a) and styrene oxide (b) from incubations of PS2.M-
heme with styrene and hydrogen peroxide. There is an absence of formation
of the same products, under the same conditions, from a solution in which the
DNA oligomer SS18 substitutes for PS2.M. A trace of benzaldehyde (c) can
be detected in the 30 min incubation of PS2.M-heme with styrene and
hydrogen peroxide. B) Chromatographs of the pure compounds
phenylacetaldehyde (solid grey line), styrene oxide (dotted grey line),
benzaldehyde (dashed grey line), and dicholoromethane are shown below the
products from the PS2.M-heme incubations. It should be noted that the
styrene oxide standard contains a small amount of phenylacetaldehyde as a
contaminant. C) Chemical structures of styrene, phenylacetaldehyde (a),
styrene oxide (b), and benzaldehyde (c).

110
3.3.9 Determining the source of the oxygen atom in styrene oxide, a product of
styrene oxidation
When styrene is oxidized to styrene oxide by a PS2.M-heme catalyzed reaction,
does the oxygen atom within styrene oxide originate from the ferryl oxygen, which is
generated by H2O2? In order to investigate this question we performed reactions using
18O labelled H2
18O2. If the oxygen atom in styrene oxide originated from hydrogen
peroxide, the mass of the molecule would be 2 mass units greater than a reaction using
H216
O2.
Among heme enzymes, chloroperoxidase incorporates 18
O from H218
O2
quantitatively into styrene oxide [116]. Only 79% of the styrene oxide generated by
modified horseradish peroxidase originates from H2O2; the rest has been proposed to
originate from dioxygen [56]. In contrast, wild-type horseradish peroxidase is able to use
H2O2 and dioxygen together to co-oxidize phenols and styrene (here, the oxygen of
styrene oxide is derived purely from the dioxygen) [117].
The data shown in Figure 3.13 indicate that 73% of the oxygen of styrene oxide
(corrected for the 18
O purity of the H218
O2, as described by the manufacturer) catalyzed
by PS2.M-heme is derived from H218
O2. The identity of the major mass peaks are shown
in Table 3.4. Thus, as observed with the thioanisole substrate, oxygen transfer to styrene
substrate proceeds primarily from the activated ferryl species within PS2.M·heme. In
addition to the thioanisole 18
O data, the high incorporation of the ferryl oxygen into 2-
electron oxidation products suggests that that the interaction between the enzyme and the
substrate is not simply collisional, but the substrate is held in position close to the ferryl
oxygen for oxygen transfer to take place.
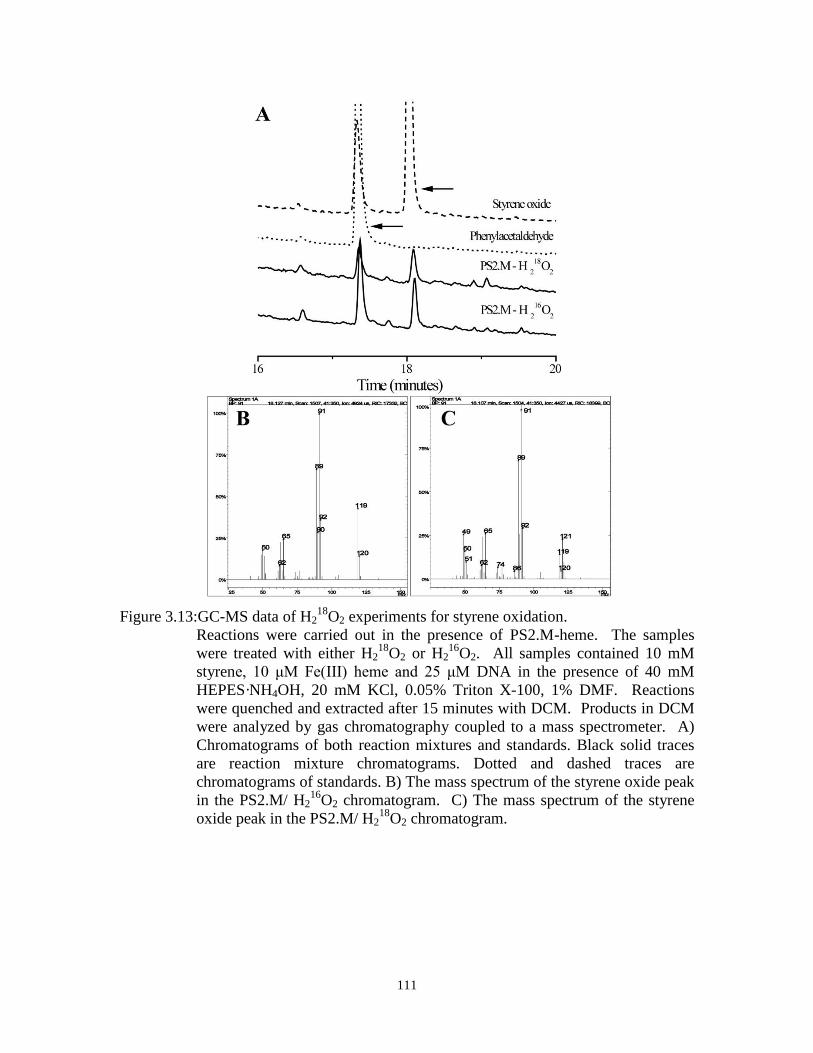
111
Figure 3.13:GC-MS data of H218
O2 experiments for styrene oxidation.
Reactions were carried out in the presence of PS2.M-heme. The samples
were treated with either H218
O2 or H216
O2. All samples contained 10 mM
styrene, 10 μM Fe(III) heme and 25 μM DNA in the presence of 40 mM
HEPES·NH4OH, 20 mM KCl, 0.05% Triton X-100, 1% DMF. Reactions
were quenched and extracted after 15 minutes with DCM. Products in DCM
were analyzed by gas chromatography coupled to a mass spectrometer. A)
Chromatograms of both reaction mixtures and standards. Black solid traces
are reaction mixture chromatograms. Dotted and dashed traces are
chromatograms of standards. B) The mass spectrum of the styrene oxide peak
in the PS2.M/ H216
O2 chromatogram. C) The mass spectrum of the styrene
oxide peak in the PS2.M/ H218
O2 chromatogram.
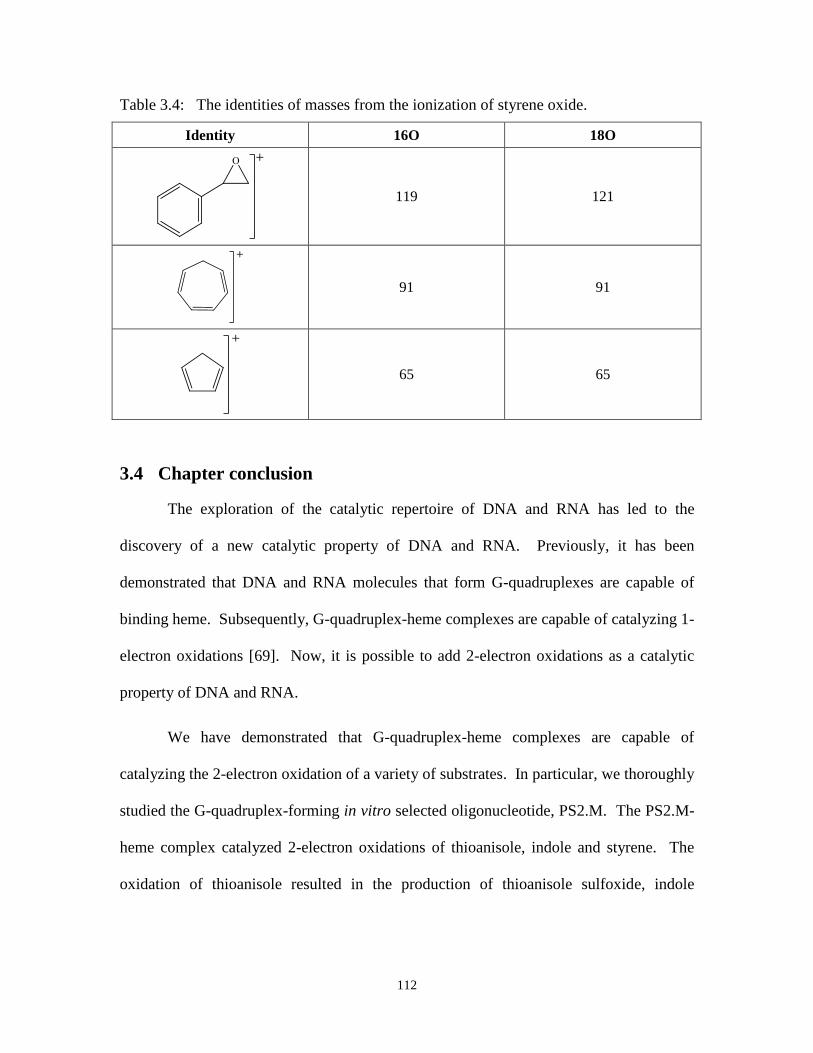
112
Table 3.4: The identities of masses from the ionization of styrene oxide.
Identity 16O 18O
119 121
91 91
65 65
3.4 Chapter conclusion
The exploration of the catalytic repertoire of DNA and RNA has led to the
discovery of a new catalytic property of DNA and RNA. Previously, it has been
demonstrated that DNA and RNA molecules that form G-quadruplexes are capable of
binding heme. Subsequently, G-quadruplex-heme complexes are capable of catalyzing 1-
electron oxidations [69]. Now, it is possible to add 2-electron oxidations as a catalytic
property of DNA and RNA.
We have demonstrated that G-quadruplex-heme complexes are capable of
catalyzing the 2-electron oxidation of a variety of substrates. In particular, we thoroughly
studied the G-quadruplex-forming in vitro selected oligonucleotide, PS2.M. The PS2.M-
heme complex catalyzed 2-electron oxidations of thioanisole, indole and styrene. The
oxidation of thioanisole resulted in the production of thioanisole sulfoxide, indole
113
resulted in the production of a mixture of products, and styrene resulted in the production
of styrene oxide, phenylacetaldehyde, and benzaldehyde.
The oxygen atom in the different oxidation products primarily originated from
hydrogen peroxide through the Compound I species. However, the mechanism of oxygen
transfer has not been resolved for PS2.M-heme catalyzed reactions. The transfer of the
oxygen atom from Compound I can proceed via the oxygen rebound mechanism or the
direct oxygen insertion mechanism. In either case, the origin of the oxygen atom in the
oxidation products reveals that the interaction between the reducing substrate and the
enzyme (PS2.M-heme) requires the substrate to be bound long enough for oxygen
transfer to take place. This may proceed via a direct 2-electron oxidation step or through
two successive 1-electron oxidations. The latter mechanism results in a radical cation
intermediate that is bound to the G-quadruplex-heme complex via possible cation-π
interactions or stacking interactions.
The investigation of the enantioselectivity of PS2.M-heme for the oxidation of
thioanisole revealed a lack of preference for the production of a specific chiral product.
In collaboration with Dr. Frédéric Pio, we performed flexible docking simulations using
Autodock software to identify the possible heme-binding sites on the NMR-derived
solution structure of Bcl-2, a G-quadruplex from the promoter region of BCL-2 [101]. As
seen in Figure 3.14, the heme molecule is stacked on top of G-quartet. Interestingly, a
cytidine is positioned directly under the center of the heme molecule, which we postulate
to be a possible candidate that may act as an axial ligand to coordinate the iron in the
heme molecule [101]. In addition, the distal side of the heme is completely exposed to
the solvent and lacks any DNA structure. These insights, in combination with studies

114
done by Klibanov and colleagues, show that the lack of substrate-, regio- and enatio-
selectivity of PS2.M-heme for 1-electron and 2-electron substrates is due to the lack of a
structured distal-heme environment [69].
Figure 3.14:The structure of Fe(III) heme docked, using the Autodock program, upon the
NMR-derived solution structure of a G-quadruplex formed by the Bcl-2 DNA
oligomer.
We have successfully demonstrated that PS2.M-heme can insert an oxygen atom
into electron-rich molecules, such as molecules containing heteroatoms or molecules that
have a large degree of conjugation. The ultimate gold standard of cytochrome P450
monooxygenase ability would be to oxidize an unactivated carbon, such as those in
adamantane or camphor. The ability of PS2.M-heme to hydroxylate unactivated carbons
is an ongoing interest in the Sen Laboratory.

115
4: Conclusion and outlook
The discovery of the catalytic capability of nucleic acids continues to inspire us in
our pursuit to understand the catalytic mechanisms and the full catalytic potential of
ribozymes. In this work, we sought to uncover the structural features of PS2.M, a G-
quadruplex-forming oligonucleotide, that allow it to bind to heme and subsequently
catalyze peroxidase reactions. In addition, we set out to investigate if the PS2.M-heme
complex could perform other functions of heme proteins, such as 2-electron oxidation
reactions where an oxygen atom is transferred to the organic substrate to form the
oxidation product.
Our studies revealed that PS2.M folds into many different species and the
distribution of species is highly dependent on various conditions. PS2.M is capable of
folding into G-quadruplex structures that range from unimolecular to tetrameric and from
parallel-stranded to anti-parallel-stranded. However, the G-quadruplex species that binds
heme and catalyzes oxidation reactions is most likely a parallel G-quadruplex. The CD
spectra of PS2.M are indicative of a primarily parallel-stranded mixture of species.
Furthermore, the addition of hemin to the PS2.M solution causes a decrease in the
amount of anti-parallel G-quadruplexes in the mixture. Along with other groups, these
results suggest that heme may even cause the switching of anti-parallel stranded G-
quadruplexes to parallel stranded G-quadruplexes.
116
Once heme was bound to PS2.M and the other examined G-quaduplexes, there
was an enhancement of the peroxidative ability of heme. A common mechanism
employed by G-quadruplexes to enhance the peroxidative ability of heme is to increase
the pKa of the water-heme complex. This causes a shift in the alkaline transition to
disfavour the formation of the hydroxide-heme complex at physiological pH. The
hydroxide-heme complex interferes with the formation of Compound I, which is the
active heme species.
Since PS2.M aids in the formation of Compound I, and Compound I is a common
intermediate species for peroxidases and monooxygenases that contain heme, we wanted
to explore PS2.M-heme‟s ability to perform 2-electron oxidation reactions. The use of
H2O2 to oxidize Fe(III) heme to form Compound I is the same for both the 1-electron and
2-electron oxidation reactions. Once PS2.M-heme complex has formed Compound I, we
have demonstrated that PS2.M-heme complex is capable of catalyzing 2-electron
oxidations of electron-rich substrates by transferring the ferryl-oxygen to the substrate.
Our studies included a variety of substrates that allowed us to test the ability of
PS2.M-heme to oxidize heteroatoms, hydroxylate unsaturated carbons, and epoxidate
alkenes. In many cases, the ability of PS2.M-heme to oxygenate the tested substrates was
comparable to protein peroxidases, but not as efficient as monooxygenases. However,
unlike the majority of classical peroxidases, PS2.M-heme does not seem to be regio- or
enantio-selective. This may suggest that the active site of PS2.M-heme is less restrictive
than their protein counterparts are. Furthermore, we demonstrated that the ability to
catalyze oxygen transfer reactions is not limited to the artificial PS2.M G-quadruplex, but
a more general property of G-quadruplexes that can bind heme.
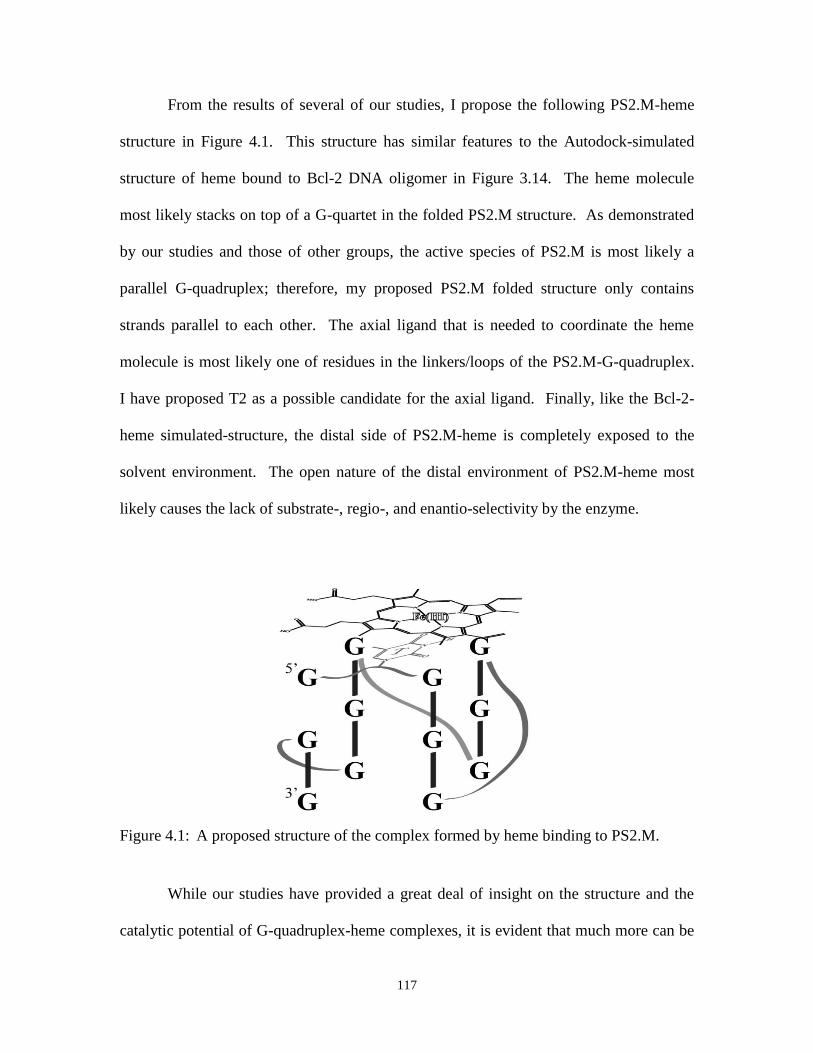
117
From the results of several of our studies, I propose the following PS2.M-heme
structure in Figure 4.1. This structure has similar features to the Autodock-simulated
structure of heme bound to Bcl-2 DNA oligomer in Figure 3.14. The heme molecule
most likely stacks on top of a G-quartet in the folded PS2.M structure. As demonstrated
by our studies and those of other groups, the active species of PS2.M is most likely a
parallel G-quadruplex; therefore, my proposed PS2.M folded structure only contains
strands parallel to each other. The axial ligand that is needed to coordinate the heme
molecule is most likely one of residues in the linkers/loops of the PS2.M-G-quadruplex.
I have proposed T2 as a possible candidate for the axial ligand. Finally, like the Bcl-2-
heme simulated-structure, the distal side of PS2.M-heme is completely exposed to the
solvent environment. The open nature of the distal environment of PS2.M-heme most
likely causes the lack of substrate-, regio-, and enantio-selectivity by the enzyme.
Figure 4.1: A proposed structure of the complex formed by heme binding to PS2.M.
While our studies have provided a great deal of insight on the structure and the
catalytic potential of G-quadruplex-heme complexes, it is evident that much more can be
118
done. One of the ongoing goals in our laboratory is to obtain a high resolution structure
of PS2.M. Without this data, it is difficult to conclude how PS2.M binds heme and how
PS2.M enhances the 1-electron abstraction and oxygen transfer ability of heme.
However, the highly polymorphic folding of PS2.M makes nuclear magnetic resonance
spectroscopy and X-ray crystallography studies difficult. Gel based assays can still be an
excellent method for investigating the active structure of PS2.M. An ongoing experiment
in our laboratory is to use an in situ peroxidase assay with diaminobenzidine to identify
the active species in either a non-denaturing polyacrylamide or agarose gel.
Aside from structural studies of PS2.M, it would also be interesting to further
investigate the mechanism of the newly discovered oxygen transfer ability of G-
quadruplex-heme complexes. For instance, the contribution of molecular oxygen to the
oxidation of styrene can be investigated with 18
O labelled molecular oxygen. Also, it
would be interesting to discern the mechanisms involved in indole oxidation that result in
a large mixture of products. Since not all the products of indole oxidation were
identified, it is important to identify all the unknown peaks especially the ones that did
not appear in the mixture of indole oxidation products by cytochrome P450. These
studies into the mechanism of oxidation by G-quadruplex-heme could help us understand
the potential catalytic contribution of in vivo G-quadruplexes.
Furthermore, the potential of PS2.M-heme as an industrial catalyst is very
intriguing due to its small size and robustness to various environmental conditions. We
have demonstrated that several substrates can be oxygenated by PS2.M-heme; however,
it has not been possible to oxidize a saturated carbon. Also, G-quadruplex-heme
complexes lack regio- and enantio-selectivity, which is not ideal for the synthesis of most

119
pharmaceuticals. However, a DNAzyme could be evolved from the G-quadruplex
scaffold to oxidize a specific position in a substrate. Our laboratory is actively looking
into all these avenues of research.

120
Reference List
1. Stanley, W.M., Isolation of a crystalline protein possessing the properties of
tobacco-mosaic virus. Science, 1935. 81(2113): p. 644-645.
2. Downie, A.W., Pneumococcal transformation - backward view. Fourth Griffith
Memorial Lecture. J. Gen. Microbiol., 1972. 73(1): p. 1-11.
3. Avery, O.T., C.M. MacLeod, and M. McCarty, Studies on the Chemical Nature of
the Substance Inducing Transformation of Pneumococcal Types: Induction of
Transformation by a Desoxyribonucleic Acid Fraction Isolated from
Pneumococcus Type III. J. Exp. Med.79 (2): 137–158., 1944. 79(2): p. 137-158.
4. Watson, J.D. and F.H.C. Crick, A Structure for Deoxyribose Nucleic Acid. Nature,
1953. 171(4356): p. 737-738.
5. The 2009 Nobel Prize in Physiology or Medicine - Press Release. [cited 2011 6
May]; Available from:
http://nobelprize.org/nobel_prizes/medicine/laureates/2009/press.html.
6. Blackburn, E.H. and J.G. Gall, A tandemly repeated sequence at the termini of the
extrachromosomal ribosomal RNA genes in Tetrahymena. J. Mol. Biol., 1978.
120(1): p. 33-53.
7. Harley, C.B. and B. Villeponteau, Telomeres and telomerase in aging and cancer.
Curr. Opin. Genet. Dev., 1995. 5: p. 249-255.
8. Sen, D. and W. Gilbert, Formation of parallel four-stranded complexes by
guanine-rich motifs in DNA and its implications for meiosis. Nature, 1988. 334: p.
364 - 366.
9. Sen, D. and W. Gilbert, A sodium-potassium switch in the formation of four-
stranded G4-DNA. Nature, 1990. 344: p. 410-414.
10. Huppert, J. and S. Balasubramanian, G-quadruplexes in promoters throughout the
human genome. Nucleic Acids Res., 2006. 35(2): p. 406-413.
11. Balasubramanian, S., L.H. Hurley, and S. Neidle, Targeting G-quadruplexes in
gene promoters: a novel anticancer strategy? Nat. Rev. Drug Discovery, 2011.
10: p. 261-275.
12. Huppert, J. and S. Balasubramanian, Prevalence of quadruplexes in the human
genome. Nucleic Acids Res., 2005. 33(9): p. 2908-2916.

121
13. Siddiqui-Jain, A., et al., Direct evidence for a G-quadruplex in a promoter region
and its targeting with a small molecule to repress c-MYC transcription. Proc.
Natl. Acad. Sci., 2002. 99(18): p. 11593-11598.
14. Gellert, M., M.N. Lipsett, and D.R. Davies, Helix formation by guanylic acid.
Proc. Natl. Acad. Sci., 1962. 48(12): p. 2013-2018.
15. Arnott, S., K. Chandrasekaran, and C.M. Marttila, Structures for polyinosinic acid
and polyguanylic acid. Biochem. J., 1974. 141(2): p. 537-543.
16. Patel, D.J., A.T. Phan, and V. Kuryavyi, Human telomere, oncogenic promoter
and 5'-UTR G-quadruplexes: diverse higher order DNA and RNA targets for
cancer therapeutics. Nucleic Acids Res., 2007. 35(22): p. 7429-7455.
17. Tougard, P., J.F. Chantot, and W. Guschlbauer, Nucleoside conformations: X. An
X-ray fiber diffraction study of the gels of guanine nucleosides. Biochim.
Biophys. Acta., 1973. 308(1): p. 9-16.
18. Zimmerman, S.B., G.H. Cohen, and D.R. Davies, X-ray fiber diffraction and
model-building study of polyguanylic acid and polyinosinic acid. J. Mol. Biol.,
1975. 92(2): p. 181-184.
19. Friedman, R.A. and B. Honig, A free energy analysis of nucleic acid base
stacking in aqueous solution. Biophys. J., 1995. 69(4): p. 1528-1535.
20. Lai, J.S., J. Qu, and E.T. Kool, Fluorinated DNA Bases as Probes of Electrostatic
Effects in DNA Base Stacking. Angew. Chem. Int. Ed., 2003. 42: p. 5973-5977.
21. Parkinson, G.N., Fundamentals of Quadruplex Structures, in Quadruplex Nucleic
Acids, S. Neidle and S. Balasubramanian, Editors. 2006, The Royal Society of
Chemistry: Cambridge. p. 1-30.
22. Burge, S., et al., Quadruplex DNA: sequence, topology and structure. Nucleic
Acids Res., 2006. 34(19): p. 5402-5415.
23. Otero, R., et al., Guanine Quartet Networks Stabilized by Cooperative Hydrogen
Bonds. Angew. Chem. Int. Ed., 2005. 44(15): p. 2270-2275.
24. Phan, A.T., V. Kuryavyi, and D.J. Patel, DNA architecture: from G to Z. Curr.
Opin. Struc. Biol., 2006. 16: p. 288-298.
25. Hud, N.V. and J. Plavec, The Role of Cations in Determining Quadruplex
Structure and Stability, in Quadruplex Nucleic Acids, S. Neidle and S.
Balasubramanian, Editors. 2006, The Royal Society of Chemistry: Cambridge. p.
100-130.
26. Mergny, J.L., A.T. Phan, and L. Lacroix, Following G-quartet formation by UV-
spectroscopy. FEBS Lett., 1998. 435: p. 74-78.
122
27. Hud, N.V., et al., The Selectivity for K+ vs. Na
+ in DNA Quadruplexes is
Dominated by Relative Free Energies of Hydration: A Thermodynamic Analysis
by 1H NMR. Biochemistry, 1996. 35: p. 15383-15390.
28. Dunford, H.B., Heme Peroxidases. 1999, New York: John Wiley & Sons, Inc. 88.
29. Dunford, H.B., Peroxidases & Catalases. 2010, Hoboken, New Jersey: John
Wiley & Sons, Inc.
30. Mansuy, D. and J.-P. Renaud, Heme-Thiolate Proteins Different from
Cytochromes P450 Catalyzing Monooxygenations, in Cytochrome P450:
Structure, Mechanism, and Biochemistry, P.R. Ortiz de Montellano, Editor. 1995,
Plenum Press: New York. p. 537-574.
31. Matsunaga, I. and Y. Shiro, Peroxide-utilizing biocatalysts: structural and
functional diversity of heme-containing enzymes. Curr. Opin. Chem. Biol., 2004.
8: p. 127-132.
32. van Rantwijk, F. and R.A. Sheldon, Selective oxygen transfer catalysed by heme
peroxidases: synthetic and mechanistic aspects. Curr. Opin. Biotechnol., 2000.
11(6): p. 554-564.
33. Erman, J.E., et al., Histidine 52 is a critical residue for rapid formation of
cytochrome c peroxiase compound I. Biochemistry, 1993. 32: p. 9798-9806.
34. Dawson, J.H., Probing Structure-Function Relations in Heme-Containing
Oxygenases and Peroxidases. Science, 1988. 240: p. 433-439.
35. Harris, D.L., High-valent intermediates of heme proteins and model compounds.
Curr. Opin. Chem. Biol., 2001. 5: p. 724-735.
36. Adachi, S., et al., Roles of proximal ligand in heme proteins: Replacement of
proximal histidine of human myoglobin with cysteine and tyrosine by site-directed
mutagenesis as models for P-450, chloroperoxidase, and catalase. Biochemistry,
1993. 32: p. 241-252.
37. Yi, X., et al., Replacement of the proximal heme thiolate ligand in
chloroperoxidase with a histidine residue. Proc. Natl. Acad. Sci., 1999. 96: p.
12412-12417.
38. Newmyer, S.L. and P.R.O.d. Montellano, Histidine catalysis and control of
substrate access to the heme iron. J. Biol. Chem., 1995. 270: p. 19430-19438.
39. Sundaramoorthy, M., J. Terner, and T.L. Poulos, Stereochemistry of the
chloroperoxidase active site: crystallographic and molecular-modeling studies.
Chem. Biol., 1998. 5: p. 461-473.
40. Poulos, T.J. and J. Kraut, The stereochemistry of peroxidase catalyst. J. Biol.
Chem., 1980. 255: p. 8199-8205.
123
41. Schlichting, I., et al., The catalytic pathway of cytochrome p450cam at atomic
resolution. Science, 2000. 287: p. 1615-1622.
42. Imai, M., et al., Uncoupling of the cytochrome P-450cam monooxygenase by a
single mutation, threonine-252 to alanine or valine: A possible role of the
hydroxy amino acid in oxygen activation. Proc. Natl. Acad. Sci., 1989. 86: p.
7823-7827.
43. Gerber, N.C. and S.G. Sligar, Catalytic mechanism of cytochrome P-450:
Evidence for a distal charge relay. J. Am. Chem. Soc., 1992. 114: p. 8742-8743.
44. Raag, R., et al., Crystal structure of the cytochrome P450cam active site mutant
Thr252Ala. Biochemistry, 1991. 30: p. 11420-11429.
45. Poulos, T.J., Cytochrome P450. Curr. Opin. Struc. Biol., 1995. 5: p. 767-774.
46. Raag, R. and T.J. Poulos, X-ray crystallographic structural studies on cytochrome
P450cam: factors controlling substrate metabolism. Front Biotransfrom, 1992. 7:
p. 1-43.
47. Poulos, T.J., B.C. Finzel, and A.J. Howard, Crystal structure of substrate-free P.
putida cytochrome P450. Biochemistry, 1986. 32: p. 9798-9806.
48. Raag, R., et al., Inhibitor-induced conformational change in cytochrome P450cam.
Biochemistry, 1993. 32: p. 4571-4578.
49. Ravichandran, K.G., et al., Crystal structure of hemoprotein domain of P450BM-3,
a prototype for microsomal P450s. Science, 1993. 261: p. 731-736.
50. Picot, D., P.J. Loll, and M. Garavito, The X-ray crystal structure of the membrane
protein prostaglandin H2 synthase-1. Nature, 1994. 367: p. 243-249.
51. Ortiz de Montellano, P.R. and M.A. Correia, Inhibition of Cytochrome P450
Enzymes, in Cytochrome P450: Structure, Mechanism, and Biochemistry, P.R.
Ortiz de Montellano, Editor. 1995, Plenum Press: New York. p. 305-366.
52. Ortiz de Montellano, P.R., Catalytic sites of hemoprotein peroxidases. Annu. Rev.
Pharmacol. Toxicol., 1992. 32: p. 89-107.
53. Raag, R., et al., Formation, crystal structure, and rearrangement of a cytochrome
P-450cam iron-phenyl complex. Biochemistry, 1990. 29: p. 8119-8126.
54. Harris, D.L., S.L. Newmyer, and P.R. Ortiz de Montellano, Horseradish
peroxidase-catalyzed two-electron oxidations. Oxidation of iodide, thioanisoles,
and phenols at distinct sites. J. Biol. Chem., 1993. 268: p. 1637-1645.
55. Miller, V.P., et al., Monooxygenase activity of cytochrome c peroxidase. J. Biol.
Chem., 1992. 267: p. 8936-8942.
56. Ozaki, S. and P.R. Ortiz de Montellano, Molecular Engineering of Horseradish
Peroxidase: Thioether Sulfoxidation and Styrene Epoxidation by Phe-41 Leucine
and Threonine Mutants. J. Am. Chem. Soc., 1995. 117: p. 7056-7064.

124
57. Shokat, K.M. and P.G. Schultz, Catalytic Antibodies. Annu. Rev. Immunol.,
1990. 8: p. 335-363.
58. Cochran, A.G. and P.G. Schultz, Antibody-Catalyzed Porphyrin Metallation.
Science, 1990. 249: p. 781-783.
59. Cochran, A.G. and P.G. Schultz, Peroxidase Activity of an Antibody-Heme
Complex. J. Am. Chem. Soc., 1990. 112: p. 9414-9415.
60. Gilbert, W., The RNA world. Nature, 1986. 319: p. 618.
61. Eddy, S.R., Non-coding RNA genes and the modern RNA world. Nat. Rev. Genet.,
2001. 2: p. 919-929.
62. Travascio, P., Y. Li, and D. Sen, DNA-enhanced peroxidase activity of a DNA
aptamer-hemin complex. Chem. Biol., 1998. 5: p. 505-517.
63. Li, Y., C.R. Geyer, and D. Sen, Recognition of Anionic Porphyrins by DNA
Aptamers. Biochemistry, 1996. 35: p. 6911-6922.
64. Li, Y. and D. Sen, A catalytic DNA for porphyrin metallation. Nat. Struct. Biol.,
1996. 3: p. 743-747.
65. Li, Y. and D. Sen, Toward an Efficient DNAzyme. Biochemistry, 1997. 36: p.
5589-5599.
66. Travascio, P., et al., A ribozyme and a catalytic DNA with peroxidase activity:
active sites versus cofactor-binding sites. Chem. Biol., 1999. 6(11): p. 779-787.
67. Travascio, P., D. Sen, and A.J. Bennet, DNA and RNA enzymes with peroxidase
activity - An investigation into the mechanism of action. Can. J. Chem., 2006. 84:
p. 613-619.
68. Travascio, P., et al., The Peroxidase Activity of a Hemin-DNA Oligonucleotide
Complex: Free Radical Damage to Specific Guanine Bases of the DNA. J. Am.
Chem. Soc., 2001. 123: p. 1337-1348.
69. Rojas, A.M., et al., Specificity of DNA-based (DNAzyme) peroxidative biocatalyst.
Biotechnol. Lett., 2007. 29(2): p. 227-232.
70. Lee, H.W., D.J.F. Chinnapen, and D. Sen, Structure-function investigation of a
deoxyribozyme with dual chelatase and peroxidase activities. Pure Appl. Chem.,
2004. 76: p. 1537-1545.
71. Elbaz, J., B. Shlyahovsky, and I. Willner, A DNAzyme cascade for the amplified
detection of Pb(2+) ions or L-histidine. Chem. Commun., 2008. 7(13): p. 1569-
1571.
72. Pavlov, V., et al., Amplified Chemiluminescence Surface Detection of DNA and
Telomerase Acitivty Using Catalytic Nucleic Acid Labels. Anal. Chem., 2004. 76:
p. 2152-2156.
125
73. Xiao, Y., et al., J. Am. Chem. Soc., 2004. 126: p. 7430-7431.
74. Niazov, T., et al., DNAzyme-Functionalized Au Nanoparticles for the Amplified
Detection of DNA or Telomerase Activity. Nano Lett., 2004. 4(9): p. 1683-1687.
75. Xiao, Y., et al., Lighting Up Biochemiluminescence by the Surface Self-Assembly
of DNA-Hemin Complexes. ChemBioChem, 2004. 5: p. 374-379.
76. Thirstrup, D. and G.S. Baird, Histochemical Application Of A Peroxidase
DNAzyme with a Covalently Attached Hemin Cofactor. Anal. Chem., 2010. 82(6):
p. 2498-2504.
77. He, Y., Y. Tian, and C. Mao, Human telomeric DNA sequences have a peroxidase
apoenzyme activity. Mol. Biosyst., 2009. 5: p. 238-240.
78. Kong, D.-M., et al., Structure-function study of peroxidase-like G-quadruplex-
hemin complexes. Analyst, 2010. 135: p. 321-326.
79. Cheng, X., et al., General Peroxidase Activity of G-Quadruplex-Hemin
Complexes and Its Application in Ligand Screening. Biochemistry, 2009. 48: p.
7817-7823.
80. Li, T., S. Dong, and E. Wang, G-quadruplex aptamers with Peroxidase-Like
DNAzyme Functions: Which Is the Best and How Does it Work? Chem. Asian J.,
2009. 4(6): p. 918-922.
81. Majhi, P.R. and R.H. Shafer, Characterization of an Unusual Folding Pattern in a
Catalytically Active Guanine Quadruplex Structure. Biopolymers, 2006. 82: p.
558-569.
82. Kong, D.-M., et al., Peroxidase activity-structure relationship of the
intermolecular four-stranded G-quadruplex-hemin complexes and their
application in Hg2+
ion detection. Talanta, 2009. 80: p. 459-465.
83. Bloomfield, V.A., D.M. Crothers, and I. Tinoco, Jr., Nucleic Acids: Structures,
Properties, Functions. 2000, Sausalito, CA: University Science Books.
84. Wang, Y., K. Hamasaki, and R.R. Rando, Specificity of Aminoglycoside Binding
to RNA Constructs Derived from the 16S rRNA Decoding Region and the HIV-
RRE Activator Region. Biochemistry, 1997. 36(4): p. 768-779.
85. Kaushik, M., et al., Possibility of an Antiparallel (Tetramer) Quadruplex
Exhibited by the Double Repeat of the Human Telomere Biochemistry, 2007. 46:
p. 7119-7131.
86. Prislan, I., et al., Kinetically governed polymorphism of d(G4T4G3) quadruplexes
in K+ solutions. Nucleic Acids Res., 2011. 39(5): p. 1933-1942.
87. Gray, D.M., et al., Measured and Calculated CD Spectra of G-Quartets Stacked
with the Same or Opposite Polarities. Chirality, 2008. 20: p. 431-440.
126
88. Luu, K.N., et al., Structure of the human telomere in K+ solution: An
intramolecular (3+1) G-quadruplex scaffold. J. Am. Chem. Soc., 2006. 128: p.
9963– 9970.
89. Lin, C.-T., et al., Structural Conversion of Intramolecular and Intermolecular G-
Quadruplexes of bcl2mid: The Effect of Potassium Concentration and Ion
Exchange. J.Phys. Chem. B, 2011. 115(10): p. 2360-2370.
90. Vorlickova, M., et al., Guanine tetraplex topology of human telomere DNA is
governed by the number o(TTAGGG) repeats. Nucleic Acids Res., 2005. 33: p.
5851–5860.
91. Viglasky, V., L. Bauer, and K. Tluckova, Structural Features of Intra- and
Intermolecular G-Quadruplexes Derived from Telomeric Repeats. Biochemistry,
2010. 49: p. 2110-2120.
92. Wang, Y. and D.J. Patel, Solution structure of the human telomeric repeat
d[AG3(T2AG3)3] G-tetraplex. Structure, 1993. 1(4): p. 263-282.
93. Parkinson, G.N., M.P. Lee, and S. Neidle, Crystal structure of parallel
quadruplexes from human telomeric DNA. Nature, 2002. 417: p. 876-880.
94. Hazel, P., et al., Loop-length-dependent folding of G-quadruplexes. J. Am. Chem.
Soc., 2004. 126: p. 16405-16415.
95. Balagurumoorthy, P., et al., Hairpin and parallel quartet structures for telomeric
sequences. Nucleic Acids Res., 1992. 20(15): p. 4061-4067.
96. Cao, W., et al., Water Penetration and Binding to Ferric Myoglobin.
Biochemistry, 2001. 40: p. 5728-5737.
97. Goldbeck, R.A., et al., Water and ligand entry in myoglobin: Assessing the speed
and extent of heme hydration after CO photodissociation. Proc. Natl. Acad. Sci.,
2006. 103(5): p. 1254-1259.
98. Job, D. and H.B. Dunford, Horseradish peroxidase. XXVIII. Formation and
reactivity of the alkaline form. Evidence for an enzyme-substrate complex in
Compound I formation. Can. J. Chem., 1978. 56: p. 1327-1334.
99. Marnett, L.J. and T.A. Kennedy, Comparison of the Peroxidase Activity of
Hemoproteins and Cytochrome P450, in Cytochrome P450: Structure,
Mechanism, and Biochemistry P.R. Ortiz de Montellano, Editor. 1995, Plenum
Press: New York. p. 49-80.
100. Bröring, M., Organic Reactions Catalyzed by Heme Proteins, in Iron Catalysis in
Organic Chemistry, B. Plietker, Editor. 2008, WILEY-VCH Verlag GmbH & Co.
KGaA: Weinheim. p. 48-72.
101. Poon, L.C.-H., et al., Guanine-Rich RNAs and DNAs That Bind Heme Robustly
Catalyze Oxygen Transfer Reactions. J. Am. Chem. Soc., 2011. 133: p. 1877-
1884.
127
102. Fruetel, J., et al., Thioanisole Sulfoxidation by Cytochrome P450cam (CYP101):
Experimental and Calculated Absolute Stereochemistries. J. Am. Chem. Soc.,
1994. 116: p. 11643-11648.
103. Isaacs, N., Physical Organic Chemistry. 1996, New Jersey: Prentice Hall.
104. Deorge, D.R., Oxygenation of organosulfur compounds by peroxidases: evidence
of an electron transfer mechanism for lactoperoxidase. Arch. Biochem. Biophys.,
1986. 244(2): p. 678-685.
105. Savenkova, M.I., S.L. Newmyer, and P.R. Ortiz de Montellano, Rescue of His-42
--> Ala horseradish peroxidase by a Phe-41 --> His mutation. Engineering of a
surrogate catalytic histidine. J. Biol. Chem., 1996. 271(40): p. 24598-24603.
106. Kobayashi, S., et al., On the Mechanism of the Peroxidase-Catalyzed Oxygen-
Transfer Reaction. Biochemistry, 1987. 26: p. 5019-5022.
107. Capeillère-Blandin, C., et al., Sulphoxidation reaction catalysed by
myeloperoxidase from human leucocytes. Biochem. J., 1998. 335: p. 27-33.
108. Blée, E. and F. Schuber, Mechanism of S-Oxidation Reactions Catalyzed by a
Soybean Hydroperoxide-Dependent Oxygenase. Biochemistry, 1989. 28: p. 4962-
4967.
109. Tuynman, A., et al., The sulphoxidation of thioanisole catalysed by
lactoperoxidase and Coprinus cinereus peroxidase: Evidence for an oxygen-
rebound mechanism. Eur. J. Biochem., 1998. 258: p. 906-913.
110. Tuynman, A., H.E. Schoemaker, and R. Wever, Enantioselective sulfoxidations
catalyzed by horseradish peroxidase, manganese peroxidase, and
myeloperoxidase. Monatsh. Chem., 2000. 131(6): p. 687-695.
111. Ricoux, R., et al., New activities of a catalytic antibody with a peroxidase activity:
formation of Fe(II)-RNO complexes and stereoselective oxidation of sulfides. Eur.
J. Biochem., 271, 1277-1283., 2004. 271: p. 1277-1283.
112. Lipps, H.J. and D. Rhodes, G-quadruplex structures: in vivo evidence and
function. Trends Cell Biol., 2009. 19(8): p. 414-422.
113. Gillam, E.M.J., et al., Oxidation of Indole by Cytochrome P450 Enzymes.
Biochemistry, 2000. 39: p. 13817-13824.
114. Corbett, M.D. and B.R. Chipko, Peroxide Oxidation of Indole to Oxindole by
Chloroperoxidase Catalysis. Biochem. J., 1979. 183: p. 269-276.
115. Tuynman, A., et al., Enantioselective epoxidation and carbon-carbon bond
cleavage catalyzed by Coprinus cinereus peroxidase and myeloperoxidase. J.
Biol. Chem., 2000. 275(5): p. 3025-3030.
128
116. Ortiz de Montellano, P.R., et al., Structure-mechanism relationships in
hemoproteins. Oxygenations catalyzed by chloroperoxidase and horseradish
peroxidase. J. Biol. Chem., 1987. 262(24): p. 11641-11646.
117. Ortiz de Montellano, P.R. and L.A. Grab, Cooxidation of styrene by horseradish
peroxidase and phenols: a biochemical model for protein-mediated cooxidation.
Biochemistry, 1987. 26(17): p. 5310-5314.