Embed Size (px)
Citation preview

Structural analysis of lymphocyticchoriomeningitis virus epitopes andcrossreactive self-peptides in complex withMajor Histocompatibility class I molecules
Implications for virus escape from CD8+ T cellrecognition and crossreactivity
Sidonia Eckle
Degree project in biology, 2007Examensarbete i biologi, 20p, 2007Biology Education Centre, Uppsala University, and Center for Infectious Medicine, Department ofMedicine, Karolinska Institutet, Karolinska University Hospital Huddinge, StockholmSupervisors: Dr. Adnane Achour and Dr. Daniel Badia-Martinez
1. Table of contents 1. Summary 3 2. Abbreviations 4 3. Introduction 5
3.1 Peptide presentation on Major Histocompatibility Complex class I molecules and T cell recognition
3.2 Lymphocytic choriomeningitis virus 3.3 Molecular mimicry between viral epitopes and self-peptides 3.4 X-ray crystallography
3.5 Aims
4. Results 12 4.1 Crystallization of murine pMHC-I complexes 4.2 X-ray crystallography of pMHC-I complexes 4.3 Binding affinity of LCMV-derived peptides to MHC-I
5. Discussion 22
5.1 Binding affinity of LCMV-derived peptides to MHC-I 5.2 LCMV immune escape from CD8+ T cell recognition 5.3 Mimicry between self-peptides and LCMV-derived peptides
6. Materials and methods 25 6.1 Peptides 6.2 Strains, cell lines and culture conditions 6.3 Purification of proteins from inclusion bodies 6.4 Refolding of murine pMHC-I complexes by rapid dilution 6.5 Protein concentration 6.6 Reducing sodium dodecyl sulfate polyacrylamide gel electrophoresis 6.7 Gel filtration size exclusion chromatography 6.8 Determination of protein concentration using a spectrophotometer 6.9 Crystallization 6.10 Cryoprotection and mounting of crystals in loops 6.11 X-ray crystallography 6.12 Binding affinity of peptides to MHC-I molecules
7. Acknowledgements 32 8 References 33 9. Appendix 39
2

1. Summary Infection with lymphocytic choriomeningitis virus (LCMV) generates a CD8+ T cell response directed mainly against two epitopes, gp33 and np396, whereas gp33 occurs in two versions, the 9-mer (KAVYNFATC) and the 11-mer gp33long (KAVYNFATCGI). Both peptides bind with high affinity to two murine Major Histocompatibility Complex class I (MHC-I) molecules, H-2Db and H-2Kb. Upon CD8+ T cell selection pressure in transgenic mice during acute LCMV infection, mutant variants of gp33 and gp33long occur. These mutant variants allow the virus to escape immune recognition in terms of both MHC-I complexes. This mechanism of immune escape may contribute to the virus persistence of Human Immunodeficiency virus and Hepatitis B virus. Molecular mimicry is defined as similarity of structures shared by molecules encoded by dissimilar genes. Due to molecular mimicry between viral and endogenous epitopes, crossreaction of virus-specific T-cells with endogenous epitopes can occur. This crossreaction might play a physiological role in positive selection of thymocytes or in the survival of virus-specific memory T cells. It may also modulate the T cell response to a virus in case the endogenous peptide acts as an antagonist. However, acting as an antagonist peptide may cause virus to escape from immune recognition. Furthermore, T cell crossreaction can lead to the activation of autoreactive T cells. The determination of the three-dimensional structures of MHC-I molecules in complex with viral escape variants of gp33long and of murine epitopes that are structurally similar to viral epitopes when bound to MHC-I would allow to establish the structural mechanisms underlying the responsiveness or non-responsiveness of T cells. Crystals of three mutant variants of gp33long in complex with H-2Db and H-2Kb were generated. Furthermore, structural data of crystals of H-2Db in complex with two murine peptides, TNFR1 (derived from the tumor necrosis factor alpha receptor I) and RPP (derived from retrovirus related pol polyprotein), were collected. The structure of TNFR1 in complex with H-2Db was solved. The structure revealed that TNFR1 bounds deeper in the peptide cleft compared to np396. Furthermore, a very different peptide-MHC surface compared to the complex with the mimicking viral peptide np396 could be observed.
3

2. Abbreviations β2m- beta2microglobulin CDR- complementarity determining region CTL- cytotoxic T lymphocyte E. coli- Escherichia coli gp- glycoprotein HIV- Human immunodeficiency virus LCMV- lymphocytic choriomeningitis virus mβ2m- murine beta2microglobulin MHC-I- Major Histocompatibility Complex class I np- nucleoprotein pMHC-I- peptide- Major Histocompatibility Complex class I SDS-PAGE- sodium dodecyl sulfate polyacrylamide gel electrophoresis TCR- αβ T cell receptor TNFR1- tumour necrosis factor alpha receptor I RPP- retrovirus related pol polyprotein
4

3. Introduction 3.1 Peptide presentation on Major Histocompatibility Complex class I molecules and T cell recognition Major Histocompatibility Complex class I (MHC-I) molecules complexed with peptides (pMHC-I) are present on the cell surface of all nucleated cells. The peptides presented on MHC-I molecules are derived from cytosolic proteins that can be either endogenous (presentation of self-epitopes) or foreign in case the cell is infected (presentation of microbial (antigenic) epitopes) [30]. During the cellular immune response to intracellular microbes, the αβ T cell receptors (TCRs) on CD8+ T cells interact in a highly specific way with MHC-I molecules complexed with antigenic epitopes [58]. The formation of the specific TCR-pMHC-I complex is the central event of antigen recognition in the cellular immune response that activates the antigen-specific cytotoxic T lymphocytes (CTL) [30]. T cell activation in response to a strong agonist peptide is characterized by TCR downregulation, T cell proliferation and CTL effector function including cytotoxic activity and cytokine production [33]. However, pMHC-TCR interaction can also lead to a partial T cell activation in case of weak and partial agonist peptides [33]. Antagonist peptides inhibit one ore more defined T cell effector functions induced upon interaction of a TCR with an agonist peptide [7]. Different models exist [38,47,60,63,67] suggesting different features of the pMHC-TCR interaction to be crucial for the physiological outcome of the T cell response. However, until now none of the models can fully explain all experimental data. The immunogenicity of a peptide depends on whether it is expressed on the cell surface in a stable complex with MHC-I, meaning that the dissociation rate is low enough to allow for TCR engagement [68]. Another factor correlating with immunogenicity is the affinity of the peptide for MHC-I which is the result of continuous association and dissociation of the complex [68]. However, for peptides with intermediate or low affinity, immunogenicity correlates better with pMHC-I stability than peptide-affinity to MHC-I [68]. The expression of an antigenic peptide in complex with MHC-I is furthermore determined by processes including peptide generation [73], peptide transport to the MHC-I, pMHC-I complex formation and transport to the cell surface [16]. For these processes the sequence of the peptide as well as the surrounding sequence in case of peptide generation has been shown to be crucial as well [72]. Generally a T cell response is elicited in a hierarchic order to only a few antigenic peptides called the immunodominant and subdominant epitopes. The position of a peptide in the immunohierarchy is determined by all mechanisms involved in antigenic peptide presentation in complex with MHC-I and in TCR recognition [72].
5

Peptide binding to MHC-I An MHC-I molecule consists of a polymorphic heavy chain comprising three domains (α1, α2 and α3) and the invariant light chain β2-microglobulin (β2m) which is non-covalently linked to the α3-domain of the heavy chain. The peptide is non-covalently associated with the MHC-I molecule in the peptide-binding cleft made up of the α1α2 domain of the heavy chain (Figure 1A) [1]. The floor of the peptide-binding groove is formed by a seven-stranded β-sheet; the sides are formed by two long α-helices (α1 and α2 helices) so that the ends of the groove are closed (Figure 1B) [1]. Eight to ten residues-long peptides are accommodated in an elongated conformation in the cleft fixing the peptide termini tightly to the cleft. Longer peptides can either bind by extension at the C-terminus or, due to the fixing of their termini, bulge out of the binding groove by a kinking of the peptide backbone [58].
A) B)
Figure 1. MHC-I molecule A) Domain organization of the MHC-I molecule. The light chain (β2m) is colored red, the heavy chain green and the peptide brown. The membrane of the cell is represented schematically, towards the bottom of the figure by a plain horizontal line. The anchors to the cell surface are indicated with dashed lines. B) Hydrogen bond interactions of the peptide with the cleft. The peptide is colored red, the cleft blue (alpha-helices) and grey (beta-sheets) and the residues of the cleft that interact with the peptide are colored black. Adapted from [1] and reproduced with permission from the copyright-holder. The MHC-I gene is polymorphic (existence of multiple alleles) through allelic variation within the depressions (pockets) of the cleft which are occupied by the peptide [9,10]. Hence, in order to bind to a certain MHC-I allele a peptide needs to possess certain anchor residues, whose position and properties are determined by the specific constellation of variable residues in the pockets of each MHC-I allele [9,10]. The interactions of the anchor residues with cleft residues are primarily van der Waal’s interactions but can also include hydrogen bonds [58]. The overall binding of the peptide to MHC-I is furthermore controlled by positive or negative factors of peptide residues other than the anchor residue, called nonanchor positions [58]. The fact that specific
6

anchor residues are required for peptide binding to MHC-I implies that a certain MHC-I allele is able to bind a unique set of peptides with similar anchor residues thereby maximizing the repertoire of peptides that can be presented. Furthermore, a certain peptide can bind to more than one allele (the peptide is restricted to several MHC-I) [58]. The MHC-I is polygenic, meaning that every individual possesses a set of genes (three on each chromosome: HLA-A, B, C in humans and H-2-D, B, K in mice) with different ranges of peptide-binding specificities [39]. H-2b mice for example express two MHC-I molecules: H-2Kb and H-2Db. Crystal structures of the extracellular parts of H-2Kb [20] and H-2Db [74] in complex with peptides have been solved and peptides eluted from the MHC-I molecules have been sequenced [17]. This way the anchor residues and their interactions with the pockets could be determined. H-2Db favors a hydrophilic residue at position 5 (Asn), for H-2Kb a more bulky hydrophobic residue at position 5 (Tyr, Phe) and Tyr or Pro at position 3 are preferred. Both MHC-I have a hydrophobic residue (Met, Ile, Leu or Val) at the C terminus. The crystal structures furthermore showed that in H-2Db the side chains of residues Trp73, Trp147 and Tyr156 form a hydrophobic ridge across the cleft (Figure 2A), which forces the peptide backbone to arch outward at position 6 and 7 and thereby to expose those residues to the TCR. The arch implies that peptides need to have a length of at least nine residues in order to bind to H-2Db. In H-2Kb this region is deeper and more spacious and H-2Kb favors octameric peptides. In both these MHC-I molecules a bridge across the cleft can be seen, formed in H-2Db by Lys66 and Glu163, and in H-2Kb by Lys66 and Thr163 (Figure 2). Ridge Bridge Figure 2. Connolly surface representation of the antigen-presenting domains of H-2Db (A) and H-2Kb (B). The surface is colored according to its potential charge (red is negative and blue positive). The bridge in both MHC-I and the ridge in H-2Db are indicated. Adapted from [74] and reproduced with permission from the copyright-holder.
7

TCR recognition of the pMHC-I TCRs contact with their complementarity determining regions (CDRs) present within their variable domains the α-helices of the MHC-I molecule and the residues of the peptide in the cleft that are oriented away from the MHC-I (Figure 3) [23].
Figure 3. Anatomy of the complexes formed between the MHC-I and the α/β TCR. Adapted from [26] and reproduced with permission from the copyright-holder. Due to combinations of host germline encoded genes an enormous diversity of TCR specificities is generated [30]. This is furthermore increased by the inherent binding degeneracy of TCRs: the complementarity determining regions (CDRs) present within the variable domains of the TCR can undergo conformational changes upon recognition of pMHC-I [30]. This conformational plasticity generates a TCR binding degeneracy that allows the TCR to interact with different but structurally similar pMHC (crossreactivity) [46,71]. Plasticity can also be seen in the pMHC during TCR binding, as a long peptide that bulged out of the peptide cleft has been shown to be crumpled by the TCR [66]. 3.2 Lymphocytic choriomeningitis virus Immune response to lymphocytic choriomeningitis virus Lymphocytic choriomeningitis virus (LCMV) is an RNA-virus that infects cells of the immune system in mice, its natural host, in a non-cytopathic way and causes persistent infection [75]. The acute phase of primary LCMV infection is characterized by a large CTL response [75]. Following LCMV infection of H-2b mice (e.g. C57BL/6) the CTL response is mainly directed towards two immunodominant epitopes, GP33–41 (gp33) (KAVYNFATC) derived from the viral glycoprotein 1 and NP396-404 (np396) (FQPQNGQFI) derived from the viral nucleoprotein [45]. Two other epitopes, GP276-
8

286 (gp276) and NP166-175 (np166) are subdominant [45]. All epitopes comprise the H-2Db anchor residues Asn at position 5 and a hydrophobic residue (C, I, L, M) at the C-terminus [22]. Furthermore, an in vitro study identified additionally to gp33 the overlapping 11-mer gp33long (KAVYNFATCGI) [27]. While all epitopes are H-2Db restricted, gp33 and gp33long are additionally H-2Kb restricted [27], and it has been demonstrated that both MHC-I alleles, H-2Db and H-2Kb, are important for LCMV infection [27,52]. The crystal structures of gp33 [3] and gp33long [Dr. Daniel Badia-Martinez and Dr. Rosmarie Friemann, unpublished data] in complex with H-2Db and H-2Kb have been solved previously. Immune escape by LCMV As an RNA virus, LCMV has a high natural mutation rate [75]. Hence, substitutions in epitopes derived from viral proteins occur, creating altered viral peptide ligands (mutant variants). These substitutions can affect peptide presentation on MHC-I and TCR-pMHC-I interaction [3,69]. It has been demonstrated in vivo in a TCR transgenic H-2b mouse model that during acute infection, LCMV mutants encoding altered peptide ligands preferentially expand and prevent CTL elimination [4,48,53,54]. Also the mechanism underlying LCMV immune escape in case of the 9-mer gp33 have been determined based on the comparative analysis of crystal structures of three altered peptide variants (Table 1) in complex with H-2Db and H-2Kb [3,4,48,53,54,64,69].
Table 1. Sequences of mutant versions of gp33 (KAVYNFATC) Peptide Sequence
gp33(V3L) KALYNFATC gp33(Y4F) KAVFNFATC gp33(F6L) KAVYNLATC
Virus escape based on mutated epitopes may contribute to the ability of viruses such as human immunodeficiency virus [5,11,29,36] and Hepatitis C virus [62] to cause viral persistence. Such escape mechanisms may furthermore be generally relevant in case of a high infection dose, a high speed of virus replication and mutation [44] and in case the immune response focuses on a few immunodominant epitopes [11,12,32]. Furthermore, antagonistic activity of viral escape variants on T cell responses impairs the immune response during infection with HIV [34,35] and Hepatitis B virus [8]. 3.3 Molecular mimicry between viral epitopes and self-peptides Molecular mimicry is defined as the similarity of structures shared by molecules that are encoded by dissimilar genes [14]. Hence, structural similarity between unrelated pMHC complexes, such as viral and self-peptides, allows for crossreactivity [19,71]. The physiological role of molecular mimicry between viral epitopes and self-peptides may happen during the positive selection of virus specific T cells during thymocyte maturation
9

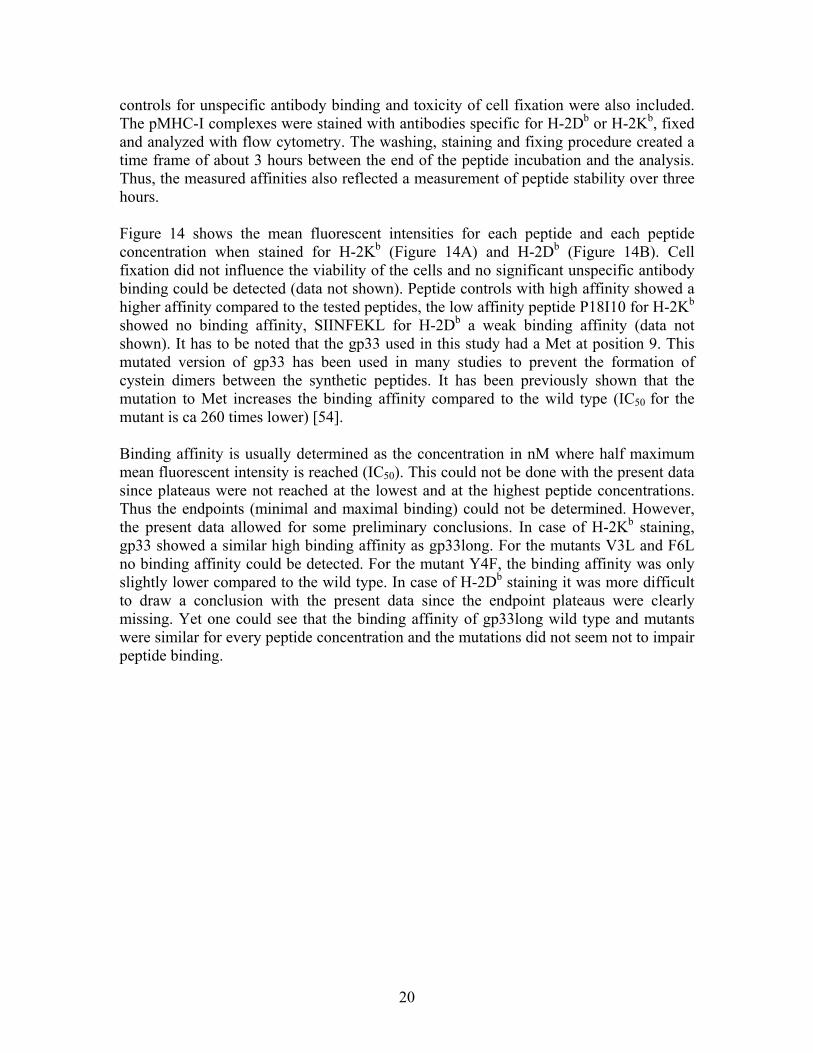
[59]. Furthermore, it has been hypothesized that self-peptides are required for the survival of virus-specific memory T cells [70]. The presence of a self-pMHC that is similar to a foreign pMHC may also inhibit the immune response to the foreign component by acting as an antagonist [7]. This could either be of benefit for the host, in case it is not necessary to react via an aggressive immune response to the foreign component or it could lead to virus evasion and therefore have a pathophysiological role [14]. Another pathophysiological role of molecular mimicry between self- and foreign pMHC could be the activation of autoreactive T cells upon virus infection causing potentially autoimmune disease as postulated by Oldstone [51]. However, there is still a lack of evidence for the role of molecular mimicry by pathogens in the initiation of autoimmunity [14,18,19,49]. It has also been argued that molecular mimicry more likely has an impact on the progression of an already existing autoimmune process since already activated auto-reactive lymphocytes are easier to reactivate for effector functions by crossreaction when compared to naïve lymphocytes [14,19,57]. 3.4 X-ray crystallography Crystallization For crystallization to occur the proteins need to pass their limit of solubility and reach a saturation state upon which critical nucleation occurs and proteins order in crystals [13]. Crystallization is influenced by several parameters that are screened during a crystallization trial, including several crystallization reagents (precipitants) that decrease the solubility of the protein (generally salts and polyalcohols). Furthermore, pH and additives (small molecules) can influence the protein-protein interactions. Also, different protein concentrations, total protein amounts as well as temperature may influence the kinetics of the solubility [56]. Crystal unit cell Crystals have a repeating unit, the unit cell. The unit cells in a crystal are stacked in three dimensions, in an orderly way, with the origins of the unit cells forming a crystal lattice consisting of parallel and equidistant planes. More sets of parallel and equidistant planes can be drawn through the lattice points. Lattice points always divide the unit cell vectors into a number of equal parts, so called Miller indices. The Miller indices identify the orientation of a particular set of parallel planes. Within the unit cell multiple copies of particles may exist allowing for different kinds of symmetry operations. The symmetry elements present within a unit cell define the space group of a crystal [56]. X-ray crystallography The arrangement of atoms within a crystal is determined in order to determine the crystal structure of a molecule. The method is based on the way the electric component of a
10
monochromatic X-ray beam is scattered elastically (scattered radiation has the same wavelength as the incident radiation) on the electrons around the atomic centers of the molecules in the crystal. Waves diffracting off many electron clouds in approximately the same relative position and orientation throughout the crystal will result in constructive interference and hence a detectable signal. The crystal therefore allows for the concentration of the weak scattering of an individual unit cell. A diffraction pattern of spots called reflections is produced. The relative intensities of the reflections together with the unit cell parameters and the crystal orientation provide the information necessary for the determination of the three-dimensional density of electrons. The relative intensity of a specific reflection is the magnitude of the inverted Fourier transform of the electron density allocated in a certain real space plane. However, the Fourier transform is generally a complex number, and therefore has a magnitude and a phase. This is known as the phase problem. Different methods exist to determine the phases. An indirect method to determine the phases is molecular replacement, which can be applied if a previously solved structure of a homologous protein exists. In molecular replacement the Patterson maps (squared magnitudes of the Fourier transform) of both molecules are compared first in their orientation by rotation. The correctly oriented model is then positioned to the correct co-ordinates within the asymmetric unit by translation. After solving the phase problem a final electron density representing an average of the electron densities of all molecules within the crystal is obtained. The electron density is displayed as a mesh that encloses the region in which the electron density exceeds a given threshold. This electron density combined with supplementary data, allows the mean atomic positions to be inferred. Upon inclusion of computationally and chemical bonding restrains, a model of the arrangement of atoms within the crystal is produced and refined, termed a crystal structure [56]. 3.5 Aims The aims of the present study were to solve the crystal structures of the three mutant variants of gp33long (F6L), (V3L) and (Y4F) in complex with H-2Db and H-2Kb. Comparative analysis with the structures of the wildtype peptide gp33long in complex with H-2Db and H-2Kb would increase the understanding of immune escape of LCMV. Another aim was to combine the structural results with in vitro functional assays in order to determine the affinity and stability of the studied peptides to the MHC-I molecules. The murine self-peptides TNFR1 [28] and RPP [50,59] have been identified and functionally characterized as molecular mimics of the LCMV immunodominant epitopes np396 and gp33, respectively. TNFR1 (TNFR-(302-310)), (FGPSNWHFM) is derived from the TNFR-I protein, a cell-surface receptor for tumor necrosis factor-alpha [6], RPP (KAIYRFNAI) is derived from retrovirus-related pol polyprotein [43]. A third aim of the study was to solve the crystal structures of both peptides in complex with H-2Db. The comparison of the self-peptide MHC-I structures with the structurally similar LCMV-peptide MHC-I structures would provide a better understanding of the previously performed functional studies regarding these self-peptide MHC-I complexes.
11

4. Results 4.1 Crystallization of murine pMHC-I complexes Expression of murine MHC-I light and heavy chains Murine MHC-I light and heavy chains were expressed in E. coli BL21(DE3)•pLysS transformed with plasmids encoding the extracellular portion of H-2Db, H-2Kb, (residues 1-276) and murine β2m, respectively, and purified from inclusion bodies. One liter overnight culture resulted in on the average in 8.5 mg heavy chain and 10 mg light chain, respectively, as determined photometrically. The relative purity of the proteins was assessed with reducing sodium dodecyl sulfate polyacrylamide gel electrophoresis (SDS-PAGE) (Figure 4). In each case the produced protein was the major protein purified with a high level of purity, which was required for successful renaturation. Figure 4. Relative purity of mMHC-I heavy and light chains purified from E. coli inclusion bodies. assessed by reducing SDS-PAGE. For mβ2m and H-2Db 0.017 mg and 0.034 mg were loaded each and for H-2Kb 0.023 mg and 0.046 mg. The gel was stained with Coomassie. Refolding of MHC-I light and heavy chains in complex with peptides and purification of the pMHC Each of the peptides gp33long(F6L), (V3L) and (Y4F), in complex with mβ2m and H-2Db or H-2Kb, were refolded in vitro through rapid dilution. The peptides RPP and TNFR1 were also refolded in complex with mβ2m and H-2Db. Following concentration with a tangential concentration machine, the pMHC-I complexes were purified from protein aggregates and mβ2m using size exclusion chromatography. The purity of the eluted fractions was assessed by reducing SDS-PAGE. As an example of the purification of refolded pMHC-complexes, figure 5 displays the size exclusion chromatogram of renatured H-2Kb in complex with mβ2m and gp33long(V3L) (complex H-2Kb/gp33long(V3L)/mβ2m) (Figure 5A) and the picture of the appropriate reducing SDS-PAGE covering the fractions A12 to B6 (Figure 5B).
12

A)
B)
Figure 5. Purification of renatured gp33long(V3L) in complex with H-2Kb and mβ2m (complex H-2Kb/gp33long(V3L)/mβ2m) from protein aggregates and mβ2m. A) Size exclusion chromatogram showing protein absorption measured at 280 nm of the eluted fractions (red) and volume (black) after loading the concentrated renatured sample of gp33long(V3L) with H-2Kb and mβ2m. The fractions containing aggregated protein (A10-B12), the correctly folded pMHC-I (B11-B9), and mβ2m (B3-C5) are marked with arrows. B) Reducing SDS-PAGE of the fractions A12 to B6. Heavy and light chains are marked with arrows. The gel was stained with Coomassie.
13

Protein aggregates, the molecules with the highest molecular weight, were first eluted during size exclusion (fractions A10 to B12) (Figure 5A). The aggregates consisted of incorrectly folded light and heavy chain (Figure 5B). The correctly folded pMHC-I complex was eluted in fractions B11 to B9 (Figure 5A). The correctly folded light chain was eluted in fractions B3 to C5 (Figure 5A). A similar elution pattern was observed for all purifications of the different pMHC-I complexes (appendix, figure 17). Generally to better discriminate the fractions containing the aggregates and the fractions containing the correctly folded complex, size exclusion was repeated for the fractions where the absorbance peaks of the aggregates and the correctly folded complex overlapped (fractions B12 and B11). The fractions containing the pMHC-I complex were finally concentrated to a volume of 0.2 to 0.5 ml using centrifugal filter devices and the protein concentration was determined photometrically. All pMHC-I complexes were successfully renatured. To compensate lower yields of correctly refolded protein gained for some complexes, renaturation was repeated. The yield gained for H-2Kb/gp33long(Y4F)/mβ2m could not be improved due to a lack of peptide. Protein concentrations between 1.2 and 5.2 mg/ml were gained (Table 2). The protein concentrations gained were potentially high enough for crystallization.
Table 2. pMHC-I complexes and protein concentrations obtained pMHC-I-complex protein concentration [mg/ml]
H-2Db/gp33long(F6L)/mβ2m 1.7 H-2Db/gp33long(V3L)/mβ2m 2.2 H-2Db/gp33long(Y4F)/mβ2m 3.4 H-2Kb/gp33long(F6L)/mβ2m 5.2 H-2Kb/gp33long(V3L)/mβ2m 5.1 H-2Kb/gp33long(Y4F)/mβ2m 2.7 H-2Db /RPP/mβ2m 1.2 H-2Db /TNFR1/mβ2m 1.7
Crystallization of the pMHC-I complexes Crystallization screenings were set up for hanging drop vapour diffusion. Conditions were thereafter refined through small step modifications until obtaining the best crystals. Protein concentration and sample volume in the drop were adjusted. In some cases, additive screenings (Hampton Research) were applied. Crystals of high quality were obtained for all gp33long variants in complex with H-2Db and mβ2m, as well as for gp33long(V3L) in complex with H-2Kb and mβ2m. Low quality crystals were obtained for gp33long(F6L) and gp33long(Y4F) in complex with H-2Kb and mβ2m. Furthermore, crystals of high quality of the peptides RPP and TNFR1 in complex with H-2Db and mβ2m were obtained. The size of the crystals ranged from 0.05 to 0.3 mm, which is suitable to retrieve diffraction data. The best crystallization
14

conditions for each pMHC-I complex as well as examples of crystals for each pMHC-I complex are presented in the appendix (Table 8 and figure 18). To decrease thermal motion and disorder as well as radiation damage during diffraction data sampling, crystals were cryoprotected, in order to avoid ice formation and other damage. Crystals were mounted in cryloops and flash-frozen in liquid nitrogen. 4.2 X-ray crystallography of pMHC-I complexes Diffraction data were collected from crystals of TNFR1 and RPP in complex with H-2Db and mβ2m at the Synchrotron ESRF in Grenoble, France. The applied data collection strategy was suggested by the program MOSFLM [40]. Oscillation angles of 0.5° and 1.0°, and rotation ranges of 180° and 200° were used for TNFR1 and RPP, respectively. The crystal of the complex of H-2Db/TNFR1/mβ2m diffracted to a resolution of 1.95 Å, while the crystal of H-2Db in complex with RPP diffracted to a resolution of 2.20 Å. Due to a lack of time the crystal structure from the diffraction data of the TNFR1 MHC-I complex was solved by Dr. Daniel Badia-Martinez. The crystal structure from the diffraction data of the RPP MHC-I complex has not been solved yet. Indexing and scaling were performed using the XDS suite of programs [31]. Table 3 summarizes the crystallographic parameters for the unit cell and the data collection. Molecular replacement was performed with PHASER [55,61], using the structure with the RSCB PDB code 1n5a [3] as a search model. Three different models were searched simultaneously (α1α2, β2m, α3) whereas one solution was established for each model (one MHC complex per asymmetric unit). For each solution a likelihood gain was provided. The likelihood was positive and increased as soon as more models were part of the solution. Table 10 (appendix) summarizes the results of the molecular replacement and the likelihood gains for each solution. Finally the simultaneous refinement of all solutions was performed, resulting in an overall likelihood gain (Table 11, appendix). Further refinements of the structure are required prior to publication. Table 3. Crystallographic parameters of H-2Db/TNFR1/mβ2m (Spacegroup C2)
Crystallographic parameters Values Spacegroup C2 Unit cell vectors a,b,c (Å) 91.5, 109.9, 58.2 Unit cell angles alpha, beta, gamma [°] 90.0, 122.2, 90.0 Number of molecules per asymmetric unit 1 Resolution range (Å) 20.00-1.95 Number of unique reflections 33340 (2106) Completeness of data 93.6% (80.4%) R-factormerge 6.2% (41.9%) Average I/σ(Ι) 12.01 (3.17)
Number in parenthesis refer to the outermost resolution shell 2.20-1.95 Å
15

The electron density of the peptide was of good quality with the peptide being clearly defined (Figure 6). The peptide backbone displayed an elongated conformation with residues at position 6 and 7 arching outwards towards the TCR forced by the hydrophobic ridge across the cleft of the H-2Db molecule (Figures 6, 7). The overall peptide conformation revealed that the main anchor residues Asn (position 5) and Met (position 9, C-terminus) were accommodated deeply in the cleft. The secondary anchor residue Pro (position 3) as well as the first two residues bound deeply in the peptide-binding cleft (Figures 6, 7).
p6W
p9M
p8F
p7H
p5N
p4S
p3P p2G
p1F
Figure 6. Electron density of TNFR1, side view. Main anchor residues (positions 5 and 9) are indicated with bold arrows, the secondary anchor residue (position 3) is indicated with a fine arrow. Each residue is indicated. Figure 7. Connolly surface model of TNFR1 accomodated in the cleft of H-2Db. The surface is colored according to its potential charge (red is negative and blue is positive).
16

The interactions of the C-and N-termini and the anchor position at position 5 are displayed in more detail in Figures 8 and 9. The C-terminus had numerous electrostatic and hydrogen interactions with the cleft (Figure 8, left picture): Met at position 9 interacted with Asn80, Tyr84, Thr143 and Lys146. Furthermore, Phe at position 8 interacted with Ser77 and Trp147 (not visible in Figure 8, left picture). Also the N-terminal Phe had numerous interactions with the cleft: three Tyr residues (Tyr159, Tyr7 and Tyr171), Glu63 and Lys66 (Figure 8, right picture). The anchor residue Asn (position 5) of the peptide and Gln97 of the cleft interacted with two hydrogen bonds between the amino acid residues (Figure 9).
Figure 8. Interactions of TNFR1 with H-2Db in the C- (left picture) and N-(right picture)-terminus of TNFR1. The peptide TNFR1 is colored in green, H-2Db in blue. Figure 9. Interactions of TNFR1with H-2Db at position 5 of TNFR1. The peptide TNFR1 is colored in green, H-2Db in blue. The residues Trp (position 6) and Phe (position 8) pointed upwards providing potential contacts for TCR recognition of the peptide. Trp (position 6) was slightly tilted towards the cleft (Figure 7) due to π−π and van der Waal’s interactions with His155 (Figure 10).
17

Figure 10. Interactions of TNFR1 with H-2Db at position 6 of TNFR1. The peptide TNFR1 is colored in green, H-2Db in blue. The crystal structure of H-2Db/TNFR1/mβ2m was compared to the mimic-peptide np396- MHC-I complex (PDB 1jpg) solved by Ciatto et al. [15] (Figure 11). Cα atoms of heavy chain residues 2 to 175 were superimposed using LSQMAN [37]. Both peptides use an identical anchor residue at position 5 (Asn) and hydrophobic residues at the C terminus (Met in TNFR1 and Ile in np396). They also have the same secondary anchor residue (Pro) at position 3. Therefore, the peptides occupied the peptide binding groove in a similar way (Figure 11). Large differences were observed in the residues projecting out from the cleft, which could potentially contact the TCR (Figure 11). Both peptides have a Phe at position 8. While TNFR1 had a Trp at position 6 and a His at position 7, np396 had a Gln at position 4 and 7.
Figure 11. Overlay of the peptides TNFR1 (green) and np396 blue) when bound to H-2Db. The left picture shows a side-view, the right picture is a top-view. However, small deviations of the backbones could be observed. Distances at the N-terminus of 1.37 Å and 1.12 Å, respectively were measured for positions 2 and 3 of the two peptides (Figure 12, left picture). The shift of np396 compared to TNFR1 was due to the Gln of np396 in position 2 which was stabilized through several interactions: Tyr7, Asp9, Tyr22, Ser24 and Tyr45 (Figure 12, right picture). In contrast, Gly at position 2 of
18

TNFR1 was more flexible due to less conformational restrictions and therefore allowed for a deeper binding of the TNFR1 peptide in the cleft compared to np396.
Figure 12.Backbone deviations of TNFR1 and np396 at the N—terminus. Left Picture: Positions 2 and 3 of the overlaid peptides TNFR1 (green) and np396 (blue) when bound to H-2Db. The measured distance between the Cα at position 2 of the peptides was 1.37 Å and 1.12 Å at position 3. Right picture: Interaction of the Gln (P2) of np396 (blue) with the cleft (turquoise). A wider shift of 1.63 Å between np396 and TNFR1 was present at position 6 (Figure 13). Here np396 possessed a flexible Gly while TNFR1 had a Trp that was stabilized with π−π and van der Waals interactions with several residues in the cleft (Figure 13). Figure 13. Position 6 of the overlaid peptides TNFR1 (green) and np396 (blue) when bound to H-2Db. The measured distance between the Cα at position 6 was 1.63 Å. 4.3 Binding affinity of LCMV-derived peptides to MHC-I In order 1) to determine the binding-affinity of gp33long and the variants gp33long(Y4F), (F6L) and (V3L) to H-2Db and H-2Kb and 2) to compare their affinity with those of the nonameric peptide gp33, RMA-S binding assays were performed using peptide concentrations stretching from 10-9 to 10-5 M. Control peptides that bind with high affinity (in case of H-2Db ASNENEMETM, in case of H-2Kb SIINFEKL) or with low affinity (in case of H-2Db SIINFEKL, in case of H-2Kb P18I10) to MHC-I as well as
19
controls for unspecific antibody binding and toxicity of cell fixation were also included. The pMHC-I complexes were stained with antibodies specific for H-2Db or H-2Kb, fixed and analyzed with flow cytometry. The washing, staining and fixing procedure created a time frame of about 3 hours between the end of the peptide incubation and the analysis. Thus, the measured affinities also reflected a measurement of peptide stability over three hours. Figure 14 shows the mean fluorescent intensities for each peptide and each peptide concentration when stained for H-2Kb (Figure 14A) and H-2Db (Figure 14B). Cell fixation did not influence the viability of the cells and no significant unspecific antibody binding could be detected (data not shown). Peptide controls with high affinity showed a higher affinity compared to the tested peptides, the low affinity peptide P18I10 for H-2Kb showed no binding affinity, SIINFEKL for H-2Db a weak binding affinity (data not shown). It has to be noted that the gp33 used in this study had a Met at position 9. This mutated version of gp33 has been used in many studies to prevent the formation of cystein dimers between the synthetic peptides. It has been previously shown that the mutation to Met increases the binding affinity compared to the wild type (IC50 for the mutant is ca 260 times lower) [54]. Binding affinity is usually determined as the concentration in nM where half maximum mean fluorescent intensity is reached (IC50). This could not be done with the present data since plateaus were not reached at the lowest and at the highest peptide concentrations. Thus the endpoints (minimal and maximal binding) could not be determined. However, the present data allowed for some preliminary conclusions. In case of H-2Kb staining, gp33 showed a similar high binding affinity as gp33long. For the mutants V3L and F6L no binding affinity could be detected. For the mutant Y4F, the binding affinity was only slightly lower compared to the wild type. In case of H-2Db staining it was more difficult to draw a conclusion with the present data since the endpoint plateaus were clearly missing. Yet one could see that the binding affinity of gp33long wild type and mutants were similar for every peptide concentration and the mutations did not seem not to impair peptide binding.
20

A B
Figure 14. RMA-S binding assays. 5x10⁵ RMA-S cells were incubated with peptides in the concentrations of 10-9 M to 10-5 M at 26°C for 12h at 26°C and stained with A) H-2Kb specific antibody and B) with H-2Db specific antibody. The time frame between the end of the peptide incubation and the analysis was about three hours.
21

5. Discussion 5.1 Binding affinity of LCMV-derived peptides to MHC-I
It has been demonstrated by van der Burg et al. [68] that for peptides with intermediate or low affinity to MHC-I the immunogenicity of the peptides correlates better with pMHC-I stability while for peptides with a high affinity to MHC-I, both, affinity and stability correlate well with immunogenicity. To get a better idea of the immunogenicity of intermediate/low affine peptide it is therefore imperative to test the peptide stability by measuring the peptide affinity at several time points after peptide incubation. In the RMA-S binding assays I performed, three hours were necessary between the end of the peptide incubation and the analysis of the RMA-S binding assay. Hence, a measured binding affinity also implyed a stability of the pMHC-I complex (here about three hours) and low or no binding affinities measured could be due to low pMHC-I complex stabilities. A more direct approach to determine the immunogenicity of a pMHC-I complex would be to test the effector function of T cells incubated with cells presenting the pMHC-I including T cell proliferation, cytotoxicity cytokine production. 5.2 LCMV immune escape from CD8+ T cell recognition The preliminary RMA-S binding assay revealed that the affinity in case of the F6L mutation of gp33long in context of H-2Kb reduced the peptide binding affinity. This has also be observed for gp33(F6L) [69]. Structural analysis of gp33(F6L) has revealed that the F6L mutation changes the bulky main anchor residue Phe (position 6) to a shorter less bulky residue that is less well accommodated in the pocket [69]. This can also be expected for gp33long since gp33 and gp33long have a very similar conformation at position 6 (Figure 15, left picture). However, this needs to be demonstrated with structural data. In case of the mutation Y4F the binding affinity of gp33long to H-2Kb was not impaired, while in case of V3L the binding affinity was impaired. For gp33 the mutations Y4F as well as V3L have not resulted in impaired binding affinity to H-2Kb, since no significant changes of the peptide conformation in the cleft could be seen [69]. It is suprising that in case of gp33long(V3L) the binding affinity was impaired since in case of gp33long wild-type the structure showed a very similar conformation in the N-terminal part of the peptide when compared with gp33 (Figure 15, left picture). In case of gp33long when bound to H-2Db the preliminary RMA-S assay showed that none of the mutations impaired the binding affinity. In case of gp33, mutation of the secondary anchor residue Val to a larger Leu has been shown to cause a movement of the peptide to the α1 domain resulting in a slightly reduced binding affinity [69]. No significant changes of the binding affinity have been detected for the gp33 mutations Y4F and F6L [69]. That the binding affinity of gp33long variant peptides to H-2Db was not impaired similarly to those of the gp33 variant peptides again accounted for the similarity of the gp33long wild-type structure when compared to gp33 in the region of the mutations [unpublished data] (Figure 15, right picture).
22

Figure 15. Superimposed side views of the peptides, gp33 colored in ochre, (crystal structure solved by Achour et al. [2]) and gp33long colored in turquoise, (crystal structures solved by Dr. Daniel Badia-Martinez and Dr. Rosmarie Friemann, unpublished data) when bound to H-2Kb (left picture) and H-2Db(right picture). 5.3 Mimicry between self-peptides and LCMV-derived peptides The comparison of the structures of the murine self-peptide TNFR1 (FGPSNWHFM) and the immunodominant LCMV epitope np396 (FQPQNGQFI) revealed that both peptides bound in a very similar conformation to H-2Db. This conformation has been shown to be common to all H-2Db restricted peptides [17]. TNFR1 was accommodated with the N-terminus deeper in the cleft compared to np396 due to less conformational restrictions of a more flexible Gly at position 2 compared to Gln of np396. This might be the reason for the higher binding affinity of TNFR1 to H-2Db compared to np396 as determined by Hudrisier et al. [28]. Large differences could be observed for the potential TCR contact residues of TNFR1 and np396. These differences included the additional bulky residues Trp (position 6) and His (position 7) in case of TNFR1. These residues probably sterically hindered the np396-specific TCR interaction and therefore the pMHC-TCR complex stability. These rather large differences of the pMHC surface of TNFR1 compared to np396 reflect the impaired T cell activity of the np396 specific T cell clone NP18 and polyclonal T cells specific for LCMV np396 when interacting with TNFR1 observed by Hudrisier et al. [28]. No significant T cell activation (T cell proliferation, IFN-γ production, cytotoxicity) of LCMV-np396 specific T cells has been observed [28]. Instead TNFR1 has appeared to act as an antagonist peptide in lysis by np396 specific CTLs [28]. The mechanisms determining the agonistic or antagonistic activity of a peptide are still not known. Furhermore, no structural correlation for agonist versus antagonist peptides could be drawn so far [58]. The finding that the pMHC-I surface was largely changed in case of TNFR1 compared to np396 suggested a TCR-pMHC interaction of low stability and affinity which has been described to be typical of peptides playing a role in positive selection of antigen specific T cells (here np396 specific T cells) [25]. A role for TNFR1 in positive selection is supported by the fact that the TNFR-I protein is highly expressed in the thymus, the
23

spleen and the liver and presented in high levels on H-2b splenocytes [41]. To see in which way the virus epitope specific TCR is able to interact with a changed pMHC interface, it would be ideal to have pMHC-TCR crystal structures.
24

25
6. Materials and Methods
6.1 Strains, cell lines and culture conditions
Escherichia coli
Escherichia coli (E. coli) BL21(DE3)•pLysS (Invitrogen) had been transformed with pET3a
(Invitrogen) encoding H2-Db, H2-K
b or murine beta2microglobulin (m 2m), respectively
(Table 4).
Table 4. Strains, prophages and plasmids
Strain, prophage or plasmid Relevant properties
E. coli BL21 F- ompT hsdSB (rB-mB
-) gal dcm
DE3a defective prophage; T7 rpo under lac UV5 promoter
pLysSb T7 lysS, Cam
R; p15A origin
pET3aH2-Db, c,d
encodes H2-Db, Amp
R; pBR322 origin
pET3aH2-Kb,c,e
encodes H2-Kb, Amp
R; pBR322 origin
pET3am 2mc
encodes m 2m, AmpR; pBR322 origin
aThe
overexpression of the lac repressor leads to repression of T7 promoter driven expression from transformed
plasmids until Isopropyl -D-1-thiogalactopyranoside (IPTG) induction of T7 RNA polymerase from a lac
promoter. bT7 lysogen reduces basal expression of recombinant proteins by inhibiting basal levels of T7 RNA
polymerase. c
T7 promotor driven recombinant gene expression. d,e
The first 276 residues (the extracellular
domains) of murine H-2Db and H-2K
b, respectively are encoded.
Bacteria were cultured in Luria-Bertani (LB) medium at 37°C while shaking at 200 rpm. To select for E. coli containing the pLysS and the pET3a plasmids, 37 mg/l chloramphenicol and 50 mg/l ampicillin were added to the medium. 50 μl of an E. coli glycerol stock were precultured over night in a 20 ml culture and then grown in a 1 l culture to an optical density measured at 600 nm (OD600) of 0.6 to 0.7. Protein production under control of the T7 promotor was induced with IPTG (final concentration 1 mM) for 3 to 4 hours. The method
was adapted from Garboczi et al. [24].
RMA-S cells
RMA-S is a H-2b restricted (expression of H-2D
b and H-2K
b) murine lymphoma cell line.
Because of the lack of the transporter associated with peptide processing (TAP)-2, RMA-S
cells express empty H-2b molecules on the surface but the MHC-I molecules become rapidly
unstable at 37°C [42]. However, surface expression of MHC-I molecules can be upregulated
(stabilized) by growing the cells at reduced temperatures (optimum 26°) for 12 hours and by
adding peptides exogenously [42,65]. Cells were cultured in an incubator at 37°C and 4% CO2
pressure in RPMI 1640 medium (Gibco) with 1% L- glutamine (Sigma), 10% fetal calf serum
(Sigma) and 1% penicillin/streptomycin (Sigma).

6.2 Peptides
Peptides were purchased from GenScript, the purity was higher than 90% (Table 5). For functional assays, peptides were dissolved first in dimethylsulfoxid (DMSO) to a concentration of 10-2 M and then in sterile water to a concentration of 10-4 M. Dissolved peptides were stored at -20°C. Table 5. Peptide name, origin, sequence and molecular weight (MW)
Peptide name and origin Sequence MW [g/mol] LCMV gp-(33-42) KAVYNFATM 1016.1770 LCMV gp-(33-43) KAVYNFATCGI 1186.3878 LCMV gp-(33-43) (V3L) KALYNFATCGI 1200.4147 LCMV gp-(33-43) (Y4F) KAVFNFATCGI 1170.3884 LCMV gp-(33-43) (F6L) KAVYNLATCGI 1152.3706 Murine RPP KAIYRFNAI 1095.3100 Murine TNFR1-(302-310) FGPSNWHFM 1122.2700 Human Immunodeficiency Virus P18I10 RRGPGRAFVTI 1073.2600 Influenza Virus np-(366-374) ASNENMETM 1026.0986 Chicken Ovalbumin SIINFEKL 963.1388
6.3 Purification of proteins from inclusion bodies To isolate the inclusion bodies from cellular compartments, the cells were centrifuged at 8000xg for 30 min at 4°C. The pellet was resuspended in STET lysis buffer (50 mM TrisHCl (pH 8.0), 25 % (w/v) sucrose, 1 mM EDTA (pH 8.0)), 1 mM phenylmethane sulphonylfluoride (PMSF, serine protease inhibitor) and 2 mM dithiothreitol (DTT, dissolved in 0.01 M Na acetate, pH 5.2, sterilization by filtration). The solution was frozen at -20°C and thawed at 37°C in a water bath. Cells were lyzed mechanically by freeze-thawing three times with liquid nitrogen. Furthermore, 20 mg lysozyme was added and the solution was incubated 30 min at 4°C. Then 0.42 mg DNase (pancreatic DNase dissolved in 0.15 M NaCl and 50% glycerol), 0.42 mmol MgCl2 and 0.042 mmol MnCl2 were added and the sample was incubated for 30 min at room temperature. The solution was then sonicated in short bursts three times for 1 min with an amplitude of 8 µm. Then the solution was centrifuged 10 min at 8000xg at 4°C and the supernatant was removed. The pellet was resuspended in 20 ml detergent buffer (0.2 M NaCl, 1% sodium deoxycholate (w/v), 1% Nonidet P40 (v/v), 20 mM TrisHCl (pH 7.5), 2 mM EDTA (pH 8.0), sterilization by filtration), 0.04 mmol DTT and 0.02 mmol PMSF. After an incubation for 10 min at room temperature the solution was centrifuged for 20 min at 8000xg at 4°C. The supernatant was removed carefully and the pellet was washed twice by carefully resuspending in 24 ml Triton X-100 buffer (0.5% Triton X-100, 50 mM TrisHCl (pH 8.0), 100 mM NaCl, 1 mM EDTA (pH 8.0), sterilization by filtration) and 0.048 mmol DTT and spinning for 20 min at 8000xg at 4°C. After the washing procedure the membrane fraction was completely solubilized and the proteins left in the pellet. The pellet was resuspended in 24 ml resuspension buffer (8 M urea) and frozen at -20°C. 8M The protein suspension was aliquoted in 1 ml aliqots, centrifuged at 13000xg at 4°C for 1
26

min to remove the debris, and the supernatant containing the protein was stored at -20°C. The method was adapted from Garboczi et al. [24]. 6.4 Refolding of murine pMHC-I complexes by rapid dilution The refolding buffer used for pMHC refolding consisted of 100 ml TrisHCl (pH 7.5), 84.28 g L-arginine, 4 mM EDTA, 3.03 g gluthation (oxidized form), 1.54 g gluthation (reduced form), 0.5 mM PMSF and ddH2O (total volume 1 l); it was filtered and stored at 4°C. First 10 mg peptide and 24 mg murine β2m where added, then after 30 min incubation, 30 mg heavy chain (total protein concentration: 64 µg/ml). In case of the refolding leaded to low yields of correctly folded protein the refolding was repeated using a double amount of mβ2m. Each component was added quickly to the refolding buffer using a 1000 µl pipette while mixing rapidly, such that in a very short period of time, the concentrations of both the protein and denaturant decreased rapidly (refolding by rapid dilution). The refolding mixture was incubated for 72 hours while mixing rapidly at 4 °C. Thereafter the sample was filtered (pore size 0.45 µm). If the filter got clogged due to aggregates, the refolding mixture was first centrifuged for 30 min at 8000xg and 4 °C. 6.5 Protein concentration For the concentration of large volumes of protein solutions (1 l) a tangential concentration machine was used with a filter pore size of 3 kDa. Always a retentate volume of 25 ml containing compounds bigger then 3 kDa was recovered and the system was washed once with another 25 ml of the filtrate. Before using the concentration machine it was cleaned 12 h with 0.15 M NaOH and three times for 20 min with distilled water. To concentrate volumes in the range of 2 to 15 ml, Centriprep centrifugal filter devices with a molecular weight limit of 10 kDa (Millipore Corp., device YM-10) were used which allow a concentration up to a volume of 0.6 to 0.7 ml. To concentrate starting volumes of up to 3.5 ml, Microsep centrifugal devices (PALL corp.) with a molecular weight limit of 10 kDa were used. Those devices allow a concentration up to a volume of 35 µl. The concentration was done in a swinging-bucket rotor centrifuge at a maximal speed of 2500xg. 6.6 Reducing sodium dodecyl sulfate polyacrylamide gel electrophoresis For sodium dodecyl sulfate polyacrylamide gel electrophoresis (SDS-PAGE), protein samples were mixed with 2x reducing Laemmli sample buffer consisting of 5% sodium dodecyl sulphate (SDS), 10% β-mercaptoethanol, 20% glycerol, 0.1% bromphenol blue and 100 mM TrisHCl (pH 6.8). Also 7 µl of a premixed mass standard (PageRuler, prestained protein ladder plus, Fermentas) was loaded additionally to the samples. The
27
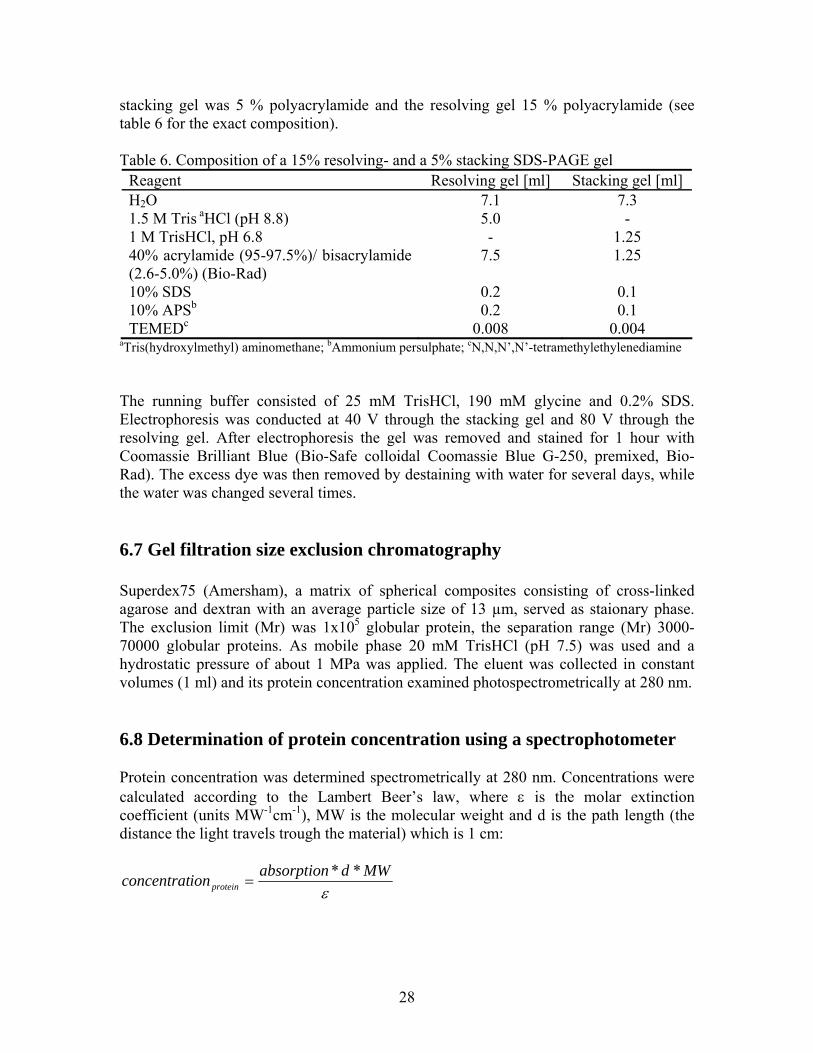
stacking gel was 5 % polyacrylamide and the resolving gel 15 % polyacrylamide (see table 6 for the exact composition). Table 6. Composition of a 15% resolving- and a 5% stacking SDS-PAGE gel
Reagent Resolving gel [ml] Stacking gel [ml] H2O 7.1 7.3 1.5 M Tris aHCl (pH 8.8) 5.0 - 1 M TrisHCl, pH 6.8 - 1.25 40% acrylamide (95-97.5%)/ bisacrylamide (2.6-5.0%) (Bio-Rad)
7.5 1.25
10% SDS 0.2 0.1 10% APSb 0.2 0.1 TEMEDc 0.008 0.004
aTris(hydroxylmethyl) aminomethane; bAmmonium persulphate; cN,N,N’,N’-tetramethylethylenediamine The running buffer consisted of 25 mM TrisHCl, 190 mM glycine and 0.2% SDS. Electrophoresis was conducted at 40 V through the stacking gel and 80 V through the resolving gel. After electrophoresis the gel was removed and stained for 1 hour with Coomassie Brilliant Blue (Bio-Safe colloidal Coomassie Blue G-250, premixed, Bio-Rad). The excess dye was then removed by destaining with water for several days, while the water was changed several times. 6.7 Gel filtration size exclusion chromatography Superdex75 (Amersham), a matrix of spherical composites consisting of cross-linked agarose and dextran with an average particle size of 13 µm, served as staionary phase. The exclusion limit (Mr) was 1x10⁵ globular protein, the separation range (Mr) 3000-70000 globular proteins. As mobile phase 20 mM TrisHCl (pH 7.5) was used and a hydrostatic pressure of about 1 MPa was applied. The eluent was collected in constant volumes (1 ml) and its protein concentration examined photospectrometrically at 280 nm. 6.8 Determination of protein concentration using a spectrophotometer Protein concentration was determined spectrometrically at 280 nm. Concentrations were calculated according to the Lambert Beer’s law, where ε is the molar extinction coefficient (units MW-1cm-1), MW is the molecular weight and d is the path length (the distance the light travels trough the material) which is 1 cm:
εMWdabsorptionionconcentrat protein
**=
28
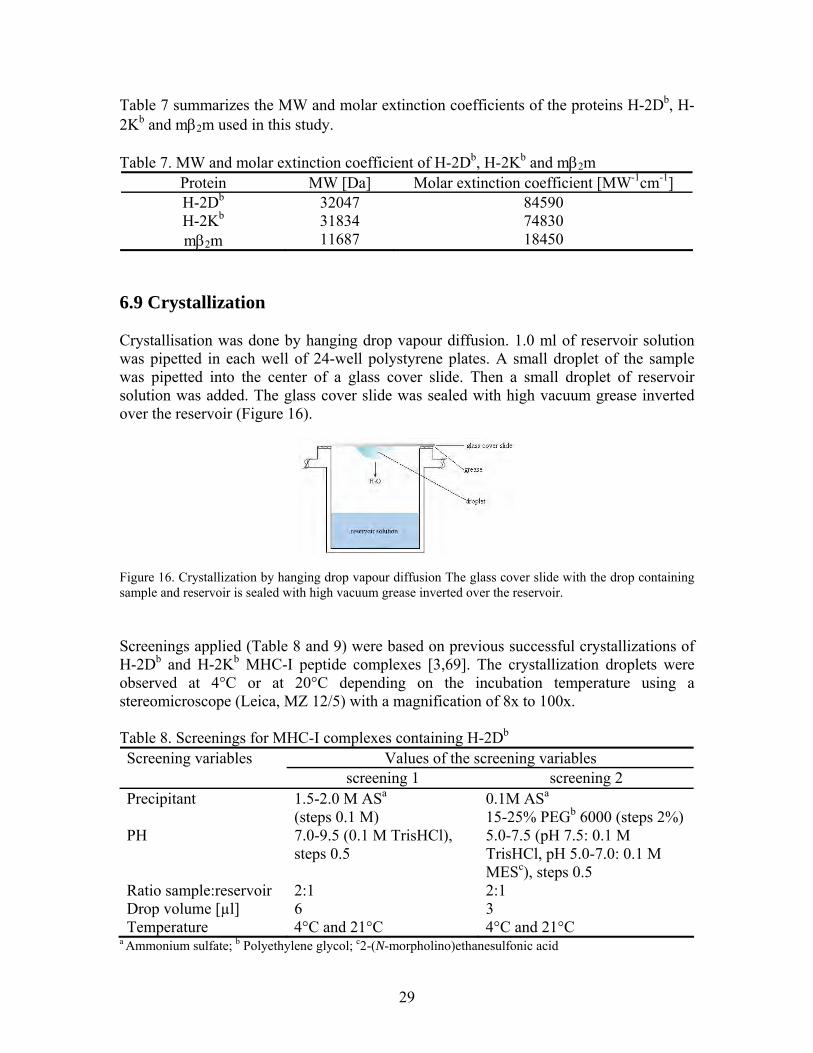
Table 7 summarizes the MW and molar extinction coefficients of the proteins H-2Db, H-2Kb and mβ2m used in this study. Table 7. MW and molar extinction coefficient of H-2Db, H-2Kb and mβ2m
Protein MW [Da] Molar extinction coefficient [MW-1cm-1] H-2Db 32047 84590 H-2Kb 31834 74830 mβ2m 11687 18450
6.9 Crystallization Crystallisation was done by hanging drop vapour diffusion. 1.0 ml of reservoir solution was pipetted in each well of 24-well polystyrene plates. A small droplet of the sample was pipetted into the center of a glass cover slide. Then a small droplet of reservoir solution was added. The glass cover slide was sealed with high vacuum grease inverted over the reservoir (Figure 16). Figure 16. Crystallization by hanging drop vapour diffusion The glass cover slide with the drop containing sample and reservoir is sealed with high vacuum grease inverted over the reservoir. Screenings applied (Table 8 and 9) were based on previous successful crystallizations of H-2Db and H-2Kb MHC-I peptide complexes [3,69]. The crystallization droplets were observed at 4°C or at 20°C depending on the incubation temperature using a stereomicroscope (Leica, MZ 12/5) with a magnification of 8x to 100x. Table 8. Screenings for MHC-I complexes containing H-2Db
Values of the screening variables Screening variables screening 1 screening 2
Precipitant 1.5-2.0 M ASa (steps 0.1 M)
0.1M ASa
15-25% PEGb 6000 (steps 2%) PH 7.0-9.5 (0.1 M TrisHCl),
steps 0.5 5.0-7.5 (pH 7.5: 0.1 M TrisHCl, pH 5.0-7.0: 0.1 M MESc), steps 0.5
Ratio sample:reservoir 2:1 2:1 Drop volume [µl] 6 3 Temperature 4°C and 21°C 4°C and 21°C
a Ammonium sulfate; b Polyethylene glycol; c2-(N-morpholino)ethanesulfonic acid
29

Table 9. Screenings for MHC-I complexes containing H-2Kb
Screening variables Values of the screening variables Precipitant 2.1- 2.7M NaH2PO4/K2HPO4 (steps 0.2)
1.5 or 2.0 % MPDa
PH 6.0-7.0 (steps 0.2) Ratio sample:reservoir 2:1 Drop volume (µl) 6 Temperature 4°C and 21°C
a2-Methyl-2,4-pentadiol 6.10 Cryoprotection and mounting of crystals in loops Crystals were fished with cryoloops (Hampton research) (size 0.05-0.3 mm). Crystals were then dipped in a cryo protectant solution of the same composition as the reservoir liquid where the crystal grew and additional 20% glycerol as cryoprotectant. Alternatively, crystals were transferred to cryprotectant solutions where the cryoprotectant concentration was incrementally increased in steps of 5%. Mounted crystals were transferred to liquid nitrogen (flash freezing) in cryo vial storage containers. 6.11 X-ray crystallography The Synchrotron source used for the experiments was the ESRF in Grenoble, France. The electric current was between 50 and 70 mA and the wavelength of the beam 0.934 Å. The crystals were centered within the beam with a high accuracy aided by a camera focused on the crystal and cooled with a cryogenic cooling device next to the beam. For data collection the crystal mounted in the loop was rotated about a single axis. The relative intensities of the reflections were recorded on a 2D screen with a charge coupled device (CCD) image sensor at every orientation of the crystal (images). First a small number of images (ca. four images) was collected to calculate a strategy for the data collection with the software MOSFLM [40]. With the software first the images were autoindexed i.e. the Miller indices (or, more correctly, their reciprocal lattice vector components) were identified from the known wavelength and the scattering angle 2θ. Also the size of the spots was identified. Then the possible space groups together with their unit cell parameters were listed and the most probable solution was suggested. With this space group, the unit cell was refined with the restrictions of the space group and the mosaicity was estimated. Finally MOSFLM suggested a strategy to collect a full data set including the crystal-to-detector distance, the rotation range, the width of the rotation range per individual exposure, and the exposure time for reach image. Then a full data set was collected, and all recorded images were indexed in order to process the data using MOSFLM. Then reflections appearing in several images were identified (merging) and the intensities were scaled to a consistent intensity scale with the XDS suite of programs [31]. The quality of measured intensity was always specified with the R-factor, which measures accuracy as a ratio mean difference between values which should be the same divided by the mean magnitude of the values. A small value for R indicates a high
30

accuracy. Rmerge was calculated during the process of merging the data from all the intensity measurements. The phase problem was solved with molecular replacement using a previously solved structure and the electron density was created. The electron density, together with supplementary data, allowed the mean atomic positions to be inferred. These data were combined computationally with chemical bonding restrains to produce and refine a model of the arrangement of atoms within the crystal. 6.12 Binding affinity of peptides to MHC-I molecules 5x10⁵ cells per well in 200 µl serum-free medium (AIMV, Gibco) were incubated with peptides (concentrations 10-5 M to 10-9 M) or without peptides (controls) in 96-well round-shaped bottom plates for 12 h at 26°C in an incubator with 4% CO2. Cells were then transferred to a flat-bottomed 96-well plate and washed two times with 200 µl serum-free medium (AIMV, Gibco) (centrifugation: 750xg). Cells were then incubated 1 h at 37°C and washed one time with 100 µl phosphate buffered saline buffer (PBS, 137 mM NaCl, 10 mM NaHPO4, 1.4 mM KH2PO4, 2.7 mM KCl, pH 7.4 adjusted with HCL). Remaining surface MHC-I molecules were stained with fluorescein isothiocyanate (FITC)-conjugated monoclonal mouse antibodies (2 mg in 50 µl PBS) specific for H-2Db (KH95, BD Bioscience,) and H-2Kb (AF6-88.5, BD Bioscience), respectively. To test for unspecific antibody binding cells without peptide were incubated with PBS but without antibody. After incubation for 30 min at 4°C in the dark, cells were washed two times with 100 µl PBS. Cells were fixed with 75 µl PBS and 25 µl Cytofix/Cytoperm (BD Bioscience) after washing and transferred into vials. To test the influence of the fixing on the cells, cells without peptide and antibody were not fixed but 100 µl PBS was added. Cells were stored at 4°C in the dark until stained MHC-I molecules on the cell surface were quantified within 12 h by flow cytometric analysis. Passing through a set of laser beams single cells were analyzed for the size (forward light scatter (FSC)), granularity (sideward light scatter (SSC)) and protein expression (emission of light by laser-activated FITC), respectively. The optical readout from analyzed cells was converted to digital information in a detector system and was visualized and analyzed using the software CellQuest Pro. The flow cytometer used for the experiments was the FACScan (Becton Dickinson).
31

7. Acknowledgements I would like to thank Dr. A. Achour for giving me the opportunity to do my Master’s thesis in his group on very interesting projects. I would like to thank him also for being very helpful with all my questions, for the ice creams and the fun we had in the office. I also would like to thank Dr. Daniel Badia-Martinez for the amazing time we had in the lab with the science and without and for patiently teaching me numerous techniques and answering all of my questions and not to forget- for teaching me Catalan! I also would like to thank Dr. M. Uhlin for helping me with the functional assays. And last but not least I want to thank Dr. B. Chambers, M. Norström and A. Duru as well as all people working in the groups of Prof. K. Kärre, Dr. P. Höglund and Dr. L. Szekely for all the good time during my project.
32

8. References 1. Achour, A.: Major Histocompatibility Complex: Interaction with Peptides.
Encyclopedia of Life Sciences, Mc Millan References Ltd, Grove´s Dictionaries, Nature Publications. 2001.
2. Achour, A., Michaelsson, J., Harris, R. A., Ljunggren, H. G., Karre, K., Schneider, G., Sandalova, T.: Structural basis of the differential stability and receptor specificity of H-2Db in complex with murine versus human beta2-microglobulin. J Mol Biol 2006;356:382-396.
3. Achour, A., Michaelsson, J., Harris, R. A., Odeberg, J., Grufman, P., Sandberg, J. K., Levitsky, V., Karre, K., Sandalova, T., Schneider, G.: A structural basis for LCMV immune evasion: subversion of H-2D(b) and H-2K(b) presentation of gp33 revealed by comparative crystal structure.Analyses. Immunity 2002;17:757-768.
4. Aebischer, T., Moskophidis, D., Rohrer, U. H., Zinkernagel, R. M., Hengartner, H.: In vitro selection of lymphocytic choriomeningitis virus escape mutants by cytotoxic T lymphocytes. Proc Natl Acad Sci U S A 1991;88:11047-11051.
5. Allen, T. M., Yu, X. G., Kalife, E. T., Reyor, L. L., Lichterfeld, M., John, M., Cheng, M., Allgaier, R. L., Mui, S., Frahm, N., Alter, G., Brown, N. V., Johnston, M. N., Rosenberg, E. S., Mallal, S. A., Brander, C., Walker, B. D., Altfeld, M.: De novo generation of escape variant-specific CD8+ T-cell responses following cytotoxic T-lymphocyte escape in chronic human immunodeficiency virus type 1 infection. J Virol 2005;79:12952-12960.
6. Bachmaier, K., Pummerer, C., Kozieradzki, I., Pfeffer, K., Mak, T. W., Neu, N., Penninger, J. M.: Low-molecular-weight tumor necrosis factor receptor p55 controls induction of autoimmune heart disease. Circulation 1997;95:655-661.
7. Bachmann, M. F., Speiser, D. E., Zakarian, A., Ohashi, P. S.: Inhibition of TCR triggering by a spectrum of altered peptide ligands suggests the mechanism for TCR antagonism. Eur J Immunol 1998;28:3110-3119.
8. Bertoletti, A., Sette, A., Chisari, F. V., Penna, A., Levrero, M., De Carli, M., Fiaccadori, F., Ferrari, C.: Natural variants of cytotoxic epitopes are T-cell receptor antagonists for antiviral cytotoxic T cells. Nature 1994;369:407-410.
9. Bjorkman, P. J., Saper, M. A., Samraoui, B., Bennett, W. S., Strominger, J. L., Wiley, D. C.: The foreign antigen binding site and T cell recognition regions of class I histocompatibility antigens. Nature 1987;329:512-518.
10. Bjorkman, P. J., Saper, M. A., Samraoui, B., Bennett, W. S., Strominger, J. L., Wiley, D. C.: Structure of the human class I histocompatibility antigen, HLA-A2. Nature 1987;329:506-512.
11. Borrow, P., Lewicki, H., Wei, X., Horwitz, M. S., Peffer, N., Meyers, H., Nelson, J. A., Gairin, J. E., Hahn, B. H., Oldstone, M. B., Shaw, G. M.: Antiviral pressure exerted by HIV-1-specific cytotoxic T lymphocytes (CTLs) during primary infection demonstrated by rapid selection of CTL escape virus. Nat Med 1997;3:205-211.
12. Borrow, P., Shaw, G. M.: Cytotoxic T-lymphocyte escape viral variants: how important are they in viral evasion of immune clearance in vivo? Immunol Rev 1998;164:37-51.
33

13. Chayen, N. E.: Methods for separating nucleation and growth in protein crystallisation. Prog Biophys Mol Biol 2005;88:329-337.
14. Christen, U., von Herrath, M. G.: Induction, acceleration or prevention of autoimmunity by molecular mimicry. Mol Immunol 2004;40:1113-1120.
15. Ciatto, C., Tissot, A. C., Tschopp, M., Capitani, G., Pecorari, F., Pluckthun, A., Grutter, M. G.: Zooming in on the hydrophobic ridge of H-2D(b): implications for the conformational variability of bound peptides. J Mol Biol 2001;312:1059-1071.
16. Cresswell, P.: Antigen processing and presentation. Immunol Rev 2005;207:5-7. 17. Falk, K., Rotzschke, O., Stevanovic, S., Jung, G., Rammensee, H. G.: Allele-
specific motifs revealed by sequencing of self-peptides eluted from MHC molecules. Nature 1991;351:290-296.
18. Ford, M. L., Evavold, B. D.: Degenerate recognition of T cell epitopes: impact of T cell receptor reserve and stability of peptide:MHC complexes. Mol Immunol 2004;40:1019-1025.
19. Fourneau, J. M., Bach, J. M., van Endert, P. M., Bach, J. F.: The elusive case for a role of mimicry in autoimmune diseases. Mol Immunol 2004;40:1095-1102.
20. Fremont, D. H., Matsumura, M., Stura, E. A., Peterson, P. A., Wilson, I. A.: Crystal structures of two viral peptides in complex with murine MHC class I H-2Kb. Science 1992;257:919-927.
21. G.J. Kleywegt & T.A. Jones (1994). A super position. CCP4/ESF-EACBM Newsletter on Protein Crystallography 31, N., pp. 9-14: 1994.
22. Gairin, J. E., Mazarguil, H., Hudrisier, D., Oldstone, M. B.: Optimal lymphocytic choriomeningitis virus sequences restricted by H-2Db major histocompatibility complex class I molecules and presented to cytotoxic T lymphocytes. J Virol 1995;69:2297-2305.
23. Garboczi, D. N., Biddison, W. E.: Shapes of MHC restriction. Immunity 1999;10:1-7.
24. Garboczi, D. N., Hung, D. T., Wiley, D. C.: HLA-A2-peptide complexes: refolding and crystallization of molecules expressed in Escherichia coli and complexed with single antigenic peptides. Proc Natl Acad Sci U S A 1992;89:3429-3433.
25. Goldrath, A. W., Bevan, M. J.: Selecting and maintaining a diverse T-cell repertoire. Nature 1999;402:255-262.
26. Hennecke, J., Wiley, D. C.: T cell receptor-MHC interactions up close. Cell 2001;104:1-4.
27. Hudrisier, D., Oldstone, M. B., Gairin, J. E.: The signal sequence of lymphocytic choriomeningitis virus contains an immunodominant cytotoxic T cell epitope that is restricted by both H-2D(b) and H-2K(b) molecules. Virology 1997;234:62-73.
28. Hudrisier, D., Riond, J., Burlet-Schiltz, O., von Herrath, M. G., Lewicki, H., Monsarrat, B., Oldstone, M. B., Gairin, J. E.: Structural and functional identification of major histocompatibility complex class I-restricted self-peptides as naturally occurring molecular mimics of viral antigens. Possible role in CD8+ T cell-mediated, virus-induced autoimmune disease. J Biol Chem 2001;276:19396-19403.
29. Iversen, A. K., Stewart-Jones, G., Learn, G. H., Christie, N., Sylvester-Hviid, C., Armitage, A. E., Kaul, R., Beattie, T., Lee, J. K., Li, Y., Chotiyarnwong, P.,
34

Dong, T., Xu, X., Luscher, M. A., MacDonald, K., Ullum, H., Klarlund-Pedersen, B., Skinhoj, P., Fugger, L., Buus, S., Mullins, J. I., Jones, E. Y., van der Merwe, P. A., McMichael, A. J.: Conflicting selective forces affect T cell receptor contacts in an immunodominant human immunodeficiency virus epitope. Nat Immunol 2006;7:179-189.
30. Janeway, C. A., Jr., Travers, P., Walport, M., Shlomchik, M.J.: Immunobiollogy: the immune system in health and disease. Garland Science Publishing, 2005.
31. Kabsch, W.: Automatic processing of rotation diffraction data from crystals of initially unknown symmetry and cell constants. Journal of Applied Crystallography 1993;26:795-800.
32. Kalams, S. A., Johnson, R. P., Trocha, A. K., Dynan, M. J., Ngo, H. S., D'Aquila, R. T., Kurnick, J. T., Walker, B. D.: Longitudinal analysis of T cell receptor (TCR) gene usage by human immunodeficiency virus 1 envelope-specific cytotoxic T lymphocyte clones reveals a limited TCR repertoire. J Exp Med 1994;179:1261-1271.
33. Kersh, G. J., Allen, P. M.: Essential flexibility in the T-cell recognition of antigen. Nature 1996;380:495-498.
34. Klenerman, P., Meier, U. C., Phillips, R. E., McMichael, A. J.: The effects of natural altered peptide ligands on the whole blood cytotoxic T lymphocyte response to human immunodeficiency virus. Eur J Immunol 1995;25:1927-1931.
35. Klenerman, P., Rowland-Jones, S., McAdam, S., Edwards, J., Daenke, S., Lalloo, D., Koppe, B., Rosenberg, W., Boyd, D., Edwards, A., et al.: Cytotoxic T-cell activity antagonized by naturally occurring HIV-1 Gag variants. Nature 1994;369:403-407.
36. Klenerman, P., Zinkernagel, R. M.: What can we learn about human immunodeficiency virus infection from a study of lymphocytic choriomeningitis virus? Immunol Rev 1997;159:5-16.
37. Kleywegt, G. J., Jones, T.A.: A super position. CCP4/ESF-EACBM Newsletter on Protein Crystallography 1994;31:9-14.
38. Lanzavecchia, A., Lezzi, G., Viola, A.: From TCR engagement to T cell activation: a kinetic view of T cell behavior. Cell 1999;96:1-4.
39. Lawlor, D. A., Zemmour, J., Ennis, P. D., Parham, P.: Evolution of class-I MHC genes and proteins: from natural selection to thymic selection. Annu Rev Immunol 1990;8:23-63.
40. Leslie, A. G. W.: Recent changes to the MOSFLM package for processing film and image plate data CCP4/ESF-EACBM Newsletter on Protein Crystallography 1992;26.
41. Lewis, M., Tartaglia, L. A., Lee, A., Bennett, G. L., Rice, G. C., Wong, G. H., Chen, E. Y., Goeddel, D. V.: Cloning and expression of cDNAs for two distinct murine tumor necrosis factor receptors demonstrate one receptor is species specific. Proc Natl Acad Sci U S A 1991;88:2830-2834.
42. Ljunggren, H. G., Stam, N. J., Ohlen, C., Neefjes, J. J., Hoglund, P., Heemels, M. T., Bastin, J., Schumacher, T. N., Townsend, A., Karre, K., et al.: Empty MHC class I molecules come out in the cold. Nature 1990;346:476-480.
43. Loeb, D. D., Padgett, R. W., Hardies, S. C., Shehee, W. R., Comer, M. B., Edgell, M. H., Hutchison, C. A., 3rd: The sequence of a large L1Md element reveals a
35

tandemly repeated 5' end and several features found in retrotransposons. Mol Cell Biol 1986;6:168-182.
44. Lucas, M., Karrer, U., Lucas, A., Klenerman, P.: Viral escape mechanisms--escapology taught by viruses. Int J Exp Pathol 2001;82:269-286.
45. Masopust, D., Murali-Krishna, K., Ahmed, R.: Quantitating the magnitude of the lymphocytic choriomeningitis virus-specific CD8 T-cell response: it is even bigger than we thought. J Virol 2007;81:2002-2011.
46. Mazza, C., Auphan-Anezin, N., Gregoire, C., Guimezanes, A., Kellenberger, C., Roussel, A., Kearney, A., van der Merwe, P. A., Schmitt-Verhulst, A. M., Malissen, B.: How much can a T-cell antigen receptor adapt to structurally distinct antigenic peptides? Embo J 2007;26:1972-1983.
47. McKeithan, T. W.: Kinetic proofreading in T-cell receptor signal transduction. Proc Natl Acad Sci U S A 1995;92:5042-5046.
48. Moskophidis, D., Zinkernagel, R. M.: Immunobiology of cytotoxic T-cell escape mutants of lymphocytic choriomeningitis virus. J Virol 1995;69:2187-2193.
49. Ohashi, P. S.: T-cell signalling and autoimmunity: molecular mechanisms of disease. Nat Rev Immunol 2002;2:427-438.
50. Ohteki, T., Hessel, A., Bachmann, M. F., Zakarian, A., Sebzda, E., Tsao, M. S., McKall-Faienza, K., Odermatt, B., Ohashi, P. S.: Identification of a cross-reactive self ligand in virus-mediated autoimmunity. Eur J Immunol 1999;29:2886-2896.
51. Oldstone, M. B.: Molecular mimicry and autoimmune disease. Cell 1987;50:819-820.
52. Perarnau, B., Saron, M. F., San Martin, B. R., Bervas, N., Ong, H., Soloski, M. J., Smith, A. G., Ure, J. M., Gairin, J. E., Lemonnier, F. A.: Single H2Kb, H2Db and double H2KbDb knockout mice: peripheral CD8+ T cell repertoire and anti-lymphocytic choriomeningitis virus cytolytic responses. Eur J Immunol 1999;29:1243-1252.
53. Pircher, H., Moskophidis, D., Rohrer, U., Burki, K., Hengartner, H., Zinkernagel, R. M.: Viral escape by selection of cytotoxic T cell-resistant virus variants in vivo. Nature 1990;346:629-633.
54. Puglielli, M. T., Zajac, A. J., van der Most, R. G., Dzuris, J. L., Sette, A., Altman, J. D., Ahmed, R.: In vivo selection of a lymphocytic choriomeningitis virus variant that affects recognition of the GP33-43 epitope by H-2Db but not H-2Kb. J Virol 2001;75:5099-5107.
55. Read, R. J.: Pushing the boundaries of molecular replacement with maximum likelihood. . Acta Crystallographica 2001;D57:1373-1382.
56. Rossmann, M. G., Arnold, E. : International Tables for Crystallography. Volume F, Crystallography of biological molecules. Dordrecht: Kluwer Academic Publishers, for the International Union of Crystallography, 2001.
57. Rouse, B. T., Deshpande, S.: Viruses and autoimmunity: an affair but not a marriage contract. Rev Med Virol 2002;12:107-113.
58. Rudolph, M. G., Stanfield, R. L., Wilson, I. A.: How TCRs bind MHCs, peptides, and coreceptors. Annu Rev Immunol 2006;24:419-466.
59. Saibil, S. D., Ohteki, T., White, F. M., Luscher, M., Zakarian, A., Elford, A., Shabanowitz, J., Nishina, H., Hugo, P., Penninger, J., Barber, B., Hunt, D. F.,
36

Ohashi, P. S.: Weak agonist self-peptides promote selection and tuning of virus-specific T cells. Eur J Immunol 2003;33:685-696.
60. Schodin, B. A., Tsomides, T. J., Kranz, D. M.: Correlation between the number of T cell receptors required for T cell activation and TCR-ligand affinity. Immunity 1996;5:137-146.
61. Storoni, L. C., McCoy, A. J., Read, R.J.: Likelihood-enhanced fast rotation functions. Acta Crystallographica 2004;D60:432-438.
62. Tester, I., Smyk-Pearson, S., Wang, P., Wertheimer, A., Yao, E., Lewinsohn, D. M., Tavis, J. E., Rosen, H. R.: Immune evasion versus recovery after acute hepatitis C virus infection from a shared source. J Exp Med 2005;201:1725-1731.
63. Tian, S., Maile, R., Collins, E. J., Frelinger, J. A.: CD8+ T Cell Activation Is Governed by TCR-Peptide/MHC Affinity, Not Dissociation Rate. J Immunol 2007;179:2952-2960.
64. Tissot, A. C., Ciatto, C., Mittl, P. R., Grutter, M. G., Pluckthun, A.: Viral escape at the molecular level explained by quantitative T-cell receptor/peptide/MHC interactions and the crystal structure of a peptide/MHC complex. J Mol Biol 2000;302:873-885.
65. Townsend, A., Ohlen, C., Bastin, J., Ljunggren, H. G., Foster, L., Karre, K.: Association of class I major histocompatibility heavy and light chains induced by viral peptides. Nature 1989;340:443-448.
66. Tynan, F. E., Reid, H. H., Kjer-Nielsen, L., Miles, J. J., Wilce, M. C., Kostenko, L., Borg, N. A., Williamson, N. A., Beddoe, T., Purcell, A. W., Burrows, S. R., McCluskey, J., Rossjohn, J.: A T cell receptor flattens a bulged antigenic peptide presented by a major histocompatibility complex class I molecule. Nat Immunol 2007;8:268-276.
67. Valitutti, S., Muller, S., Cella, M., Padovan, E., Lanzavecchia, A.: Serial triggering of many T-cell receptors by a few peptide-MHC complexes. Nature 1995;375:148-151.
68. van der Burg, S. H., Visseren, M. J., Brandt, R. M., Kast, W. M., Melief, C. J.: Immunogenicity of peptides bound to MHC class I molecules depends on the MHC-peptide complex stability. J Immunol 1996;156:3308-3314.
69. Velloso, L. M., Michaelsson, J., Ljunggren, H. G., Schneider, G., Achour, A.: Determination of structural principles underlying three different modes of lymphocytic choriomeningitis virus escape from CTL recognition. J Immunol 2004;172:5504-5511.
70. Williams, M. A., Bevan, M. J.: Effector and memory CTL differentiation. Annu Rev Immunol 2007;25:171-192.
71. Wucherpfennig, K. W.: Insights into autoimmunity gained from structural analysis of MHC-peptide complexes. Curr Opin Immunol 2001;13:650-656.
72. Yewdell, J. W., Bennink, J. R.: Immunodominance in major histocompatibility complex class I-restricted T lymphocyte responses. Annu Rev Immunol 1999;17:51-88.
73. Yewdell, J. W., Reits, E., Neefjes, J.: Making sense of mass destruction: quantitating MHC class I antigen presentation. Nat Rev Immunol 2003;3:952-961.
37

74. Young, A. C., Zhang, W., Sacchettini, J. C., Nathenson, S. G.: The three-dimensional structure of H-2Db at 2.4 A resolution: implications for antigen-determinant selection. Cell 1994;76:39-50.
75. Zinkernagel, R. M., Planz, O., Ehl, S., Battegay, M., Odermatt, B., Klenerman, P., Hengartner, H.: General and specific immunosuppression caused by antiviral T-cell responses. Immunol Rev 1999;168:305-315.
38

9 Appendix Table 10. Screening conditions (protein concentration, drop composition, reservoir composition) in which crystals of high quality of pMHC-I complexes were gained
pMHC-I
complex: heavy chain and peptide
Drop composition:
Protein concentration [mg/ml], ratio
sample:reservoir, drop volume [µl]
Reservoir composition and equilibration temperature
H-2Db
gp33long(F6L) 1.7, 2:1, 3 1.7, 1:1, 2
pH 6.0, 15-19% PEG 6000, 0.1 M ASb, 4 °C pH 5.8-6.2, 21.5-24% PEG 6000, 0.1 M AS, 4°C
H-2Db
gp33long(V3L) 2.2, 2:1, 3 2.2, 3:1, 4 1.3, 3:1, 4
pH 6.5-7.0, 21-23% PEG 6000, 0.1 M AS, 4°C pH 6.5-7.0, 23% PEG 6000, 0.1 M AS, 4°C pH 6.5, 23% PEG 6000, 0.1 M AS, 4°C
H-2Db
gp33long(Y4F) 3.4, 4:1, 5 1.1, 2:1, 3
pH 5.0-5.5, 17-21% PEG 6000, 0.1 M AS, 20°C pH 6.0, 15-21% PEG 6000, 0.1 M AS, 4°C
H-2Kb gp33long(V3L)
5.1, 3:1, 8 5.1, 2:1, 6
pH 7.0, 2.1 M NaH2PO4/K2HPO4, 1.5% MPDc, 4°C pH 7.0-7.2, 2.1-2.2 M NaH2PO4/K2HPO4, 2.0% MPD, 4°C
H-2Db
RPP 1.2, 2:1, 6 1.2, 2:1, 6
pH 7.0-9.5, 1.8-2.0 M AS, 20°C pH 8.5, 2.0 M AS, 4°C
H-2Db
TNFR1 1.7, 2:1, 6 1.7, 2:1, 6 1.7, 2:1, 3 1.7, 3:1, 4 1.7, 2:1, 3 1.7, 2:1, 3
pH 7.5, 2.0 M AS, 4°C pH 9.0-9.5, 1.8 M AS, 4°C pH 7.5, 23-25% PEG 6000, 0.1 M AS, 4°C pH 7, 21% PEG 6000, 0.1 M AS, 4°C pH 7.0-7.5, 21% PEG 6000, 0.1 M AS, 4°C pH 7.0, 15% PEG 6000, 0.1 M AS, 0.01 M BaCl-dihydrate, 4°C
a Polyethylene glycol; b Ammonium sulfate; c2-Methyl-2,4-pentadiol Table 11. Results for the molecular replacement search for H-2Db/TNFR1/mβ2m Search models
Rotation function (Euler angles)
Z-score (Rot. func.)
Translation function (fractionated coordinates)
Z-score (Transl. func.)
Likelihood gain
H-2Db domain α1-2
314.137 122.391 303.979
13.2 -0.38121 0.00132 -0.34624
11.9 292
Mβ2m 317.372 124.808 309.439
10.4 -0.39025 -0.00784 -0.35147
25.8 745
H-2Db domain α3
220.807 54.458 137.754
3.2 -0.10491 0.47925 -0.65925
16.2 954
Global Refinement likelihood gain: 2109
39

A)
B)
40

C)
Figure 17. Purification of the renatured gp33long variant peptides (gp33long(variants)) and the crossreactive peptides TNFR1 and RPP in complex with H-2Kb and H-2Db, respectively, and mβ2m (complexes: H-2Kb and H-2Db/peptides/mβ2m) from protein aggregates and mβ2m. Overlay of the size exclusion chromatograms showing protein absorption measured at 280 nm of the eluted fractions (red) and volume (black) after loading the concentrated renatured sample of A) the gp33long(variants) in complex with H-2Kb and mβ2m. B) the gp33long(variants) in complex with H-2Db and mβ2m and C) TNFR1, RPP and gp33long(Y4F) in complex with H-2Db and mβ2m. The fractions containing aggregated protein (A10-B12), the correctly folded pMHC-I (B11-B9), and mβ2m (B3-C5) are marked with arrows. Peptide gp33long(V3L): blue, drawn through; gp33long(F6L): pink, dashed; gp33long(Y4F): green, dot-dashed, TNFR1: black, drawn through, RPP: orange, drawn through.
41

A
B
C
D
42

43
re 19. Examples of crystals of high quality gained for pMHC-I complexes. A) H-
E
F
Figu2Db/gp33long(F6L)/mβ2m, B) H-2Db/gp33long(V3L)/mβ2m, C) H-2Db/gp33long(Y4F)/mβ2m, D) H-2Db/RPP/mβ2m, E) H-2Db/TNFR1/mβ2m, F) H-2Kb/gp33long(V3L)/mβ2m.