Embed Size (px)
Citation preview

Stresses in Yielding Soils Under Moving Wheels And Tracks D. R. FREITAG and S. J . KNIGHT, respectively, Chief, Mobility Section, and Chief, Army Mobility Research Center, Soils Division, U.S. Army Engineer Waterways Experiment Station, Vicksburg, Miss.
As part of the study of cross-country vehicular movement conducted.by the U. S. Army Engineer Waterways Experiment Station, research has been initiated to determine the nature of the interaction between a vehicle's traction elements and a yielding soil. In one phase of this work, pressure-sensitive cells have been embedded in soft soils to measure stress intensities Induced by vehicles moving on the surface of that mass. The work is complicated by problems of soil homogeneity, instrument reliability, and data interpretation, and by soil flow that results in displacement of the cells. Measurements have been made in soil beneath a pneumatic tire, a rigid wheel, and two types of crawler tracks. Results, although chiefly qualitative, provide some Insight into the manner in which vehicle stresses are transmitted to soft soils.
•THE KEYNOTE of present-day military planning is mobility—the quick, precise movement of forces on the ground and in the air. However, the mobility envisioned by military strategists is not of convoys moving along roads and aircraft operating from permanent airfields, but rather of vehicles moving freely over the landscape without dependence on previously constructed facilities. If this concept is to be realized, the Army must acquire the most agile, mobile, and versatile overland vehicles that can be devised.
Commercial interests have had very litUe motivation to develop vehicles with a high degree of cross-country mobility. Usually, it has been more practical and economical to build and improve roads than to Improve vehicles. Recently, however, mineral and oil exploration in northern tundra and muskeg regions, in tropical forests, and in desert sands has stimulated an interest in vehicles capable of operating in the most forbidding regions of the world.
Present-day vehicles have been designed by rule of thumb, by instinct, or from fragmentary theoretical concepts. A complete, rigorous statement of the fundamental principles that govern vehicular overland movement has not yet been formulated. Research studies that eventually will provide the basis for this formulation are being conducted by the Army Mobility Research Center (AMRC), a facility of the U. S. Army Engineer Waterways Experiment Station (WES). One phase of these studies involves the measurement of the stresses induced within a yielding soil mass by the passage of a vehicle.
To date, the stress measurement program has been chiefly exploratory. Wheels and traclcs of various types have been used to apply loads mainly on soft clay soils, and stresses have been measured with three different kinds of pressure-sensitive cells. Many problems of measurement and analysis have arisen; some of these seem to have been circumvented, whereas others remain annoyingly present. This paper describes the equipment and techniques employed in this study, some of the difficulties encountered, and the results obtained thus £a.r.
2k

25
SR-4 GAGES MERCURY CHAMBER
FLEXIBLE RIM FACE PLATE
GAGE CHAMBER
DIAPHRAGM
COVER PLATE
FLEXIBLE TUBING. STAINLESS STEEL RIBBON BRAND
TERMINAL STRIP
Figure 1. Schematic drawing, WES earth pressure cel l .
PRESSURE C E L L S
Types of Cells
The WES earth pressure cell (Fig. 1) is 6 in. in diameter and is fabricated from stainless steel. Basic components are a mercury-filled fluid chamber with diaphragm, and a full Wheatstone bridge circuit consisting of four SR-4 strain gages hermetically sealed within the cell. Pressure applied to the face plate of the cell is transmitted through the mercury in the fluid chamber to an internal flexible diaphragm and produces deflection of the diaphragm proportional to the load. The four SR-4 strain gages are mounted on the diaphragm and are actuated by its deflection. The full Wheatstone bridge circuit practically eliminates the effects of temperature and of resistance variations in the lead wires. The strain-gage readings are calibrated by applying known loads to the face plate of the cell. Generally, a 60-/i in. movement of the SR-4 strain gage corresponds to about a 1-psi load on the face plate of the cell. The cells are instrumented so that strain measurements are converted to stress and recorded directly in pounds per square inch on a direct-writing oscillograph. The ceUs used are rated at 50-psi capacity but can withstand somewhat larger pressures without damage.
The WES fluid pressure cell (Fig. 2) is a single-diaphragm type in which the diaphragm is directly exposed to the soil and deflects in proportion to the applied pressure. Four strain gages (Baldwin SR-4) are cemented to the interior side of the diaphragm so that two gages are in tension when the other two are in compression. The four gages are joined to a four-arm Wheatstone bridge circuit. Pressure applied to the cell results in a resistance change in the gages which is linearly proportional to the pressure. The resulting signal is amplified and recorded on suitable equipment. The location of the gages on the same diaphragm and within the same housing produces good temperature compensation. The cells are hermetically sealed to prevent moisture from entering and causing cell deterioration.
The C E C , type 4-312, pressure cell (Fig. 3) used in this study is a small, single-diaphragm, fluid pressure cell, hermetically sealed (absolute), manufactured by the Consolidated Electrodynamics Corporation of Pasadena, Calif. In this study the small V2 - in . diameter ceU was mounted in a 3-in. diameter cell mount to provide greater positional stability. Applied pressure deflects the diaphragm of the cell a small amoimt (0. 0008 in. maximum deflection) causing a star spring arm to move outward, which, in turn, causes the strain-sensitive wires to be distorted. The distortion (strain) of the wires causes a change in resistance which is translated by the amplifying and recording equipment into a record proportional to the distortion. Inactive strain-gage arms are

26
LOCATION OF STRAIN GAGES ON INSIDE OF DIAPHRAGM
TOP VIEW
DIAPHRAGM
N O T E :
D I A P H R A G M T H I C K N E S S V A R I E S W I T H P R E S S U R E R A N G E . D I A P H R A G M A N D H O U S I N G M A C H I N E D F R O M S O L I D S T O C K A N D T H I C K N E S S O F D I A P H R A G M C L O S E L Y C O N T R O L L E D .
D I A P H R A G M W I T H H O U S I N G H E A T -T R E A T E D A F T E R M A C H I N I N G .
BONDED STRAIN GAGES
SOLDER JOINT
7, 6 10-24 MACH SCREWS
SOLDER JOINT
3 SEALING CRIMPS I" f COPPER TUBING
SPIRAL-4 CABLE
SECTIONAL ELEVATION
Figure 2. WES fluid pressure ce l l .

27
PRESSURE
DIAPHRAGM
2 ACTIVE STRAIN GAGE ARMS
OVERPRESSURE STOP
4 STAR SPRING
2 INACTIVE STRAIN GAGE ARMS
PIN CONNECTOR
REFERENCE PORT-
NOTE ALL CELLS USED IN TRAFFICABILITY STUDIES ARE OF THE ABSOLUTE PRESSURE T Y P E - T H E REFERENCE PORT BEING HERMETICALLY SEALED.
Figure 3. Sectional view of CEC pressure ce l l .
mounted within the cell housing to compensate for temperature changes. The resistance arms are unbonded strain-gage windings connected internally in a four-arm Wheat-stone bridge (full bridge) circuit with two active arms.
Calibration of Pressure Cells
The pressure cells used in these tests were calibrated in a reinforced steel tank in which the air pressure is built up in controlled amounts. In the calibration procedure, the pressure measured by the cells Is indicated on a direct-writing oscillograph or Baldwin SR-4 strain indicator, and compared with the pressure read on the laboratory test gage. Where a recorder Is used, the gain of the amplifiers is adjusted so that the maximum range of the recording paper is equivalent to the maximum applied air pressure in the tank. This gain and resulting recorder indication can be reproduced in the field by means of calibrating resistors built into the amplifiers. When an SR-4 indicator Is used in the field, the pressure is calculated from the readings taken by the operator, using the calibration Victor obtained in the laboratory test.
With both the C E C and WES fluid pressure cells, the air pressure is applied directly to the cell diaphragm in the calibration tank. However, in most cases the WES earth pressure cells are calibrated in what is called a "double-diaphragm" test chamber. In this procedure the air pressure is applied to the earth pressure cell through two diaphragms, one on each side of the cell. This method applies the force, developed by the air pressure on the diaphragm, evenly across the two faces of the cell, thus closely simulating soil action on a cell installed underground.

28
T E S T CONDITIONS
Soil Preparation Tests were conducted on soils carefully placed in test pits. These pits were about
4 ft deep, approximately 50 ft long, and wide enough to Insure that the loaded area was at a distance at least twice its width from the edge of the pit. Most of the data have been obtained from tests conducted on a high-plasticity clay soil, but some are from tests on a low-plasticity clay and a clean sand. In all cases the test soil was built up uniformly in lifts. Water content was controlled to achieve the desired properties in the clay, and density was controlled in the air-dried sand.
Cell Installation After the test area was constructed, pressure cells were installed at various depths
along the centerline of the intended vehicle path and at prescribed offsets. The minimum horizontal spacing between cells was 1 ft. To install a cell at a given spot in the test area, a 7-in. diameter hole was dug to the desired depth. The cell was then placed (aligned horizontally or vertically) in the hole at a specified depth, after which the soil was replaced and compacted manually.
The position and movement of the cells were determined by making the following measurements before and after a test: (a) the north-south position ( i . e . , the station number) of the center of the cell; (b) the east-west horizontal offset distance from the centerline of the intended vehicle path to the center of the cell; and (c) the elevation of the center of the face of the cell, and of points (usually four) on the edge of horizontally placed cells.
Test Loads Loads were applied to the test soils by a variety of moving wheels and tracks. In
the early phases an actual vehicle was driven along a preselected path over the test area. These tests included runs with the M29C weasel, the E>4 and D7 engineer tractors, and an M135 2 Vz-ton truck with 11. 00-20 tires. Later a load cart guided by a rail system was used to operate a single rigid wheel or a single pneumatic-tired wheel.
• • • • 2 3 4 5 6 7 8
TEST WEIGHT = 5,640 LB CONTACT PRESSURE = I 8 PSI
7g"
WIDTH OF TRACK = 20" ,3- <i. TO (t OF TRACK = 45"
Figure U. Schematic diagram M29C weasel.
29
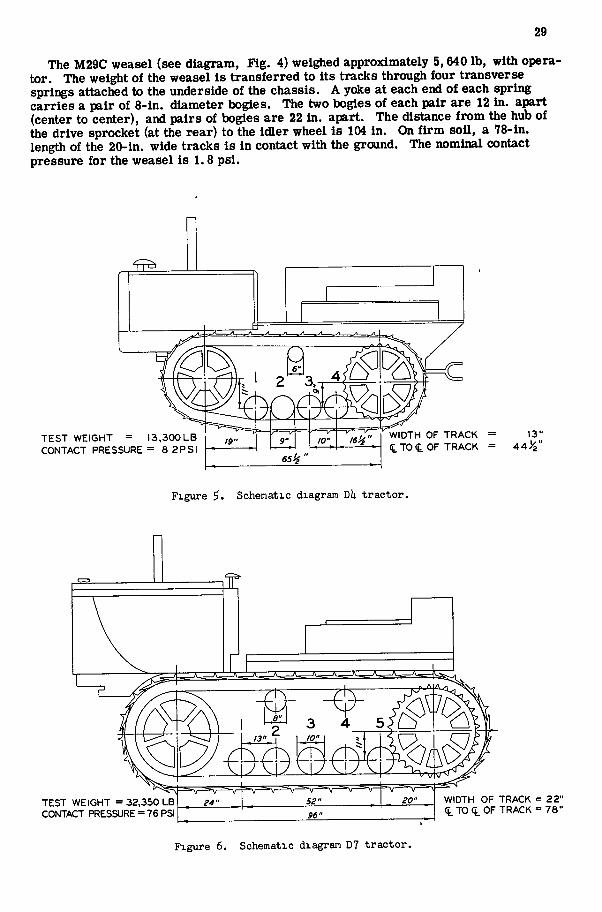
The M29C weasel (see diagram, Fig. 4) weighed approximately 5,640 lb, with operator. The weight of the weasel Is transferred to its tracks through four transverse springs attached to the underside of the chassis. A yoke at each end of each spring carries a pair of 8-in. diameter bogies. The two bogies of each pair are 12 in. apart (center to center), and pairs of bogies are 22 in. apart. The distance from the hub of the drive sprocket (at the rear) to the idler wheel is 104 in. On firm soil, a 78-in. length of the 20-in. wide tracks is in contact with the ground. The nominal contact pressure for the weasel is 1.8 psi.
TEST WEIGHT = I 3 , 3 0 0 L B CONTACT PRESSURE = 8 2 P S I
WIDTH OF TRACK <t. TO (£. OF TRACK
13"
Figure 5. Schematic diagram Dl* tractor.
TEST WEIGHT = 32.350 LB CONTACT PRESSURE = 76 PSI
14" 52" 96"
WIDTH OF TRACK = 22" <t.TO<t.OF TRACK = 7 8 "
Figure 6. Schematic diagram D7 tractor.

30
The D4 engineer tractor weighs 14,800 lb (with blade). This weight is distributed to the soil through tracks 13 in. wide and 64 in. long, resulting in a nominal contact pressure of 8.9 psi. The girder-type track system consists of a large drive sprocket (at the rear), a large idler wheel, and four 9-in. diameter unsprung track rollers on 10-in. centers. Each track pad is 7 in. long, with a grouser 1 Va in. high. Figure 5 shows the D4 tractor without the blade.
The D7 tractor weighs 32,400 lb, and each track is 22 in. wide by 96 in. long. Its nominal contact pressure (with blade) is 7.7 psi. The track system is generally similar to that of the D4. There are five 10-in. diameter track rollers spaced on 13-in.
\.— -^1
X \(— —
267'
J J TIRE SIZE= IIOOX 20 I TO t OF TIRE = 7I>S" AVa LQM) PER WHEEL" 2937 LB
Figure 7. Schematic diagram M135 2|-ton truck.
H 0 R I 2 0 N T A F O R C E C E L
Figure 8. Load cart.
31
centers. Each track pad is 8 in. long, and the grouser height is 2 In. A schematic drawing of the D7, without the blade, is shown in Figure 6.
The M135, 2 7a-ton, 6x6 cargo truck has single-tandem wheels equipped with 11. 00-20, 12-ply rating tires with nondirectional cross-country treads. A schematic diagram of this vehicle is shown in Figure 7. The truck was loaded with 5,000 lb of steel distributed uniformly over the truck bed. The gross weight of the vehicle was 17,600 lb. The front, front tandem, and rear tandem axles weighed 5,900, 5,600, and 6,100 lb, respectively. For the tests the tires were Inflated to 15 and 60 psl. At 15-psl inflation pressure the average contact pressure over the area of the total tire contact patch was 30.4 psi; and at 60-psi inflation pressure the average contact pressure was 52.3 psl.
The load cart used in these tests was designed to permit testing a single wheel isolated from the influence of a vehicular suspension system (Fig. 8). The mechanical arrangements of the cart are such that the wheel is free to move vertically (and to roll down the test section) and yet the horizontal and vertical forces on the wheel can be separated and measured. The cart has been used with a rigid wheel 48 in. in diameter and 6 in. wide, and with a buffed-smooth 11. 00-20 tire at several load and inflation pressures on a variety of soil surfaces.
SOURCES O F EXPERIMENTAL ERROR
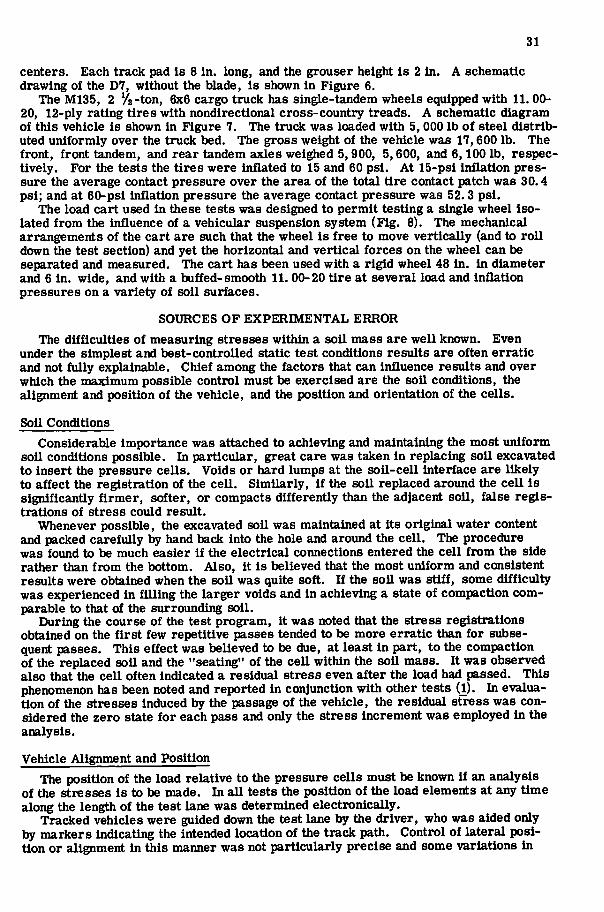
The difficulties of measuring stresses within a soil mass are well known. Even under the simplest and best-controlled static test conditions results are often erratic and not fully explainable. Chief among the factors that can influence results and over which the maximum possible control must be exercised are the soil conditions, the alignment and position of the vehicle, and the position and orientation of the cells.
Sou Conditions
Considerable Importance was attached to achieving and maintaining the most uniform soil conditions possible. In particular, great care was taken in replacing soil excavated to insert the pressure cells. Voids or hard lumps at the soil-cell interface are likely to affect the registration of the cell. Similarly, if the soil replaced arotmd the cell is significantly firmer, softer, or compacts differently than the adjacent soil, false registrations of stress could result.
Whenever possible, the excavated soil was maintained at its original water content and packed carefully by hand back Into the hole and around the cell. The procedure was found to be much easier if the electrical connections entered the cell from the side rather than from the bottom. Also, it is believed that the most uniform and consistent results were obtained when the soil was quite soft. If the soil was stiff, some difficulty was experienced in filling the larger voids and in achieving a state of compaction comparable to that of the surrounding soil.
During the course of the test program, it was noted that the stress registrations obtained on the first few repetitive passes tended to be more erratic than for subsequent passes. This effect was believed to be due, at least in part, to the compaction of the replaced soil and the "seating" of the cell within the soil mass. It was observed also that the cell often indicated a residual stress even after the load had passed. This phenomenon has been noted and reported in conjunction with other tests (1). In evaluation of the stresses induced by the passage of the vehicle, the residual stress was considered the zero state for each pass and only the stress Increment was employed in the analysis.
Vehicle Alignment and Position The position of the load relative to the pressure cells must be known if an analysis
of the stresses is to be made. In all tests the position of the load elements at any time along the length of the test lane was determined electronically.
Tracked vehicles were guided down the test lane by the driver, who was aided only by markers indicating the intended location of the track path. Control of lateral position or alignment in this manner was not particularly precise and some variations in
32
stress registrations are believed to have resulted, particularly when a vehicle's track did not penetrate into the soU.
In tests with the trucks, a channel was used to guide the wheels of the nontest side of the vehicle. This was hefpful but not completely satisfactory, because the degree of control varied with tire inflation pressure and depth of rutting. The most recent approach has been to separate the test wheel from the vehicle and place it in the load test cart, described earlier, with flanged wheels rolling on rafls. This h s provided a positive control of wheelpath.
Cell Position and Orientation
The pressure cells were precisely positioned during Installation. However, as the soil yielded under the loads, the embedded pressure cells moved with it. Cell displacements of as much as 5 in. have been recorded. Depending on the original position of the cell relative to the load, the cells could move in any direction, tflt, twist, or combine all these movements. In general, the cell movements corresponded to hypothesized soU-flow patterns. Cells directly beneath the load path tended to move downward and along the traffic path in a direction opposite to the direction of travel. Cells some distance outside the path of the load element often moved upward. If the vertically placed cells tilted, they tended to tUt away from the centerline of the traffic path. Some movements such as ceU twisting are not so readily explained, however.
Cell movement introduces an element of doubt in the validity and applicability of the stress registrations. Except in a few instances, it is not known if the cells moved gradually over the duration of the test or if the movements were rather abrupt. However, even if position corrections could be made for each cell registration, there is no assurance that the moving cell measures a true stress.
T E S T 1 ( C O N E INDEX 1 1 3 ) O T E S T 2 ( C O N E INDEX 1 0 0 ) • T E S T l a ( C O N E INDEX 1 6 0 )
T E S T S ( C O N E INDEX 3 0 0 )
A /
1 / /
uu
/
•
/ /
V
•074-t
f
•074-t
/
k T E O T E
L E (
ST 3 CCt S T 3 a (C<
S E N D
>NE INDE> ) N E INDEX
1 I S ) l e o )
• T E S T 5 ( C O N E INDEX 3 0 0 + )
R E C O R D E D S T R E S S , PS I
15-PSI INFLATION PRESSURE
10 2 0 3 0 4 0 S O 6 0 7 0 R E C O R D E D S T R E S S , PS I
b 6 0 - P S I INFLATION PRESSURE
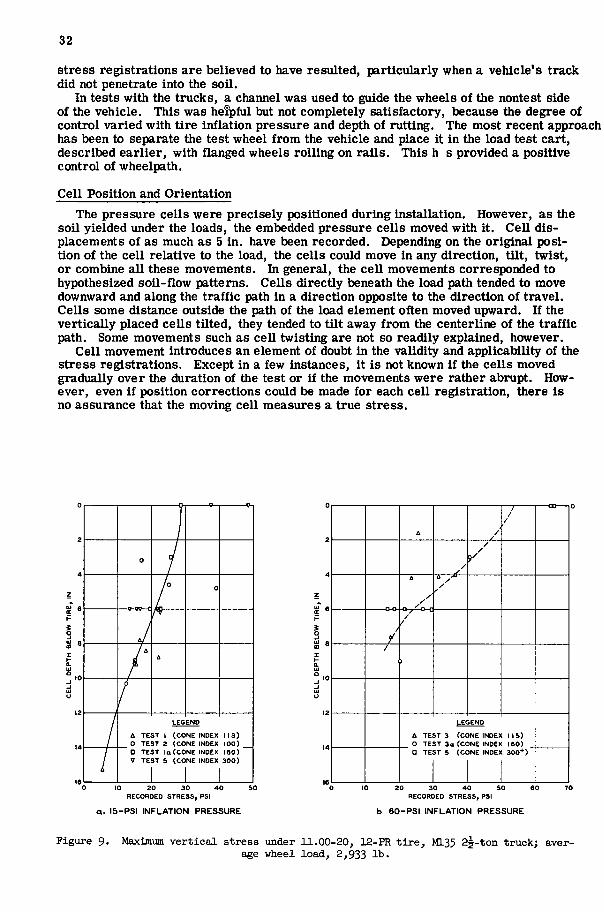
Figure 9. Maximum vert i c a l stress under 11.00-20, 12-PR t i r e , >a35 2|-ton truck; average wheel load, 2,933 lb.
33
RESULTS OF TESTS
Typical Test Data In Figure 9 the maximum stresses recorded at various cell depths beneath the cen
ter of an 11. 00-20, 12-PR pneumatic tire have been plotted. The plotted points in Figure 9a represent data obtained when the tire was inflated to 15-psi pressure; in Figure 9b, the data are from 60-psi inflation pressure tests. It can be seen that inflation pressure has little apparent effect on stress levels below about 6 in. At lesser depths, the high stresses are associated with the high inflation pressure.
Also, at the 6-in. depth the strength of the test soil had little influence on the stress level. Test 5 was conducted in a very firm soil that might be expected to be capable of spreading the load more effectively than a softer soil. This does not appear to have been the case, although it is possible that the observed values are due merely to an effect on the registration of the cells.
The amount of scatter displayed In these plots illustrates the problems involved in the analysis of the data. In Figure 9a, for example, the three data points above the 6-in. depth representing test 2 results are quite divergent. However, Inasmuch as this section was relatively soft, these shallow-depth cells experienced considerable movement. The cell of this group that registered about 17-psi stress moved 1.4 in. downward, 3. 5 in. laterally, and 1. 0 in. along the traffic path while tilting sideways 19y2 degrees. The cell registering about 25. 0 psi moved downward 1.9 in . , laterally 1.3 in . , longitudinally 1. 8 in . , and tilted 23 % degrees. The ceU registering about 39 psi moved downward 2. 8 in , , laterally 0, 5 in , , and longitudinally 1,3 in , ; its tilt was less than 6 degrees.
Effect of Vehicle Type The several vehicles used in the test program can be grouped into three broad
classes: (a) vehicles with unsprung wheels rolling on a relatively rigid track; i . e,, the D4 and D7 engineer tractors; (b) vehicles with spring-suspended wheels rolling on a relatively flexible track; i , e,, the M29C; and (c) vehicles with wheels but no track. The great difference in size and weight of the vehicles representing each of the classes as well as differences in the soil conditions tested precludes any logical comparison of the actual magnitudes of the stresses recorded. However, the patterns of stress induced by each of the vehicle types can be studied readily, and these are found to be of some significance.
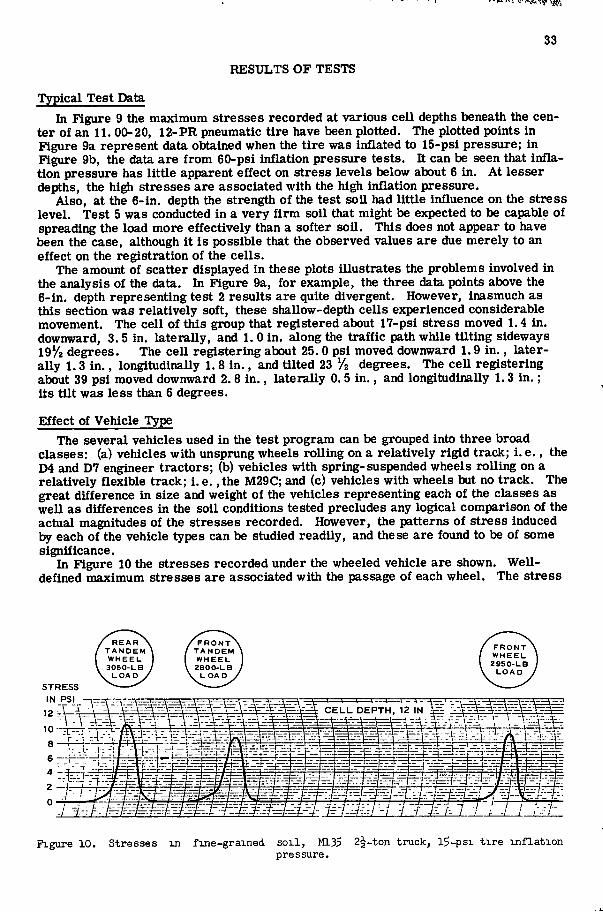
In Figure 10 the stresses recorded under the wheeled vehicle are shown. Well-defined maximum stresses are associated with the passage of each wheel. The stress
STRESS
Figure 10. Stresses m fine-grained soil , M135 2|-ton truck, l5-psi tire inflation pressure.

34
varies smoothly and in proportion to load imposed by each wheel. The stresses recorded under the vehicle with a flexible track are shown in Figure 11. is seen that the track has transferred some of the stress from the soil Immediately under the wheel to the region between the wheels. Nevertheless, a definite maximum occurs in the stress trace in association with each wheel of the vehicle. The maximums differ in magnitude but this can be shown to be due to differences in the load on each of the wheels.
Finally, the stress under a rigid-track vehicle appears as in Figure 12. The trace is not smooth. The fluctuations apparenUy are not caused primarily by stress intensities under each wheel but seem to occur in a random fashion. The rigid track tends to distribute the loads carried by the wheels, but in doing so pays a penalty in terms of vibrations and shock loadings. The stresses under the rear of the vehicle are very low. This is believed due to the bulldozer blade that makes the tractor rather nose-heavy.
Thus, from these data it can be concluded that a rigid-track distributes the load much more uniformly than the more flexible track, and that the greatest stress intensities are found under the wheels when there is no track at all . This observation agrees well with the known soil-strength requirements for the three vehicle types (2). The engineer tractors are able to operate on soft clay soils that cause difficulty to flexible-track vehicles and are impassable to wheeled vehicles.
S T R E S S IN P S I
C E L L D E P T H , 3 IN.^^ :J ;
Figure 11. Stresses in fine-grained soil , M29C Weasel, 1.8-psi contact pressure.
STRESS IN PSI
ROLLERS
OLER
SPROCKET
Figure 12. Stress recorded under Bh, cel l EP93, 6-in. depth, test 2, second pass.

35
Comparison with Elastic Theory
To provide some basis for estimating whether the measured stresses were reasonable, a theoretical computation of stresses was made for the cell position-load condition that existed on the last pass of each test. Computations were made using the Boussinesq solutions for the stresses in an isotropic, elastic, homogeneous mass of semi-infinite extent due to a static vertical load uniformly applied over the contact area. Although the assumptions involved are obviously crude for the case of soft, yielding soils under moving loads, it was believed that such comparisons were worthwhile.
In some instances the elastic theory appeared to provide at least a good working approximation of the stresses. For example, the dashed line drawn through the data points of Figure 9b represents the theoretical vertical stress due to a uniform circular load of an area equal to the tire contact area.
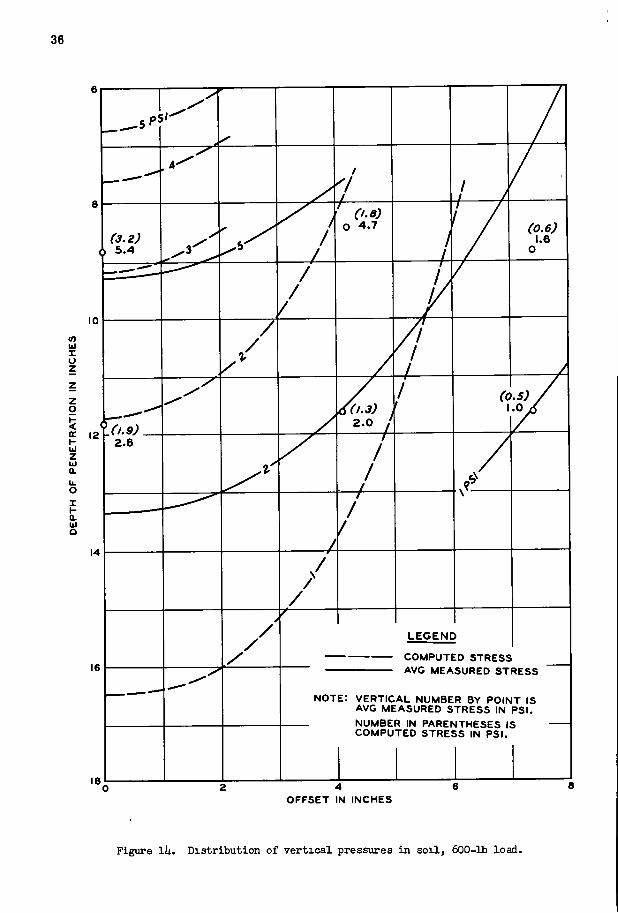
However, the measured stresses were generally greater than the computed stresses by a factor ranging from a little more than one to about four. Further, the ratio of the measured and computed stresses appeared to vary with the cell location. To study the manner in which the stress ratio (and ultimately that of the measured stresses) varied with the cell location, average values for depth, offset, and stress ratio were determined for simUarly located cells for the tests with the rigid single wheel. The average depth of the cell is plotted against the average stress ratio for three offsets (0.0, 4.2, and 7.4 in.) and the average offset is also plotted against the average stress ratio for two depths (approximately 9 and 12 in.) in Figure 13. Although the trend of these data is not definitive, it indicates that the ratio of the measured to the computed stress is a function of the cell location. Furthermore, it Indicates that the measured stresses follow a pattern other than that of the stresses computed from elastic theory. The data from tests conducted with the 600-lb load provide sufficient Information for a direct comparison of computed and measured stress patterns in a portion of the stress field (Fig. 14). For the region for which data are available, this comparison shows that the stress induced in the soil is greater than that predicted by means of elastic theory.
0
0- W OFF ler
7
r -IN OFFi
0 ;
1 / ^J V / / / i y / A
S 2 0 2 & 3 0 A V E R A G E S T R E S S RATIO
M E A S U R E D S T R E S S / C O M P U T E D S T R E S S
/I'lM DiPTH
9-IN DEPTH
A V E R A G E S T R E S S RATIO M E A S U R E D S T R E S S / C O M P U T E D S T R E S S
Figure 13. Effect of depth and offset on stress ratio.
36
HI X o z
z o
(£ I -ui Z iiJ a.
I I -0. UJ o
L E G E N D
C O M P U T E D S T R E S S
A V C M E A S U R E D S T R E S S
N O T E : V E R T I C A L N U M B E R B Y P O I N T I S A V G M E A S U R E D S T R E S S IN P S I
N U M B E R IN P A R E N T H E S E S I S C O M P U T E D S T R E S S IN P S I .
O F F S E T IN I N C H E S
Figure 11*. Distribution of vertical pressures in soil , 600-lb load.
37
SUMMATION
This study of stresses in yielding soils by means of pressure cells has not as yet produced any particularly useful results. It is believed, though, that much can be learned from this approach if some of the more perplexing problems can be solved. In particular, the very broad scatter of results must be narrowed. Previous work with pressure cells leads to the conclusion that from a purely mechanical standpoint a high degree of precision can be expected.
Probably much of the data dispersion encountered was due to nonuniformity of soil properties, particularly those created during cell placement. These should be susceptible of being minimized by carefully controlled preparation of the test soil and meticulous care during cell installation. Steps are being taken to improve techniques in this respect.
It would be useful to be able to locate each cell precisely at any interval during the course of the test To date, no one method of doing this has been very accurate, particularly for the smaller cells. With good fortune and minor movement of the cell, probing with a small-diameter stiff wire can be employed advantageously, but frequently the only accomplishment is serious disturbance of the soil. Probably a system based on reflected waves eventually will provide the required location-fixing ability.
Finally, more knowledge of the effect of soil properties on the response of embedded pressure cells, and of the effect of the shape of the cell on its response is needed.
R E F E R E N C E S
1. U. S, Army Engineer Waterways Experiment Station, C E , Technical Memorandum 3-323, "Investigations of Pressures and Deflections for Flexible Pavements": Report 1, "Homogeneous Clayey-Silt Test Section" (Mar 1951); Report 2, "Pilot Tests on New Four-Gage Cell" (Oct 1951); Report 3, "Theoretical Stresses Induced by Uniform Circular Loads" (Sept 1953); Report 4, "Homogeneous Sand Test Section" (Dec 1954).
2. U. S. Army Engineer Waterways Experiment Station, C E , "Trafficability of Soils, A Summary of Trafficability Studies Through 1955, " Technical Memorandum 3-240, 14th Suppl., Vicksburg, Miss, (Dec 1956).