Embed Size (px)
Citation preview
Kalpakjian • SchmidManufacturing Engineering and Technology © 2001 Prentice-Hall Page 4-1
Metal Alloys: Their Structure andStrengthening by Heat Treatment

Kalpakjian • SchmidManufacturing Engineering and Technology © 2001 Prentice-Hall Page 4-2
Induction-Hardened Surface
Figure 4.1 Cross-section ofgear teeth showinginduction-hardenedsurfaces. Source: TOCCODiv., Park-Ohio Industries,Inc.

Kalpakjian • SchmidManufacturing Engineering and Technology © 2001 Prentice-Hall Page 4-3
Chapter 4 Outline
Figure 4.2 Outline of topics described in Chapter 4.

Kalpakjian • SchmidManufacturing Engineering and Technology © 2001 Prentice-Hall Page 4-4
Two-Phase System
Figure 4.3 (a) Schematic illustration of grains, grain boundaries, and particles dispersed throughoutthe structure of a two-phase system, such as a lead-copper alloy. The grains represent lead in solidsolution in copper, and the particles are lead as a second phase. (b) Schematic illustration of a two-phase system consisting of two sets of grains: dark, and light. The dark and the light grains haveseparate compositions and properties.

Kalpakjian • SchmidManufacturing Engineering and Technology © 2001 Prentice-Hall Page 4-5
Cooling Curve
Figure 4.4 Cooling curve forthe solidification of puremetals. Note that freezing takesplace at a constant temperature;during freezing the latent heatof solidification is given off.
Kalpakjian • SchmidManufacturing Engineering and Technology © 2001 Prentice-Hall Page 4-6
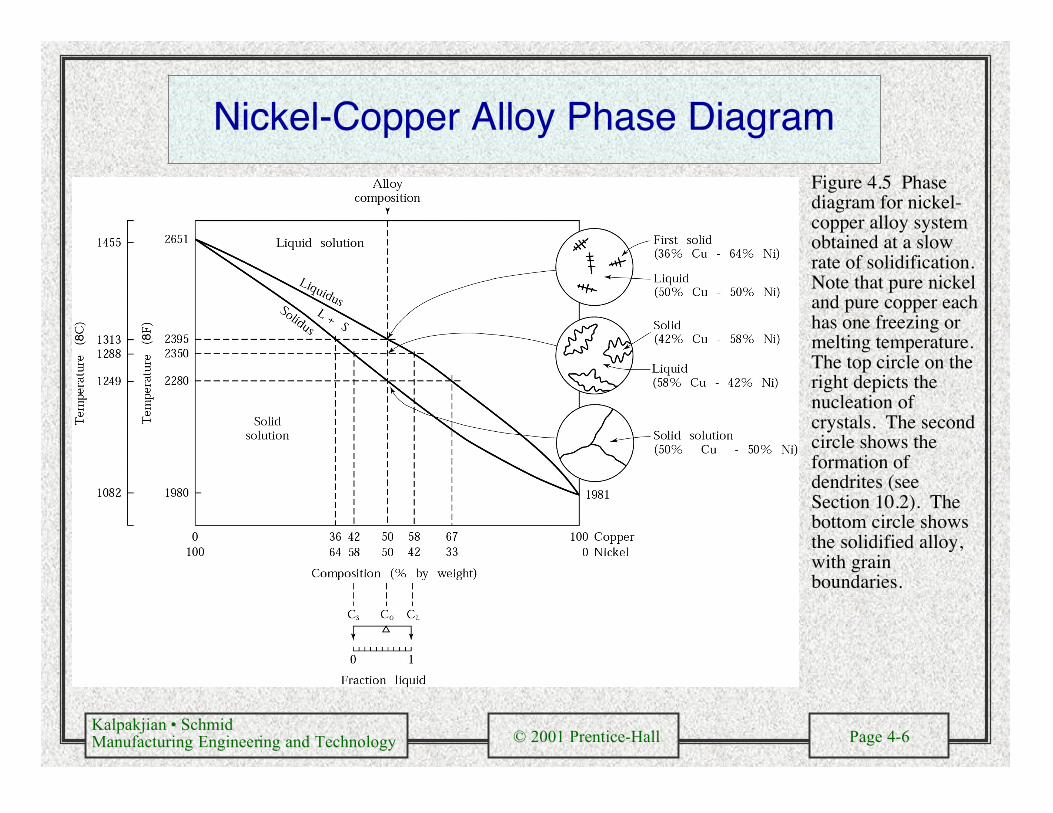
Nickel-Copper Alloy Phase Diagram
Figure 4.5 Phasediagram for nickel-copper alloy systemobtained at a slowrate of solidification.Note that pure nickeland pure copper eachhas one freezing ormelting temperature.The top circle on theright depicts thenucleation ofcrystals. The secondcircle shows theformation ofdendrites (seeSection 10.2). Thebottom circle showsthe solidified alloy,with grainboundaries.

Kalpakjian • SchmidManufacturing Engineering and Technology © 2001 Prentice-Hall Page 4-7
Mechanical Properties of Copper-Nickel andCopper-Zinc Alloys
Figure 4.6 Mechanicalproperties of copper-nickeland copper-zinc alloys as afunction of theircomposition. The curvesfor zinc are short, becausezinc has a maximum solidsolubility of 40% in copper.Source: L. H. Van Vlack;Materials for Engineering.Addison-WesleyPublishing Co., Inc., 1982.

Kalpakjian • SchmidManufacturing Engineering and Technology © 2001 Prentice-Hall Page 4-8
Lead-Tin Phase Diagram
Figure 4.7 Thelead-tin phasediagram. Note thatthe composition ofthe eutectic point forthis alloy is 61.9%Sn-38.1% Pb. Acomposition eitherlower or higher thanthis ratio will have ahigher liquidustemperature.

Kalpakjian • SchmidManufacturing Engineering and Technology © 2001 Prentice-Hall Page 4-9
Iron-Iron Carbide Phase Diagram
Figure 4.8 The iron-ironcarbide phase diagram.Because of theimportance of steel as anengineering material, thisdiagram is one of themost important of allphase diagrams.

Kalpakjian • SchmidManufacturing Engineering and Technology © 2001 Prentice-Hall Page 4-10
Austenite, Ferrite, and Martensite
Figure 4.9 The unit cells for (a) austenite, (b) ferrite, and (c) martensite. The effect of percentage ofcarbon (by weight) on the lattice dimensions for martensite is shown in (d). Note the interstitial positionof the carbon atoms (see Fig. 1.9). Note, also, the increase in dimension c with increasing carbon content;this effect causes the unit cell of martensite to be in the shape of a rectangular prism.

Kalpakjian • SchmidManufacturing Engineering and Technology © 2001 Prentice-Hall Page 4-11
Iron-Carbon Alloy Above and Below EutectoidTemperature
Figure 4.10 Schematic illustrationof the microstructures for an iron-carbon alloy of eutectoidcomposition (0.77% carbon), aboveand below the eutectoid temperatureof 727 °C (1341 °F).

Kalpakjian • SchmidManufacturing Engineering and Technology © 2001 Prentice-Hall Page 4-12
Pearlite Microstructure
Figure 4.11 Microstructure ofpearlite in 1080 steel, formedfrom austenite of eutectoidcomposition. In this lamellarstructure, the lighter regions areferrite, and the darker regions arecarbide. Magnification: 2500X.Source: Courtesy of USXCorporation.

Kalpakjian • SchmidManufacturing Engineering and Technology © 2001 Prentice-Hall Page 4-13
Extended Iron-Carbon Phase Diagram
Figure 4.12 Phase diagram for the iron-carbon system with graphite (insteadof cementite) as the stable phase. Note that this figure is an extended versionof Fig. 4.8.

Kalpakjian • SchmidManufacturing Engineering and Technology © 2001 Prentice-Hall Page 4-14
Microstructures for Cast Irons
(a) (b) (c)
Figure 4.13 Microstructure for cast irons. Magnification: 100X. (a) Ferritic gray iron with graphite flakes. (b)Ferritic Ductile iron (nodular iron), with graphite in nodular form. (c) Ferritic malleable iron; this cast ironsolidified as white cast iron, with the carbon present as cementite, and was heat treated to graphitize the carbon.Source: ASM International.

Kalpakjian • SchmidManufacturing Engineering and Technology © 2001 Prentice-Hall Page 4-15
Austenite toPearlite
Transformation
Figure 4.14 (a) Austenite-to-pearlite transformationof iron-carbon alloy as afunctionof time andtemperature. (b)Isothermal transformationdiagram obtained from (a)for a transformationtemperature of 675 °C(1247 °F). (continued)

Kalpakjian • SchmidManufacturing Engineering and Technology © 2001 Prentice-Hall Page 4-16
Austenite to Pearlite Transformation (cont.)
Figure 4.14 (c) Microstructuresobtained for a eutectoid iron-carbonalloy as a function of cooling rate.Source: ASM International.

Kalpakjian • SchmidManufacturing Engineering and Technology © 2001 Prentice-Hall Page 4-17
Hardness and Toughness of Annealed Steels
Figure 4.15 (a) and (b) Hardness and (c) toughness for annealed plain-carbon steels, as a function of carbideshape. Carbides in the pearlite are lamellar. Fine pearlite is obtained by increasing the cooling rate. Thespheroidite structure has spherelike carbide particles. Note htat the percentage of pearlite begins to decreaseafter 0.77% carbon. Source: L. H. Van Vlack; Materials for Engineering. Addison-Wesley Publishing Co.,Inc., 1982.

Kalpakjian • SchmidManufacturing Engineering and Technology © 2001 Prentice-Hall Page 4-18
Mechanical Properties of Annealed Steels
Figure 4.16 Mechanical properties of annealed steels, as a function of composition and microstructure. Note(in (a)) the increase in hardness and strength and (in (b)) the decrease in ductility and toughness, withincreasing amounts of pearlite and iron carbide. Source: L. H. Van Vlack; Materials for Engineering.Addison-Wesley Publishing Co., Inc., 1982.

Kalpakjian • SchmidManufacturing Engineering and Technology © 2001 Prentice-Hall Page 4-19
Eutectoid Steel Microstructure
Figure 4.17 Microstructureof eutectoid steel.Spheroidite is formed bytempering the steel at 700 °C(1292 °F). Magnification:1000X. Source: Courtesy ofUSX Corporation.
Kalpakjian • SchmidManufacturing Engineering and Technology © 2001 Prentice-Hall Page 4-20
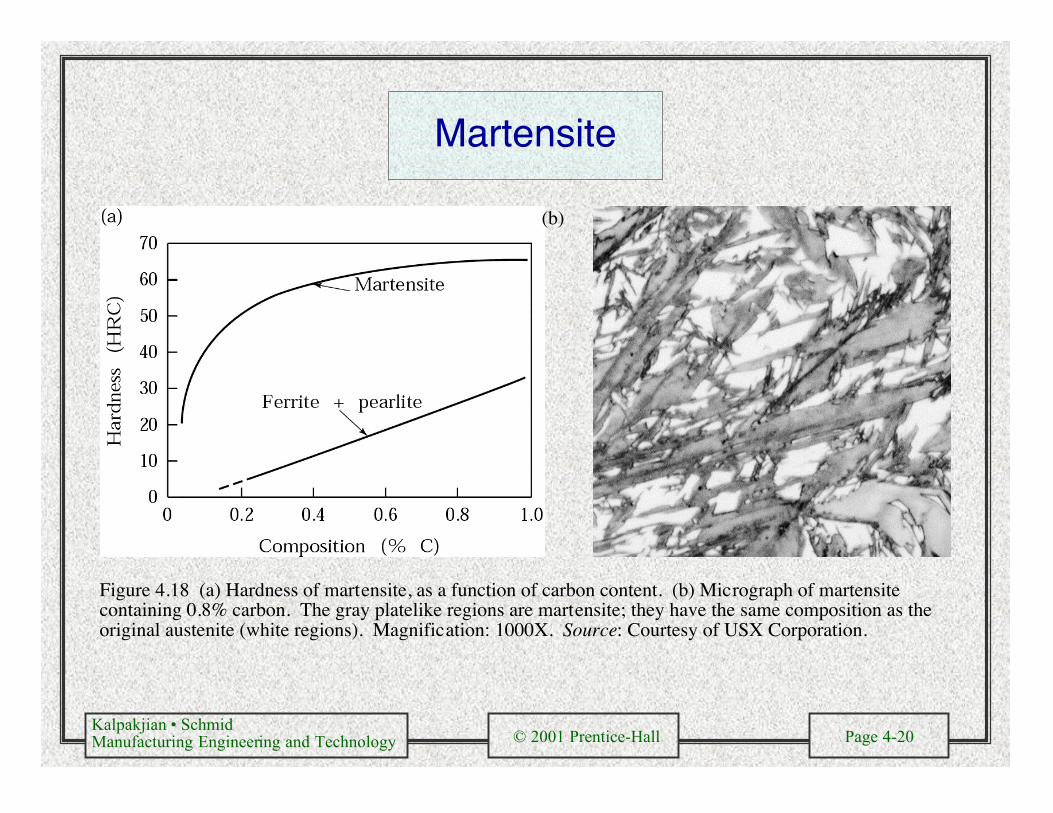
Martensite
(b)
Figure 4.18 (a) Hardness of martensite, as a function of carbon content. (b) Micrograph of martensitecontaining 0.8% carbon. The gray platelike regions are martensite; they have the same composition as theoriginal austenite (white regions). Magnification: 1000X. Source: Courtesy of USX Corporation.

Kalpakjian • SchmidManufacturing Engineering and Technology © 2001 Prentice-Hall Page 4-21
Hardness of Tempered Martensite
Figure 4.19 Hardnessof temperedmartensite, as afunction of temperingtime, for 1080 steelquenched to 65 HRC.Hardness decreasesbecause the carbideparticles coalesce andgrow in size, therebyincreasing theinterparticle distanceof the softer ferrite.

Kalpakjian • SchmidManufacturing Engineering and Technology © 2001 Prentice-Hall Page 4-22
End-QuenchHardenability
Test
Figure 4.20 (a)End-quench testand cooling rate.(b) Hardenabilitycurves for fivedifferent steels, asobtained from theend-quench test.Small variations incomposition canchange the shape ofthese curves. Eachcurve is actually aband, and its exactdetermination isimportant in theheat treatment ofmetals, for bettercontrol ofproperties. Source:L. H. Van Vlack;Materials forEngineering.Addison-WesleyPublishing Co.,Inc., 1982.

Kalpakjian • SchmidManufacturing Engineering and Technology © 2001 Prentice-Hall Page 4-23
Aluminum-Copper Phase Diagram
Figure 4.21 (a) Phase diagram for the aluminum-copper alloy system. (b) Various micro-structures obtained during the age-hardening process. Source: L. H. Van Vlack; Materials forEngineering. Addison-Wesley Publishing Co., Inc., 1982.

Kalpakjian • SchmidManufacturing Engineering and Technology © 2001 Prentice-Hall Page 4-24
Age Hardening
Figure 4.22 The effect of agingtime and temperature on the yieldstress of 2014-T4 aluminum alloy.Note that, for each temperature,there is an optimal aging time formaximum strength.

Kalpakjian • SchmidManufacturing Engineering and Technology © 2001 Prentice-Hall Page 4-25
Outline of Heat Treatment Processes forSurface Hardening
TABLE 4.1Process Metals hardened Element added to
surfaceProcedure General Characteristics Typical applications
Carburizing Low-carbon steel(0.2% C), alloysteels (0.08–0.2%C)
C Heat steel at 870–950 °C (1600–1750°F) in an atmosphere of carbonaceousgases (gas carburizing) or carbon-containing solids(pack carburizing). Then quench.
A hard, high-carbon surface isproduced. Hardness 55 to 65HRC. Case depth < 0.5–1.5 mm( < 0.020 to 0.060 in.). Somedistortion of part during heattreatment.
Gears, cams, shafts,bearings, piston pins,sprockets, clutch plates
Carbonitriding Low-carbon steel C and N Heat steel at 700–800 °C (1300–1600°F) in an atmosphere of carbonaceousgas and ammonia. Then quench in oil.
Surface hardness 55 to 62 HRC.Case depth 0.07 to 0.5 mm(0.003 to 0.020 in.). Lessdistortion than incarburizing.
Bolts, nuts, gears
Cyaniding Low-carbon steel(0.2% C), alloysteels (0.08–0.2%C)
C and N Heat steel at 760–845 °C (1400–1550°F) in a molten bath of solutions ofcyanide (e.g., 30% sodium cyanide) andother salts.
Surface hardness up to 65 HRC.Case depth 0.025 to 0.25 mm(0.001 to 0.010 in.). Somedistortion.
Bolts, nuts, screws, smallgears
Nitriding Steels (1% Al,1.5% Cr, 0.3%Mo), alloy steels(Cr, Mo), stainlesssteels, high-speedtool steels
N Heat steel at 500–600 °C (925–1100 °F)in an atmosphere of ammonia gas ormixtures of molten cyanide salts. Nofurther treatment.
Surface hardness up to 1100HV. Case depth 0.1 to 0.6 mm(0.005 to 0.030 in.) and 0.02 to0.07 mm (0.001to 0.003 in.) for high speedsteel.
Gears, shafts, sprockets,valves, cutters, boringbars, fuel-injection pumpparts
Boronizing Steels B Part is heated using boron-containinggas or solid in contact with part.
Extremely hard and wearresistant surface. Case depth0.025– 0.075 mm (0.001–0.003 in.).
Tool and die steels
Flame hardening Medium-carbonsteels, cast irons
None Surface is heated with an oxyacetylenetorch, then quenched with water spray orother quenching methods.
Surface hardness 50 to 60 HRC.Case depth 0.7 to 6 mm (0.030to 0.25 in.). Little distortion.
Gear and sprocket teeth,axles, crankshafts, pistonrods, lathe beds andcenters
Inductionhardening
Same as above None Metal part is placed in copper inductioncoils and is heated by high frequencycurrent, then quenched.
Same as above Same as above

Kalpakjian • SchmidManufacturing Engineering and Technology © 2001 Prentice-Hall Page 4-26
Heat Treatment ProcessesFigure 4.23 Heat-treating temperature ranges forplain-carbon steels, as indicated on the iron-ironcarbide phase diagram. Source: ASMInternational.
Figure 4.24 Hardness of steels in the quenched andnormalized conditions, as a function of carbon content.

Kalpakjian • SchmidManufacturing Engineering and Technology © 2001 Prentice-Hall Page 4-27
Properties of Oil-Quenched Steel
Figure 4.25 Mechanical properties ofoil-quenched 4340 steel, as a functionof tempering temperature. Source:Courtesy of LTV Steel Company

Kalpakjian • SchmidManufacturing Engineering and Technology © 2001 Prentice-Hall Page 4-28
Induction Heating
Figure 4.26 Types of coils used in induction heating of various surfaces of parts.