Embed Size (px)
Citation preview

Final Report
Strategies to achieve economic
and environmental gains by
reducing food waste
This report highlights the need for action on food waste and provides concrete examples of how this can be achieved. Investments of time and money will be required, but the potential economic and environmental benefits are huge, and the consequences of not taking sufficient action are serious – for billions of individuals, countries, and the food system as a whole. Date: February 2015 Research date: February - August 2014 ISBN: 978-1-84405-473-2

WRAP’s vision is a world where resources are used sustainably. We work with businesses, individuals and communities to help them reap the benefits of reducing waste, developing sustainable products and using resources in an efficient way. Find out more at www.wrap.org.uk
Document reference: WRAP, 2015, Banbury, Strategies to achieve economic and environmental gains by reducing food waste
Document reference: [e.g. WRAP, 2006, Report Name (WRAP Project TYR009-19. Report prepared by…..Banbury, WRAP]
Written by: Andrew Parry, Keith James and Stephen LeRoux
While we have tried to make sure this report is accurate, we cannot accept responsibility or be held legally responsible for any loss or damage arising out of or in
connection with this information being inaccurate, incomplete or misleading. This material is copyrighted. You can copy it free of charge as long as the material is
accurate and not used in a misleading context. You must identify the source of the material and acknowledge our copyright. You must not use material to endorse or
suggest we have endorsed a commercial product or service. For more details please see our terms and conditions on our website at www.wrap.org.uk

1
Acknowledgements
The authors would like to thank Christopher Delgado at the New Climate Economy and Brian Lipinski at the World Resources Institute for fruitful discussions and valuable comments on draft versions of this report. The contents of this report were also informed by the high quality presentations and discussions at a workshop on food waste prevention held in London on the 23rd of May 2014, and WRAP would like to thank all of the attendees, from Governments, international organisations, the food industry, NGOs and academia for their contributions. Particular thanks go to Tim Fox of the Institution of Mechanical Engineers for sharing their latest report ahead of its publication. Gratitude is also expressed to The Global Commission on the Economy and Climate, and the New Climate Economy project team, for funding to carry out this research, and input to inform its development.

2
Foreword
An estimated one third of all food produced in the world ends up as waste. Reducing food waste is good for the economy, good for food security and good for the climate. In this new report, ‘Strategies to achieve economic and environmental gains by reducing food waste’, WRAP (the Waste & Resources Action Programme) estimates the value of global consumer food waste at more than US$400 billion per year. It identifies the incredible savings that can be realised by reducing food waste in the UK and countries around the world. The costs of decreasing food waste are relatively low, but the potential benefits are substantial. Less food waste leads to more efficiency, more economic productivity and reductions in emissions of greenhouse gases that contribute to climate change. These findings should serve as a motivation to act for policymakers around the world. While food waste is currently valued at more than US$400 billion per year, as the global middle class expands the cost could rise to US$600 billion within 15 years. By 2030, a 20-50% reduction in consumer food waste could save an estimated US$120-300 billion per year. Reducing food waste has clear benefits for climate change mitigation. An astonishing 7% of all global greenhouse gas emissions (GHGs), or 3.3 billion tonnes per year, are due to food waste. WRAP estimates that by 2030 GHGs could be lowered by at least 0.2 and possibly as much as 1 billion tonnes per year through food waste reductions. Governments and businesses should develop food waste prevention plans throughout the entire supply chain. In developing countries this requires much greater focus on reducing post-harvest losses early in the chain, through better pest and mould control technologies in storage, for example. In developed countries and increasingly in the urban areas of emerging countries, policy should encourage initiatives to help reduce food waste at the consumer level, such as providing more appropriate pack sizes at the retail level, portion sizes in restaurants and addressing ambiguous date labelling that could lead to food being unnecessarily thrown away. The report highlights how practical changes in all countries, such as lowering the average temperatures of refrigerators or designing better packaging, can make a considerable difference in preventing food from spoiling. WRAP’s findings contributed to Better Growth, Better Climate: The New Climate Economy Report, released in 2014 by the Global Commission on the Economy and Climate, which demonstrates how countries can achieve economic growth while dealing with the risks posed by climate change. The report highlighted how reforms in urban development, land use and energy policy could lead to sustained growth in a low-carbon economy. WRAP’s research on the benefits of food waste reduction proves yet again that it is possible to achieve economic goals and a better climate together. Helen Mountford New Climate Economy Programme Director

3
Contents
Summary ................................................................................................................ 5 1.0 Introduction ............................................................................................... 13 2.0 Why preventing food waste must be the priority ....................................... 15 3.0 Food waste globally – a brief overview ...................................................... 16 4.0 UK experience – establishing a robust evidence base ................................ 19
4.1 Household food waste (WRAP 2013a) ........................................................ 20 4.2 Hospitality and food service food waste (WRAP 2011a, 2013f) ..................... 22 4.3 Manufacturing and retail supply chain food waste (WRAP 2013g) ................. 23
5.0 UK experience - strategies to reduce food waste ....................................... 26 5.1 Household food waste .............................................................................. 26 5.2 Hospitality and food service food waste ..................................................... 29 5.3 Manufacturing and retail supply chain food waste ....................................... 29 5.4 All sectors ............................................................................................... 30
6.0 How reducing food waste delivers economic benefits and contributes to lower GHG emissions ............................................................................................ 32
6.1 Economic benefits .................................................................................... 32 6.2 Considering trade-offs .............................................................................. 38
7.0 How targeting interventions can maximise reductions in GHG emissions .. 40 8.0 Examples of potential impacts from food waste reduction ........................ 43
8.1 Reducing global consumer food waste ....................................................... 43 8.2 Reducing food waste in South and South East Asia and Industrial Asia ......... 44
9.0 What can governments and other senior influencers do to reduce food waste? .................................................................................................................. 47 11.0 Conclusion .................................................................................................. 53 12.0 References .................................................................................................. 54 Annex – Illustration of the ‘food loop’ in the UK .................................................. 58

4
Figures and tables Table 1: Change in life cycle emissions from different waste management options ........... 15 Figure 1: Amounts of food waste arising by region and by supply chain stage (based on FAO data, 2011) ........................................................................................................... 17 Figure 2: GHG emissions linked to food waste arising by region and by supply chain stage (based on FAO data, 2011) ........................................................................................... 17 Figure 3: Cost of food waste arising (producer prices) by region and by supply chain stage (based on FAO data, 2011) ........................................................................................... 18 Figure 4: Amounts of food waste arising in the UK by sector (total equals ca 15 million tonnes) ....................................................................................................................... 20 Figure 5: Weight of avoidable food and drink waste by food group, split by reason for disposal ....................................................................................................................... 21 Figure 6: Illustration of the complexity of factors that influence household food waste (macro-level factors such as economic conditions can influence the food industry and individuals, through for example food prices. Actions by the food industry can influence household food waste through aspects of the products plus communication with customers, whilst many interrelated factors at a family or individual level can influence behaviours that result in food being eaten or wasted) ............................................................................. 22 Figure 7: Potential reasons for food waste from post-farm gate to purchase (waste arises in all parts of the supply chains, and the causes will be numerous - potential reasons for food waste from post-farm gate, through to purchase are illustrated, and a Venn diagram has been used to illustrate that there are reasons for waste that different parts of the supply chain have in common, and therefore can help reduce through collaboration). .................. 25 Table 2: Costs and benefits of waste prevention activities related to the third phase of the Courtauld Commitment (2012 – 2015) ........................................................................... 30 Figure 8: The change in the sales of different grades of fresh chicken in response to changes in the economy and activities to reduce food waste ............................................ 33 Figure 9 Examples of materials used to raise awareness of the value of food waste, to consumers and businesses ............................................................................................ 35 Figure 10: Top down estimate of average greenhouse gas emissions associated with household food and drink waste in the UK ...................................................................... 37 Figure 11: Cumulative GHG emissions per tonne of selected foods purchased by UK households .................................................................................................................. 40 Figure 12: Cumulative GHG emissions for total UK avoidable household waste, for selected foods (2012) ................................................................................................................ 41 Figure 13a: Benefits of a 20% reduction in food waste in Industrialised Asia – weight of food waste avoided (based on FAO data, 2011; 2013) ..................................................... 45 Figure 13b: Benefits of a 20% reduction in food waste in Industrialised Asia – GHG emissions avoided (based on FAO data, 2011; 2013) ....................................................... 45 Figure 13c: Benefits of a 20% reduction in food waste in Industrialised Asia – cost of food waste avoided (based on FAO data, 2011; 2013) ............................................................ 45 Figure 14a: Benefits of a 20% reduction in food waste in South and Southeast Asia – weight of food waste avoided (based on FAO data, 2011; 2013) ...................................... 46 Figure 14b: Benefits of a 20% reduction in food waste in South and Southeast Asia – GHG emissions avoided (based on FAO data, 2011; 2013) ....................................................... 46 Figure 14c: Benefits of a 20% reduction in food waste in South and Southeast Asia – cost of food waste avoided (based on FAO data, 2011; 2013) ................................................. 46 Box 1 – Key resources to help inform action to reduce food waste .................................. 51

5
Summary
Key recommendations:
Governments should consider supporting the establishment of independent
organisations, such as WRAP in the UK, which can facilitate and evaluate efforts to
reduce consumer food waste and food waste in grocery and hospitality supply chains.
UNEP, FAO and WRAP have recently produced detailed guidance on the development
and implementation of effective food waste prevention strategies, and tactical
implementation plans (UNEP et al 2014). This type of collaborative working in
countries such as the UK, Norway and Japan is delivering significant reductions in
food waste, saving many billions of dollars per year.
In developing countries, governments and international organisations
should invest in infrastructure and help coordinate food production, storage and
distribution activities to reduce food waste; and in particular encourage the roll out of
sustainable and effective cold and frozen supply chains. IMechE (2014) have
estimated 25% of food waste in the developing world could be eliminated with better
refrigeration equipment, helping to alleviate hunger and improve global food security.
Emerging cities with fast growing middle class populations can reduce waste
management costs, and help residents save money, by setting up and supporting
consumer food waste prevention campaigns, such as Love Food Hate Waste. The
latter campaign deployed in West London yielded waste disposal savings of up to
eight times the campaign costs.
Private companies can increase competitiveness and resilience through food waste
prevention, but the most significant gains can only be made through whole-chain
collaboration. Companies should support the development of, and participate in
sector agreements (see UNEP et al 2014) to enable such collaboration.
In addition to the points above, several very practical short term recommendations can be made:
Governments and companies should support the development of the WRI-led ‘Food
Loss and Waste Protocol’ and adopt this when finalised, to establish more robust food
waste estimates.
Governments and companies should make use of robust measurement techniques,
such as those recommended by the protocol, to evaluate the impact of new national,
regional and local interventions aimed at reducing food waste – expanding the
evidence base to encourage and inform future action on food waste prevention.
Organisations such as UNEP and FAO should consider, with others, developing a
mechanism for hosting, sharing and analysing the increasing number of studies
reporting food waste levels, drivers and evaluating interventions, to increase the pace
and geographic spread of change.

6
Why is tackling food waste so important? The United Nations Food and Agriculture Organisation (FAO) estimated that in 2011 roughly one-third of all food produced in the world ended up as waste, although some estimates put the figure as high as 50%, or up to 2 billion tonnes a year (FAO 2013). FAO also estimated that the global carbon footprint of food waste, excluding land use change, was 3.3 billion tonnes of CO2e, equivalent to approximately 7% of global GHG emissions (ibid). FAO (2013) also estimated the value of the food wasted at around US$750 billion, at producer prices, or US$470 a tonne. However, as the value of food increases through the supply chain the true economic cost of food waste will be much higher. In South Africa for example the value of food waste increased from around US$450 a tonne to over US$1,100 a tonne between agriculture and consumption (Nahman A and De Lange W, 2013), whilst in the UK WRAP (2013 a,f,g) estimate that the value of food waste increases from around US$1,500 a tonne for manufacturers to US$4,800 a tonne for consumers. In the US, Buzby et al (2014) estimated that 60 million tonnes of food was wasted at retail and consumer stages, with a retail value of US$162 billion ($2,700 a tonne). The Ministry of Agriculture Forestry and Fisheries in Japan has estimated that about 23 million tonnes of food was wasted in 2007, worth the equivalent of US$110 billion, or an average of US$4,800 a tonne (OECD 2014). Using conservative estimates for retail prices the true global cost of the 280 million tonnes of consumer food waste for example, could exceed US$400 billion. The costs to local governments of collecting and treating food waste are also substantial, for example WRAP estimate that in the UK gate fees and landfill taxes amount to the equivalent of around US$450 million a year to dispose of household food waste, and in the US the costs of landfilling the 32 million tonnes of municipal food waste are likely to be around US$1.5 billion a year (EPA, 2014). Searchinger et al (2013) suggest that by 2050, with a population of at least nine billion, an additional 60% (more than 2 billion tonnes) of food will be required unless actions are taken to reduce food waste and address other aspects of food production and consumption. They estimate that cutting global food waste in half by 2050 would reduce the food gap by roughly 20 percent. However, if concerted action is not taken there are strong drivers that could result in global food waste rising significantly – due to an increasing global population, the rapidly expanding middle classes and changes in diet. By 2030 for example, it is estimated that the global middle class will more than double, to almost 5 billion people (Kharas 2010). If, as the evidence suggests, these new middle classes adopt diets and habits more akin to those in the developed world, an additional 280 million tonnes of food waste per year could be generated, doubling the levels reported in 2011 – which could take the cost of consumer food waste to more than US$600 billion a year1. Can food waste be reduced? Whilst recent years have seen an increasing focus on food waste, there are very few examples yet of the impact of food waste prevention initiatives.
1 Although the amounts of consumer food waste could double, the increase in value is based on current retail food prices, which at present are lower in regions where most of the increases in food waste are likely to occur. Compared to where most of consumer food waste currently arises

7
WRAP (2013a) found that in the UK concerted and co-ordinated efforts helped to reduce avoidable household food waste by 21% over five years. This avoided food waste had a retail value of around £3.3 billion (US$5.3 billion) in 2012 alone. In addition this will have prevented 4.4 million tonnes of GHG emissions a year, the same as taking 1.8 million cars off UK roads, and saved a billion tonnes of water. The evaluation of specific initiatives is often a challenge, but a range of localised campaigns and other interventions have reported reductions in food waste of around 15% to 80%. WRAP also manages voluntary agreements with both the grocery and hospitality and food service sectors aimed at delivering measurable reductions in food waste. Under the Courtauld Commitment, food and packaging waste in the grocery supply chain reduced by 7.4% over three years (WRAP 2013b). Specific examples of success include a manufacturer of pre-prepared foods identifying how to cut food waste by 25%, and a retailer and supplier working together to optimise how bananas were supplied to store, and identifying how to reduce waste by 90%. A similar exercise with bagged salad suggested waste could be reduced by between a third and 80%. A meal supplier to the public sector cut waste by 60% through small changes to the size of cooking batches (WRAP 2013c). In Japan food waste prevention was identified as a priority in 2006, and measures put in place to encourage measurement and reporting by industry, with targets being introduced in 2012. Data suggests food waste arising from industry has reduced by around 14% over a 3 year period (OECD 2014). ForMat is a collaborative programme in Norway, initiated by the food industry and financed by a range of partners. The goals of the project are to contribute to a 25% reduction in food waste by 2015, changing attitudes and improving knowledge and routines. The avoided food waste would have a value of €650 million (US$900 million) (Hanssen and Møller 2013). Four years of data on food waste in Norway have been obtained from producers, retailers, wholesalers and consumers. For producers, the results show a reduction in food waste relative to production from 4.8% to 4.0% between 2010 and 2013 for the selected product categories, which represents a decrease of about 16% in the period. Consumer survey data reveals a clear pattern of a lower percentage who report having discarded a particular product category in 2013 than in 2010, with the greatest reduction in eggs (50%), followed by snacks, fresh meat, milk/cream, cheese and yoghurt/sour cream. In Denmark, where there is an active food waste prevention campaign, surveys suggested that 50% of the population had reduced food waste within a year (Stop Wasting Food 2013). Is it cost effective to try and reduce food waste? Actions to reduce food waste are often associated with low or no costs, and the benefits are potentially very large indeed. This section provides some of the evidence from the UK to substantiate this conclusion, and the following section addresses the obvious question of ‘if it’s so cost effective why aren’t people doing more to reduce food waste?’ Prior to launching the third phase of the Courtauld Commitment WRAP worked closely with UK Governments to undertake a detailed cost benefit analysis, which took in to account both private and public sector costs that might be incurred in delivering the target reductions in household, manufacturing and retail waste. Over the three years of the agreement (2012 to 2015) the estimated net benefit was more than £1.2 billion (US $1.9 billion) for household food waste and £230 million (US $370 million) for supply chain waste (WRAP and DEFRA 2013). Many of the actions needed to reduce food waste by businesses rely on low-cost solutions, changes to processes, procedures and interactions between people and organisations.

8
WRAP more recently evaluated the impact of a six-month Love Food Hate Waste campaign in West London, which resulted in changes in behaviour and reductions in food waste (ca 15% for total household food waste). The campaign cost ca £170,000, (US $270,000) and the boroughs were estimated to have saved £1.3 million (US $2.1 million) in avoided disposal costs, i.e. for every £1 invested up to £8 was saved (WRAP 2013d). When considering the benefits of reducing food waste it is relatively straightforward to calculate the immediate benefits to consumers and businesses when they reduce their own waste, however it is more complex to calculate the impact on economic growth that results from a reduction in food waste overall. At a household level in the UK the amount of food purchased has reduced, as would be expected if households are wasting less food, but this has been ‘compensated’ to a large extent through increases in the population – which may not be the case for all countries. There are also opportunities for the food industry to innovate around added value foods, and of course make savings from reduced waste in the supply chain. WRAP (2014) suggests that around half of the food waste savings were used by consumers to buy more expensive food and drinks (i.e. to ‘trade up’), while the remaining half was either saved or spent on other goods or services. The increased spending on more expensive food and drinks means that the value of food and drink purchased will change by less than the reduction in the amount (or weight) of food purchased. Rutten et al (2013) suggested that reducing food waste by 50% between 2012 and 2020 could lead to average savings of €192 per person (US$270) or a saving of €94.4 billion (US$130 billion) for the EU as a whole, whilst leaving the EU economy relatively unaffected, although some sectors were predicted to do better than others. Some interventions aimed at reducing food waste will have economic and environmental costs, and WRAP has carried out studies to quantify the overall economic and GHG benefits from several such interventions. Making better use of fridges and freezers, for example, can help food last longer resulting in less waste, but will require additional energy consumption. The potential annual UK net benefits, taking into account the additional energy use, were around £200 million (US$320 million) savings and a reduction of 210,000 tonnes CO2e. The economic and GHG benefits of using the freezer more effectively were found to be over 100 times higher than the costs (WRAP 2013e). Making better use of packaging that has been designed to protect food, and of the guidance on the label, could dramatically reduce the amount of food thrown away, but come at an environmental, and financial cost. These costs are however substantially outweighed by the reductions in food waste. It is very challenging to estimate potential savings, which in addition to the effectiveness of any interventions will also be influenced by a variety of external factors, such as economic conditions, population changes and cultural / social differences. Evaluating the impact of more initiatives to reduce food waste around the world will improve the ability to forecast costs and benefits. Why are interventions needed? If the financial and environmental benefits of reducing food waste are so significant the obvious question is why has more action not been taken to tackle this? There are a number of reasons that can help explain this. Firstly, many businesses are unaware of the full financial and environmental benefits of producing less waste, and of the potential to address

9
this. There is often little robust data on the amounts and types of food waste arising, and reluctance to share such data due to concerns of commercial confidentiality and how this might affect perceptions of business efficiency. Food waste is often not segregated from other waste, and processes to monitor the levels of food waste produced are not commonly in place. It is therefore difficult for businesses to benchmark themselves against others in terms of waste production, 10% waste per tonne may be deemed acceptable to one business when a comparable business may be operating at less than half that. There are many reasons for food ending up as waste, and these are often linked to how different stages of the supply chain interact, for example when specifying, forecasting and ordering food. Those nearer the end of the supply chain, whose actions may inadvertently lead to food being wasted at other points in the supply chain, may not see that waste, suffer any financial penalty linked to it or be responsible for its disposal. Anti-competition laws, or concerns about these, may prevent businesses from working together to identify the causes of food waste, develop and test solutions and to share good practice. Competitive pressures also make individual businesses reluctant to effect changes by themselves, which might require significant investment but benefit others. In addition, the benefits arising from investments to reduce waste (or environmental impact) may not be distributed fairly across the supply chain (e.g. producer vs retailer), or may be beyond the means or capabilities of individual businesses (e.g. developing new processes to increase shelf-life or carrying our robust research to identify how best to reduce consumer food waste). Consumers may lack the knowledge, skills and solutions to reduce food waste, and some of these solutions are outside of their control (such as pack or portion sizes). There may also be concerns within businesses over the implications of reduced consumer food waste, and altered purchasing patterns (on production volumes, profitability), which could influence participation in efforts to help customers reduce waste. Overall, achieving change (e.g. large reductions in food waste) is not just dependent on the financial resources available, but on having the necessary mechanisms in place to co-ordinate, support and monitor the delivery of food waste prevention programmes. Where to focus? FAO data on global food waste, broken down by food type, region and supply chain stage is being supplemented by increasing numbers of national and sector specific food waste studies. Information is available to help prioritise activities based on the amounts of food being wasted, the environmental impact of different foods and their economic value. The profile of GHG emissions varies significantly between different foods, and by supply chain stage - for example emissions associated with vegetables increase by over 100% between farm and retail, whereas for red meat the increase is less than 4%. Although the GHG emissions associated with a tonne of vegetables are much lower than those of a tonne of meat, in many cases as a category they represent the highest overall GHG emissions due to the overall quantity wasted. Regional priorities will vary. For example for Industrialised Asia and South and South East Asia on a weight and GHG emission basis, the greatest impact could be achieved through avoiding waste of cereals, fruit and vegetables (including roots and tubers). In Industrialised Asia, waste of meat by consumers would also be of significance in terms of GHG emissions and in South and South East Asia significant impact could be achieved through targeting dairy products across the supply chain.

10
In Industrial Asia the greatest impact in reducing GHG emissions could be achieved through reducing waste at the consumption stage, whereas in South and Southeast Asia, an emphasis on reductions across the supply chain would be needed to deliver the greatest benefits. If waste was reduced by 20% in Industrialised Asia and South and Southeast Asia, around 250 and 150 million tonnes CO2e could be avoided respectively, with 630 and 360 million tonnes CO2e avoided if 50% of waste could be avoided. A key area of focus globally needs to be consumer food waste, for the reasons outlined above. A 20 – 50% reduction in global consumer food waste could deliver savings of between 55 and 140 million tonnes of food per year (US$80 to 200 billion) based on 2011 waste levels, or 110 – 280 million tonnes of food (US$120 – 300 billion) based on potential future levels of consumer food waste linked to the increase in the middle classes. GHG savings could therefore vary between 220 million and more than 1 billion tonnes. What can and should be done? Based on its experience, WRAP would highlight the following as important for successfully reducing food waste: 1) A robust evidence base, to identify priorities, build a strong case for change, develop robust targets and recommendations and inform the development of effective messages and materials for engaging with consumers, industry and other stakeholders, and solutions to reduce food waste. WRI, UNEP, FAO and the World Business Council on Sustainable Development are in the process of developing a global standard for measuring food waste, drawing on current best practice. This protocol will be a globally consistent and credible approach to measure food waste, and will be road tested in 2014 and 2015. Without robust and comparable measures of food waste, which requires action by the public and private sector, it is difficult to set credible goals or targets, design effective interventions or monitor progress. Putting in place measures to quantify food waste in itself prompts action. There are more and more examples of nations, businesses and others setting goals or targets, which can be associated with voluntary agreements or set by governments, often in conjunction with industry (such as in Japan, France and Germany). Setting defined goals or targets motivates collective action, within an organisation, across sectors, within communities and the wider population and at regional and national levels. 2) Integrated action plans, looking across the whole supply chain (recognising the influence those at any given stage in the supply chain can have on others in the supply chain), and also in terms of householders incorporating three key elements (national / large scale awareness raising campaigns, local / community engagement to influence behaviours and changes to products, packaging and labelling to make it easier to buy the right amounts of food and use what is bought), which if implemented together deliver much more than any element in isolation. Similarly staff engagement and training, systems improvements and a greater emphasis on lean thinking all make significant contributions to waste reduction in businesses.

11
3) A collaborative, ‘whole chain’ approach, enabled by frameworks for action and supported by governments. Food businesses have a central role, and in particular the larger companies (the top 15 grocery retailers are responsible for over 30 percent of global grocery retail sales and the top 20 food manufacturers for a 20 percent share of global packaged food retail sales). Major food brands and retailers can work with their own integrated supply chains, third party suppliers and customers to understand how their actions and those of others can reduce wasted food, and catalyse action. This can be in the context of a broader collaborative agreements to address food waste, such as the Courtauld Commitment and Hospitality and Food Service Agreements in the UK, ForMat in Norway and the Sustainable Alliance in the Netherlands, with collective targets which provides a mechanism for sharing best practice and facilitating the uptake of recommendations for change or be more unilateral. One such example is Tesco announcing a core programme to tackle food waste in their own operations and with their suppliers and customers as part of their ‘Using Our Scale for Good’ initiative. Whilst larger food businesses can undoubtedly make a significant impact, it is important to remember that much of the worlds’ food is produced, manufactured and sold by smallholders and small businesses, which require different types of support, and are less likely to sign up to formal voluntary agreements. Relevant information must be made accessible to smaller businesses, and ‘trusted intermediaries’ identified to reach them. The latter could be larger food businesses, but could range from aid organisations, hygiene inspectors to trade bodies and local business groups. 4) Monitoring and reporting, to assess progress against targets, allow changes in action to be made in response to this and to recognise (publically) achievements (show what can be done) and benefits of taking action. Above all what is important is to challenge the status quo (facing up to the ‘it’s too difficult’, ‘it will take too much time and effort’ and ‘we’ve always done it this way), involve and empower people across organisations and groups to help develop solutions, and take a structured approach to testing these out, and measuring impact, in real-world situations. Governments are uniquely placed to support efforts to reduce food waste, through policies directly aimed at encouraging food waste prevention but also those that can have an impact on the effectiveness or feasibility of potential solutions to reduce food waste. Specific areas where governments can take steps to support action by both the public and private sectors include:
Guidance, regulations and financial incentives to support the waste or food
utilisation hierarchy, and communication to local decision makers and business and
household users to ensure adherence to this (i.e. prevent food waste
arising>>redistribution of surplus food for humans>animal feed>> collection and
treatment).
Policies that support optimal use of packaging materials and effective
labelling. Whilst there are legitimate concerns about over packaging food, appropriate
amounts of packaging can significantly reduce food waste. On-pack guidance also helps
to reduce waste, for example applying ‘best before’ rather than ‘use by’ dates where
possible, communicating whether products can be frozen, when and for how long, and
how best to store foods for maximum safe and high quality life.
Education and training. It is important that both children and adults are provided with
the knowledge and skills necessary to manage food at home and in the workplace in such
a way that supports food waste prevention and efficient and competitive business.

12
Integrated advice on healthy eating and food waste. It is important that there is
an integrated approach to policies around food waste and healthy eating, as encouraging
consumers or schools and other institutions to purchase healthier and often more
perishable food, without equipping them with the necessary skills to use such produce,
risks more food being wasted.
Procurement strategies and contracts. A significant percentage of meals eaten by
people around the world will be provided as part of government services (education,
healthcare and other government funded institutions), which provides an opportunity to
influence waste arising during preparation and via diners.
Research, technology and infrastructure development. Harnessing the wealth of
existing knowledge from the social, biological and physical sciences, and more applied
research, could promote rapid progress. A report from the Institution of Mechanical
Engineers (IMechE, 2013) makes recommendations that ‘governments of developed
nations put in place programmes that transfer engineering knowledge, design know-how,
and suitable technology to newly developing countries. This will help improve produce
handling in the harvest, and immediate post-harvest stages of food production’ and
‘Governments of rapidly developing countries incorporate waste minimisation thinking into
the transport infrastructure and storage facilities currently being planned, engineered and
built’. More recently IMechE (2014) have suggested that about a quarter of food waste in
developing world could be eliminated with better refrigeration equipment.
As outlined in the sections above food waste arises across all sectors of the food chain, for a multitude of reasons, influenced by the actions of many different actors. There is no single solution to reducing food waste, and the most effective strategies will vary depending on the state of development and focus of the food industry, diets and culture, the scale and nature of businesses, whether they are in the public or private sector, existing policy and regulatory landscapes, business and consumer cultures and capabilities and so on. Significant reductions in food waste are possible, but will require collaborative working of those in the public and private sector. There are some important principles which should be applicable to a wide range of circumstances, and an increasingly broad evidence base available to inform the development of tailored plans. In addition several national, regional and global organisations have produced recommendations for action, and detailed advice on how to formulate and deliver initiatives to reduce food waste. UNEP, FAO and WRAP have collaborated on one such resource (UNEP et al 2014), which provides a suite of materials and a structured approach. Investments of time and money will be required, but the potential economic and environmental benefits are huge, and the consequences of not taking sufficient action are serious – for billions of individuals, countries, and the food system as a whole.

13
1.0 Introduction The value of the global food and agriculture sector is around US$8 trillion, or 10% of global GDP, and it provides employment to over a billion people, or a third of the world’s workforce (ILO 2014). The production and consumption of food demands huge resources, in terms of raw materials and the land required to produce these, and the energy, capital, labour required for growing, manufacturing, packaging, storing, transporting and cooking around 4 billion tonnes of food for 7 billion people. Technological advances and cultural/societal shifts have brought huge changes to both the industry and food consumption, and the rate of change is accelerating. However, major adjustments are required to the food system in order to provide sufficient, healthy food for a growing and developing world population, to ensure international and national food supply chains are secure and to reduce environmental impact (including climate change mitigation and the protection of biodiversity). Solutions include increasing production (sustainable intensification), making production and products more sustainable (reducing impacts across a range of metrics, more sustainable sourcing and so on) and reducing the impact of food consumption (including the amounts and types of food eaten, and methods of food storage and preparation). Reducing food waste2 is an important and achievable approach to making both food production and consumption more sustainable as well as delivering significant economic benefits. WRAPs work on ‘Securing the Future’ illustrated how reducing food waste could make substantial contributions to reducing the impact of food (WRAP 2010). Recent work by the World Resources Institute (WRI 2013a,b) and Ray et al (2013) has again highlighted the need to develop a ‘menu of solutions’ to achieve a sustainable food system that include reducing the amounts of food wasted. Roughly one-third of all food produced in the world is thought to end up as waste based on weight (FAO 2011), although some estimates put the figure as high as 50%, or up to 2 billion tonnes a year (IMechE 2013). This translates in to about one-quarter of all food based on calories (Searchinger et al 2013). FAO (2013) estimate that the global carbon footprint of food waste, excluding land use change, was 3.3 billion tonnes of CO2e in 2007, equivalent to approximately 7% of global GHG emissions3. FAO (2013) also estimates that the value of the food wasted is around US$750 billion to US$1 trillion (producer vs retail prices), but the total cost of global food waste could be in excess of US$2 trillion a year, almost the same as the income of all countries in Sub-Saharan Africa4. These additional costs include environmental, estimated at US$700 billion, and social costs at US$1 trillion, although even these figures are likely to be an underestimate, being based only on those costs that FAO have managed to quantify. Many of the costs of food waste borne by nature (e.g. unnecessary deforestation) and people (e.g. wasted effort) have not yet been quantified. However the above estimates are all based on producer prices, and FAO (2013) state that these will be underestimates, particular as food wasted later in the supply chain has a much higher value. By 2050, with a population of at least nine billion (Kharas 2010), an additional 60% (more than 2 billion tonnes) of food will be required unless actions are taken to reduce food waste
2 For the purposes of this paper ‘food waste’ is used as shorthand for ‘food and drink waste’ 3 This based on the assumption of approximately 47 Gtonnes of global GHG emissions in 2007. 4 Gross domestic product based on purchasing-power-parity (PPP) valuation of country GDP of 2.1 trillion current international dollars for all countries in Sub-Saharan Africa in 2012. Based on data query from the IMF World Economic Outlook Database updated in April 2014, http://www.imf.org/external/pubs/ft/weo/2014/01/weodata/index.aspx

14
and address other aspects of food production and consumption. Searchinger et al (2013) have estimated that cutting global food waste in half by 2050 would reduce the food gap by roughly 20 percent. Agriculture accounts for nearly one-quarter of global GHG emissions and 70 percent of all freshwater use. As the population continues to grow, and with billions joining the global middle class in the coming decades, even more pressure will be placed on the global food system. By 2050, agriculture alone could consume 70 per cent of the total allowable “budget” of GHG emissions consistent with limiting global warming to two degrees. Reducing food waste will mean that production becomes more efficient, GHG emissions per tonne of food production would be reduced and more food available to feed a growing population5. Reduced food waste therefore does not only help to produce less GHG emissions but also increases the supply of food demanded by a growing population. Whilst recent years have seen an increasing focus internationally, nationally and regionally on food waste, the evidence relating to what food waste is being generated and why remains limited. More and more studies are being published, which help to reinforce the importance of tackling the issue, but there are very few examples yet of the impact of food waste prevention initiatives. WRAP has extensive expertise in quantifying and tackling food waste in the UK, and of supporting international efforts to reduce food waste. These efforts have helped to reduce avoidable household food waste in the UK by 21% (1.1 million tonnes) between 2007 and 2012 (WRAP 2013a) at a time when the number of households increased by almost 4%. This avoided food waste had a retail value of around £3.3 billion (US$5.3 billion) in 2012 alone, and was associated with 4.4 million tonnes of CO2 equivalents (CO2e); the same as would be saved from taking 1.8 million cars off UK roads. WRAP also manages voluntary agreements with both the grocery and hospitality and food service sectors aimed at delivering measurable reductions in food waste. This paper draws on the UK experience to illustrate the level and types of food waste that occur across different sectors, the drivers for waste generation by consumers and businesses, and the interventions adopted and their impacts. The economic and environmental benefits of reducing food waste are explored in more detail, and how targeting interventions developed and applied in the UK might be used elsewhere in the world to reduce food waste, and what benefits this could deliver.
5 Changes in overall future GHG emissions associated with food production will also be dependent on population increases and dietary shifts.

15
2.0 Why preventing food waste must be the priority It is important to stress that efforts to reduce food waste are much more effective in reducing GHG emissions than any form of food waste treatment. Table 1 gives the emissions increase or saving from one tonne of food waste treated or disposed of in different ways, compared to preventing a tonne of food waste. Please note that the difference between any two actions below is the difference between the two values (e.g. the difference between redistribution to animals and anaerobic digestion is 58kg CO2e). Sending food waste to landfill is the worst possible option, creating an additional 536kg of emissions. Where possible, redistribution to people (i.e. keeping the food from actually going to waste) is by far the best option. Therefore interventions should first and foremost be aimed at keeping food within the human food supply chain.
Table 1: Change in life cycle emissions from different waste management options
Route for management or disposal
Emissions incurred (+) or avoided (-) CO2 equivalent emissions per tonne of food waste
Place in waste hierarchy
Redistribute to people from manufacture / retail
-3090 kg Prevention
Redistribute to animals from manufacture
-220 kg Prevention / Recovery
Anaerobic Digestion (AD) -162 kg Recovery
Incineration (with energy recovery) -89 kg Recovery
Composting -39 kg Recovery
Land spreading -39 kg Recovery
Incineration (without energy recovery) 0 kg6 Disposal
Landfill +536 kg Disposal Source: WRAP Analysis
These are the emissions per waste management option and include avoided raw materials and energy (e.g. AD avoids some fertiliser and gas fired electricity generation) but exclude avoided emissions
from alternative waste management options. This means that negative numbers are savings, positive numbers are net emissions. The relative impact of different options is the difference between the
figures in each row. For comparison preventing a tonne of food waste would avoid between 4 to 4.6
tonnes of CO2e.
The costs of collecting and treating food waste can also be substantial. Based on analysis of data in WRAP (2012), EPA (2014), van Haaren et al (2010), in the UK alone gate fees and landfill taxes amount to the equivalent of around US$450 million a year just to dispose of household food waste, and in the US the costs of landfilling the 32 million tonnes of municipal food waste are likely to be around US$1.5 billion a year.
6 Biogenic carbon dioxide is assumed to be in short cycle and therefore its emission is equivalent to uptake during plant growth. Biogenic methane is accounted for where this arises.

16
3.0 Food waste globally – a brief overview In 2011 FAO published a ground breaking report on global food waste, which for the first time attempted to quantify food waste by food (commodity) type, supply chain stage and region (FAO 2011). Subsequently FAO estimated the regional economic and environmental impacts of food waste (FAO 2013). Figures 1 to 3 summarise some of this data, highlighting the scale of the issue by region7 and by supply chain stage (agriculture, post-harvest to sale and consumption). This suggests that 415 million tonnes of food is wasted in agriculture globally, worth US$240 billion, 600 million tonnes is wasted after harvest and up to the point of sale (with a value of US$340 billion) and 280 million tonnes is wasted at the consumption stage (with a value of US$170 billion). However the above estimates are all based on producer prices, and FAO state that these will be underestimates, particular as food wasted later in the supply chain has a much higher value. Nahman and de Lange (2013) suggest that in South Africa the value of food waste increased from around US$450 a tonne to over US$1,100 a tonne between agriculture and consumption. In the UK the value of food waste at different points on the supply chain, vary from around £950 (US$1,500) a tonne (manufacturing) to an average of £2,775 (US$4,450) a tonne for hospitality and food service businesses (ranging from ca £1,660 (US$2,600) to £4,000 (US$6,350) a tonne) to almost £3,000 (US$4,800) a tonne (consumers) (WRAP 2013a,f,g). The US Department of Agriculture (USDA 2014) estimated that 60 million tonnes of food was wasted at retail and consumer stages, with a retail value of US$162 billion. This translates in to $2,700 a tonne, compared to the average $470 per tonne FAO estimate for producer prices. The Ministry of Agriculture Forestry and Fisheries (MAFF) in Japan has estimated that about 23 million tonnes of food was wasted in 2007, worth the equivalent of US$110 billion, or an average of US$4,800 a tonne (OECD 2014). The true economic cost of food waste at the latter stages of the supply chain will therefore be much higher than the estimates quoted above. Using conservative estimates for retail prices the true cost of global consumer food waste for example, would exceed US$400 billion8.
7 For a list of countries within each region see annex 1 of FAO (2011) 8 Using US$2,500/tonne for North America and Europe; US$1,000/tonne for industrialised Asia and US$550 for all other regions

17
Figure 1: Amounts of food waste arising by region and by supply chain stage (based on FAO data, 2011)
Figure 2: GHG emissions linked to food waste arising by region and by supply chain stage (based on FAO data, 2011)
-
20
40
60
80
100
120
140
160
180
Europe North America& Oceania
IndustrializedAsia
Sub-SaharanAfrica
North Africa,West &
Central Asia
South &Southeast Asia
Latin America
Am
ou
nt
of
foo
d w
aste
(m
illio
n t
on
nes
)
Agriculture Postharvest/Processing/Distribution Consumption
-
50
100
150
200
250
300
350
400
450
500
Europe NorthAmerica &
Oceania
IndustrializedAsia
Sub-SaharanAfrica
North Africa,West &
Central Asia
South &Southeast
Asia
Latin America
GH
G e
mis
sio
ns
linke
d t
o f
oo
d w
aste
(m
illio
n
ton
nes
)
Agriculture Postharvest/Processing/Distribution Consumption
18
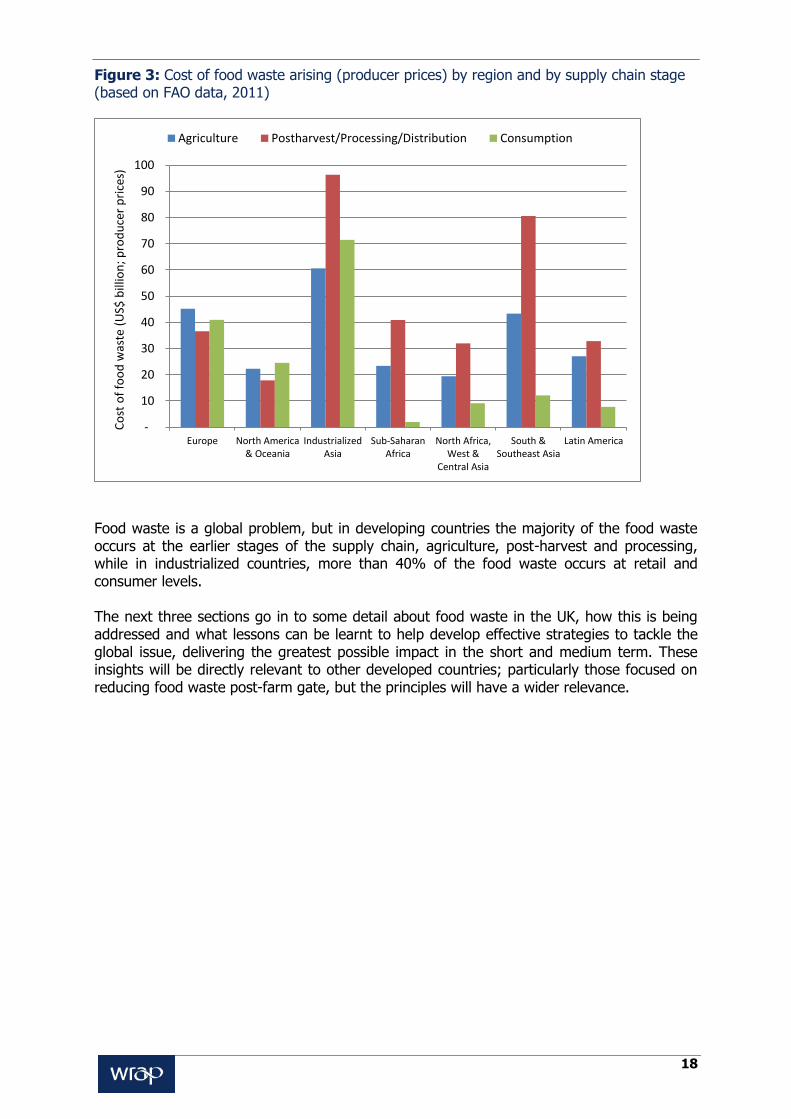
Figure 3: Cost of food waste arising (producer prices) by region and by supply chain stage (based on FAO data, 2011)
Food waste is a global problem, but in developing countries the majority of the food waste occurs at the earlier stages of the supply chain, agriculture, post-harvest and processing, while in industrialized countries, more than 40% of the food waste occurs at retail and consumer levels. The next three sections go in to some detail about food waste in the UK, how this is being addressed and what lessons can be learnt to help develop effective strategies to tackle the global issue, delivering the greatest possible impact in the short and medium term. These insights will be directly relevant to other developed countries; particularly those focused on reducing food waste post-farm gate, but the principles will have a wider relevance.
-
10
20
30
40
50
60
70
80
90
100
Europe North America& Oceania
IndustrializedAsia
Sub-SaharanAfrica
North Africa,West &
Central Asia
South &Southeast Asia
Latin America
Co
st o
f fo
od
was
te (
US$
bill
ion
; pro
du
cer
pri
ces)
Agriculture Postharvest/Processing/Distribution Consumption

19
4.0 UK experience – establishing a robust evidence base In order to facilitate its work on food waste prevention and management WRAP has proposed a simple definition of food waste9, which is: ‘Food waste is any food that had the potential to be eaten, together with any unavoidable waste, which is lost from the human food supply chain, at any point along that chain’ This definition covers:
Only food produced for human consumption;
All food and drink types, all disposal routes, and all sectors of the supply chain; and
Both avoidable (edible) and unavoidable (inedible) food waste.
This definition does not class as waste food or food surplus used as animal feed as this is not viewed as ‘leaving the human food supply chain’, and therefore not considered to be waste. Three major WRAP studies (WRAP 2013a,f,g) estimated annual food waste arisings within UK households, hospitality and food service, food manufacture, retail and wholesale sectors at around 12 million tonnes, 75% of which could have been avoided. This had a value of over £19 billion a year (US$30 billion), and was associated with at least 20 million tonnes of GHG emissions. Around 90% (by weight) of the avoidable food waste arises in households and food manufacture, although waste arising in one part of the supply chain is certainly influenced by other parts of the chain. Based on Environment Agency (2004), WRAP estimate that 3 million tonnes of food waste arises from other sectors. This includes estimates for other food thrown away by consumers out of home (e.g., from home-made lunches at work, as litter, in litter bins) and the pre-factory gate stages of the food supply chain. Existing estimates of agricultural food waste are indicative. This results in a total of 15 million tonnes of food waste. In comparison, around 43 million tonnes of food are purchased in the UK (the majority for in home use), meaning that the amount of food wasted throughout the supply chain is equivalent to around a third of that purchased. In addition to food waste there are also 2.2 million tonnes of food or food by-products from food manufacturing used as animal feed, and another 2 million tonnes of animal by-products sent to rendering plants. Annex 1 illustrates the ‘food loop’ in the UK. This type of detailed evidence base allows Governments, organisations such as WRAP and its partners to make strategic decisions regarding the prevention, collection and treatment of food waste.
9 Other definitions are in common use, notably that developed by the FAO (for example, see FAO, 2011). In that definition food waste as defined by WRAP would be split in to food losses (typically arising in primary production and manufacture) and food waste (typically arising in retail and households)

20
Figure 4: Amounts of food waste arising in the UK by sector (total equals ca 15 million tonnes)
* includes other out of home food waste (e.g. in litter), and pre-factory gate food waste. NB data for household also includes waste to sewer, which is not currently available for other sectors 4.1 Household food waste (WRAP 2013a) The 7.0 million tonnes of food waste thrown away from households in 2012 is enough to fill London’s Wembley Stadium nine times over, and represents 19%, by weight, of food brought into the home. Of this total:
4.2 million tonnes (or 60% of the total) is avoidable, worth £12.5 billion (US$20 billion).
This avoidable waste is food that would have been edible at some point prior to being
thrown away, for example slices of bread, apples, yoghurts etc.
1.2 million tonnes (17% of the total) was considered ‘possibly avoidable’. This includes
bread crusts and potato peelings that some people eat but others do not.
1.6 million tonnes (23% of the total) was unavoidable waste. Five types of waste made
up 60% of this (tea waste, banana skins, poultry bones, onion skins and orange peel).
For the average household, the cost of the avoidable food waste was around £470 (US$750) per year, rising to £700 for the average family (US$1,100). The higher the number of people in a household, the greater the amount of food waste generated, although single-person households threw away, on average, over 40% more avoidable food waste than the overall amount per person in the UK, worth £290 (US$460) a year compared to the UK average of £200 (US$320) per person. Just under half of avoidable food waste (worth £5.6 billion; US$9 billion) was classified as ‘not used in time’: thrown away because it had either gone off or passed the date on the packaging. This included large amounts of bread, milk and fresh potatoes. A further 31% (worth £4.1 billion; US$6.6 billion) was classified as ‘cooked, prepared or served too much’: this included food and drink that had been left over after preparation or serving, such as carbonated soft drinks, home-made and pre-prepared meals, and cooked potatoes.

21
The remaining reasons are linked to personal preferences including health reasons and not liking certain foods (£1.9 billion; US$3 billion), and accidents, including ‘food dropped on the floor’ and ‘failure of a freezer’ (£560 million; US$900 million). The reasons for disposal vary considerably by food group (see figure 5). For the following categories, most was wasted because it was not used in time: fresh vegetables and salads, bakery, dairy and eggs, and fruit. For example, avoidable fresh vegetable and salad wasted because it was not used in time cost £1.1 billion (US$1.8 billion), approximately two-thirds of the total cost of fresh vegetables and salads thrown away. In contrast, drinks and meal waste had high levels of waste from leftovers: too much was prepared, cooked or served. There are many potentially interrelating factors that influence whether food is consumed or wasted (see figure 6), ranging from macro (cultural, economic etc.) to micro (knowledge of what can be frozen, portion sizes etc.), and related to the individual or family, the nature of the food bought or how it is sold.
Figure 5: Weight of avoidable food and drink waste by food group, split by reason for disposal
22
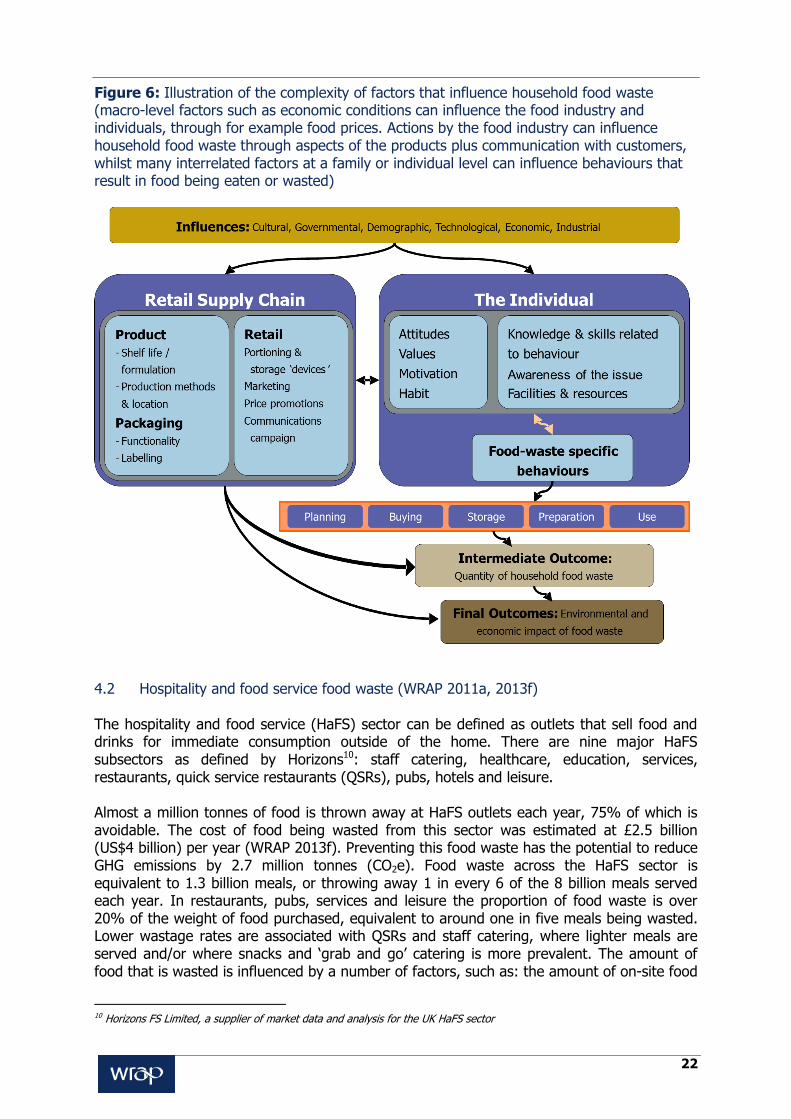
Figure 6: Illustration of the complexity of factors that influence household food waste (macro-level factors such as economic conditions can influence the food industry and individuals, through for example food prices. Actions by the food industry can influence household food waste through aspects of the products plus communication with customers, whilst many interrelated factors at a family or individual level can influence behaviours that result in food being eaten or wasted)
4.2 Hospitality and food service food waste (WRAP 2011a, 2013f) The hospitality and food service (HaFS) sector can be defined as outlets that sell food and drinks for immediate consumption outside of the home. There are nine major HaFS subsectors as defined by Horizons10: staff catering, healthcare, education, services, restaurants, quick service restaurants (QSRs), pubs, hotels and leisure. Almost a million tonnes of food is thrown away at HaFS outlets each year, 75% of which is avoidable. The cost of food being wasted from this sector was estimated at £2.5 billion (US$4 billion) per year (WRAP 2013f). Preventing this food waste has the potential to reduce GHG emissions by 2.7 million tonnes (CO2e). Food waste across the HaFS sector is equivalent to 1.3 billion meals, or throwing away 1 in every 6 of the 8 billion meals served each year. In restaurants, pubs, services and leisure the proportion of food waste is over 20% of the weight of food purchased, equivalent to around one in five meals being wasted. Lower wastage rates are associated with QSRs and staff catering, where lighter meals are served and/or where snacks and ‘grab and go’ catering is more prevalent. The amount of food that is wasted is influenced by a number of factors, such as: the amount of on-site food
10 Horizons FS Limited, a supplier of market data and analysis for the UK HaFS sector

23
preparation, over-production of meals, menu choice and the extent to which consumers leave food uneaten. Key findings on the composition of food being wasted include:
40% of all food waste is associated with ‘carbohydrate foods’, including the following
avoidable categories:
potato and potato products (21%);
bread and bakery (12%); and
pasta/rice (7%).
The higher value food types account for a lower proportion of avoidable food waste, for
example:
Fruit and vegetable food waste (15%); and
Meat/fish (6%).
The quarter of all food waste that is unavoidable mainly consists of fruit and vegetable
peelings.
WRAP also carried out research to understand the point at which food is being wasted from spoilage, food preparation and from customer plates in different types of commercial kitchens, and identify the actions that would most significantly reduce food being wasted. This research shows that, on average:
21% of food waste arises from spoilage;
45% of food waste arises from food preparation; and
34% of food waste is generated from customer plates.
4.3 Manufacturing and retail supply chain food waste (WRAP 2013g) In 2012 WRAP undertook work to provide robust estimates of food waste for the grocery supply chain (agriculture/fishing was excluded from this supply chain research, as was waste disposed to sewer; although WRAP (2011b) contains estimates for this from signatories to its Courtauld Commitment). All food waste arising in manufacturing is attributed to the grocery retail market, although a proportion of manufacturing output will serve the hospitality and food service sector11. Total food waste was found to be 4.3 million tonnes, including 3.8 million tonnes of segregated food waste and 0.5 million tonnes of food included in the mixed, non-segregated waste stream, most of which would have been avoidable. Food waste in manufacturing amounts to 3.9 million tonnes and in grocery retail (and wholesale) to 0.4 million tonnes. WRAP estimates that food waste is valued at £3.7 billion (US$5.9 billion) for manufacture and £0.5 billion (US$0.8 billion) for retail. The total represents around 7% of consumer expenditure on food and drink and 8.6% of the sectors Gross Value Added (GVA). These percentages are likely to be a higher proportion than many grocery retailer and manufacturer profit margins (in comparison with sales). Whilst waste cannot be reduced to zero, there are significant opportunities to reduce it and achieve the associated economic benefits of doing so.
11 Industrial classifications based on the dominant business activity at a site do not differentiate between grocery retail and foodservice markets. Similarly, waste audit data and Courtauld Commitment returns do not split out waste arisings at a manufacturing site with respect to these different markets.

24
Depending on whether the food was suitable for animal feed or human consumption, the estimated environmental cost of food waste in the grocery supply chain is between 1 and 13 million tonnes CO2e respectively. At present it is not possible to break down food waste arising in manufacturing and retail by food type, although WRAP has produced detailed ‘resource maps’ for key food categories, such as fresh fruit and vegetables, meat and fish, which document waste and economic losses through the supply chain (WRAP 2011c). There are a number of market failures that exist in the grocery sector that result in food waste being generated (WRAP and DEFRA 2013), and significant barriers and challenges to tackling food waste. Information failures exist within many businesses, being unaware of the full financial and environmental benefits of producing less waste or disposing of it differently, and of the potential routes to address this. There is often little robust data on the amounts and types of food waste arising, in the public domain or even within many businesses, and reluctance to share such data. Broader co-ordination failures among businesses also contribute, and competitive pressures make individual businesses reluctant to effect significant changes by themselves. Those nearer the end of the supply chain, whose actions may inadvertently lead to food being wasted, may not see that waste, or suffer any financial penalty linked to it or be responsible for its disposal. In addition the benefits arising from investments to reduce waste (or environmental impact) may not be distributed fairly (e.g. producer vs retailer). There will also be concerns over the implications of reduced consumer food waste, and altered purchasing patterns (on production volumes, profitability), which could influence participation in efforts to help customers reduce waste at home. Overall, achieving change (e.g. large reductions in food waste) is not just dependent on the financial resources available, but on having the necessary mechanisms in place to co-ordinate, support and monitor the delivery of food waste prevention programmes. Figure 7 illustrates some of the potential reasons for food waste between farm gate and purchase, and show (in the overlapping parts of the ovals) where collaborative action between producers and manufacturers, and retailers and HaFS operators is required to have maximum impact. There are significant and complex interactions between manufacturers and retailers which underlines why whole chain collaboration is critical for food waste prevention.

25
Figure 7: Potential reasons for food waste from post-farm gate to purchase (waste arises in all parts of the supply chains, and the causes will be numerous - potential reasons for food waste from post-farm gate, through to purchase are illustrated, and a Venn diagram has been used to illustrate that there are reasons for waste that different parts of the supply chain have in common, and therefore can help reduce through collaboration).
Looking across the whole supply chain, including households, it is possible to make some generalisations as to why food waste occurs:
A lack of awareness of the amounts of food waste generated, and its value, or an
acceptance of the amount of food waste created
A lack of adequate planning/ordering/forecasting which results in a mismatch with the
amount of food required
A lack of skills or equipment to deal with an excess of food or changes in circumstances
(e.g. what can be frozen, what could be cooked but then kept chilled for use later)
Not understanding and making use of date labels and other food guidance (which can
lead to premature disposal)
Poor storage that reduces the shelf-life of food (incorrect storage temperatures, light
levels, premature removal of or not re-closing packaging etc.)
Inefficient preparation/processing that results in low utilisation of ‘raw’ foods
Not using up ‘leftovers’ (lack of skills or know-how)

26
5.0 UK experience - strategies to reduce food waste The primary mechanisms in the UK for facilitating the reduction in food waste are the Courtauld Commitment12 and Hospitality and Food Service Agreement13, both voluntary agreements managed by WRAP, and funded by Westminster, Scottish, Welsh and Northern Ireland governments, and the consumer facing Love Food Hate Waste (LFHW) campaign14. All tonnage figures discussed exclude packaging waste. 5.1 Household food waste Over the last eight years WRAP has built up a comprehensive evidence base which has raised awareness, developed a strong case for change and given focus to the areas where consumers need the most help, where business and local authorities can benefit, and where the biggest impacts can be made. Influencing decisions around food product design, production processes, purchase and use is challenging. WRAP has worked with a wide range of partners to develop a credible, integrated and consistent approach, increasingly supporting people and organisations to develop their own action plans. WRAP provides a suite of tools and guidelines making it easier for those consumers who want to change to buy the right amounts of food and make the most of what they buy. WRAP launched LFHW in 2007 to help deliver practical ways to reduce food waste, and expanded an agreement with the food industry (the Courtauld Commitment) to help consumers make more of the food and drink they buy, and throw less away. The strategy for reducing household food waste consisted of three parts: large scale communications campaigns, local engagement and changes to products, packaging, labelling. In terms of consumer engagement it is critical to understand current motivations and barriers to action. Motivations to prevent food being wasted vary between consumer segments, the potential to save money is the strongest, but others almost as strong relate to how it reflects on the individual and their role in the home. For most people highlighting the environmental benefits of wasting less food is not strong enough to initiate action, but combining that with the potential cost saving is effective. Efforts are now being made to make the link with the broader impact of food waste, illustrating the energy, water and effort that go in to the production of food, and trying to strengthen that connection between people and the food they buy. LFHW is a mainstream consumer facing campaign, which aims to raise awareness of the benefits of reducing food waste, to the individual and environment. It enables a change in behaviour through the provision of helpful tips, recipes and advice. The tone is positive, and encouraging. It communicates directly to consumers through the media and website, but also through a range of partnerships. The engagement strategy has evolved over time – partly to ensure that as many people as possible are reached, partly in response to new insights (e.g. around attitudes to packaging as a barrier), partly to keep the campaign fresh and introduce more values-based messaging; and also to respond to changing circumstances (such as reduced public spending on advertising) and new communication channels. LFHW now works on jointly-funded initiatives (such as ‘Fresher for Longer’15) and provides training for people to cascade messages locally (in their businesses or communities).
12 WRAP, ‘The Courtauld Commitment’, http://www.wrap.org.uk/node/14507 13 WRAP, ‘The Hospitality and Food Services Agreement’, http://www.wrap.org.uk/content/hospitality-and-food-service-agreement-3 14 WRAP, ‘Love Food Hate Waste’, http://www.lovefoodhatewaste.com/ 15 Waste and Resources Action Programme, Reducing food waste - how packaging can help, http://www.wrap.org.uk/fresherforlonger and WRAP (2013k)

27
LFHW engages with millions of consumers directly (for example through the web-site, newsletters, social media and PR), but most delivery depends on working through a wide range of partners – for example local government, food retailers, community groups and organisations such as the National Farmers Union, WWF and the National Federation of Women’s Institutes. In order to help partners deliver LFHW messages, or complementary ones, there are a wide range of guidelines, briefing materials, templates, (all available via a dedicated partners website16) and training. The media are invaluable to help raise awareness, and enable action, via major TV and radio programmes, and articles in both broadsheet and tabloid newspapers – for example talking about understanding date labels and using leftovers. Food businesses have run multi-million pound campaigns, included articles in their in-store magazine and on-line. More than three quarters (around 300) of local authorities in the UK have run LFHW initiatives that help local residents, including road shows, cookery demonstrations and recipe competitions, working with community groups, housing associations, and businesses. Local celebrity chefs are often used, and significant coverage in the local press and on local radio can usually be obtained. Since 2007, tackling food waste has received much attention in the UK and indeed around the world: Governments, international agencies, businesses, local authorities, community groups and many others have worked with consumers to change the way food is bought and used. Major retailers, food brands and other manufacturers have also helped through innovations in products, packaging and labelling. Simplifying date labelling helps to reduce consumer confusion, and enhanced storage and freezing guidance helps consumers know what should be stored where. WRAP worked with governments, regulators and industry to update official guidance, removing barriers to innovation. Most retailers moved to a single date label (removal of ‘sell by’ or ‘display until’ dates), are switching from ‘use by’ to ‘best before’ dates where possible (for example on hard cheeses and pasteurised fruit juice) and are changing to ‘freeze by date shown’ rather than ‘freeze on day of purchase’. Most retailers also improved their storage guidance for fresh fruit & vegetables, either on pack or on the loose produce bags, to encourage consumers to store more produce in the fridge where it will last considerably longer. A range of more appropriate pack sizes for products such as bread and salad have also been launched. Processing and packaging can also help to increase shelf-life given to consumers, for example vacuum-packed beef can extend life by five days or more. Innovation was also seen in frozen food and ambient categories – more effective reclosable packaging for frozen peas and fishfingers, and packs of baked beans which once opened can be kept in the fridge for 5 days, and which helps in portioning and recipe ideas. WRAP (2013a) estimated that there was 1.3 million tonnes less household food waste in 2012 compared to 2007, a 15% reduction. Almost all (85%) of this reduction was in food that could have been eaten (avoidable), meaning on average every household in the UK not having to spend £130 (US$210) a year on food bought but thrown away, helping to mitigate the impact of rising food prices. In addition this will have prevented 4.4 million tonnes of GHG emissions a year, and saved a billion tonnes of water. Per household the level the level of avoidable food waste reduced by 24% over this five year period.
16 WRAP, ‘Love Food Hate Waste Partners’, http://partners.wrap.org.uk/

28
The evaluation of specific initiatives is difficult and costly, but a range of localised campaigns and other interventions have reported reductions in food waste of around 15% to 80%17. Further research is in progress to determine the scalability and longevity of such changes. The contributions to the large reduction in avoidable food waste were primarily concentrated in five categories, each with reductions of more than 100,000 tonnes: home-made and pre-prepared meals, bakery, drink, fresh fruit and dairy and eggs. A range of behaviours (buying appropriate amounts, storing food under the optimal conditions, portion control, using the freezer more effectively etc.) and technical innovations (range of pack sizes available, improved storage and freezing guidance, clearer date labelling, increased shelf-life, packaging innovations etc.) will have contributed to these reductions, supported by LFHW and its partners through a wide range of national and local initiatives. Between 2007 and 2012 the ‘public sector’ (national and local government) cost of the programme of activities to reduce household food waste was ca £13 million (research, development of materials, delivery of the campaign, and providing funding for delivery of LFHW locally). The cumulative (retail) value of the food prevented from becoming waste over the same period was £13 billion (US $21 billion). However it is important to understand how much of the reduction in food waste might be attributed to interventions aimed at delivering this, as opposed to other factors that could have stimulated change. WRAP estimates that around half of the reduction over this time period was influenced by WRAP and partner activity, the remaining half via deep recession and rapidly rising food prices between ca 2007 and 2010 (WRAP 2014). Interventions were also supported or delivered by the private sector (food retailers and brands in particular), and although detailed private sector costs are difficult to obtain (commercial sensitivity etc.), WRAP estimates that between 2007 and 2012 private sector spend at least matched the public sector spend. Therefore in terms of household food waste, over this time period, every £1 (US$1.6) spent by the public and private sector could have contributed to around £250 (US$400) of food waste being prevented. It is also important to note that this reflects what happened in the past, against a backdrop of very steep rises in food price inflation and difficult economic times, and it is not possible to assume the same impact going forward. WRAP (2013d) evaluated the impact of a six-month LFHW campaign in West London, which resulted in changes in behaviour and reductions in food waste (ca 15% for total household food waste). The campaign cost ca £170,000 (US $270,000), and the boroughs were estimated to have saved £1.3 million (US $2.1 million) in avoided disposal costs (i.e. for every £1 invested up to £8 was saved). It was also estimated that residents could have saved around £14 million (US $22 million) through avoiding food being thrown away. This would yield an estimate of £1 (US$1.6) invested saving around £90 (US$140) for consumers and local authorities. Now in its third phase the Courtauld Commitment, with more than 50 of the largest food retailers, brands and manufacturers as signatories, has a target to reduce household food waste by another 5% by 2015, and WRAP’s CEO Liz Goodwin has indicated that a combined effort could see another 1.7 million tonnes of avoidable food waste a year prevented by 2025. This would result in a halving of avoidable household food waste compared to 2007.
17 For example see WRAP 2008b, 2011f, 2013d and ‘Less Waste, Food Waste Challenge’, http://www.lesswaste.org.uk/food_waste_challenge

29
5.2 Hospitality and food service food waste The Hospitality and Food Service Agreement, launched in June 2012, is a voluntary agreement to support the sector in reducing waste and recycling more, and has targets to reduce food and associated packaging waste by 5% and increase recycling rate to 70% or more by the end of 2015. The Agreement now has 175 signatories and supporters, covering 24% of the sector by turnover, and is flexible to allow any size of organisation to sign up, from multi-national companies to smaller businesses, from sector wholesalers/distributors to trade bodies. Signatories and supporters work towards delivering collective goals, and also influence their peers and supply chains, therefore accelerating change across the sector. Working groups encourage collaborative action delivering accelerated change, and the development of innovative approaches to address existing gaps in sector knowledge, which currently act as barriers to change. Interim results are not yet available, but there are a range of published case studies detailing successful approaches to reduce waste, for example a meal supplier to the public sector cut waste by 60% through small changes to the size of cooking batches18. 5.3 Manufacturing and retail supply chain food waste The Courtauld Commitment (phase 2) introduced a target to reduce food and packaging waste in the supply chain by 5% (2012 vs 2009). This was exceeded, with reductions of 7.4% (217,000) tonnes p.a.). In order to help deliver this reduction, WRAP developed the W.A.S.T.E. process19 to help businesses identify waste and reduce it within their operations and across supply chains. This is described in UNEP et al (2014). Good Practice Guidance and case studies highlight how waste has been prevented at UK manufacturing sites. There are opportunities to prevent waste within an individual site or business and across supply chains. Working collaboratively across a supply chain can lead to higher levels of waste prevention. Specific examples of success include a major manufacturer of pre-prepared foods identifying how to cut food waste by 25% after a 3 month project, and a retailer and supplier working together to optimise how bananas were supplied to store, and identifying how to reduce waste by 90%. A similar exercise with bagged salad suggested waste could be reduced by between a third and 80% (WRAP 2013h). Prior to launching the third phase of the Courtauld Commitment WRAP worked closely with UK Governments to undertake a detailed cost benefit analysis, which took in to account both private and public sector costs that might be incurred in delivering the target reductions in household, manufacturing and retail waste. Over the three years of the agreement (2012 to 2015) the estimated net benefit was more than £1.2 billion (US$1.9 billion) for household food waste and £230 million (US$365 million) for supply chain waste (WRAP and Defra 2013) (see table 2). Many of the actions needed to reduce food waste rely on low-cost solutions, changes to processes, procedures and interactions between people and organisations.
18 WRAP, ‘Good practice case studies’, http://www.wrap.org.uk/content/good-practice-case-studies 19 Waste definition, Analyse and identify root causes, Solution generation, Trial, evaluate and measure and Execute sustainable change and reduce waste

30
Table 2: Costs and benefits of waste prevention activities related to the third phase of the Courtauld Commitment (2012 – 2015) Changes vs. Counterfactual Scenario
Household Food waste
Manufacturing & Retail
Packaging Total
Total Net
Present Value
(NPV)
£1,200,000,000 £230,000,000 £200,000,000 £1,600,000,000
Tonnes of
waste
prevented (tonnes)
510,000 310,000 280,000 1,100,000
Tonnes of GHG emissions
prevented
(tonnes CO2e)
1,800,000 750,000 320,000 2,900,000
Value of GHG
emissions
prevented (£)
£71,000,000 £26,000,000 £9,300,000 £110,000,000
NPV per tonne
of waste prevented (£)
£2,350 £740 £710 £1,450
More recently WRAP founded The Product Sustainability Forum (PSF)20, a collaboration of organisations made up of grocery and home improvement retailers and suppliers, academics, NGOs and UK Government representatives, which provides a platform for these organisations to work together to measure, improve and communicate the environmental performance of the grocery and home improvement products (which includes the reduction in waste). WRAP (2013i) provides a range of practical materials to help implement changes to reduce the environmental impact of grocery products. A series of ‘pathfinder’ projects have been initiated aimed at preventing waste and improving resource efficiency by identifying and implementing specific solutions to waste/resource hotspots and root causes across the supply chain. The projects will also inform the development of transferable learning and a replicable approach for implementing whole chain resource efficiency. As an example, the Co-operative Group is engaging internal stakeholders across its entire fresh potato value chain, from farm to fork, to identify and implement opportunities to prevent waste and improve wider resource efficiency (energy consumption, water consumption and GHG emissions). The intention is that the learning from this exercise will be replicated across other fresh produce in the future. 5.4 All sectors Based on our experience in the UK, WRAP would highlight the following factors as important for successfully reducing food waste: 1) An evidence based strategy, to identify priorities, build a persuasive case for action, develop clear and robust recommendations and inform the development of effective messages and materials for engaging with consumers, industry and other stakeholders.
20 WRAP, ‘Product Sustainability Forum’, http://www.wrap.org.uk/content/product-sustainability-forum

31
2) An integrated approach, looking across the whole supply chain (recognising the influence those at any given stage in the supply chain can have on others in the supply chain), and also in terms of householders incorporating three key elements (national / large scale awareness raising campaigns, local / community engagement to influence behaviours and changes to products, packaging and labelling to make it easier to buy the right amounts of food and use what is bought), which if implemented together deliver much more than any element in isolation. 3) A framework for action, such as the Courtauld Commitment and Hospitality and Food Service Agreement, with collective targets which provides a mechanism for sharing best practice and facilitating the uptake of recommendations for change. 4) Monitoring and reporting, to assess progress against targets, allow changes in action to be made in response to this and to recognise (publically) achievements (show what can be done) and benefits of taking action. Above all what is important is to challenge the status quo (facing up to the ‘it’s too difficult’, ‘it will take too much time and effort’ and ‘we’ve always done it this way), involve and empower people across organisations and groups to help develop solutions, and take a structured approach to testing these out, and measuring impact, in real-world situations.

32
6.0 How reducing food waste delivers economic benefits and contributes to lower GHG emissions
6.1 Economic benefits When considering the benefits of reducing food waste it is relatively straightforward to calculate the immediate benefits to consumers and businesses when they reduce their own waste. However, it is more complex to calculate the exact impact on economic growth (i.e., the change in national income21) that result from a reduction in food waste overall. This requires a detailed understanding of consumer behaviour that is made more complex by rebound effects which are very difficult to model. Direct rebound effects take place when the price of food falls (for example due to reduced food purchases) which makes food relatively cheaper compared with other goods and services. This may increase spend on food as the lower price makes food more affordable22. This could help poorer families to buy more food, or allow others to buy higher quality foods. It is important to remember that the size of any effect on food prices depends on the sensitivity of food prices to the fall in the demand for food due to reduced food waste. As the world population continues to grow so will the demand for food. Increasing prosperity may also change demand, if those consumers that experience increases in living standards increase their consumption of animal-derived foods. It is therefore more likely that reduced food waste will only slow the increase in the demand for food rather than reduce it. In addition, food prices are also determined by many other factors (weather events, geopolitical changes, government policies, stock levels, biofuel production, etc.) which may result in changes to food prices not related to food waste. An analysis of the amounts (tonnage) of food and drink bought in the UK does show a modest reduction, at a household level, of around 4% between 2007 and 2012. This reduction is consistent with consumers having to buy less (as they waste less), but will of course also have been influenced by other initiatives such as those aimed at promoting healthy eating. However, population growth has meant there was only a reduction of ca 0.5% at a UK level, suggesting that an increase in population (of 4.4%) has off-set most of the reduction due to less food being wasted. The UK population is forecast to grow by 6.1 million people by 2025, a 10% increase, and would (with current consumption patterns) require an extra 4.1 million tonnes of food; much more than the further reduction in food waste that may be possible by that time (1.7 million tonnes). Indirect rebound effects take place when consumers’ incomes23 increase and when they reduce the amount of food they buy. This means that consumers may increase their consumption of other goods and services. However, this effect should not be seen as unambiguously negative as reduced waste means that efficiency has increased. Consumers will have higher levels of welfare as they are able to purchase more with same budget (ERM 2012). Therefore, it is important to be aware that these rebound effects exist and design interventions in ways that attempt to minimise any potential unintended consequences, for example messages on how to keep fresh fruit and vegetables fresh for longer could be incorporated in to initiatives aimed at encouraging healthier eating, to increase the probability that food bought will be eaten rather than thrown away.
21 National income here means Gross Domestic Product (GDP). GDP is the is the market value of all officially recognized final goods and services produced within a country in a year, or other given period of time. 22 Economists call this the substitution effect. 23 Economists call this the income effect.

33
WRAP (2014) investigated what happens when people waste less food and what the immediate benefits may be. It revealed that those UK households that had reduced food waste between 2007 and 2010 achieved annual savings of around £1.9 billion per year. The magnitude of this food waste reduction ‘dividend’ was estimated to be equal in value to 2.1% of all expenditure on food and drink in 2011. This research suggested that around half of the food waste ‘dividend’ was used to buy more expensive food and drinks (i.e. to ‘trade up’), while the other half was either saved or spent on other goods or services. The increased spending on more expensive food and drinks means that the value of food and drink purchased will change by less than the reduction in the amount (or weight) of food purchased. This means that some of the increased income is spent on food which reduces the negative impact on food retailers of lower food sales. In addition, it is possible that retailers selling non-food items may be able to attract the proportion of the ‘dividend’ spent on non-food items. This also makes the identification of clear effects on the price of food almost impossible, as some foods may see lower consumption by weight but not necessarily by revenue. For example, if a consumer wastes less fresh chicken then they will need to purchases less chicken but the increase in income means that they are able to afford to buy more expensive (e.g., premium rather than standard) chicken. The WRAP research suggested that deterioration in the economic cycle, represented by an increase in the unemployment rate, was found to be associated with a substitution out of premium and standard grades into economy grades of all fresh chicken. These results provided strong evidence that households ‘trade down’ in their purchases of fresh chicken following deterioration in the economy, as one might expect (and as is observed in UK food purchase data). By contrast, an increase in the ‘food waste reduction activity index’ (FWRAI, designed to reflect levels of interventions to reduce food waste) is associated with substitution out of economy grades of fresh chicken into both standard and premium grades (see figure 8). This behaviour would be expected if an increase in food waste reduction activities caused households to spend some of the proceeds from throwing less food away on buying better quality food.
Figure 8: The change in the sales of different grades of fresh chicken in response to changes in the economy and activities to reduce food waste
Notes: The figure shows the impact of a 1 percentage point increase in unemployment and a 1 standard
deviation increase in the ‘food waste reduction activities index’ on the sales of three types of fresh chicken.
Estimates are based on a regression analysis that also controlled for changes in the prices of the three types of
chicken. All estimates were significant at the 5% level.
-15%
-10%
-5%
0%
5%
10%
15%
Economy FreshChicken
Standard FreshChicken
Premium FreshChicken
Change in sales due to anincrease in unemployment
Change in sales due toincrease in food wastereduction activities

34
At a household level in the UK the amount of food purchased has reduced, as you would expect if households are wasting less food, but this has been ‘compensated’ to a large extent through increases in the population – which may not be the case for many countries. There are also opportunities for the food industry to innovate around added value foods, substitute imports and increase exports to compensate; and of course make savings from reduced waste in the supply chain). The Department for Environment, Food and Rural Affairs (Defra) with advice from WRAP developed a tool to consider the cost effectiveness of different environmental impact reduction measures, including interventions aimed at reducing food waste (DEFRA 2012). The tool uses marginal abatement cost (MAC) curves, an accounting methodology used to rank graphically the cost effectiveness of different environmental impact reduction measures (ERM 2012). The method is based on the UK Treasury’s Green Book24 accounting principles and has been used extensively in energy and climate change modelling. The marginal cost is the cost of eliminating an additional unit of emissions against a projected baseline level of emissions. Total abatement cost is simply the sum of the marginal costs, which is most readily presented as a curve. This provides a convenient means of ranking actions by economic performance (in real terms) and environmental performance. Initial analysis on a wide range of waste reduction initiatives suggested that reducing food waste had the largest potential for both economic savings and reduced environmental impacts in spite of food waste having a smaller impact in terms of number of tonnes of material avoided. Indirect ‘rebound’ effects were not taken into account here due to the large number of assumptions that this will involve. As noted previously we should not view these as unambiguously negative. Rutten et al (2013) suggested that reducing food waste by 50% between 2012 and 2020 could lead to average savings of €192 (US$270) per person or a saving of €94.4 billion (US$130 billion) for the EU as a whole, whilst leaving the EU economy relatively unaffected, although some sectors were predicted to do better than others. A clear and unambiguous benefit of reducing waste is the increase in efficiency and productivity of the food system. The existence of food waste at all stages of the food system means that the system of food production, supply and consumption is not as efficient as it could be. Reducing the amount of food wasted increases efficiency by allowing the production of more food with the same amount of inputs. This means that the capital, labour and natural resources (land, water, and energy) used produce, transport and sell food are used more efficiently and become more productive. Increased productivity is the key driver of growth in most countries, particularly the advanced economies that have fewer natural resources left to exploit. However, even developing countries that are currently achieving most of their growth through natural resources exploitation will be able to gain from increased productivity. Efforts to reduce food waste will also have positive implications for the productivity of other sectors of the economy. A developing country with a population that has improved access to food for its workers will have a healthier and more productive labour force. Investment in the transport infrastructure used to get crops to market quicker, thereby reducing spoilage, will also help other sectors of the economy that use the same infrastructure.
24 HM Treasury guidance for public sector bodies on how to appraise proposals before committing funds to a policy, programme or project, see https://www.gov.uk/government/publications/the-green-book-appraisal-and-evaluation-in-central-governent

35
However, in spite of clear benefits there may not be a strong or visible enough economic incentive for individual actors (business or consumers) to reduce the food waste. Reducing food waste has a cost and one might therefore expect the saving of food to take place only if the cost of saving it is less than or equal to the value of the food saved for human consumption (General Accounting Office 1977), plus any savings associated with the management of food waste. If the cost is higher than the value of the food saved (and any associated waste costs) then there would be no economic gain from reducing the food waste. However, the existence of social benefits (e.g., lower GHG emissions, redistribution to those in need, etc.) from reducing food waste provides additional incentives and a rationale for businesses and governments to intervene. For a business, the benefits of taking action to strengthen its corporate social responsibility position, the relationship with its suppliers, customers and local communities may be harder to quantify but can be a strong motivator. It is also likely that even where economic gains exist, efforts to reduce food waste may not happen without help. It may be that other issues disguise or hinder the opportunity to reduce the waste. This could be due to reasons such as information and coordination failures. An example of an information failure is where individuals may not be aware of the amount of food they waste and/or the gains they can make by reducing the amount of the waste. An awareness raising campaign such as LFHW helps to overcome this lack of information, for example by suggesting individuals record their wasted food (using food waste diaries) as well as providing practical advice on how to achieve savings once waste has been identified (the LFHW website and smartphone app for example). Similarly for businesses a key first step is to encourage the separation of food waste from other wastes, and its quantification. This gives visibility to the scale of the problem and opportunity, and helps solutions to be identified. Figure 9 illustrates some of the materials used by WRAP to raise awareness of the scale and value of food waste.
Figure 9 Examples of materials used to raise awareness of the value of food waste, to consumers and businesses

36
Coordination failures may exist where individual businesses may not feel able to take action on their own due to competitive pressures. Investment in developing new technology to reduce food waste is costly and risky, and may benefit not only the firm that made the investment. Again, publically funded loans or grants or the setting up of voluntary agreements between groups of businesses may overcome some of these coordination failures. Environmental benefits The IPCC (2014) have identified that reducing food waste has the potential to contribute positively to a range of environmental and social agendas. These include reduced GHG emissions, creating of carbon sinks, increased provision of ecosystem services via ecosystem conservation and sustainable management as well as sustainable agriculture, improved soil quality, reduced erosion, increased ecosystem resilience, and increased enforcement of existing policies for sustainable resource management. WRAP has calculated the GHG emissions (WRAP 2013a), water footprint (WRAP 2011d) and land requirement (WRAP 2013a) associated with avoidable household food waste in UK. The water footprint was 5,200 Mm3 equivalent to 6% of the total UK water footprint, and the land footprint 19,000km2, equivalent to an area about 91% the size of Wales. Reducing food waste has the potential to reduce the pressure on both of these resources, alongside the issues covered by the IPCC (2014). The remainder of this chapter focusses on the estimate of GHG emissions. For GHG emissions, two interlinking approaches were adopted to estimate the emissions associated with avoidable food waste: the top-down analysis totalled the impact of sectors associated with food and drink, whereas the bottom-up approach summed the effect of food types which make up avoidable food waste in the UK. The combined methods suggest that avoidable household food waste is associated with 17 million tonnes of CO2e: equivalent to the emissions produced by 1 in 4 cars on UK roads. The top-down analysis summed GHG emissions associated with key sectors associated with food and drink production in the UK (WRAP 2013j). These emissions were adjusted to include the impact of imports and exports, taking into account the different types of foods produced overseas in comparison with UK production using data from the bottom up methodology for agricultural impacts associated with particular food items. This gave an estimate of the total GHG emissions associated with all food and drink consumed in the UK. The total GHG emissions were divided by the total weight of food and drink consumed in the UK, resulting in a factor that converts weight of food and drink to GHG emissions. This factor was multiplied by the weight of avoidable food waste in the UK to give an estimate of the GHG emissions associated with avoidable waste. Figure 10 shows the breakdown of emissions through this approach. 26% of emissions occur within the agricultural sector, 16% in packaging, transport and retail, 8% in home and 15% in waste management.

37
Figure 10: Top down estimate of average greenhouse gas emissions associated with household food and drink waste in the UK
The bottom-up method summed the GHG emissions of food that make up a large proportion of avoidable food waste. Where information was not available, or a food type made up only a small proportion of avoidable waste, a representative figure from the same food group was used25. This method has the advantage that it uses information on the relative amounts of food types wasted, rather than inferring information from UK purchases. It does rely on assumptions relating to individual food types that can have an influence on the emissions, including:
production method (e.g. intensive versus organic production);
country of origin; and
storage in retailer and household (frozen, chilled, ambient).
The two approaches suggest between 4.0 and 4.6 tonnes CO2e are emitted for each tonne of avoidable food waste. There is a large variation – more than an order of magnitude – in the GHG emissions associated with different types of food and drinks. Furthermore, there is variation in emissions with the time of year, sourcing, and types of production. Therefore, the average figure quoted is not representative of any one product.
25 See references within WRAP 2013a

38
6.2 Considering trade-offs Some interventions aimed at reducing food waste will have economic and environmental costs, and WRAP has carried out studies to quantify the overall economic and GHG benefits from several such interventions. Making better use of fridges and freezers, for example, can help food last longer resulting in less waste. However, it is recognised that lower fridge temperatures, and chilling and freezing more food, can only be achieved with additional energy consumption. In terms of benefits, (WRAP 2013e) suggested that storage lives of the majority of chilled foods would be increased if fridge temperatures could be lowered (e.g. from 7°C, the current UK average for domestic fridges to 4°C). Storage life extensions were typically equivalent to an additional 3 days of life. The potential annual UK waste savings resulting both from lowering fridge temperature and refrigerating foods which are predominantly stored at ambient temperatures (but would benefit from being refrigerated, such as many fresh fruits), taking into account the additional energy use, leads to a net benefit of around £200 million (US$320 million) and a net reduction of around 210,000 tonnes CO2e a year. The financial value and embodied CO2e emissions of food waste saved by using the freezer more effectively were over 100 times higher than the cost and CO2e emissions associated with the extra energy required to freeze the food. Making better use of packaging that has been designed to protect food, and of the guidance on the label, could dramatically reduce the amount of food thrown away, but come at an environmental, and financial cost. Around half of UK household food waste arises from products “not used in time”, around 2 million tonnes with a value of at least £5.6 billion (US$9 billion). The majority of this is made up of perishable / short shelf life products (fresh fruit & vegetables, bakery products, dairy products, fresh meat & fish, ready meals and other chilled foods). There have been significant advances in packaging and related technologies over recent decades, with ‘intelligent’ / ‘smart’ materials designed to keep specific products at their best for longer. These include films that allow fresh produce to ‘breathe’, materials to help control ripening and slow down dehydration, greening (of potatoes) and inhibit the growth of moulds and bacteria. Research (WRAP 2008a), carried out in conjunction with East Malling Research (world experts in fresh produce), showed how keeping fresh produce in the right location and in packaging helped maintain quality, for example peppers, lemons and melons lasted 14 days longer, tomatoes 10 days longer and carrots 17 days longer. Research on novel portion packs for fresh meat (2001e) (which enables consumers to divide the packaging without exposing a portion of the meat provides significant user convenience and facilitates storage and freezing that extends product life) showed that 38% of users cut the pack and used one side and froze the other, whilst 21% of respondents cut the pack and used one side at a time, which could help reduce the £730 million (US$1.2 billion) worth of fresh meat thrown away as a result of not being used in time. The modified tray requires a small amount of additional polymer that is likely to increase tray costs by a small margin – estimated to be 0.5% - 1% of current packaging costs depending on raw material prices. If such a pack led to a 5-10% reduction in waste there would be a 2-4-fold environmental benefit of the small amount of additional packaging. In the UK consumers buy around 38 million tonnes of food and drink every year for consumption at home, and this is protected by less than 4 million tonnes of packaging. The GHG emissions associated with the food bought in the UK are about 15 times those of the packaging that protects this food (ca 166 million tonnes vs 10.8 million tonnes of CO2e). The packaging used to protect fresh fruit & vegetables weighs only a few grammes, and keeps the contents fresher for longer. The greenhouse gas emissions associated with the produce

39
are many times higher than the packaging – 6 times for apples for example, 30 times for tomatoes and an incredible 100 times higher for lettuce26.
26 WRAP analysis

40
7.0 How targeting interventions can maximise reductions in GHG emissions The previous section outlines how WRAP estimate that, on average, 1 tonne of food wasted by households in the UK is associated with 4.0 to 4.6 tonnes CO2e. However, the emissions associated with wasting different foods and drinks vary both per tonne, and in absolute terms. Using information on the emissions for different food and drink items therefore offers the potential to target specific products to maximise GHG emission reductions. Figures 11 and 12 show how GHG emissions accumulate through the supply chain in the production of three example food groups; red meat, eggs, and vegetables. The results are then shown for the total amount of avoidable UK household waste for each of these foods in 2012. The figures illustrate two points. Firstly, the profile of GHG emissions varies significantly between these foods. GHG emissions associated with vegetables increase by over 100% between farm and retail, whereas for eggs the increase is around 20% and for red meat the increase is less than 4%.
Figure 11: Cumulative GHG emissions per tonne of selected foods purchased by UK households
05
1015202530354045
Ton
ne
s C
O2 e
qu
ival
en
t
Life Cycle Stage
Eggs
Vegetables
Red Meat

41
Figure 12: Cumulative GHG emissions for total UK avoidable household waste, for selected foods (2012)
The figures together illustrate the importance of understanding the composition of food waste. Although the GHG emissions associated with a tonne of vegetables are the lowest of the three example foods, they represent the highest overall GHG emissions of the three due to the quantity wasted by UK households. This is also likely to be the case for many countries, by weight, for example vegetables and fruit are also the most wasted food types in India (Nanda et al 2012) and China Liu et al (2013). In addition, the figures highlight that the rate at which GHG emissions accumulate is dependent on the scale of on-farm emissions and the degree of processing, chilling and transport in the supply chain. In Life Cycle Assessment, it is conventional to attribute environmental impacts to a specific product or service (a functional unit). In the case of work on food and drink, the functional unit relates to food and drink purchased by the final consumer. However, depending on whether the food wasted in the supply chain was suitable for animal feed or human consumption, WRAP estimates that the UK ‘opportunity cost’ is between 1 and 13 million tonnes CO2e. Based on UK carbon intensities and data from Emerson (2013) and Liu (2012), for India the figure could be 10-55 million tonnes CO2e per year, and for China 40-215 million tonnes CO2e for fruit and vegetable waste alone. A range of interventions can be made to reduce waste at all stages of the supply chain. As part of the preparation for a national Waste Prevention Programme, DEFRA commissioned the development of a marginal abatement cost curve which considers the effectiveness of a range of measures for reducing food waste (DEFRA 2012). This work highlighted two key points. Firstly more than one solution will be required to achieve maximum reductions in food waste. For household food waste, high level national communications, effective local engagement and changes to products, packaging and labelling are all equally important in achieving reductions, and synergies exist if all are delivered in an integrated package (WRAP estimates a 30% ‘uplift’ in impact vs delivering a
0200000400000600000800000
10000001200000140000016000001800000
Ton
ne
s C
O2
eq
uiv
ale
nt
Life Cycle Stage
Eggs
Vegetables
Red Meat

42
less integrated suite of interventions). Similarly staff engagement and training, systems improvements and a greater emphasis on lean thinking all potentially make significant contributions to waste reduction in businesses. Secondly many of the most effective interventions depend on behaviour change rather than high investment technological or infrastructural changes, and this applies equally to those in business as to consumers. It is however very challenging to estimate potential future savings, which in addition to the effectiveness of any interventions will also be influenced by a variety of external factors, such as economic conditions, population changes and cultural / social factors. In terms of assessing the potential impact of food waste reductions outside of the UK two scenarios have therefore been considered, a 20% reduction and a 50% reduction, with a focus on global consumer food waste and supply chain food waste in the supply chains of South and South East Asia and Industrial Asia. These reductions are consistent with the work done in the UK, and also with scenarios or targets proposed by others.

43
8.0 Examples of potential impacts from food waste reduction Two types of examples are given here, firstly taking a global perspective on one stage of the supply chain, consumption, and secondly looking at the whole supply chain for two geographically close but developmentally different regions, Industrialised Asia and South and South East Asia. 8.1 Reducing global consumer food waste
The IPCC (2014) suggest that “demand‐side measures, such as changes in diet and reductions of losses in the food supply chain, have a significant, but uncertain, potential to reduce GHG emissions from food production (medium evidence, medium agreement). Estimates vary from roughly 0.76–8.6 Gt CO2e per year by 2050 (limited evidence, medium agreement). Based on FAO (2013) estimates more than a fifth of global food waste occurs at the consumption stage (280 million tonnes, the majority arising in Europe, North America & Oceania and Industrialized Asia (220 million tonnes). As outlined above a conservative cost estimate for global consumer food waste would exceed US$400 billion. However by 2030, it is estimated that the global middle class will more than double, to almost 5 billion people (Kharas 2010). Two-thirds of the global middle class will live in the Asia-Pacific region, up from just under one-third in 2009, and a significant proportion of the new Asian middle class are also expected to be at the upper end of the income bracket (ibid)27. India and China are two fast growing economies with a combined population of 2.6 billion28. Economic growth is changing these countries from ones where most of the population are considered poor to ones where the middle class will dominate. This will have a significant impact on consumption patterns as new middle classes adopt diets and habits more akin to those in the developed world. An unintended consequence of this, unless mitigated against, is likely to be an increase in food wasted at the consumer level (in and out of home). Ernst and Young, a global consultancy, estimate that the middle class29 in India and China will increase from around 50 million and 150 million people, respectively, to around 475 million and 1 billion people. Based on estimates by FAO (2011) on the current levels of per capita consumer food waste in a less developed region30 and in Europe and North America, consumer food waste could increase by between 36 and 44 million tonnes in India and between 71 and 88 million tonnes in China if (as some evidence suggests may be the case31) individuals who join the middle class in these countries adopt habits akin to those in Europe and North America that result in more food being wasted. Based on the same producer prices used by FAO (FAO 2013a) the combined cost of the increased consumer food waste could be as high as US$110 billion (before other environmental and social costs are included). Three billion extra middle class people globally could generate an additional 280 million tonnes of food waste per year, doubling the levels reported in 2011 –
27 http://www.ey.com/GL/en/Issues/Driving-growth/Middle-class-growth-in-emerging-markets---Entering-the-global-middle-class 28 http://www.census.gov/population/international/data/ Accessed on 29/04/2014 at 14:15 29 As defined by the OECD, those earning between US$ 10 and US$100 per day. http://www.oecd.org/development/pgd/44457738.pdf 30 In the estimates we used the upper end of the range of per capita consumer food waste of US$11 per person in Sub-Saharan Africa and South/South East Asia. 31 For example see Liu (2013)

44
which could take the cost of consumer food waste to more than US$600 billion a year32. A 20 – 50% reduction in global consumer food waste could therefore deliver savings of between 55 and 140 million tonnes of food per year (US$80 to 200 billion) based on 2011 waste levels, or 110 – 280 million tonnes of food (US$120 – 300 billion) based on potential future levels of consumer food waste linked to the huge increase in the middle classes. GHG savings could therefore vary between 220 million and more than 1 billion tonnes. There are also potential indirect impacts. For example, WRAP (2014) found that those reducing food waste chose to spend around half of the financial saving in ‘trading up’ to higher value foods. Therefore, the research supports the earlier finding that as consumers avoid food waste, many change their purchasing behaviour and buy smaller quantities of higher price food. The specific approaches necessary to achieve reductions in consumer food waste will vary in different regions and nations, as will the costs of delivering these. Further evaluation of the growing number of initiatives aimed at helping consumers to waste less food will help to refine projections of how far food waste at this stage can be reduced, and at what cost. However these potential savings are very significant. 8.2 Reducing food waste in South and South East Asia and Industrial Asia Data from FAO estimate waste arisings in South and South East Asia and Industrial Asia by supply chain stage, and by commodity type. These suggest that 275 and 360 million tonnes of food are wasted per annum respectively in these two regions, but with very different profiles of where the waste arises, and the types of food wasted. Figures 13 and 14 illustrate the potential benefits of a 20% reduction in food waste arisings, for both of these regions33. These suggest that for both regions, on a weight and GHG emission basis, the greatest impact could be achieved through avoiding waste of cereals, fruit and vegetables (including roots and tubers). In Industrialised Asia, waste of meat by consumers would also be of significance in terms of GHG emissions and in South and South East Asia significant impact could be achieved through targeting dairy products across the supply chain. In Industrial Asia the greatest impact in reducing GHG emissions could be achieved through reducing waste at the consumption stage, whereas in South and Southeast Asia, an emphasis on reductions across the supply chain would be needed to deliver the greatest benefits. If waste was reduced by 20% in Industrialised Asia and South and Southeast Asia, around 250 and 150 million tonnes CO2e could be avoided respectively, with 630 and 360 million tonnes CO2e avoided if 50% of waste could be avoided. Although the FAO food waste data has been made use of here, and extensively elsewhere, Parfitt (2013) has highlighted the need for caution when making use of the regional and sectoral data from the FAO reports (FAO 2011, 2013) – ‘for example, of the 40 supply chain stage/food commodity group estimates for South and Southeast Asia, over 70% were based on assumptions, generic data or food waste estimates from other regions. Overall, the FAO data gaps are greatest for parts of the world that have undergone the most rapid shifts away from starchy staples towards more varied and fresh diets. With growing demand for more perishable foods in countries such as China and India the potential for waste has increased as infrastructure has struggled to keep pace with demand’.
32 Assuming most of the increasing middle classes will be outside of Europe and North America, and applying conservative estimates of US$1,000/tonne of food waste for Industrialised Asia and US$550/tonne for all other regions 33 The estimate of GHG emissions is based on factors for the UK

45
Figure 13a: Benefits of a 20% reduction in food waste in Industrialised Asia – weight of food waste avoided (based on FAO data, 2011; 2013)
Figure 13b: Benefits of a 20% reduction in food waste in Industrialised Asia – GHG emissions avoided (based on FAO data, 2011; 2013)
Figure 13c: Benefits of a 20% reduction in food waste in Industrialised Asia – cost of food waste avoided (based on FAO data, 2011; 2013)
0.0
2.0
4.0
6.0
8.0
10.0
12.0
Agriculture Postharvest Processing Distribution Consumption
we
igh
t o
f w
aste
po
ten
tial
ly
avo
ide
d (
mill
ion
to
nn
es)
0.00
5.00
10.00
15.00
20.00
25.00
30.00
Agriculture Postharvest Processing Distribution Consumption
Gre
en
ho
use
gas
em
issi
on
s p
ote
nti
ally
avo
ide
d (
mill
ion
to
nn
es)
0.0
1.0
2.0
3.0
4.0
5.0
6.0
Agriculture Postharvest Processing Distribution Consumption
Co
st o
f w
aste
po
ten
tial
ly a
void
ed
(U
S$
Bill
ion
, Pro
du
cer
Pri
ces)
Cereals Roots and Tubers Oilseeds and Pulses
Fruits and Vegetables Meat Fish and Seafood
Dairy products

46
Figure 14a: Benefits of a 20% reduction in food waste in South and Southeast Asia – weight of food waste avoided (based on FAO data, 2011; 2013)
Figure 14b: Benefits of a 20% reduction in food waste in South and Southeast Asia – GHG emissions avoided (based on FAO data, 2011; 2013)
Figure 14c: Benefits of a 20% reduction in food waste in South and Southeast Asia – cost of food waste avoided (based on FAO data, 2011; 2013)
0.0
1.0
2.0
3.0
4.0
5.0
6.0
7.0
8.0
Agriculture Postharvest Processing Distribution Consumption
we
igh
t o
f w
aste
po
ten
tial
ly
avo
ide
d (
mill
ion
to
nn
es)
0.00
1.00
2.00
3.00
4.00
5.00
6.00
7.00
8.00
Agriculture Postharvest Processing Distribution Consumption
Gre
en
ho
use
gas
em
issi
on
s p
ote
nti
ally
avo
ide
d (
mill
ion
to
nn
es)

47
9.0 What can governments and other senior influencers do to reduce food waste?
Governments are uniquely placed to ensure that different policies across departments, and the way these are communicated and implemented, support efforts to reduce food waste. These include policies directly aimed at encouraging food waste prevention but also many that can have an impact on the effectiveness or feasibility of potential solutions to reduce food waste. Raising awareness of the urgent need to tackle food waste, the benefits of doing so and how this fits in to regional or national priorities, through a range of audience specific channels, trusted intermediaries and with tailored and effective messages, and crucially directing people to where they can get inspiration and help to take action is a critical first step. Much has been done in recent years to raise the awareness of food waste as an issue, both globally and in many nations. This has most often been done in the context of food security and the need to be able to feed the current population more equitably, and the additional 3 billion, or in the context of the environment and climate change mitigation. These are powerful motivations for action for many, but not all. It is important to understand the motivations of those who can influence food waste and design approaches and messages that will tap in to these. For some the financial benefits that stem from wasting less food, linked to improvements in spending power (and for many consumers the ability to improve their diet) and competitiveness (for businesses) will outweigh any concerns about global food supply or the environment. Many remain unaware of the benefits that could be accrued from taking action, the fact that in many cases actions can be taken at no or low cost and that there are numerous case studies and other resources to help implement change. Specific areas where governments can take steps to support action by both the public and private sectors include the following items. Guidance on many of these can be found in UNEP et al (2014):
National waste reporting. In particular whether there is a requirement to report
separately on food waste, vs organic waste for example.
Tax and food safety regulations that can act to promote the redistribution of
surplus food for human consumption.
Regulations that influence what food waste and related by-products can safely
be used as animal feed (which would be classed as waste prevention, as such material
feeds animals which in turn are used to produce food for human consumption, and
displaces other more environmentally damaging sources of animal feed).
Strategies for the collection and treatment of food waste. Whilst it is essential to
have strategies and infrastructure for dealing with unavoidable food waste, this should be
integrated with approaches to reduce food waste – to ensure that where possible food
can be prevented from arising in the first place. Financial incentives, and capacity
planning need to consider how to best support the waste or food utilisation hierarchy, and
communication to local decision makers and business and household users need to
integrate messaging around prevention and participation in any collection scheme34.
Policies that relate to food packaging. Whilst there are legitimate concerns about
over-packaging food, the appropriate amounts of modern packaging can act to
significantly reduce food waste through protecting food from damage, extending shelf-life
etc. Action focussed purely on reducing the amount of packaging, without considering the
34 For example see WRAP 2013l

48
benefits to food waste prevention, can have unintended consequences. Similarly
communication around packaging needs to be balanced, to ensure that consumers and
other users of food bought pre-packed get the maximum benefit from the packaging (and
also recycle that packaging to minimise its impact further)35.
Food labelling and hygiene/safety policy. Clear communication of nutritional content
and instructions to maintain food safety are paramount, but guidance can also be given to
those providing and using such information to encourage the use of the most appropriate
and helpful information to help reduce waste, for example applying ‘best before’ rather
than ‘use by’ dates where possible, communicating whether products can be frozen, when
and for how long, and how best to store foods for maximum safe and high quality life.
This covers both mandatory requirements and non-mandatory best practice36.
Education and training. It is important that both children and adults are provided with
the knowledge and skills necessary to manage food at home and in the workplace in such
a way that supports food waste prevention and efficient and competitive business, and
this needs to be reflected in school curricula and access to adult education.
Integrated advice on healthy eating and food waste. Many of the behaviours and
skills key to reducing food waste are also relevant to achieving other policy objectives,
including healthy diets. For example better planning and portion control will help reduce
waste, and also support moves to eating the right amounts of food. Building confidence
and skills around managing and preparing food is important to help reduce waste, and
could also support moves to adopt a more balanced diet and reductions in food borne
illness. It is important that there is an integrated approach to policies around food waste
and healthy eating, as encouraging consumers or schools and other institutions to
purchase healthier and often more perishable food, without equipping them with the
necessary skills to use such produce, risks more food being wasted.
Specifications for equipment and building design. It is important that in addition to
safety and environmental performance consideration is given to aspects of design that
can help users / residents manage their food better. This includes for example
refrigerators that maintain and ideally display an optimal temperature, without the need
for use intervention, and kitchens that have sufficient storage space.
Procurement strategies and contracts. A significant percentage of meals eaten by
people around the world will be provided for directly, or indirectly via contractors, as part
of government services. For example at least 30% of all meals in the UK are provided
through the education, healthcare and other government funded institutions. This
provides an opportunity to influence waste arising during preparation and via diners.
Research, technology and infrastructure development. Harnessing and sharing the
wealth of existing knowledge from the social, biological and physical sciences, and more
applied research, together with stimulating integrated approaches to solving some of the
underlying challenges related to food being wasted across supply chains could promote
rapid progress.
35 For example see WRAP 2013k 36 For example see WRAP 2012a and 2012b

49
For developing nations, the following emphasis is suggested (based on IMechE 2013, 2014):
Focus on perishable products. Developing nations often have relatively high
population growth, warmer climates and greater exposure to the impacts of climate
change.
Connect farmers to markets through sustainable infrastructure. As well as
reducing waste, this can improve income for farmers and drive development. Waste
minimisation thinking should be incorporated into the transport infrastructure and storage
facilities currently being planned, engineered and built.
Integrate renewable energy resources. Take advantage of off-grid and micro-grid
opportunities. As well as improved energy security, this provides the potential to reduce
environmental degradation, reduce contribution to greenhouse gas emissions and
empower communities at a cost similar to development of a grid.
Transfer knowledge. Governments of developed nations should put in place
programmes that transfer engineering knowledge, design know-how, and suitable
technology to newly developing countries. This will help improve produce handling in the
harvest, and ‘immediate post-harvest stages of food production’.
According to IMechE (2014), it is estimated that about 25% of food waste in the developing world could be eliminated with better refrigeration equipment. The report also states that up to 50% of fruit and vegetables end up being wasted in Sub-Saharan Africa and India, while Tanzania sees 25% of all milk produced in the wet season wasted. As outlined in the sections above food waste arises across all sectors of the food chain, for a multitude of reasons, influenced by the actions of many different actors. There is no single solution to reducing food waste, and the most effective strategies will vary depending on the state of development and focus of the food industry, diets and culture, the scale and nature of businesses, whether they are in the public or private sector, existing policy and regulatory landscapes, business and consumer cultures and capabilities and so on. Similarly significant reductions in food waste require the collaborative working of those in the public and private sector. However there are some important principles which should be applicable to a wide range of circumstances, and an increasingly broad evidence base available to inform the development of tailored plans. In addition several national, regional and global organisations have produced recommendations for action, and detailed advice on how to formulate and deliver initiatives to reduce food waste (see box 1). UNEP, FAO and WRAP have collaborated on one such resource (Prevention and Reduction of Food and Drink Waste in Businesses and Households), which provides a suite of materials and a structured approach, covering:
Understanding the scale of food waste, what is being wasted and why (measurement
options; waste reviews)
Understanding who can influence this (organisational mapping)
Understanding the range of existing and emerging mechanisms (policy and legislative,
fiscal, information provision, and promotional strategies etc.) that may influence food
waste (whether that is the primary purpose of them or not; i.e. tools available)
Establishing baselines, targets or goals and reporting mechanisms (national, corporate
etc.)
Developing waste prevention plans (unilateral, collaborative)
Delivering household and consumer engagement campaigns (to raise awareness of food
waste in and out of home, and the benefits of its reduction, encourage behaviours which

50
reduce food and equip households and consumers with the information, tools and skills
they need)
Developing and delivering a voluntary collective action programme to prevent and reduce
food waste in businesses (grocery and hospitality and food service)
Changes to processes, products, packaging and labelling (to make it easier for consumers
and businesses to buy the right amount of food and use what is bought)
Acquiring better understanding of the amounts and types of food waste, where this is arising and what may be causing it has been proved to both raise awareness of the potential benefits, and facilitate the development of reduction solutions. This applies equally to governments, businesses and consumers. This can be a daunting process but there is detailed guidance available, and learnings from those that have experience in this area (see box 1). Advances in how best to obtain the most useful insights are being made at an increasing rate, through the combined action of academics, institutes, measurement specialists and other practitioners – which will make this activity more precise and cost effective, and range of dedicated options are available for consumers and businesses, including new processes, hardware and apps. WRI, UNEP, FAO and the World Business Council on Sustainable Development are in the process of developing a global standard for measuring food loss and waste, or a “food loss and waste protocol”, drawing on current best practice. This protocol will be a globally consistent, peer reviewed, and credible approach for individual countries and companies to measure and monitor food loss and waste, and will be road tested in 2014 and 2015. Without robust measures of food waste, which requires action by the public and private sector, it is difficult to set credible goals or targets, design effective interventions or monitor progress. Setting defined goals or targets helps to motivate collective action, within an organisation, across sectors, within communities and the wider population and at regional and national levels. There are more and more examples of nations, businesses and others setting such goals or targets, which can be associated with voluntary agreements (such as the Courtauld Commitment in the UK) or set by governments, often in conjunction with industry (such as in Japan, France and Germany). Having commitment from senior government officials and CEOs is a crucial first step, but such commitment must be shared within organisations, and translated in to practical actions, reinforced where appropriate by personal objectives and supported by the necessary training. To support delivery against any goals or targets it is essential to have evidence-based action plans, which can again be relevant to individual businesses, departments or organisations, or nations. UNEP et al (2014) provides guidance on how best to develop such plans

51
Box 1 – Key resources to help inform action to reduce food waste Key resources Reference Focus
‘Prevention and reduction of food and drink waste in businesses and households’ (UNEP/FAO/WRAP)
http://thinkeatsave.org/index.php/be-informed/think-eat-save-guidance-document
Provides tools and know-how to define the problem of food waste from consumers, retailers, hospitality and processing, find the critical waste points, measure them and identify feasible and sustainable reduction options to be delivered by multiple stakeholders
WRAP insights, guidance, case studies etc.
http://www.wrap.org.uk/food-waste-reduction
Food waste prevention (consumer, grocery and hospitality and food service supply chains)
Love Food Hate Waste campaign
http://www.lovefoodhatewaste.com/ and http://partners.wrap.org.uk/sear
ch/?show=collections&category_campaign=104
Consumer facing campaign website, and partner resources
‘Toolkit: Reducing the Food Wastage Footprint, and related reports’ (FAO)
http://www.fao.org/news/story/en/item/196377/icode/
Showcases concrete examples of good practices for food waste reduction; information sources, guidelines and pledges supporting food waste reduction
Think Eat Save campaign http://www.thinkeatsave.org/ A portal for many regional and national campaigns; resources and tips
‘Food losses and waste in the context of sustainable food systems’ (UN Committee on World Food Security (CFS)
http://www.fao.org/cfs/cfs-hlpe/en/
Causes and drivers for food waste, framework of solutions to reduce food waste
‘Global Food – Waste Not, Want Not’ ; ‘A Tank of Cold:Cleantech Leapfrog to a more food secure world’; (Institution of Mechanical Engineers)
http://www.imeche.org/knowledge/themes/environment/global-food ; http://www.imeche.org/docs/default-source/reports/a-tank-of-cold-cleantech-leapfrog-to-a-more-food-secure-world.pdf?sfvrsn=0
Drivers for food waste, and recommendations for reducing this, particularly in the developing world
World Resources Institute reports
http://www.wri.org/our-work/topics/food
Drivers for food waste, and recommendations for reducing this
Barilla Centre for Food and Nutrition reports
http://www.barillacfn.com/en/pubblicazioni/
Drivers for food waste, and recommendations for reducing this
Best Practices and Emerging Solutions Toolkit (US Food
Waste Reduction Alliance)
http://www.foodwastealliance.org/wp-
content/uploads/2014/04/FWRA_Toolkit_FINAL_0415141.pdf
Covers manufacturing and processing, transportation and retail/restaurant sectors
FUSIONS website http://www.eu-fusions.org/ Drivers of food waste, examples of social innovation to reduce waste
Preparing a Waste Prevention Programme - Guidance Document (EC)
http://ec.europa.eu/environment/waste/prevention/index.htm and http://ec.europa.eu/food/food/sustainability/index_en.htm
Provides guidance for developing a waste prevention plan, and specific resources for food
Governments have a major role to play, but cannot solve the problem of food waste alone. Broader collaborative action, supported by governments, is essential. Food businesses have a central role, and in particular the larger companies (the top 15 global grocery retailers for example are responsible for over 30 percent of global grocery retail sales (Bodimeade 2013), and the top 20 food manufacturers' for around a 20 percent share of global packaged food retail sales; USDA 2012). Providing businesses with clear evidence of the drivers for action (which may be financial, public pressure or other business customer pressure), and demonstrating that waste prevention measures are often

52
behavioural and therefore are no or low-cost actions to a business are important for success. Major food brands and retailers can work with their own integrated supply chains, third party suppliers and customers to understand how their actions and those of others can reduce wasted food, and catalyse action. This can be in the context of a broader collaborative agreements to address food waste, such as the Courtauld Commitment and Hospitality and Food Service Agreements in the UK, ForMat in Norway and the Sustainable Alliance in the Netherlands) or be more unilateral. One such example is Tesco announcing a core programme to tackle food waste in their own operations and with their suppliers and customers as part of their ‘Using Our Scale for Good’ initiative. Whilst larger food businesses can undoubtedly make a significant impact, it is important to remember that much of the worlds’ food is produced, manufactured and sold by smallholders and small businesses. For example according to FoodDrinkEurope (2014) 99.1% of Europe’s 287,000 food and drink companies are small or medium sized enterprises (SMEs), accounting for 48.7% of turnover (€452 billion; US$630 billion) and 63% of employment 2.7 million jobs in Europe’s food and drink industry (2010 data). The people who own and work in such operations will require different types of messages and support, and are less likely to sign up to formal voluntary agreements. Relevant information must be made accessible to smaller businesses, and ‘trusted intermediaries’ identified to reach them. The latter could be larger food businesses, but equally could range from aid organisations, health and safety or hygiene inspectors through to trade bodies and local business groups. Non-food businesses and a wide variety of community and membership based groups are also key to bringing about long lasting behaviour change. The impact of more ‘local’ interventions, complemented by national or larger scale action, and changes to products, packaging and labelling, can be impressive. These can range from locally organised ‘gleaning’ of non-harvested crops to informal training on how to plan better food buying and cooking37. Many volunteer for such activities, but the provision of core materials and training is important to ensure consistency of messages and optimal impact. 10.0 Limitations and Future Development There are a number of opportunities to further develop and enhance this paper in future. As noted, for many areas of the world the quality of data available on food waste is poor, and any future improvements in data quality would allow for improvement in the analysis presented. Improved understanding of differences in the relative importance of eating out and consuming at home would also aid analysis and inform recommended activities. There are also opportunities to link a number of different agendas, such as World Health Organisation activity on reducing obesity and the need to adapt food production systems to a changing climate, and the link between demand for food, land use change and biodiversity. The impact of social programmes that support food purchases specifically could also be considered with regards to impact on food waste generation, such as US food stamps. The greenhouse gas emission factors used are based on IPCC 3rd Assessment report. Replacing these with the factors advocated in the 5th Assessment Report (IPCC 2013) would significantly increase the emissions associated with food waste, both in the supply chain and at end of life. Conversely, the greenhouse gas emission factors are based on a snapshot in time. Utilisation of a dynamic model to allow for changes in emissions associated with each stage (e.g. energy generation) could allow for more accurate projections of future emissions avoidance through food waste reduction.
37 See http://www.eu-fusions.org for examples of social innovation

53
11.0 Conclusion As outlined in the sections above food waste arises across all sectors of the food chain, for a multitude of reasons, influenced by the actions of many different actors. Whilst a common approach is advocated across all countries, the emphasis of that approach should vary depending on the national characteristics of waste. There is no single solution to reducing food waste, and the most effective strategies will vary depending on the state of development and focus of the food industry, diets and culture, the scale and nature of businesses, whether they are in the public or private sector, existing policy and regulatory landscapes, business and consumer cultures and capabilities and so on. Significant reductions in food waste are possible, but will require collaborative working of those in the public and private sector. There are some important principles which should be applicable to a wide range of circumstances, and an increasingly broad evidence base available to inform the development of tailored plans. In addition several national, regional and global organisations have produced recommendations for action, and detailed advice on how to formulate and deliver initiatives to reduce food waste. UNEP, FAO and WRAP have collaborated on one such resource (Prevention and Reduction of Food and Drink Waste in Businesses and Households), which provides a suite of materials and a structured approach. Investments of time and money will be required, but the potential economic and environmental benefits are huge, and the consequences of not taking sufficient action are serious – for billions of individuals, countries, and the food system as a whole.

54
12.0 References Bodimeade, M. (2013). Global Food Industry; https://uk.finance.yahoo.com/news/global-food-industry-000000272.html
Buzby, J., Wells, H.F., Hyman, J. (2014). The Estimated Amount, Value, and Calories of Postharvest Food Losses at the Retail and Consumer Levels in the United States. Economic Information Bulletin No. (EIB-121); http://www.ers.usda.gov/publications/eib-economic-information-bulletin/eib121.aspx
DEFRA (2012). Evidence to support choosing the appropriate level of ambition for waste reduction; http://randd.defra.gov.uk/Default.aspx?Menu=Menu&Module=More&Location=None&Completed=0&ProjectID=18118
Emerson (2013). The Food Wastage & Cold Storage Infrastructure Relationship in India; http://www.emerson.com/SiteCollectionDocuments/India%20Cold%20Storage%20Report%202013/Report_layout_Reduced.pdf
Environment Agency (2004). Review of agricultural waste research and development projects; http://cdn.environment-agency.gov.uk/geho1204bikm-e-e.pdf
EPA (2014). Municipal Solid Waste Generation, Recycling, and Disposal in the United States: Facts and Figures for 2012; US EPA; Washington USA; http://www.epa.gov/osw/nonhaz/municipal/pubs/2012_msw_fs.pdf)
ERM (2012). Waste prevention Actions for Priority Wastes; http://www.rebnews.com/pdfs/news/11816_finalmainmaccreport.pdf
FAO (2011). Global Food Losses and Food Waste; http://www.fao.org/docrep/014/mb060e/mb060e00.pdf
FAO (2013). Food Wastage Footprint: Impact on Natural Resources; http://www.fao.org/docrep/018/i3347e/i3347e.pdf
FAO (2013a). Food Wastage Footprint: Impacts on natural resources, Technical Report; http://www.fao.org/docrep/018/ar429e/ar429e.pdf
FoodDrinkEurope (2014), Website (accessed June 2014; 2010 estimates); http://www.fooddrinkeurope.eu/industry-in-focus/topic/small-and-medium-sized-enterprises-smes/working-on-behalf-of-smes/
General Accounting Office (GAO) (1977). Food Waste: An Opportunity to Improve Resource Use. Comptroller General of the United States, Washington, DC
Hanssen, O.J. and Møller, H (2013). Food Wastage in Norway 2013;
http://www.fao.org/fsnforum/cfs-hlpe/sites/cfs-hlpe/files/resources/Food%20Waste%20in%20Norway%202013%20-%20Status%20and%20trends%202009-13.pdf
ILO (2014). Global Employment Trends 2014, http://www.ilo.org/wcmsp5/groups/public/---dgreports/---dcomm/---publ/documents/publication/wcms_233953.pdf
IMechE (Institution of Mechanical Engineers) (2013). Global Food-Waste Not, Want Not; http://www.imeche.org/knowledge/themes/environment/global-food

55
IMechE (2014). A Tank of Cold:Cleantech Leapfrog to a more food secure world; http://www.imeche.org/docs/default-source/reports/a-tank-of-cold-cleantech-leapfrog-to-a-more-food-secure-world.pdf?sfvrsn=0
IPCC (Intergovernmental Panel on Climate Change) (2013). Climate Change: The Physical Science Basis; https://www.ipcc.ch/report/ar5/wg3/
IPCC (2014). Climate Change 2014: Mitigation of Climate Change; http://www.ipcc.ch/report/ar5/wg3/
Junguo Liu, Lundqvist, J., Weinberg, J. and Gustafsson, J. (2013). Food losses and waste in China and their implication for water and land. Environmental Science and Technology 47; http://pubs.acs.org/doi/abs/10.1021/es401426b
Kharas, H. (2010). The Emerging Middle Class in Developing Countries, OECD Development Centre Working Paper number 285; http://www.oecd.org/social/poverty/44457738.pdf
Liu, J (2012). Food Waste Across Supply Chain in China: A wicked problem for water, Presentation at World Water Week Conference 2012, Stockholm; http://www.worldwaterweek.org/documents/WWW_PDF/2012/Wed/Addressing-post-harvest-losses/Junguo-Liu.pdf
Liu, G (2013). Food losses and food waste in China: a first estimate; http://www.oecd.org/site/agrfcn/food%20losses%20and%20waste%20in%20china_gang%20liu.pdf
Nahman A. and De Lange W. (2013). Costs of food waste along the value chain: Evidence from South Africa, Waste Management, Volume 33, Issue 11; http://www.sciencedirect.com/science/journal/0956053X/33/11
Nanda S.K., Vishwakarma, R. K., Bathla, H. V. L., Rai, A., and Chandra, P. (2012). Harvest and postharvest losses of major crops and livestock produce in India. AICRP on PHT, CIPHET (ICAR), Ludhiana.
OECD (2014). Meeting of the Working Party on Agricultural Policies and Markets Market and Trade Impacts of Food Losses and Waste Reduction: Case Studies, 19-21 May 2014. OECD Conference Centre Paris, France
Parfitt, J. (2013). Global food waste campaigns suffer from data deficiency; http://www.theguardian.com/global-development-professionals-network/2013/oct/28/global-food-waste-tesco-fao-data
Ray, D.K., Mueller, N., West, P.C., Foley, J.A. (2013). Yield Trends Are Insufficient to Double Global Crop Production by 2050, PLoS ONE 8(6): e66428;
http://www.plosone.org/article/info%3Adoi%2F10.1371%2Fjournal.pone.0066428
Rutten, M., Nowicki, P., Bogaardt, M.J., Aramyan, L (2013). Reducing food waste by households and in retail in the EU, LEI Wageningen; The Hague, Netherlands; http://edepot.wur.nl/290135
Searchinger, T., Hanson, C., Ranganathan, J., Lipinski, B., Waite, R., Winterbottom, R., Dinshaw, A., and Heimlich, R. (2013). Creating a Sustainable Food Future: Interim Findings. WRI; http://www.wri.org/publication/creating-sustainable-food-future-interim-findings
Stop Wasting Food (2013). TNS Gallup survey for Stop Wasting food movement and Danish Agriculture & Food Council; http://www.stopspildafmad.dk/inenglish.html

56
UNEP, FAO, WRAP (2014). Prevention and Reduction of Food and Drink Waste in Businesses and Households; http://thinkeatsave.org/index.php/be-informed/think-eat-save-guidance-document
USDA (United States Department of Agriculture) (2012). Global Food Industry; http://www.ers.usda.gov/topics/international-markets-trade/global-food-markets/global-food-industry.aspx
USDA (2014). The Estimated Amount, Value, and Calories of Postharvest Food Losses at the Retail and Consumer Levels in the United States; http://www.ers.usda.gov/publications/eib-economic-information-bulletin/eib121.aspx
Van Haaren, R., Themelis, N., Goldstein, N. (2010). The State of Garbage in America, Biocycle October 2010; http://www.seas.columbia.edu/earth/wtert/sofos/SOG2010.pdf
World Resources Institute (2013a). The Great Balancing Act; http://pdf.wri.org/great_balancing_act.pdf
World Resources Institute (2013b). Creating a Sustainable Future; http://www.worldresourcesreport.org/
WRAP (2008a). Helping consumers reduce fruit and vegetable waste; http://www.wrap.org.uk/content/helping-consumers-reduce-fruit-and-vegetable-waste
WRAP (2008b). Love Food Champions; http://www.wrap.org.uk/content/love-food-champions
WRAP (2010). Securing the Future-The Role of Resource Efficiency; http://www.wrap.org.uk/sites/files/wrap/FULL%20REPORT%20v2.pdf
WRAP (2011a). The composition of waste disposed of by the UK hospitality industry; http://www.wrap.org.uk/content/composition-waste-disposed-uk-hospitality-industry-1
WRAP (2011b). The Courtauld Commitment Phase 2-First Year Progress Report; http://www.wrap.org.uk/sites/files/wrap/CC2_Interim_Report_AUG_2012.pdf
WRAP (2011c). Resource Maps; http://www.wrap.org.uk/node/13542
WRAP (2011d). The water and carbon footprint of household food and drink waste in the UK; http://www.wrap.org.uk/content/water-and-carbon-footprint-household-food-and-drink-waste-uk-1. [The carbon footprint reported here has been updated in the preceding reference]
WRAP (2011e). Packaging design to reduce household meat waste; http://www.wrap.org.uk/content/packaging-design-reduce-household-meat-waste-0
WRAP (2011f). Reducing food waste through community focussed initiatives; http://www.wrap.org.uk/sites/files/wrap/2011.11_Worcestershire_CC_LFHW_2011_case_study.3e14035c.11397.pdf
WRAP (2012). Gate Fees Report; http://www.wrap.org.uk/sites/files/wrap/Gate%20Fees%20Report%202012.pdf
WRAP (2012a). How to apply date labels to help prevent food waste; http://www.wrap.org.uk/sites/files/wrap/Info%20Sheet%20Date%20Labels%20final.pdf

57
WRAP (2012b). Freezing guidance to prevent food waste; http://www.wrap.org.uk/sites/files/wrap/Info%20Sheet%20Freezing%20final.pdf
WRAP (2013a). Household food and drink waste in the UK 2012; http://www.wrap.org.uk/content/household-food-and-drink-waste-uk-2012
WRAP (2013b). The Courtauld Commitment Phase 2: Final Results; http://www.wrap.org.uk/content/courtauld-commitment-2-1
WRAP (2013c). Courtauld Commitment 2 Signatory Case Studies; http://www.wrap.org.uk/content/courtauld-commitment-2-signatory-case-studies
WRAP (2013d). West London Food Waste Prevention Campaign Case Study; http://www.wrap.org.uk/content/food-waste-campaign-saves-west-london-boroughs-over-%C2%A31million-1 )
WRAP (2013e). Impact of more effective use of the fridge and freezer; http://www.wrap.org.uk/content/impact-using-your-fridge-and-freezer-more-effectively
WRAP (2013f). Waste in the UK Hospitality and Food Service Sector; http://www.wrap.org.uk/content/overview-waste-hospitality-and-food-service-sector
WRAP (2013g). Estimates of waste in the food and drink supply chain; http://www.wrap.org.uk/content/estimates-waste-food-and-drink-supply-chain
WRAP (2013h). Waste Prevention Case Studies; http://www.wrap.org.uk/content/waste-prevention-case-studies
WRAP (2013i). An initial assessment of the environmental impact of grocery products; http://www.wrap.org.uk/sites/files/wrap/An%20initial%20assessment%20of%20the%20environmental%20impact%20of%20grocery%20products%20final_0.pdf
WRAP (2013j). Methods used for household food and drink waste in the UK 2012; http://www.wrap.org.uk/sites/files/wrap/Methods%20Annex%20Report%20v2.pdf
WRAP (2013k). Consumer Attitudes to Food Waste and Food Packaging (report) and ‘Fresher for Longer’ campaign; http://www.wrap.org.uk/fresherforlonger
WRAP (2013l). Food waste messages for maximum impact – how to engage your residents in prevention and collections; http://www.wrap.org.uk/content/food-waste-messages-maximum-impact-uk
WRAP (2014). Econometric modelling and household food waste; http://www.wrap.org.uk/content/econometric-modelling-and-household-food-waste
WRAP and DEFRA (2013). Analysis for Courtauld Commitment 3 Targets; http://www.wrap.org.uk/sites/files/wrap/Analysis%20for%20Courtauld%20Commitment%203%20targets.pdf

58
Annex – Illustration of the ‘food loop’ in the UK

59
www.wrap.org.uk