Embed Size (px)
Citation preview
Strategies to Accelerate Growth in the Steel Sector
Peter J. ScottManaging PartnerHeadwall Partners LLC
March 13, 2017

Steel Volume Growth
Indexed Apparent U.S. Steel Consumption(1)
(1) Defined as TTM total steel mill product shipments + imports – exports – semifinished steel product imports, indexed to 1/1/2007 = 100
Source: AISI
0%
50%
100%
150%
200%
77%
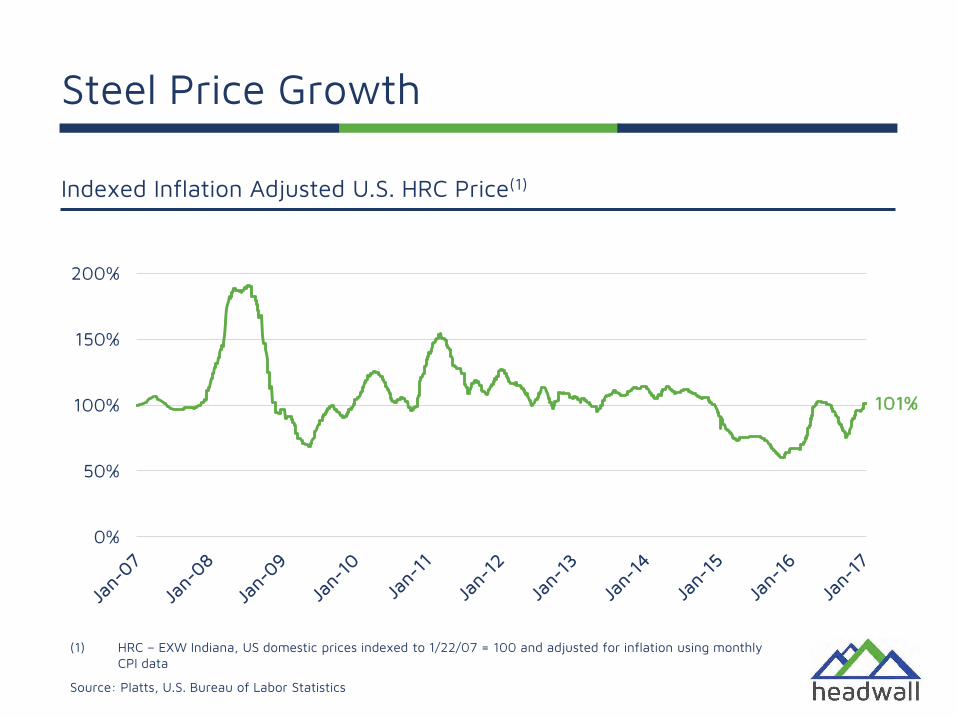
Steel Price Growth
0%
50%
100%
150%
200%
Indexed Inflation Adjusted U.S. HRC Price(1)
(1) HRC – EXW Indiana, US domestic prices indexed to 1/22/07 = 100 and adjusted for inflation using monthly CPI data
Source: Platts, U.S. Bureau of Labor Statistics
101%

Steel Spread Growth
0%
50%
100%
150%
200%
Indexed Inflation Adjusted U.S. Steel Spread(1)
(1) Spread = (HRC – EXW Indiana, US domestic prices less Shredded Midwest US – delivered, US domestic prices), indexed to 1/22/07 = 100 and adjusted for inflation using monthly CPI data
Source: Platts, U.S. Bureau of Labor Statistics
98%
0%
50%
100%
150%
200%Steel Index
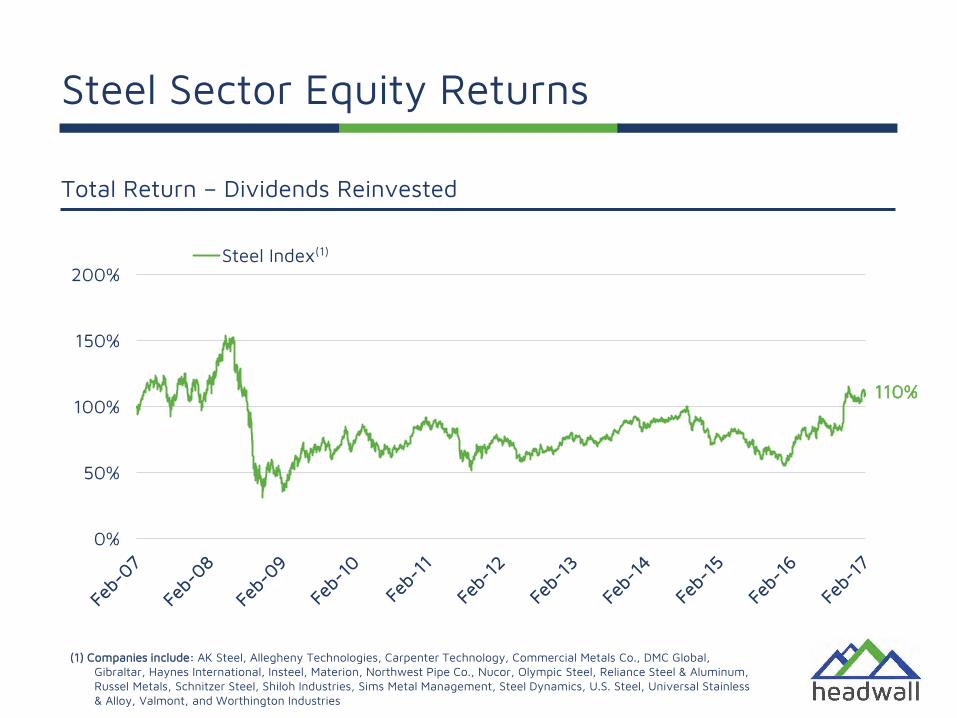
Steel Sector Equity Returns
Total Return – Dividends Reinvested
(1) Companies include: AK Steel, Allegheny Technologies, Carpenter Technology, Commercial Metals Co., DMC Global, Gibraltar, Haynes International, Insteel, Materion, Northwest Pipe Co., Nucor, Olympic Steel, Reliance Steel & Aluminum, Russel Metals, Schnitzer Steel, Shiloh Industries, Sims Metal Management, Steel Dynamics, U.S. Steel, Universal Stainless & Alloy, Valmont, and Worthington Industries
(1)
110%
0%
50%
100%
150%
200%
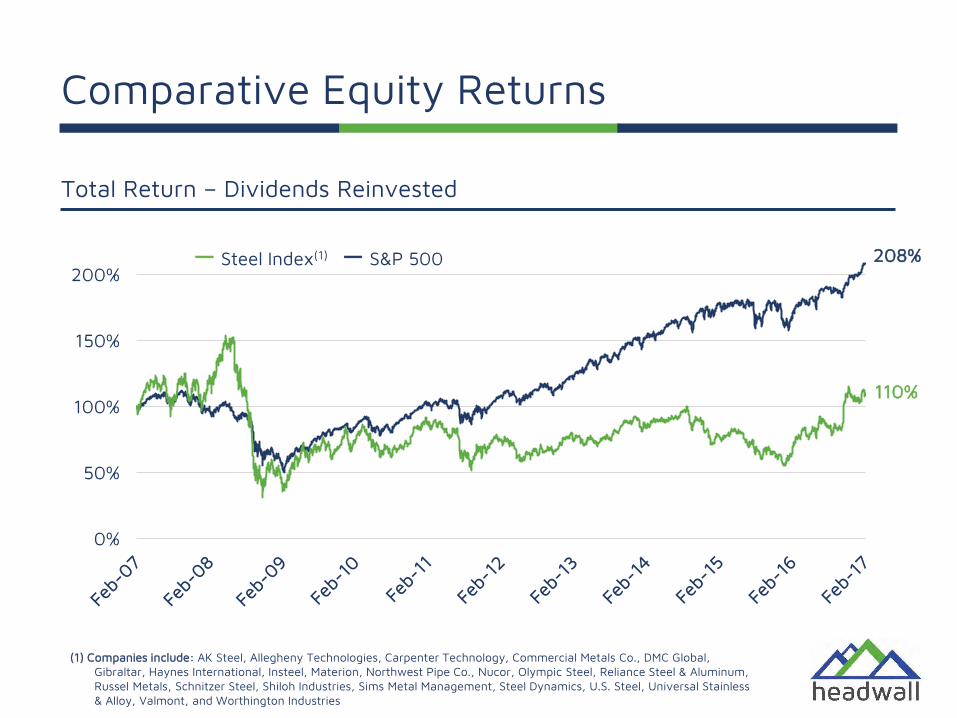
Comparative Equity Returns
Total Return – Dividends Reinvested
(1) Companies include: AK Steel, Allegheny Technologies, Carpenter Technology, Commercial Metals Co., DMC Global, Gibraltar, Haynes International, Insteel, Materion, Northwest Pipe Co., Nucor, Olympic Steel, Reliance Steel & Aluminum, Russel Metals, Schnitzer Steel, Shiloh Industries, Sims Metal Management, Steel Dynamics, U.S. Steel, Universal Stainless & Alloy, Valmont, and Worthington Industries
208%
110%
一 Steel Index(1) 一 S&P 500
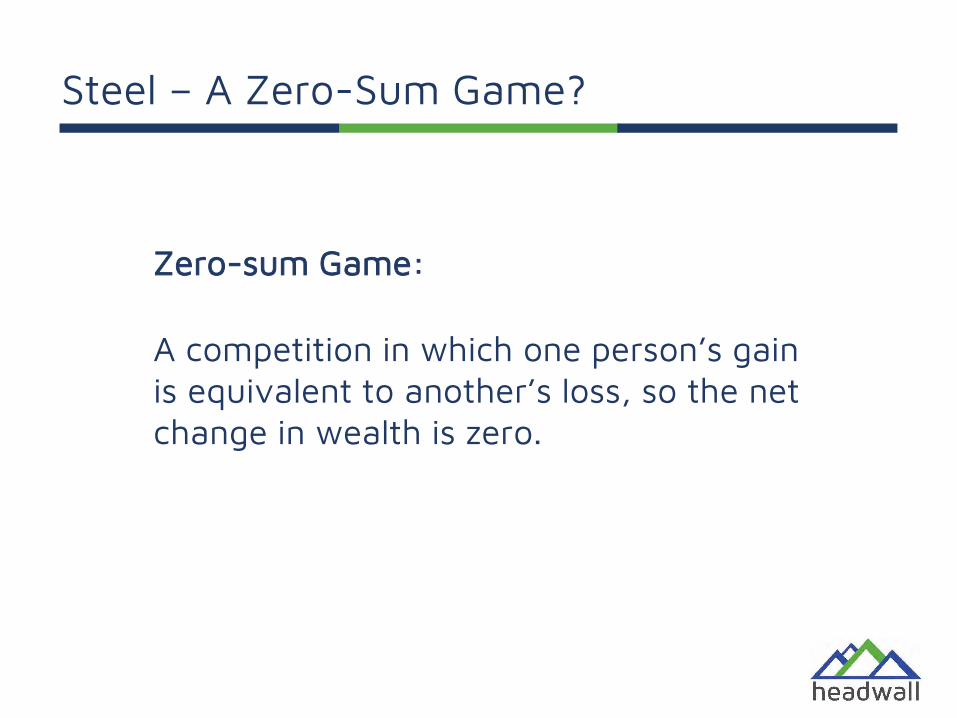
Steel – A Zero-Sum Game?
Zero-sum Game:
A competition in which one person’s gain is equivalent to another’s loss, so the net change in wealth is zero.
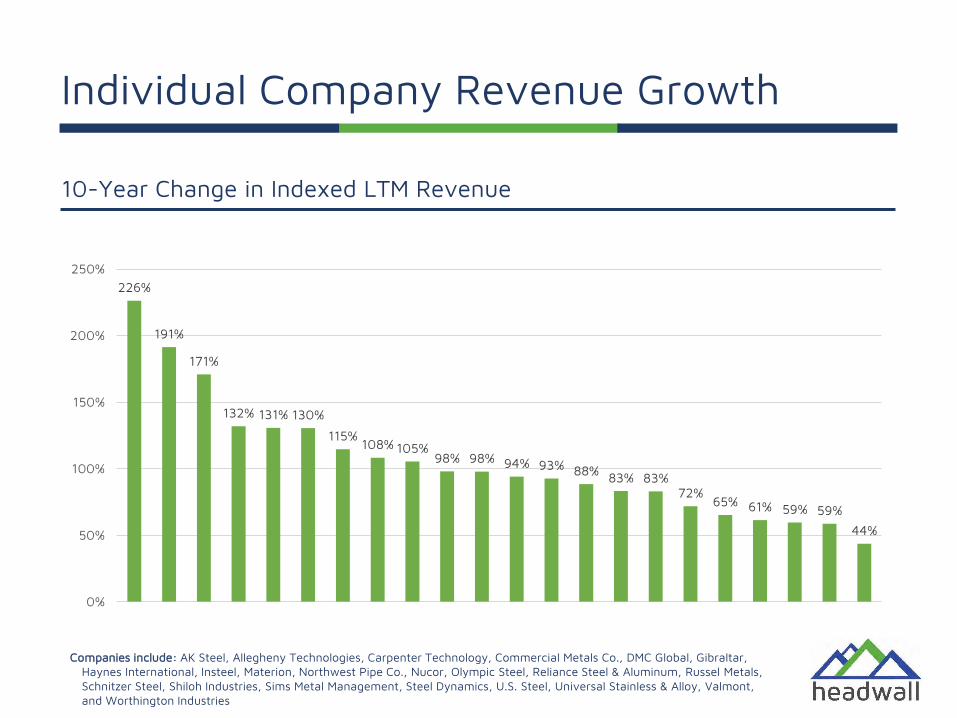
Individual Company Revenue Growth
10-Year Change in Indexed LTM Revenue
Companies include: AK Steel, Allegheny Technologies, Carpenter Technology, Commercial Metals Co., DMC Global, Gibraltar, Haynes International, Insteel, Materion, Northwest Pipe Co., Nucor, Olympic Steel, Reliance Steel & Aluminum, Russel Metals, Schnitzer Steel, Shiloh Industries, Sims Metal Management, Steel Dynamics, U.S. Steel, Universal Stainless & Alloy, Valmont, and Worthington Industries
226%
191%
171%
132% 131% 130%
115%108% 105%
98% 98% 94% 93% 88% 83% 83%72%
65% 61% 59% 59%
44%
0%
50%
100%
150%
200%
250%
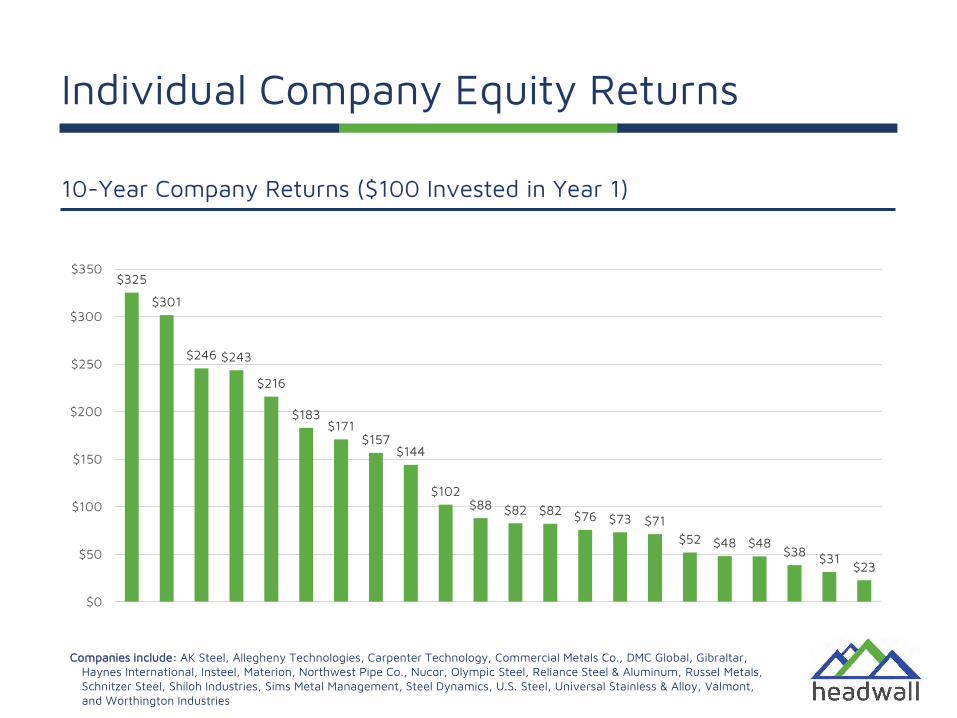
Individual Company Equity Returns
10-Year Company Returns ($100 Invested in Year 1)
Companies include: AK Steel, Allegheny Technologies, Carpenter Technology, Commercial Metals Co., DMC Global, Gibraltar, Haynes International, Insteel, Materion, Northwest Pipe Co., Nucor, Olympic Steel, Reliance Steel & Aluminum, Russel Metals, Schnitzer Steel, Shiloh Industries, Sims Metal Management, Steel Dynamics, U.S. Steel, Universal Stainless & Alloy, Valmont, and Worthington Industries
$325
$301
$246 $243
$216
$183$171
$157$144
$102$88 $82 $82 $76 $73 $71
$52 $48 $48$38 $31
$23
$0
$50
$100
$150
$200
$250
$300
$350
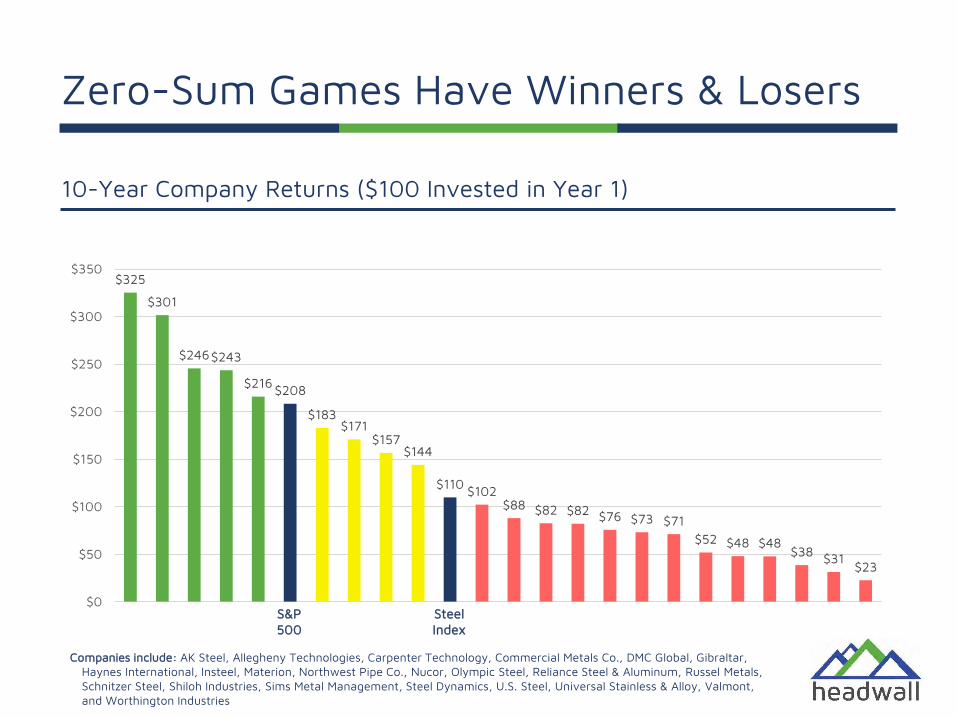
10-Year Company Returns ($100 Invested in Year 1)
Companies include: AK Steel, Allegheny Technologies, Carpenter Technology, Commercial Metals Co., DMC Global, Gibraltar, Haynes International, Insteel, Materion, Northwest Pipe Co., Nucor, Olympic Steel, Reliance Steel & Aluminum, Russel Metals, Schnitzer Steel, Shiloh Industries, Sims Metal Management, Steel Dynamics, U.S. Steel, Universal Stainless & Alloy, Valmont, and Worthington Industries
$325
$301
$246$243
$216 $208
$183$171
$157$144
$110 $102$88 $82 $82 $76 $73 $71
$52 $48 $48$38 $31
$23
$0
$50
$100
$150
$200
$250
$300
$350
Steel Index
S&P 500
Zero-Sum Games Have Winners & Losers
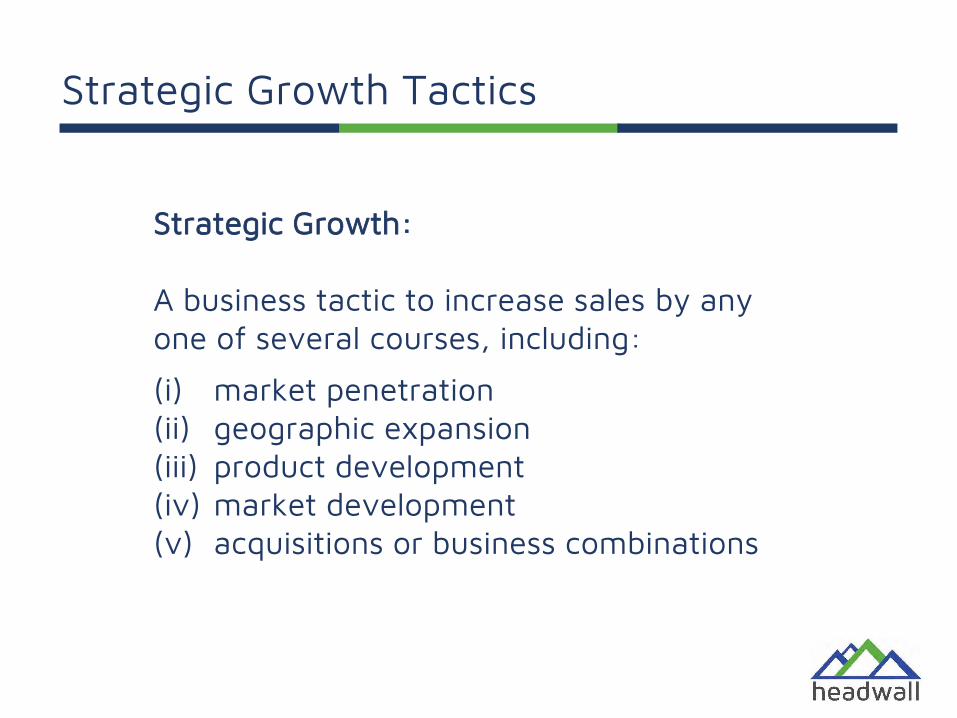
Strategic Growth Tactics
Strategic Growth:
A business tactic to increase sales by any one of several courses, including:
(i) market penetration(ii) geographic expansion (iii) product development(iv) market development (v) acquisitions or business combinations
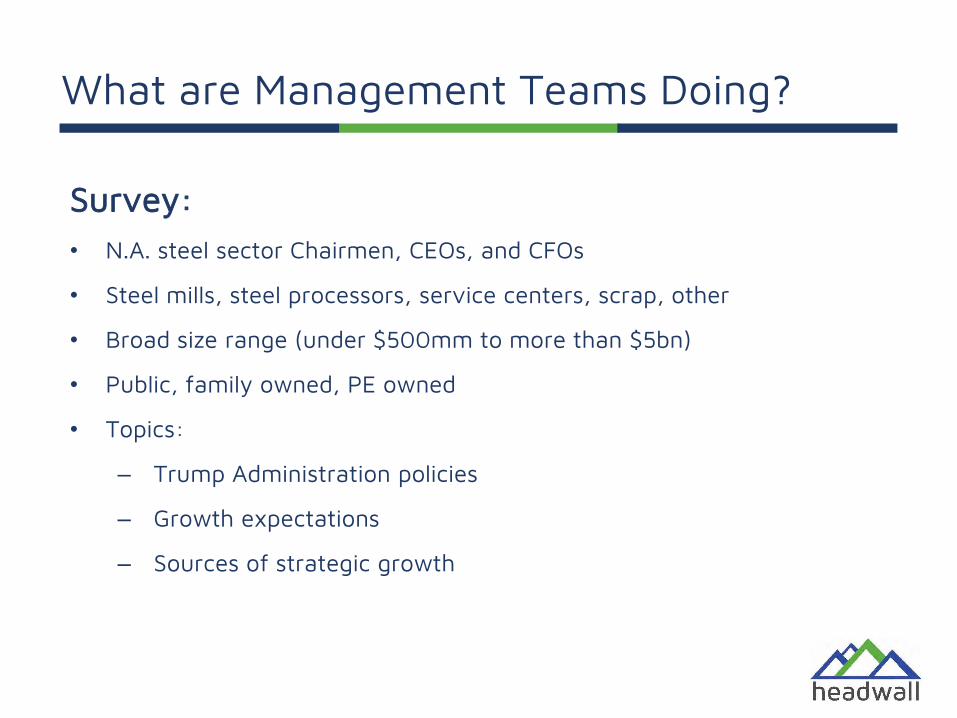
What are Management Teams Doing?
Survey:• N.A. steel sector Chairmen, CEOs, and CFOs
• Steel mills, steel processors, service centers, scrap, other
• Broad size range (under $500mm to more than $5bn)
• Public, family owned, PE owned
• Topics:
‒ Trump Administration policies
‒ Growth expectations
‒ Sources of strategic growth
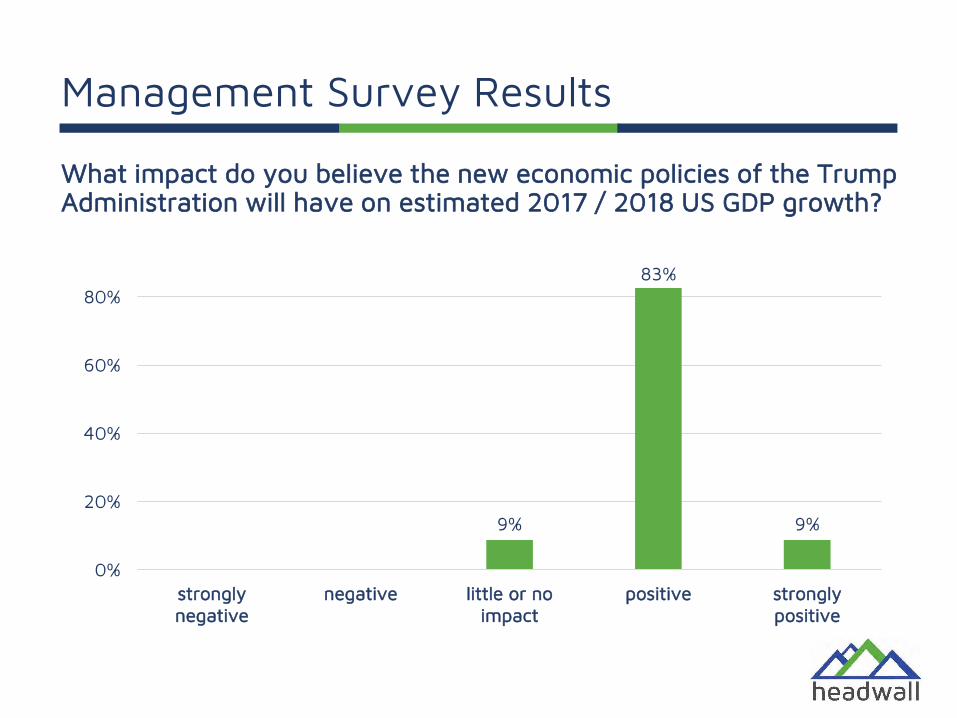
What impact do you believe the new economic policies of the Trump Administration will have on estimated 2017 / 2018 US GDP growth?
9%
83%
9%
0%
20%
40%
60%
80%
stronglynegative
negative little or noimpact
positive stronglypositive
Management Survey Results
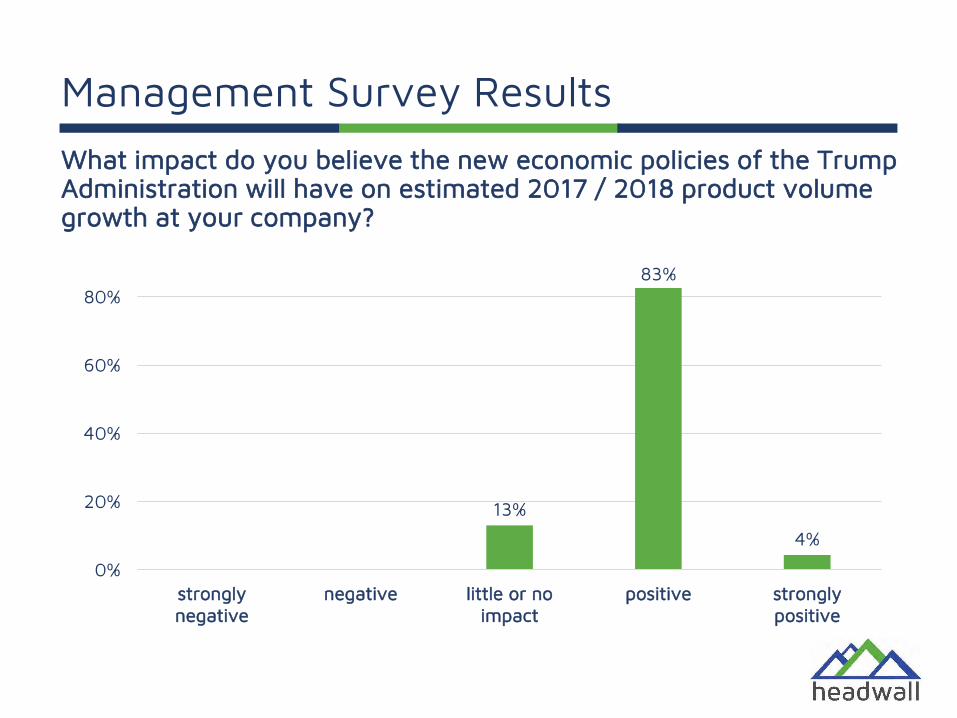
What impact do you believe the new economic policies of the Trump Administration will have on estimated 2017 / 2018 product volume growth at your company?
13%
83%
4%
0%
20%
40%
60%
80%
stronglynegative
negative little or noimpact
positive stronglypositive
Management Survey Results
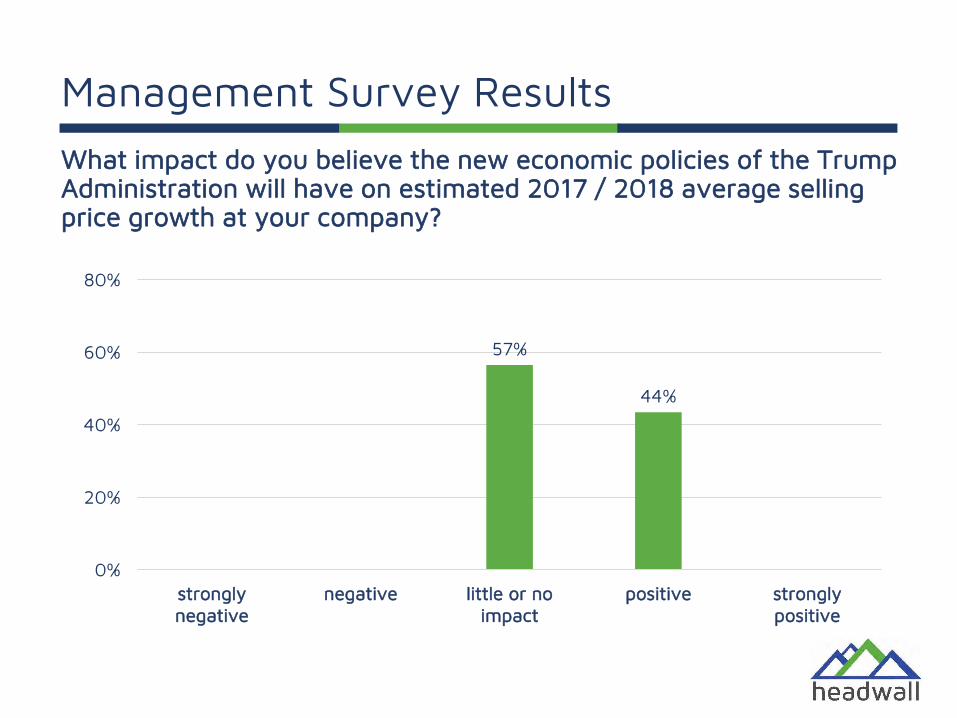
What impact do you believe the new economic policies of the Trump Administration will have on estimated 2017 / 2018 average selling price growth at your company?
57%
44%
0%
20%
40%
60%
80%
stronglynegative
negative little or noimpact
positive stronglypositive
Management Survey Results
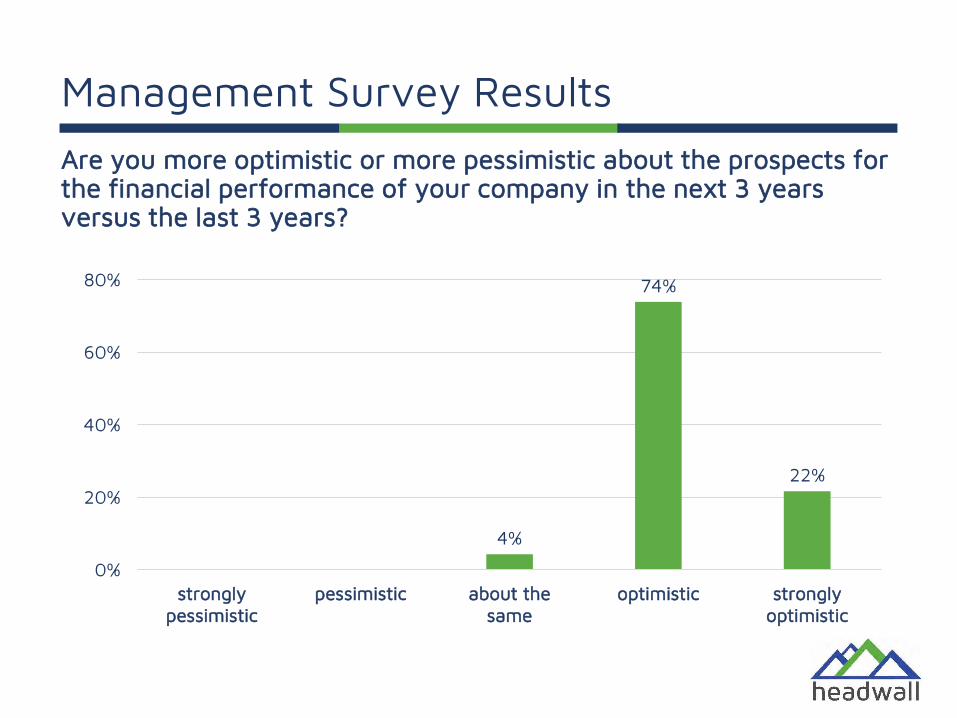
Are you more optimistic or more pessimistic about the prospects for the financial performance of your company in the next 3 years versus the last 3 years?
4%
74%
22%
0%
20%
40%
60%
80%
stronglypessimistic
pessimistic about thesame
optimistic stronglyoptimistic
Management Survey Results
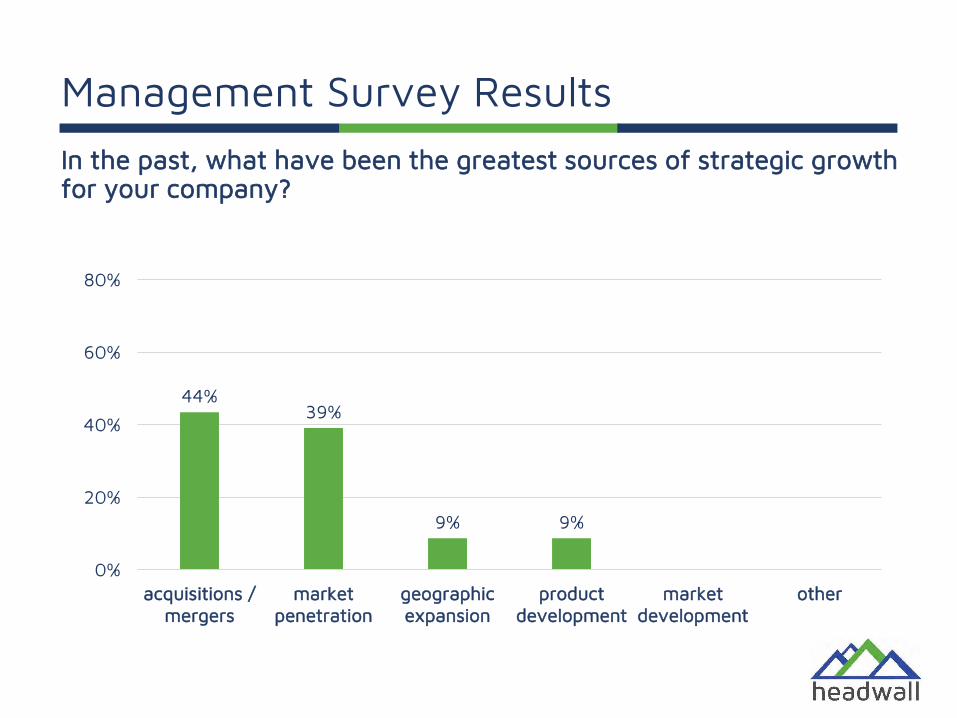
In the past, what have been the greatest sources of strategic growth for your company?
44%39%
9% 9%
0%
20%
40%
60%
80%
acquisitions /mergers
marketpenetration
geographicexpansion
productdevelopment
marketdevelopment
other
Management Survey Results
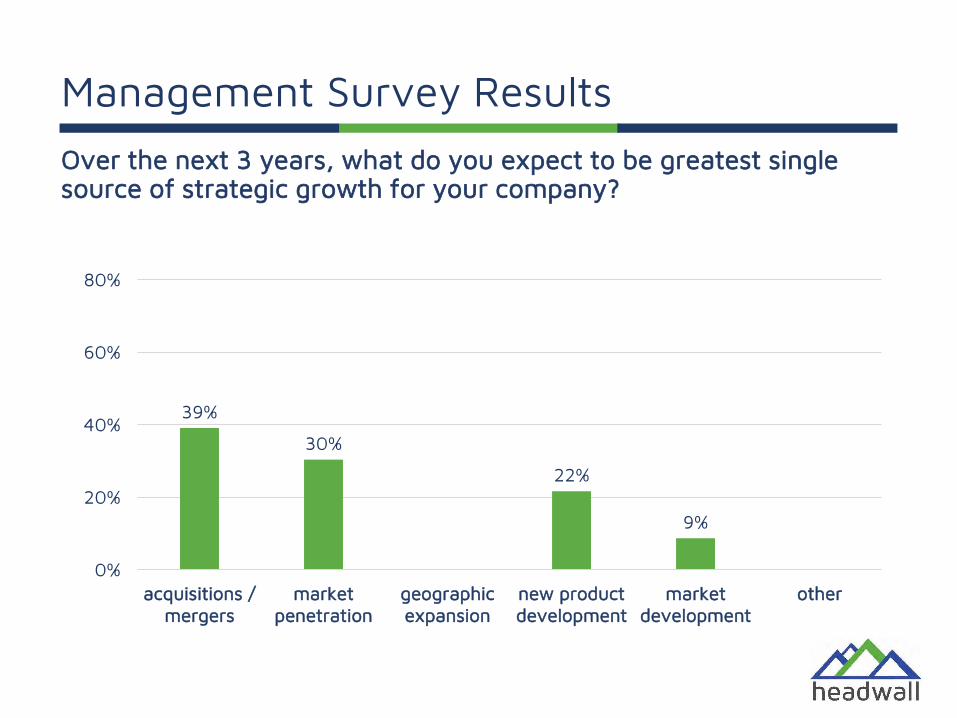
Over the next 3 years, what do you expect to be greatest single source of strategic growth for your company?
39%
30%
22%
9%
0%
20%
40%
60%
80%
acquisitions /mergers
marketpenetration
geographicexpansion
new productdevelopment
marketdevelopment
other
Management Survey Results
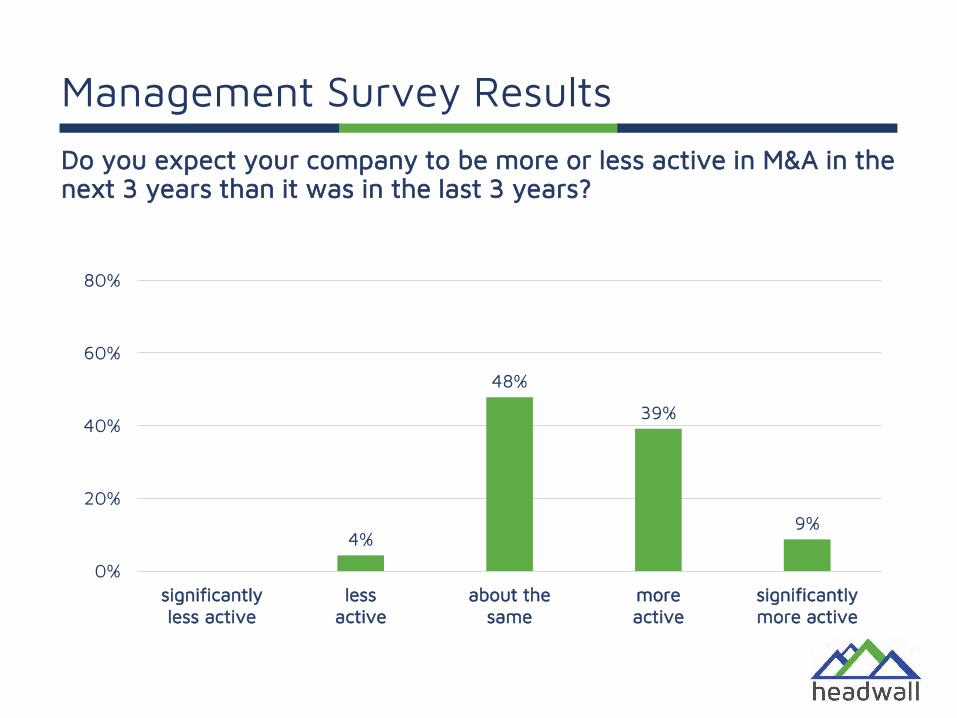
Do you expect your company to be more or less active in M&A in the next 3 years than it was in the last 3 years?
4%
48%
39%
9%
0%
20%
40%
60%
80%
significantlyless active
lessactive
about thesame
moreactive
significantlymore active
Management Survey Results
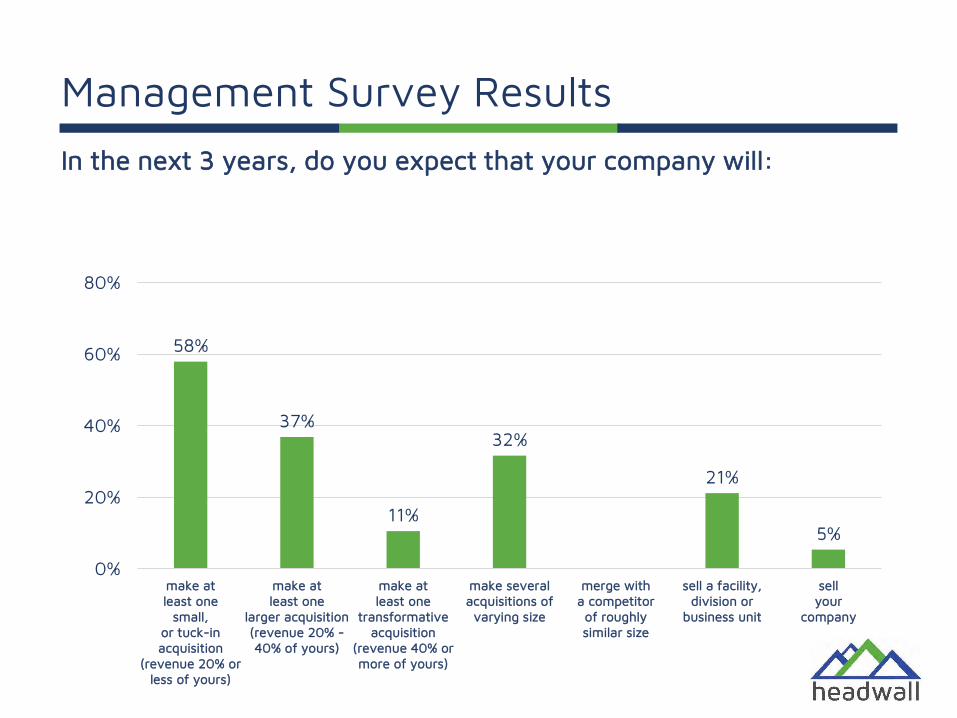
In the next 3 years, do you expect that your company will:
58%
37%
11%
32%
21%
5%
0%
20%
40%
60%
80%
make atleast one
small,or tuck-inacquisition
(revenue 20% orless of yours)
make atleast one
larger acquisition(revenue 20% -40% of yours)
make atleast one
transformativeacquisition
(revenue 40% ormore of yours)
make severalacquisitions of
varying size
merge witha competitorof roughlysimilar size
sell a facility,division or
business unit
sellyour
company
Management Survey Results
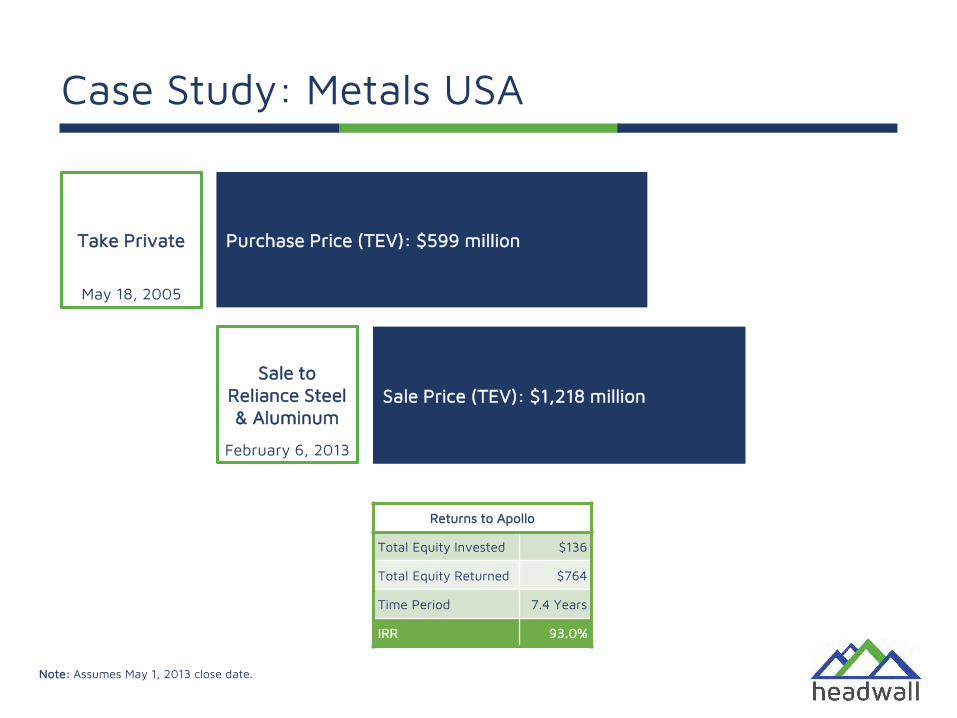
Case Study: Metals USA
Take Private
Sale to Reliance Steel & Aluminum
Purchase Price (TEV): $599 million
Sale Price (TEV): $1,218 million
May 18, 2005
February 6, 2013
Returns to Apollo
Total Equity Invested $136
Total Equity Returned $764
Time Period 7.4 Years
IRR 93.0%
Note: Assumes May 1, 2013 close date.
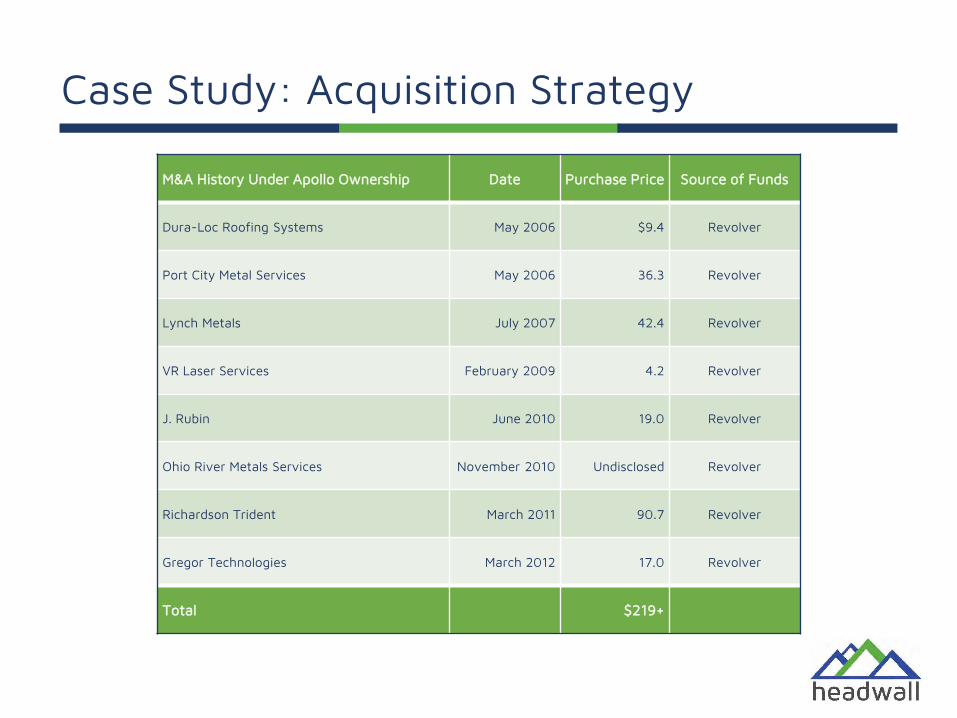
Case Study: Acquisition Strategy
M&A History Under Apollo Ownership Date Purchase Price Source of Funds
Dura-Loc Roofing Systems May 2006 $9.4 Revolver
Port City Metal Services May 2006 36.3 Revolver
Lynch Metals July 2007 42.4 Revolver
VR Laser Services February 2009 4.2 Revolver
J. Rubin June 2010 19.0 Revolver
Ohio River Metals Services November 2010 Undisclosed Revolver
Richardson Trident March 2011 90.7 Revolver
Gregor Technologies March 2012 17.0 Revolver
Total $219+
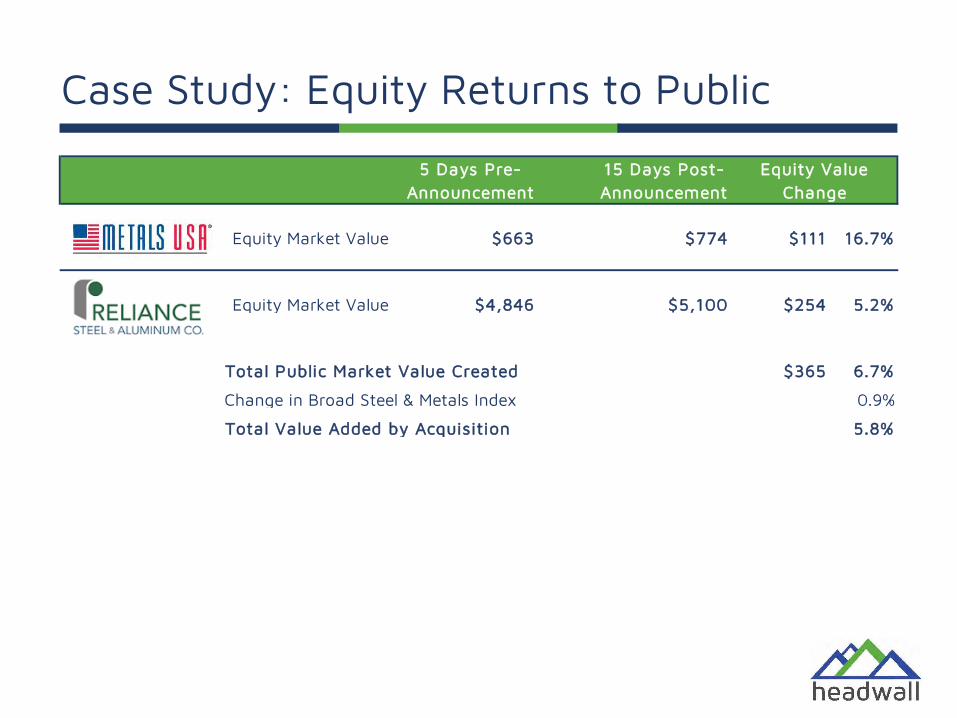
Case Study: Equity Returns to Public
5 Days Pre-Announcement
15 Days Post- Announcement
Equity Market Value $663 $774 $111 16.7%
Equity Market Value $4,846 $5,100 $254 5.2%
Total Public Market Value Created $365 6.7%
Change in Broad Steel & Metals Index 0.9%
Total Value Added by Acquisition 5.8%
Equity Value Change

Types of Acquirers
Infrequent larger acquisitionsFrequent large and small acquisitions
Infrequent smaller acquisitions Frequent smaller acquisitions
Infrequent Frequent
Larger
Smaller
Systematic
Cautious Tuck-In

Number of Transactions
<10 10+
Types of Acquirers
Infrequent Frequent
Larger
Smaller
Systematic (4)
Cautious (6) Tuck-In (6)
Larg
est
Acq
uisi
tion
as
a %
of
Mar
ket
Cap
>20
%<
20%
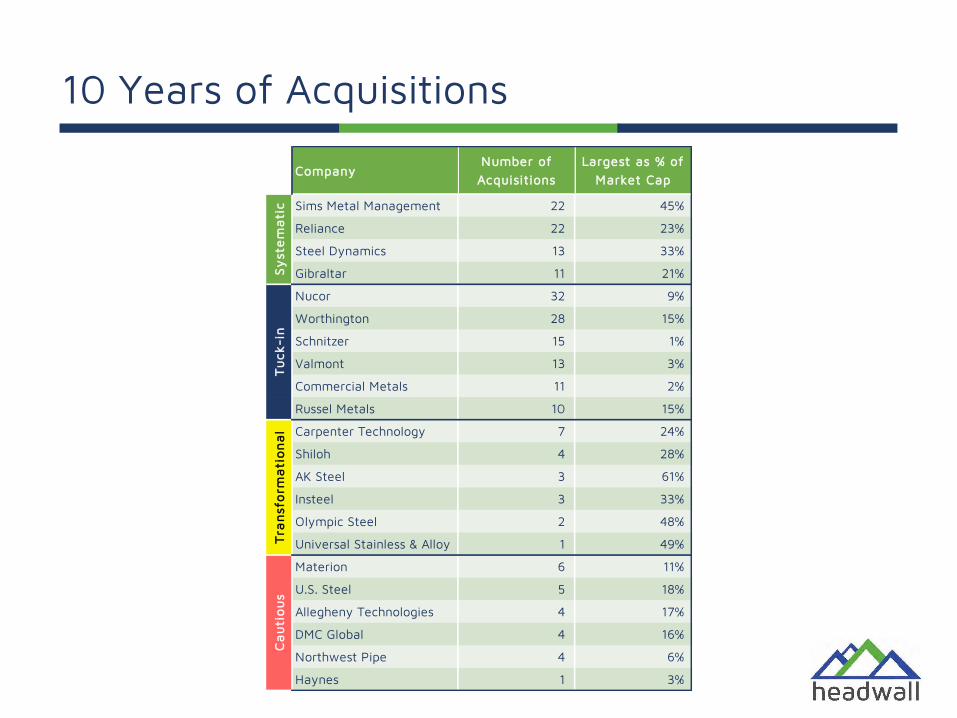
10 Years of Acquisitions
CompanyNumber of
AcquisitionsLargest as % of
Market Cap
Sims Metal Management 22 45%
Reliance 22 23%
Steel Dynamics 13 33%
Gibraltar 11 21%
Nucor 32 9%
Worthington 28 15%
Schnitzer 15 1%
Valmont 13 3%
Commercial Metals 11 2%
Russel Metals 10 15%
Carpenter Technology 7 24%
Shiloh 4 28%
AK Steel 3 61%
Insteel 3 33%
Olympic Steel 2 48%
Universal Stainless & Alloy 1 49%
Materion 6 11%
U.S. Steel 5 18%
Allegheny Technologies 4 17%
DMC Global 4 16%
Northwest Pipe 4 6%
Haynes 1 3%
Ca
uti
ou
sT
ran
sfo
rma
tio
na
lT
uck
-in
Sy
ste
ma
tic
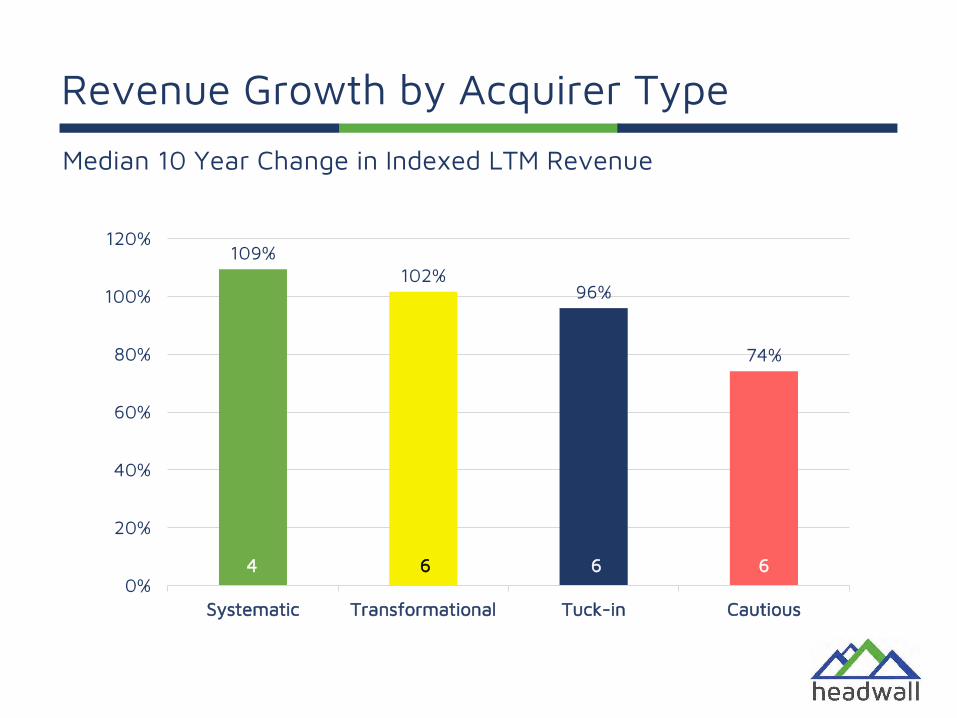
Revenue Growth by Acquirer Type
109%102%
96%
74%
0%
20%
40%
60%
80%
100%
120%
Systematic Transformational Tuck-in Cautious
Median 10 Year Change in Indexed LTM Revenue
64 66
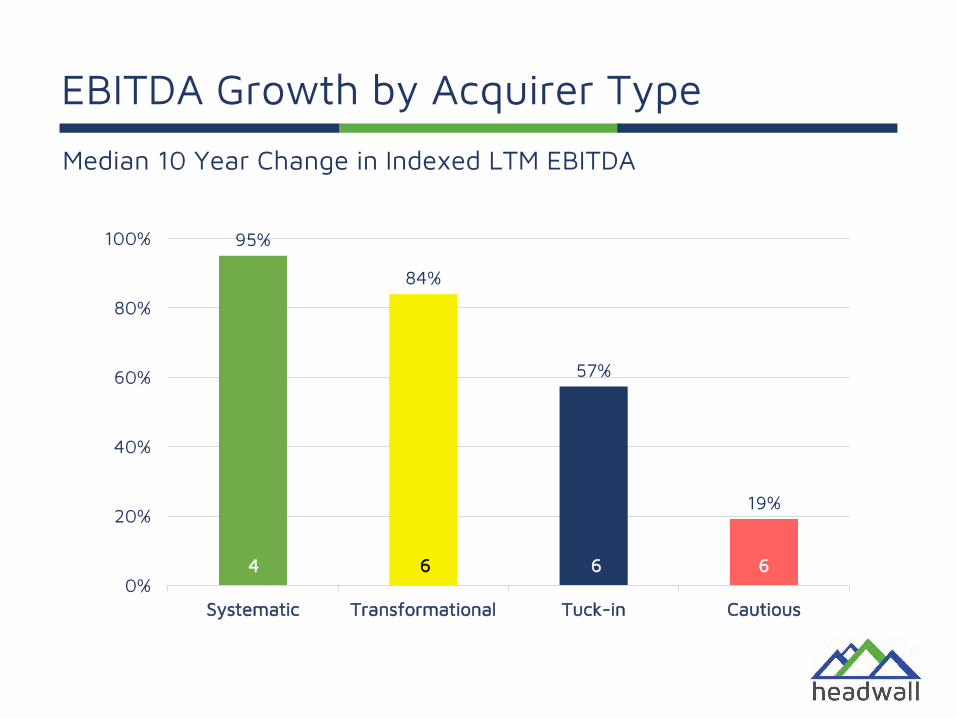
EBITDA Growth by Acquirer Type
95%
84%
57%
19%
0%
20%
40%
60%
80%
100%
Systematic Transformational Tuck-in Cautious
Median 10 Year Change in Indexed LTM EBITDA
64 66
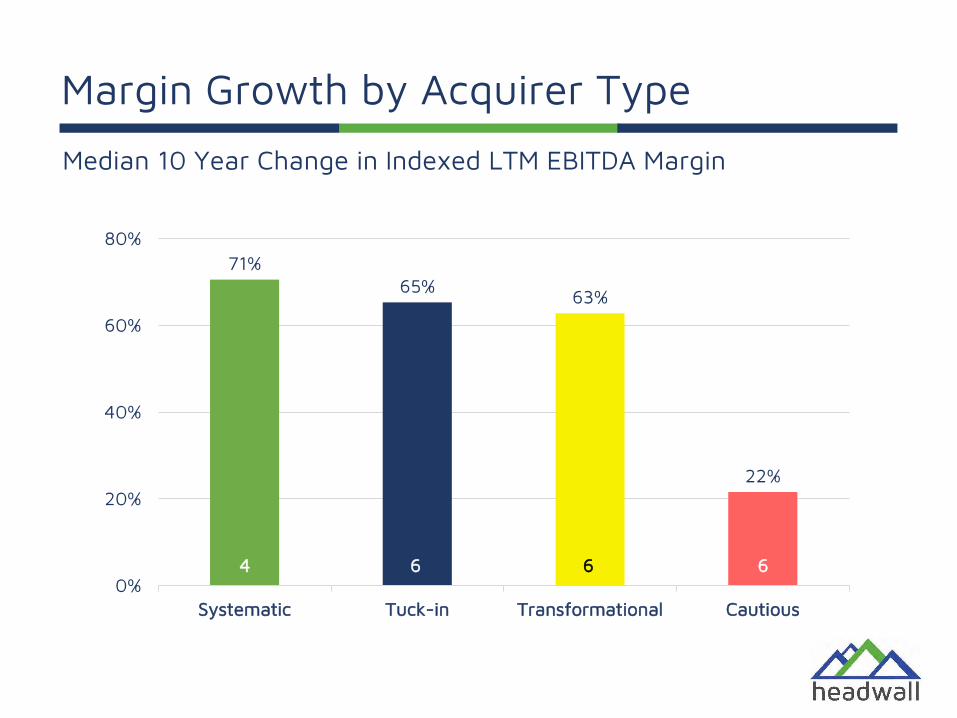
Margin Growth by Acquirer Type
71%65% 63%
22%
0%
20%
40%
60%
80%
Systematic Tuck-in Transformational Cautious
Median 10 Year Change in Indexed LTM EBITDA Margin
64 66
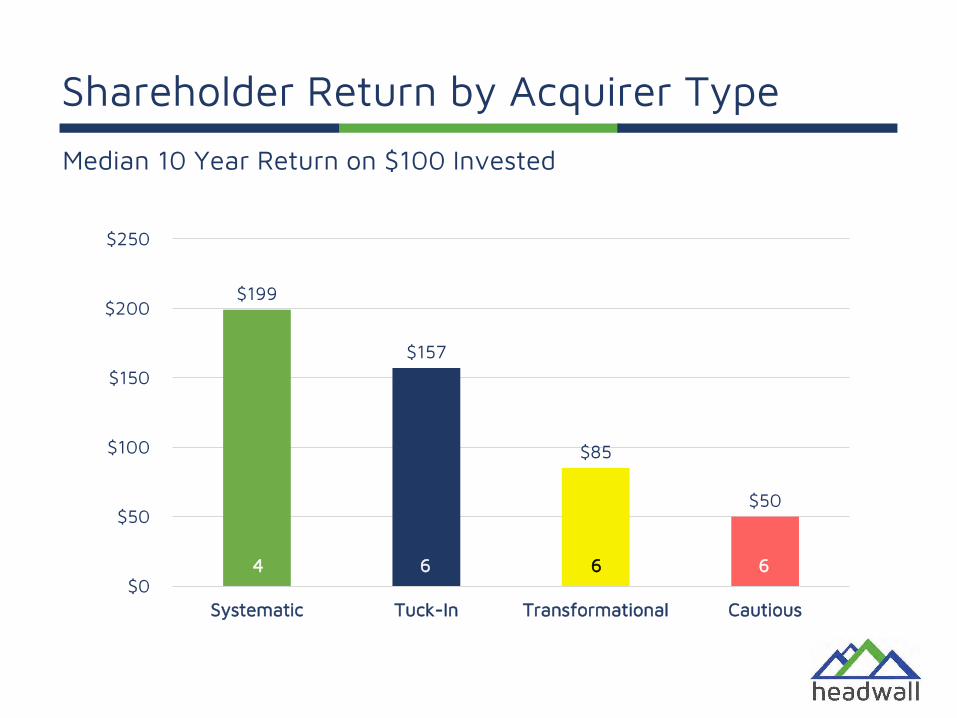
Shareholder Return by Acquirer Type
6 6 6 4
$199
$157
$85
$50
$0
$50
$100
$150
$200
$250
Systematic Tuck-In Transformational Cautious
64 66
Median 10 Year Return on $100 Invested
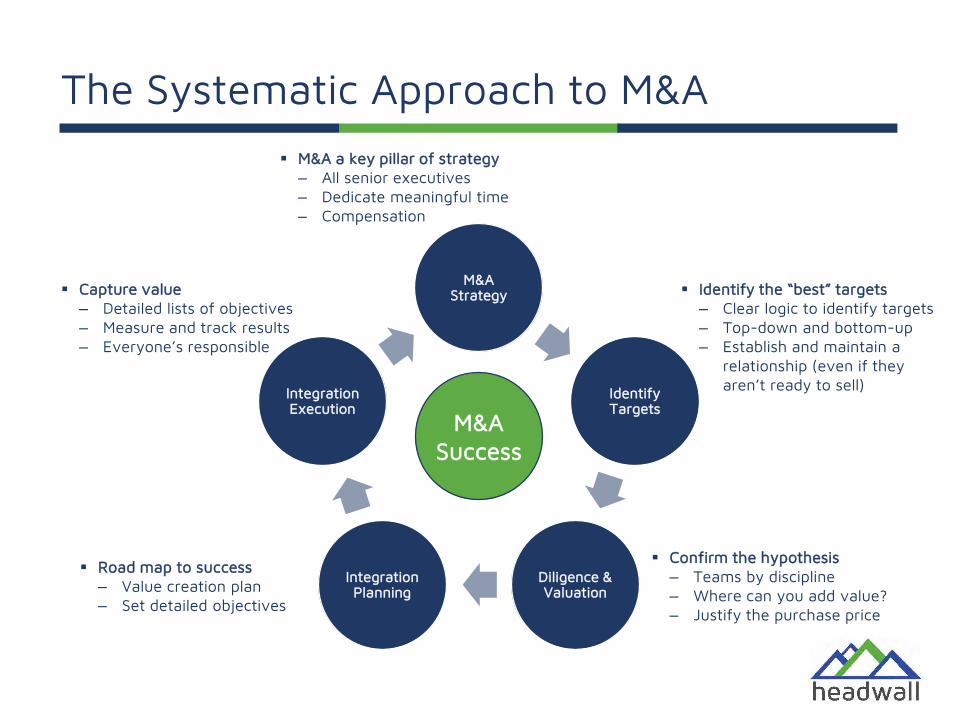
The Systematic Approach to M&A
M&A Strategy
Identify Targets
Diligence & Valuation
Integration Planning
Integration Execution
M&ASuccess
Capture value‒ Detailed lists of objectives ‒ Measure and track results ‒ Everyone’s responsible
Road map to success‒ Value creation plan‒ Set detailed objectives
Confirm the hypothesis‒ Teams by discipline‒ Where can you add value?‒ Justify the purchase price
Identify the “best” targets‒ Clear logic to identify targets‒ Top-down and bottom-up‒ Establish and maintain a
relationship (even if they aren’t ready to sell)
M&A a key pillar of strategy‒ All senior executives‒ Dedicate meaningful time‒ Compensation
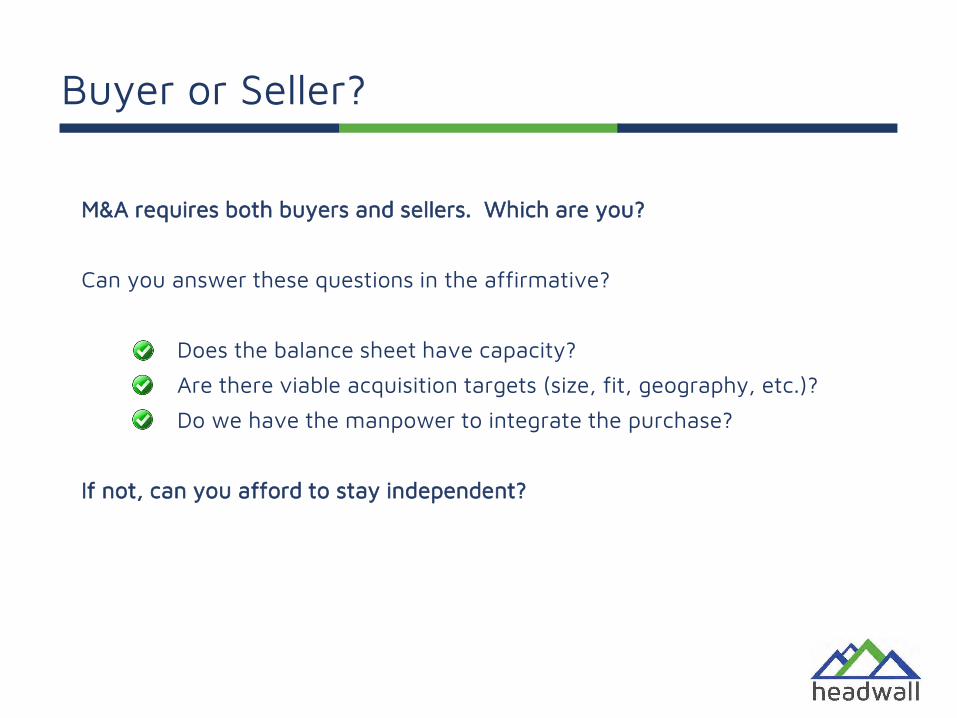
Buyer or Seller?
M&A requires both buyers and sellers. Which are you?
Can you answer these questions in the affirmative?
Does the balance sheet have capacity?
Are there viable acquisition targets (size, fit, geography, etc.)?
Do we have the manpower to integrate the purchase?
If not, can you afford to stay independent?
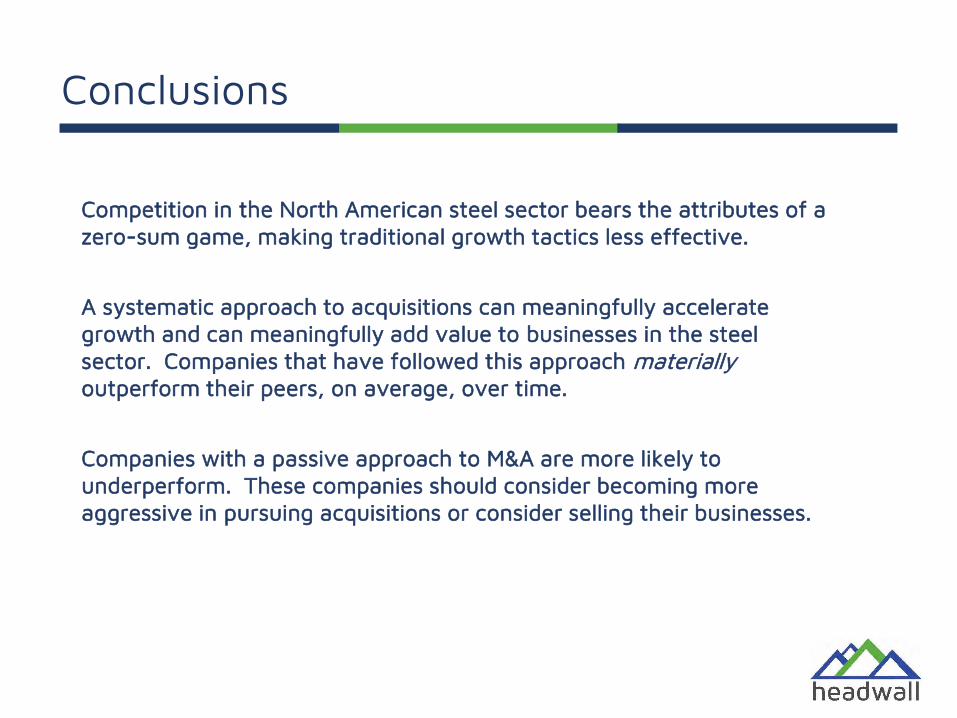
Conclusions
Competition in the North American steel sector bears the attributes of a zero-sum game, making traditional growth tactics less effective.
A systematic approach to acquisitions can meaningfully accelerate growth and can meaningfully add value to businesses in the steel sector. Companies that have followed this approach materiallyoutperform their peers, on average, over time.
Companies with a passive approach to M&A are more likely to underperform. These companies should consider becoming more aggressive in pursuing acquisitions or consider selling their businesses.

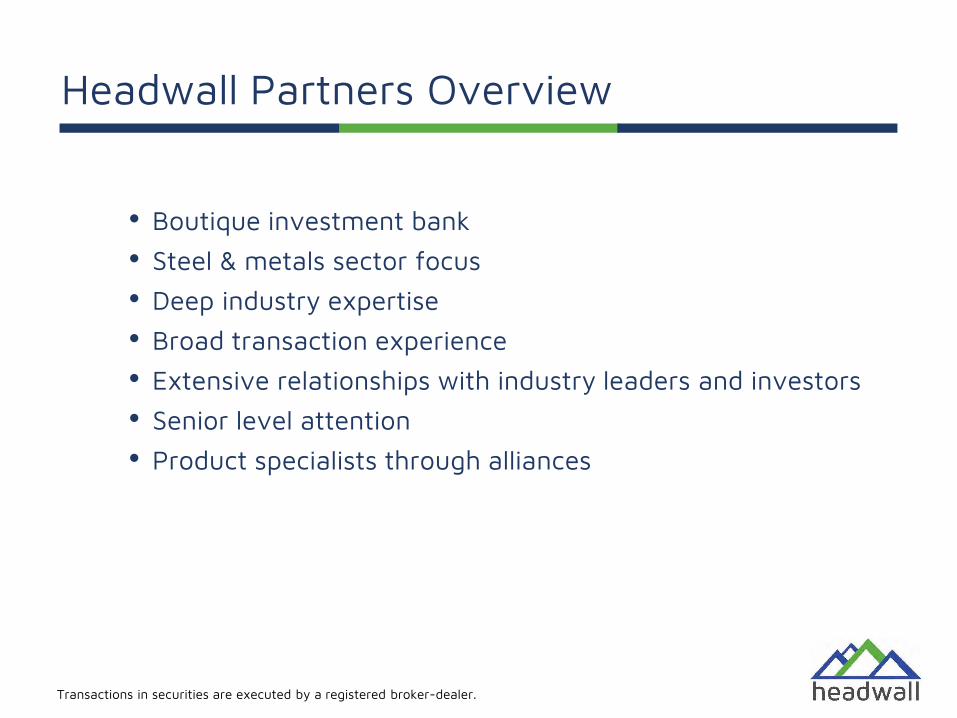
Headwall Partners Overview
• Boutique investment bank
• Steel & metals sector focus
• Deep industry expertise
• Broad transaction experience
• Extensive relationships with industry leaders and investors
• Senior level attention
• Product specialists through alliances
Transactions in securities are executed by a registered broker-dealer.
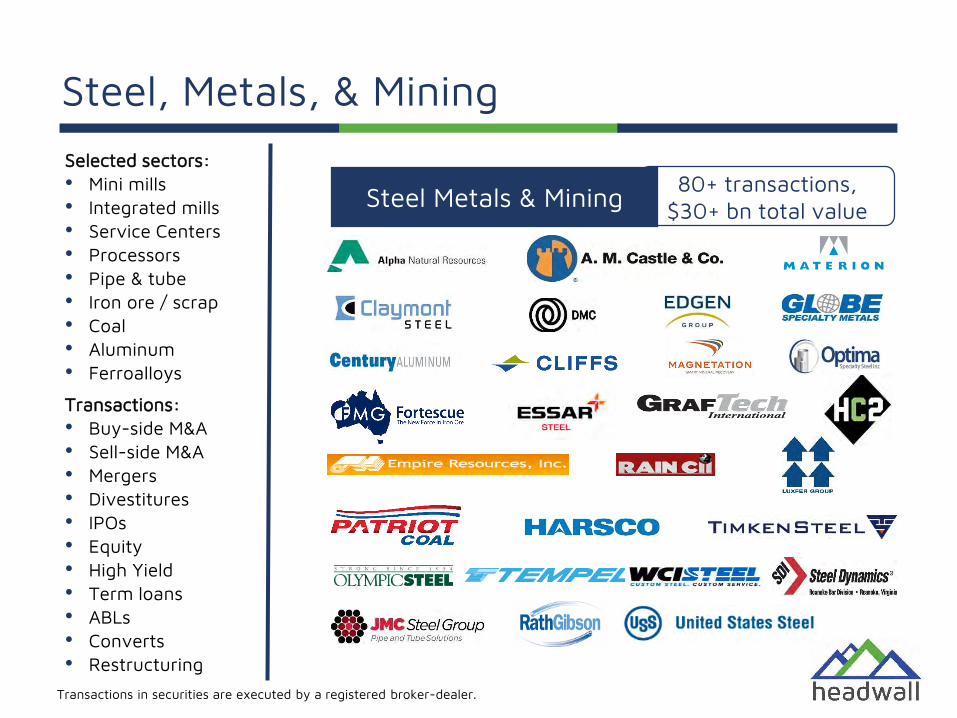
Steel, Metals, & Mining
80+ transactions, $30+ bn total valueSteel Metals & Mining
Selected sectors:• Mini mills• Integrated mills• Service Centers• Processors• Pipe & tube• Iron ore / scrap• Coal• Aluminum• Ferroalloys
Transactions:• Buy-side M&A• Sell-side M&A• Mergers• Divestitures• IPOs• Equity• High Yield• Term loans• ABLs• Converts• Restructuring
Transactions in securities are executed by a registered broker-dealer.
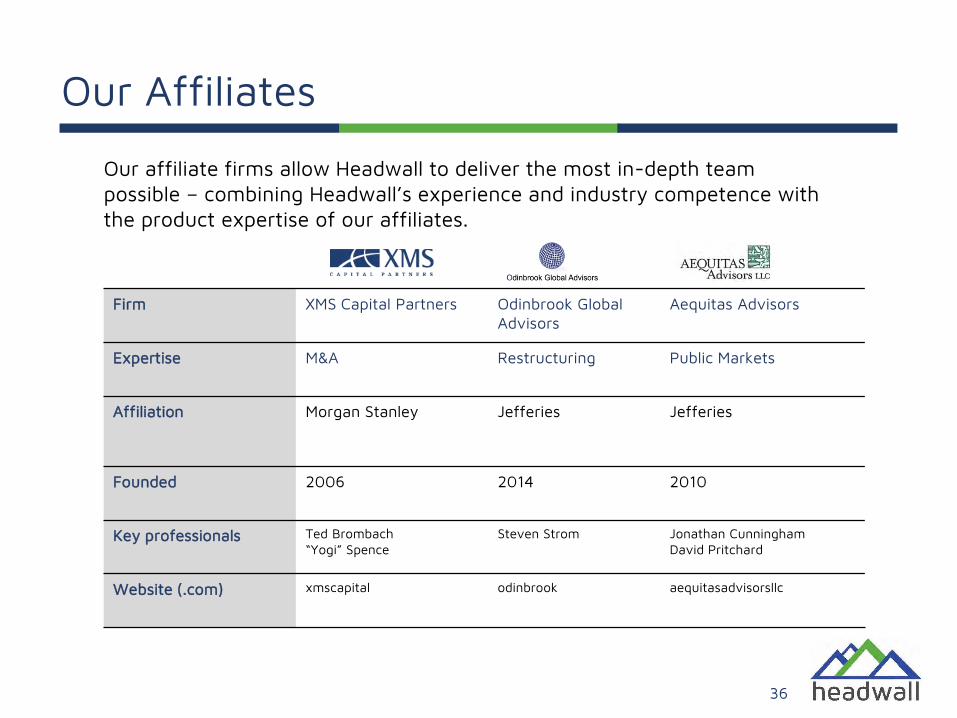
Our Affiliates
36
Firm XMS Capital Partners Odinbrook Global Advisors
Aequitas Advisors
Expertise M&A Restructuring Public Markets
Affiliation Morgan Stanley Jefferies Jefferies
Founded 2006 2014 2010
Key professionals Ted Brombach“Yogi” Spence
Steven Strom Jonathan CunninghamDavid Pritchard
Website (.com) xmscapital odinbrook aequitasadvisorsllc
Our affiliate firms allow Headwall to deliver the most in-depth team possible – combining Headwall’s experience and industry competence with the product expertise of our affiliates.
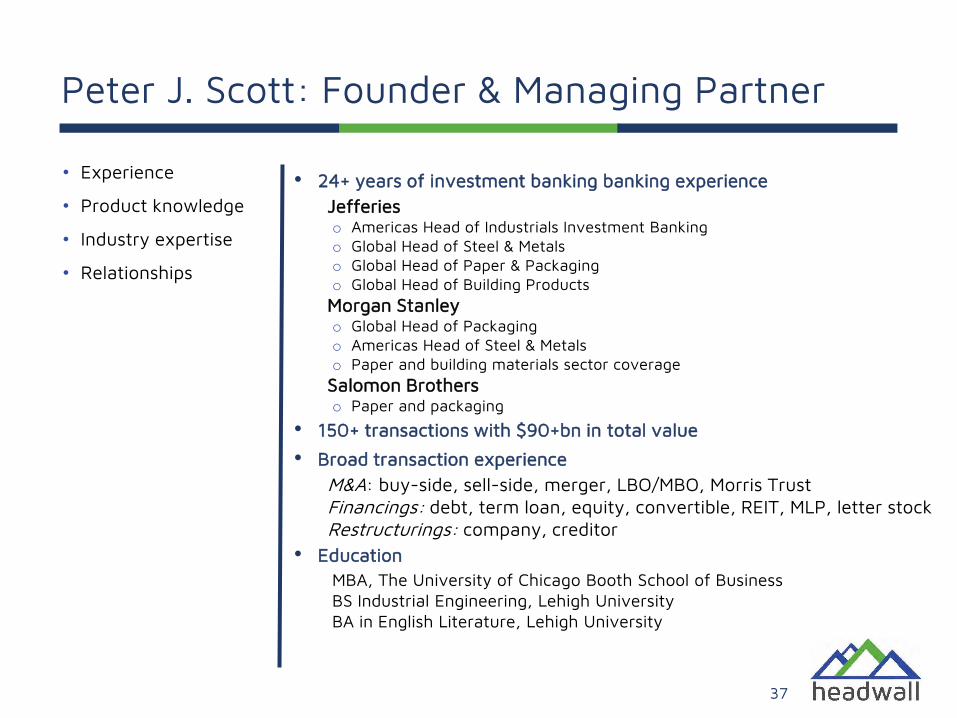
Peter J. Scott: Founder & Managing Partner
• 24+ years of investment banking banking experienceJefferieso Americas Head of Industrials Investment Bankingo Global Head of Steel & Metalso Global Head of Paper & Packagingo Global Head of Building Products Morgan Stanleyo Global Head of Packagingo Americas Head of Steel & Metalso Paper and building materials sector coverageSalomon Brotherso Paper and packaging
• 150+ transactions with $90+bn in total value
• Broad transaction experienceM&A: buy-side, sell-side, merger, LBO/MBO, Morris TrustFinancings: debt, term loan, equity, convertible, REIT, MLP, letter stockRestructurings: company, creditor
• EducationMBA, The University of Chicago Booth School of BusinessBS Industrial Engineering, Lehigh UniversityBA in English Literature, Lehigh University
37
• Experience
• Product knowledge
• Industry expertise
• Relationships