Embed Size (px)
Citation preview

Strategic Materials Selection In The Automobile Body: Economic Opportunities for Polymer Composite Design By Erica R.H. Fuchs*, Frank R. Field*, Richard Roth*, Randolph E. Kirchain*
*Massachusetts Institute of Technology
Previous studies on materials choice in automotive bodies have looked at both composite and aluminum alternatives, but have always found steel to be the most cost-effective option at the production volumes found in the overwhelming majority of vehicle models. This study finds steel to no longer overwhelmingly dominate as the most cost-effective body material when considering potential advances in the polymer composite body-in-white design against the mild-grade steel body currently on the road. With the significant implications of a polymer-composite body for vehicle light-weighting and thereby improved fuel efficiency, these results come at a time when they are particularly pertinent.
The results presented in this paper are based on a consortium-developed, 25-part unibody design not available to previous studies. Also presented for the first time are data on competing alternatives in fiber-composite component assembly and implications of platform sharing across vehicle models. Finally, developments in process-based cost modeling capabilities are presented for a) fiber-reinforced composite component production, b) component assembly, and c) design implications of glass versus carbon reinforcement.
Materials Selection in Automotive Body-In-Whites: Technologies and Demands
Public concern about energy consumption has influenced vehicle development for over three
decades. The issue came to the fore with the energy shocks of the 1970's. The U.S. government
responded by passing the Corporate Average Fuel Economy (CAFE) standards in 1975. In
response to these federal mandates, automakers began deploying alternative materials,
architectures, and power trains to improve fuel economy while still satisfying consumer demand.
Although CAFE requirements remained fixed between 1990 and 2006 [1] ,1 automakers have
1 As of March 2006, CAFÉ standards for light trucks of model years 2008-2011 have been increased to 24.1mpg. [2]
Working Paper: Do not cite without author permission.
continued to explore technologies that improve vehicle fuel efficiency and accommodate
consumer preferences for increased vehicle performance, size, and convenience features. With
recent rises in oil prices, such technological advances have increasing importance for
competitiveness in the global automobile market [3, 4]. One key technical design strategy for
improving vehicle efficiency is the reduction of vehicle mass, or light-weighting.
Vehicle light-weighting not only enhances fuel efficiency, but also lowers vehicle emissions
and improves driving performance.2 Lightweight subsystems such as hoods and decklids are
already employed throughout the industry to achieve small weight savings. However, significant
improvements in vehicle efficiency will require larger changes in mass. A primary target for this
mass reduction is the body-in-white, whose standard steel version comprises 20-25% of total
vehicle curb weight.
The two main strategic approaches for reducing weight in the body-in-white are architectural
changes and material substitution. Among architecture alternatives, the unibody is most mass
efficient and is already ubiquitous. Consequently, the primary mechanism available for reducing
the weight of the body-in-white is the use of alternative materials. This study examines the
potential cost-competitiveness of two alternative body materials – carbon fiber (CFRP) and glass
fiber reinforcement polymer (GFRP) composites.
Background: Current BIW Materials Use
Steel has been the material of choice for automobiles since Henry Ford’s introduction of mass
production in 1913. This history of steel in the automobile has lead not only to numerous jobs in
the U.S.,3 but also to a wealth of technological experience on body component design,
2 Alternatively, lighter structures can allow for additional weight in the form of electrical conveniences such as DVD players,
navigation systems, and additional motorized options. 3 According to the Center for Automotive Research, in 2001 the U.S. automotive industry accounted for 14% of U.S. steel
consumption and 31.4% of U.S. iron consumption. The automotive industry’s use of steel provided 15,475 jobs in the U.S. steel industry and 3,384 jobs in the U.S. iron industry. [5]
Working Paper: Do not cite without author permission.

production, and assembly with steel. In 2004, the average light vehicle produced in North
America contained 2233 pounds of steel, totaling 55% of the vehicle weight [6]. Another 331
pounds, or 8%, of the typical light vehicle in 2004 was iron[6].4,5
The use of polymers in U.S. automotive applications has risen dramatically from an average of
18 pounds per vehicle in 1960[8]. Ward’s Motor Vehicle Facts and Figures place plastics and
composites at 335 pounds in the average light vehicle produced in 2004, or 8% of vehicle
weight, and 4.5% of total U.S. plastic consumption. Most of the plastic applications in vehicles
are lower-performance commodity polymers and short-fiber composites. These lower-
performance polymers are used in sportside truck models in fascia, fenders, and trims, and in
heavy truck applications for cab steps, bumpers, spoilers, doors, fenders, toolbox doors, and even
full cabs. Low-performance polymers are also used in non-structural body applications of some
passenger vehicles. Vehicles with non-structural polymer body panels have included GM’s
Saturn, EV1, Corvette, Firebird, and Camaro, as well as Ford’s Tarus/Sable, Mustang, and
Windstar. Advanced composites in structural vehicle body applications have been far less
extensive. The two most well-known advanced composite applications are the GM 800 truckbox
and the GM 805 tailgate, both of which are structural reaction injection molded. Recently, GM
placed a polyester and carbon-fiber-reinforced floor in its Corvette Z06, and BMW has included
a carbon-fiber-reinforced roof structure in its M6[9].
Previous Work
Most work on the competitiveness of polymer composite technology came out in the early- to
mid-1990s along with the 1993 establishment of the Partnership for a New Generation of
4 These numbers, based on “Average Materials Content of North American Light Vehicles” in 2006 Ward’s Automotive Vehicle Facts
and Figures assume a total material content of 4026 pounds. 5 With ongoing pressures to light-weight vehicles, in March of 1998 the U.S. Iron and Steel Industry rolled out an Ultra Light Steel
Auto Body (ULSAB) concept. In comparison to today's mid-size cars which weigh about 3,300 lbs., they estimate that a ULSAB-bodied car would weigh about 2,960 lbs [7]
Working Paper: Do not cite without author permission.

Vehicles (PNGV) [10-15]. Little new work has emerged in the past decade re-evaluating the
economic feasibility of structural polymer composite applications in automobile bodies-in-white.
It is conventional wisdom within the industry that the use of polymer matrix composites in
automobile structures cannot be defended on an economic basis [10, 16]. A 1995 study by IBIS
and the Rocky Mountain Institute, based on GM’s 100-day first cut ultra-light BIW concept car,
argued that concerns over the economic viability of carbon fiber advanced composites in the
BIW may be misplaced [10]. A 1999 study by the Rocky Mountain Institute has suggested that
polymer composite BIW alternatives may be well-suited to platforming goals by providing a
cheaper an more easily contoured alternative for the customized part of the vehicle [17].
The work presented in this paper differs from previous studies in several ways: (1) It is based
on, up-to-date detailed data collection with resin and fiber reinforcement suppliers, polymer
composite equipment suppliers, polymer composite component producers, and Ford, General
Motors, and DaimlerChrysler; (2) It applies new component and assembly modeling techniques;
(3) It evaluates the competitiveness of polymer composites against real North American car
production volumes; and (4) It looks at how platform sharing changes the competitive position of
polymer composites again steel in BIW applications.
Methods: Process-Based Cost Modeling
Since the late 1980’s, models of the cost of ownership have been used widely in industry to
support investment decisions. Activity-based costing [18] and other process-based cost research
[19] have extended these methods to include the implications of both non-manufacture and
individual process activities. These costing approaches, however, are unable to predict the cost-
implications of technology advances while those advances are still in their early stages of
development. Process-based (or technical) cost modeling was developed to address just such a
Working Paper: Do not cite without author permission.

problem. Process-based cost modeling is a method for analyzing the economics of alternative
manufacturing processes without the prohibitive economic burden of trial and error
investigation [20]. Its application has been extended to analyzing the implications of alternative
design specifications or process operating conditions on production costs within and across
manufacturing processes [21]. In the same way that present-day mathematical models allow
designers and manufacturing engineers to understand the physical consequences of their
technical choices before those choices are put into action, technical cost models harness science
and engineering principles to understand the economic consequences of technology choices prior
to large product development and facility investments[21]. The relationships developed in a
process-based cost model are shown in Figure 1A.
The mathematical framework of the component and assembly cost model are provided in the
Appendix. The calculations in these models for the relationships between part design parameters
and process requirements are presented in the next section.
Figure 1. A) Process-based cost models reveal the economic properties of a materials decision by mapping materials and product characteristics to process and resource requirement and, thereby, manufacturing costs. B) Automotive Composites Consortium (modeled) vehicle assembly sequence for composite unibody designs. Identical assembly sequence was assumed for both carbon-fiber and glass-fiber designs.
Working Paper: Do not cite without author permission.

A Three-Case Comparison
Product Design
This study evaluates the relative competitiveness of three design alternatives – a CFRP
unibody, a GFRP unibody, and a steel unibody. Each design is described below.
Design 1:Carbon Fiber-Reinforced Polymer Composite Unibody
Design and processing information for the composite vehicles is drawn from the Automotive
Composite Consortium’s [22] Focal Project III, whose goal was to characterize the perspectives
of industry experts on the near-term potential of composites technology.6 The specific design
goal of the Focal Project III was to produce a body-in-white with minimum mass, while
maintaining structural integrity and cost-competitiveness at medium to high production volumes
(20,000-250,000 body units per year). The Focal Project III vehicle design is a four door mid-
sized sedan. The sedan has a 108” wheelbase, is 186” long, 71”wide, and 54” high. The design
consists of 25 components and 37 inserts. The components are 60 wt% of two-component
polyurethane7 and 40% carbon fiber reinforcement. The joining inserts are mild steel. All of
the components are designed to be produced using SRIM (structural reaction injection molding).
The preforms for the bodyside inners, outers, and caps, the floor pieces, the firewall, the
seatback, the front and rear wheel arches, the radiator, the front and rear headers, the right and
left lower longitudes and the cowl are created using a robotic spray-up process.8 The preforms
for the front floor, front lower longitude, rear floor, and roof are composed of layered carbon-
fiber fabric to create the preform. The assembly of the 25 components and 37 inserts is achieved
by joining the parts with a two-component adhesive.9 The joining inserts are mild steel.
6 The ACC was formed in August 1988 as a collaborative effort of Ford, GM, and Chrysler (now Daimler-Chrysler). 7 The two-component polyurethane polymer chosen by the ACC and used in this study was Bayer AG’s Baydur 420. 8 The specific spray-up preformming process used is called P4 (programmable powder pre-form process). 9 The adhesive chosen by the ACC and used in this study was SIA’s Plastilock 731SI.
Working Paper: Do not cite without author permission.

Design 2: Glass-Fiber Reinforced Polymer Composite Unibody
In addition to the highly innovative carbon-fiber reinforced design, a second composite option
is examined – a glass-reinforced fiber composite body. Because glass fiber is less stiff, less
strong, and more dense than carbon fiber, glass fiber reinforced parts are typically thicker and
heavier than comparable carbon fiber reinforced parts. The unit price of glass fiber, however, is
five to ten times less than that of carbon fiber.
The glass-reinforced design has the same general layout as the carbon-reinforced ACC vehicle.
For each of the 25 components, height and width are the same as for the carbon-reinforced BIW.
The thickness of the glass-reinforced components, however, is increased. For the carbon-
reinforced and glass-reinforced components to exhibit the same stiffness, their deflection under
the same loading force must be equal. The required thickness (hG) of each glass reinforced
component is calculated by approximating the component as a centrally loaded, fixed beam:
13
ECh hG CEG= Equation 1
Here, EC is the modulus of the carbon-reinforced material, EG is the modulus of the glass-
reinforced material, and hC is the thickness of the carbon-reinforced component . These moduli
are modeled as an average of the resin and the reinforcement moduli weighted by their respective
volume fraction, as follows:
, E V E V E E V E V Ec c r r g g r rC G= + = + Equation 2
where Vc is the volume fraction of carbon fiber, Ec is the modulus of the carbon fiber, Vg is the
volume fraction of the glass fiber, Eg is the modulus of the glass fiber, Vr is the volume fraction
of the resin, and Er is the modulus of the resin. The volume fraction of glass reinforcement is
Working Paper: Do not cite without author permission.
assumed to be equal to that used in the carbon-reinforced components. Here, Vc=Vg = 35.1%, Vr
= 64.9%, Ec = 230 Gpa, Eg= 72.4 Gpa, and Er= 3.5 Gpa.
The increase in thickness of the glass-reinforced parts has consequences throughout the SRIM
process, affecting material quantities, preform spray times, molding cycle times, and line
requirements. The methods by which these differences are accounted for in the process-based
cost model are described in the next section of this paper on process design.
Design 3: Mild-Grade Steel Unibody
The third design, a steel unibody, is based on the typical steel body design currently on the
market. This sedan has a 103” wheelbase, and is 185” long, 67” wide, and 57” high (compared
with the 108” wheelbase, 186” long, 71” wide, and 54” high composite design). The minor
dimensional differences between the steel and composite body designs are, for the purposes of
this study, insignificant. The steel body is made up of 120 components and 130 inserts
(compared with 25 components and 37 inserts for the composite design).
Process Design: Component Production and Assembly
Structural Reaction Injection Molding
The polymer composite fabrication process chosen for this study is structural reaction injection
molding (SRIM). It was chosen because this process minimizes fiber scrap, accommodates part
complexity, and is a relatively rapid process. SRIM is a four-step process: (1) pre-form making,
(2) pre-form trimming, (3) injection molding, and (4) part trimming and inspection.
Preforming
Pre-form making shapes the reinforcement material into the form of the part. This study
models two different performing methods: 1) spraying of fibers and 2) cutting and layering of
Working Paper: Do not cite without author permission.
woven fiber fabric. The type of pre-form method most appropriate for each part was chosen by
design engineers from the ACC team, and then actuated in the model.
The “spray method” creates the perform shape by spraying chopped fibers onto a screen in the
shape of the part along with a powder or string binder. The screen is held in a press. Once the
spraying is completed, the press closes, and the perform is heated to bind the fibers in place for
handling.
As programmed, the model assumes a preform manufacturing line with a two-robot spray
station at lower production volumes, and a six station carousel at higher production volumes. The
cycle time for the spray station is modeled as comprising four stages: press opening (5 seconds),
spraying, pre-form curing (2.5 minutes), and part unloading (30 seconds.) The spray time is a
function of the mass of fiber required for each pre-form and the chopper gun operating rate. The
chopper gun rate is modeled as 1.6 kg of carbon fiber reinforcement per minute and 2.29 kg of
glass reinforcement per minute.
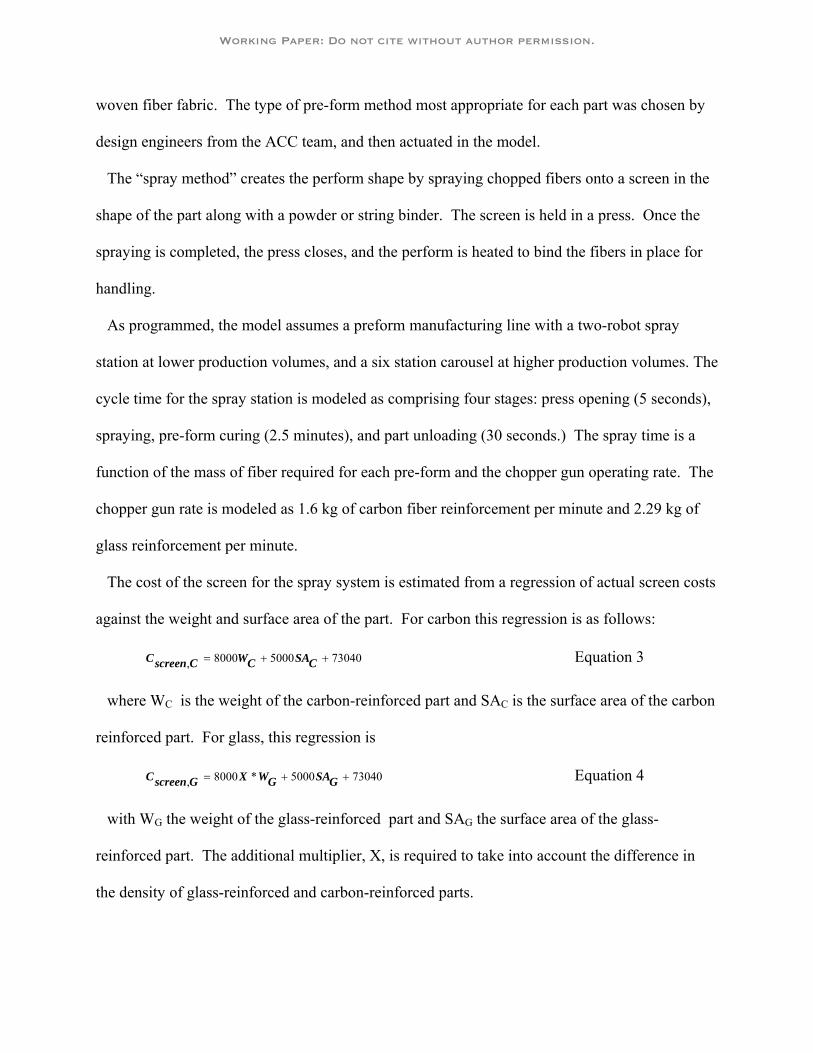
The cost of the screen for the spray system is estimated from a regression of actual screen costs
against the weight and surface area of the part. For carbon this regression is as follows:
8000 5000 73040,C W SAscreen C C C= + + Equation 3
where WC is the weight of the carbon-reinforced part and SAC is the surface area of the carbon
reinforced part. For glass, this regression is
8000 * 5000 73040,C X W SAscreen G G G= + + Equation 4
with WG the weight of the glass-reinforced part and SAG the surface area of the glass-
reinforced part. The additional multiplier, X, is required to take into account the difference in
the density of glass-reinforced and carbon-reinforced parts.
Working Paper: Do not cite without author permission.

13
EC CXEG G
ρ
ρ
−= Equation 5
Component densities are calculated as follows:
, GV V V Vc c r r g g r rCρ ρ ρ ρ ρ ρ= + = + Equation 6
where pC is the density of the carbon-reinforced composite, pc is the density of the carbon
reinforcement, pG is the density of the glass-reinforced composite, pg is the density of the glass
reinforcement, and pr is the density of the resin. The densities of carbon reinforcement (ρc) and
glass reinforcement (ρg ) are as follows ρc = 1.6 g/cc and ρg = 2.55 g/cc [23].
The “lay-up method” employs sheets of reinforcement in the form of dry fabric (note: not a
pre-preg). The fabric is pulled directly from its roll onto the forming machine, where it is cut to
the required pattern. The cut patterns composed of two to five sheets are then stacked directly
onto the SRIM press. The number of fabric layers used depends on both the thickness and on the
number of fiber orientations required to achieve the desired mechanical properties for the part.
To improve the formability of the stack of fabric, blocks in the reciprocal shape of the part,
called conformers, are used to press the fabric into position. A vacuum is pulled to form the
sheets into the shape of the mold. This entire process takes 2 ½ minutes to complete. Three-
dimensional shaping of the pre-form occurs when the press closes during injection molding. The
capital equipment and material cost assumptions for the two performing methods are shown in
Table 1 in Appendix 2.
Pre-form Trimming
During pre-form trimming, the edges of the shape are refined, removing any unwanted
material. This “trimming” is estimated to remove 4% of the fiber originally sprayed and binded
into form, and to require 90 seconds per part.
Working Paper: Do not cite without author permission.

Reaction Injection Molding
The SRIM step, as modeled in this study, consists of five stages: a 30 second load, a 20 second
partial closing of the mold and injection of the resin, a 150 second completion of the closing of
the mold and cure of the resin, a 30 second opening of the mold and unloading of the part, and a
10 second clean and prep before the loading of the next part. To reflect current practice in
industry, injection time, closing time, and mold closed time are held constant, regardless of part
dimensions, and the number of injection sites and dispensers are modified to accommodate the
geometry of different parts. For the purposes of this study, the number of dispensers required for
successful resin distribution was estimated by the ACC engineering team.10 The model assumes
that a typical two component polyurethane thermoset resin is employed in the molding of
structural automotive components. The cure time is modeled as 2.5 minutes or 4 minutes
depending whether a powder or string binder, respectively, is needed. The cycle time breakdown
described above is used for both the carbon- and the glass-reinforced parts in the model.
The model treats the cost of the injection molding press (CPress) as a function of the maximum
part length (Lmax), maximum part width (Wmax), and the maximum force required of the press
(Fmax). This press cost estimation was developed in a Ph.D. thesis by Paul Kang, and is
independent of the component material[24]. Kang’s regression is as follows:
49, 400 590.0 94, 000max max maxPressC F L W= + + Equation 7
The maximum required mold force (Fmax) is calculated as follows:
10 Although not used in this analysis, the equation for fill time developed by Kang, provides a good approximation of the number of
dispensers chosen by the ACC engineering team for each part. By setting the fill time (Tfill) constant instead of the number of injection ports (Pinjection), Kang’s equation to calculate fill time could be used in future studies to instead estimate the necessary number of injection ports.
2 2
2 max maxln2 2
initial
injection initial
fill initial
R R RP R
KT R
φμ −= −
⎛ ⎛ ⎞ ⎞⎜ ⎜ ⎟ ⎟⎝ ⎝ ⎠ ⎠
. In this equation, K is the permeability of the preform, andφ is the porosity of the preform.
Kang, P. (1998). A Technical and Economic Analysis of Structural Composite Use in Automotive Body-in-White Applications. Materials Science and Engineering and Technology and Policy. Cambridge, MA, M.I.T.
Working Paper: Do not cite without author permission.
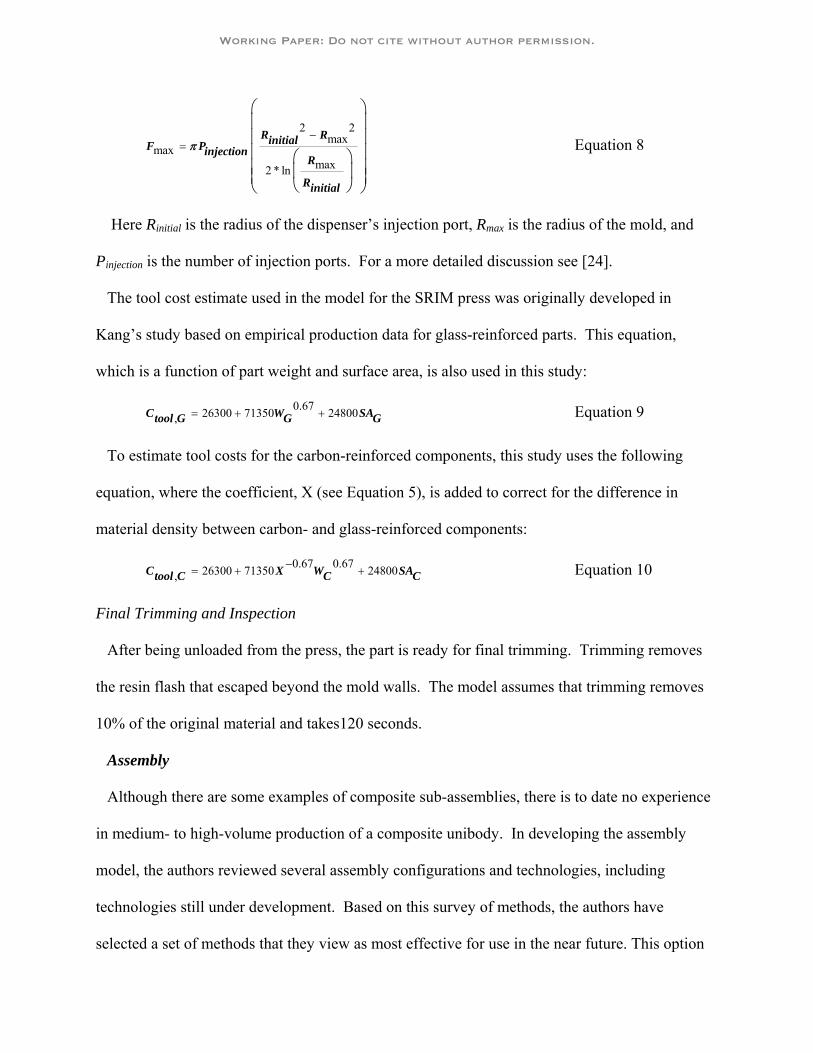
2 2max
maxmax2 * ln
R RinitialF PinjectionR
Rinitial
π−
=
⎛ ⎞⎜ ⎟⎜ ⎟⎜ ⎟⎛ ⎞⎜ ⎟⎜ ⎟⎜ ⎟⎝ ⎠⎝ ⎠
Equation 8
Here Rinitial is the radius of the dispenser’s injection port, Rmax is the radius of the mold, and
Pinjection is the number of injection ports. For a more detailed discussion see [24].
The tool cost estimate used in the model for the SRIM press was originally developed in
Kang’s study based on empirical production data for glass-reinforced parts. This equation,
which is a function of part weight and surface area, is also used in this study:
0.6726300 71350 24800,C W SAtool G G G= + + Equation 9
To estimate tool costs for the carbon-reinforced components, this study uses the following
equation, where the coefficient, X (see Equation 5), is added to correct for the difference in
material density between carbon- and glass-reinforced components:
0.67 0.6726300 71350 24800,C X W SAtool C C C−= + + Equation 10
Final Trimming and Inspection
After being unloaded from the press, the part is ready for final trimming. Trimming removes
the resin flash that escaped beyond the mold walls. The model assumes that trimming removes
10% of the original material and takes120 seconds.
Assembly
Although there are some examples of composite sub-assemblies, there is to date no experience
in medium- to high-volume production of a composite unibody. In developing the assembly
model, the authors reviewed several assembly configurations and technologies, including
technologies still under development. Based on this survey of methods, the authors have
selected a set of methods that they view as most effective for use in the near future. This option
Working Paper: Do not cite without author permission.

is described below. The interested reader should refer to [25] for a more detailed discussion of
eliminated options.
The bonding step in assembly entails positioning the first part or already-joined sub-assembly,
laying down adhesive, and then positioning subsequent parts or sub-assemblies on top of the
adhesive (along the join). Bonding requires pumps, a metering system, adhesive guns, a heated
hose, and switch-over pumps to dispense the adhesive. The carbon and glass composite bodies
are modeled as being assembled using a heat-cure epoxy. There are several advantages to a heat-
cure epoxy. Although heat curing requires additional equipment and time, the resulting bond has
superior properties to the bond created by a room temperature epoxy. A heat cure epoxy also has
the advantage of an infinite open time – the length of time between dispensing the adhesive and
its curing. This infinite open time increases the number of parts that can be joined at a given
station, and eliminates adhesive waste due to premature curing. This study assumes no primer
and no pre-heating is necessary on the joining surfaces of the parts. Cure times within the model
range between two and three minutes, depending on the length of the join.11 The price of the
adhesive used in this study is $17.50/kg.
The researchers surveyed seven different cure methods: hot blocks, hot air impingement, RS
induction cure, radio frequency cure, microwave frequency cure, and oven curing. Based on the
recommendations of industry experts, this study uses hot air impingement. Heaters are generally
placed every 50” along the join, with each heater costing between $8K and $12K. The system as
a whole also requires a thermocouple sensor, as well as a control panel for the thermocoupler.
In addition to bonding and curing equipment, fiber reinforced polymer composite assembly
also requires fixtures. The fixture costs used in this analysis are shown in Table 2 in Appendix 2
along with the curing systems for different sized sub-assemblies.
11 The cure time for a heat cured epoxy can range between one and seven minutes depending on the magnitude of heat used for cure.
Working Paper: Do not cite without author permission.

The assembly order is shown in Figure 1B. The layout of the assembly line is dependent on this
order, as well as the number of parts, the type and intensity of joining, and the production rate.
Higher production rates lead to more stations, more robots, and more automation, while smaller
production runs assume fewer stations, more time at each station, and more manual labor.
Results
This section presents the model results for the three body-in-white (BIW) designs: a carbon
fiber reinforced polyurethane composite (carbon), a glass fiber reinforced polyurethane
composite (glass), and a mild-grade steel unibody (steel).
Baseline Results
Figure 2A shows the estimated unit cost of producing and assembling each of the three
alternative BIW cases in the U.S. At annual production volumes under 105,000, the model
results suggest that the glass-reinforced BIW is less costly than the steel, and at annual
production volumes under 45,000, the carbon-reinforced BIW is also less costly than the steel.
The steel option is the least costly alternative when modeling high production volumes,
because of sheet steel’s low material costs and exceptionally fast cycle times. The steel design
becomes less cost-competitive than composites at lower production volumes because of the
carrying costs of expensive, under-utilized steel stamping equipment and tooling. As shown in
Figure 2D, at annual production volumes (APV) of 100,000 units per year, machine, equipment,
building, maintenance, and overhead – all fixed expenses – make up 59% of steel BIW costs.
These fixed expenses account for only 24% of carbon, and 40% of glass BIW cost estimates.
Figures 2B and 2C isolate component production and assembly costs. Figure 2B shows that,
although the composite BIW has far fewer total components than steel, the sum of the modeled
composite component and insert costs is significantly larger than the sum of the steel component
Working Paper: Do not cite without author permission.
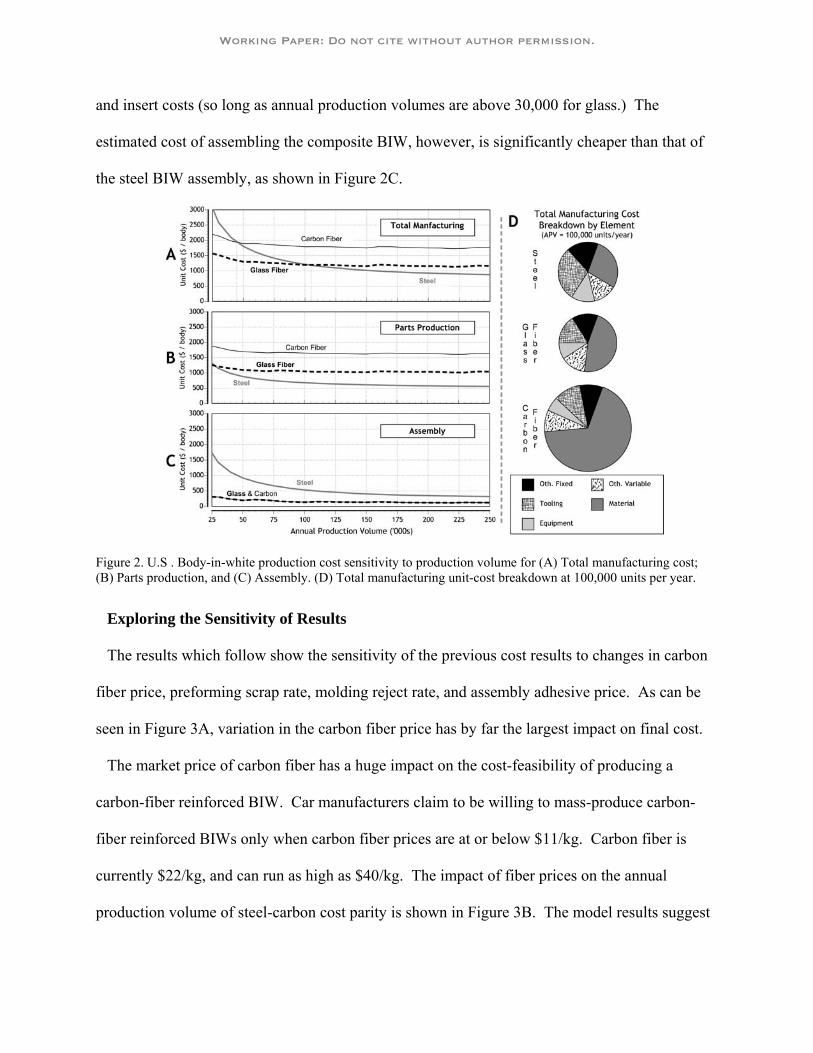
and insert costs (so long as annual production volumes are above 30,000 for glass.) The
estimated cost of assembling the composite BIW, however, is significantly cheaper than that of
the steel BIW assembly, as shown in Figure 2C.
Figure 2. U.S . Body-in-white production cost sensitivity to production volume for (A) Total manufacturing cost; (B) Parts production, and (C) Assembly. (D) Total manufacturing unit-cost breakdown at 100,000 units per year.
Exploring the Sensitivity of Results
The results which follow show the sensitivity of the previous cost results to changes in carbon
fiber price, preforming scrap rate, molding reject rate, and assembly adhesive price. As can be
seen in Figure 3A, variation in the carbon fiber price has by far the largest impact on final cost.
The market price of carbon fiber has a huge impact on the cost-feasibility of producing a
carbon-fiber reinforced BIW. Car manufacturers claim to be willing to mass-produce carbon-
fiber reinforced BIWs only when carbon fiber prices are at or below $11/kg. Carbon fiber is
currently $22/kg, and can run as high as $40/kg. The impact of fiber prices on the annual
production volume of steel-carbon cost parity is shown in Figure 3B. The model results suggest
Working Paper: Do not cite without author permission.
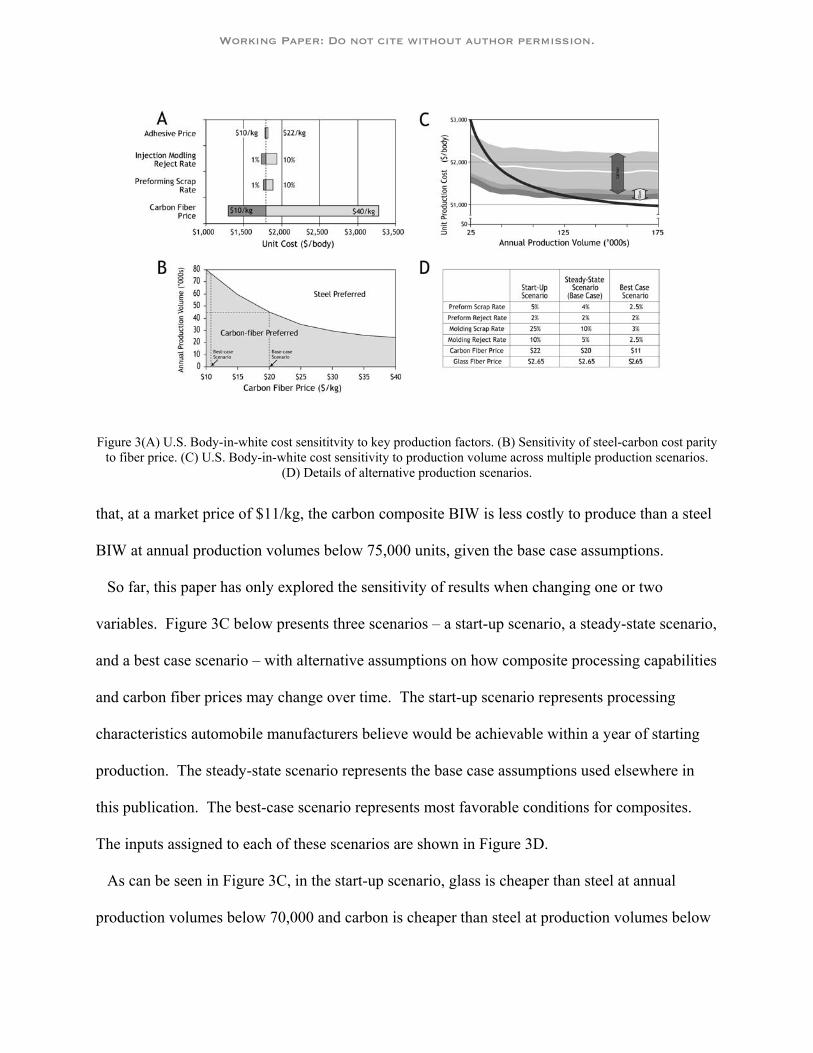
Figure 3(A) U.S. Body-in-white cost sensititvity to key production factors. (B) Sensitivity of steel-carbon cost parity to fiber price. (C) U.S. Body-in-white cost sensitivity to production volume across multiple production scenarios.
(D) Details of alternative production scenarios.
that, at a market price of $11/kg, the carbon composite BIW is less costly to produce than a steel
BIW at annual production volumes below 75,000 units, given the base case assumptions.
So far, this paper has only explored the sensitivity of results when changing one or two
variables. Figure 3C below presents three scenarios – a start-up scenario, a steady-state scenario,
and a best case scenario – with alternative assumptions on how composite processing capabilities
and carbon fiber prices may change over time. The start-up scenario represents processing
characteristics automobile manufacturers believe would be achievable within a year of starting
production. The steady-state scenario represents the base case assumptions used elsewhere in
this publication. The best-case scenario represents most favorable conditions for composites.
The inputs assigned to each of these scenarios are shown in Figure 3D.
As can be seen in Figure 3C, in the start-up scenario, glass is cheaper than steel at annual
production volumes below 70,000 and carbon is cheaper than steel at production volumes below
Working Paper: Do not cite without author permission.

30,000 units. In the best-case scenario, glass is cheaper than steel at production volumes below
120,000 and carbon is cheaper than steel at production volumes below 90,000 units annually.
Discussion
According to the results shown, composite technologies hold not only the potential to reduce
vehicle mass, but also to do so in a cost effective manner. This economic advantage, however, is
strongly dependent on production volume. Typical volumes on the U.S. market vary greatly.
Figure 4A presents the distribution of 2005 production volumes for car models produced in the
U.S. and Canada [6]. Figure 4A shows that 68% of car models in the US and Canada in 2005 –
29% of all cars produced in 2005 – were produced in volumes under 105,000, the base case
cross-over point between glass and steel. Forty-five percent of 2005 car models –10% of all cars
produced – had annual production volumes under 45,000, the carbon cross-over point.
In many vehicle models, BIW components are shared across model platforms. Conventional
wisdom in the auto world suggests that such platform sharing minimizes the competitiveness of
composites. The production volumes of the car platforms produced in the U.S. and Canada, as
reported in Automotive News’ 2006 Market Data Book [6], can be seen below in Figure 4B.
Even accounting for this sharing, composites maintain economic advantage over a large range of
platforms. Specifically, 41% of car platforms produced and 8% of all cars produced in 2005 had
platforms with 2005 production volumes under the estimated glass-steel cost parity. Similarly,
24% of car platforms and 2% of all cars produced in 2005 had platforms with annual production
volumes under 45,000 (the carbon-steel cost parity.) Finally, only around 50% (by mass) of a
given vehicle’s body is typically shared across a platform[26].
The results presented in this section are for a BIW constructed entirely of a single material.
Although there are manufacturing and performance advantages to such a solution, the economics
Working Paper: Do not cite without author permission.

Figure 4. (A) Car models produced in U.S. and Canada with annual production volumes below composite-steel cost parity[27]. (B) Car platforms produced in the U.S. and Canada with annual volumes below compoiste-steel cost
parity. [6] (C) Synthesis of all-composite and hybrid material opportunties within the North American fleet.
may favor a body using a hybrid set of materials. A more complete analysis will require
exploring the economic competitiveness of composites at the subassembly level. Several
insights, however, can be drawn from the present results. As shown in Figure 4C, this study’s
analysis estimates that glass reinforced composite components are only cheaper than steel
components at annual production volumes below 30,000 units. At annual production volumes of
30,000 or less substitutions of glass-reinforced composites for steel components in a body-in-
white are likely to reduce costs. At higher production volumes, composites are only likely to
gain cost-advantage at the sub-assembly level. This advantage does not exist within all sub-
Working Paper: Do not cite without author permission.

assemblies. An initial schematic of how to think about composite competitiveness is provided in
Figure 4C. Based on 2005 vehicle production in the U.S. and Canada, 68% of current car
models (29% of all cars) could be strong candidates for composite-steel hybrid body-in-whites,
and 32% of car models (5% of all cars) could be strong candidates for entirely composite bodies-
in-white. Industry trends toward build-to-order and customization may mean a further increase
in the economic competitiveness of composite components over time.
In addition to hybrid body analyses, two other scenarios would be of interest for future work.
The first is the competitiveness of the composites against other light-weighting body materials,
in particular, aluminum and high-strength steel. The second would be the cost-feasibility of
composites in a setting with greenfield investment opportunities, such as a developing country.
Conclusions
Automobiles today are over 63% iron and steel by weight [27]. Fiber-reinforced polymer
composite technologies offer a way of light-weighting the vehicle, both to increase fuel economy
and to allow for the addition of other vehicle systems (and, thus, features). Several advances
have occurred in the past decade in fiber-reinforced polymer composite body-in-white design,
component processing, and assembly technology. This study uses process-based cost modeling,
which allows the user to evaluate technology alternatives before investments are made, to gain
insights into the manufacturing cost-feasibility of fiber-reinforced composite technology. The
results show that the potential for fiber-reinforced composite bodies-in-white to be competitive
against steel is greater than it has been in the past. Moreover, platforming only reduces, but does
not eliminate, the potential cost competitiveness of composites. Considering platforming, the
model results suggest that approximately 41% of car models and 8% of the cars produced in the
U.S. and Canada in 2005 might have been cheaper if produced with a glass-fiber reinforced
Working Paper: Do not cite without author permission.
composite rather with than a steel unibody. In the end, any such materials substitution would
need to be evaluated individually and against other light-weight materials options. These
modeling results indicate that the polymer-composite industry’s developments in process and
design have kept composites technology a credible alternative for vehicle body applications.
References
1. National Research Council (NRC), Effectiveness and Impact of Corporate Average Fuel Economy
(CAFE) Standards. Washington, D.C.: National Academies Press, 2002.
2. National Highway Traffic Safety Administration (NHTSA), Average Fuel Economy Standards for
Light Trucks: Model Years 2008-2011, 49 Code of Federal Regulations, Pts. 523, 533, and 537.2006
ed.
3. Toyota on a roll. Nature 2005; 435(7045): 1004.
4. Fuyuno, I. Toyota's production line leads from lab to road. Nature 2005; 435(7045): 1026-1027.
5. McAlinden, SP, Hill, K, and Swiecki, B, Economic Contribution of the Automotive Industry to the
U.S. Economy -- An Update. A Study Prepared for the Alliance of Automotive Manufacturers, ed.
Economic and Business Group. Ann Arbor, MI: Center for Automotive Research, 2003.
6. North American Car Production by Platform, in Automotive News 2006 Market Data Book. Detroit,
MI: Crain Communications, 2006.
7. American Iron and Steel Institute (AISI), AISI Chairman Challenges PNGV to Develop Lighweight,
Steel-Bodied Midsize Car., in American Iron and Steel Institute Press Release. Detroit, Michigan
1998.
8. Swift, TK, Changing Customer Dynamics: Chemistry and Light Vehicles. Arlington, VA: American
Chemistry Council, 2006.
9. Ward's Automotive Group, Ward's 2006 Automotive Yearbook. Sixty-Eigth ed, ed. A.K. Binder.
Southfield, MI: Ward's Automotive Group, 2006.
Working Paper: Do not cite without author permission.

10. Mascarin, AE, et al., Costing the Ultralite in Volume Production: Can Advanced Composite Bodies-
in-White Be Affordable? Snowmass, CO: Rocky Mountain Institute, 1995.
11. Eusebi, E. Composite Intensive Vehicles: Past Present and Future. in Structural Materials
Challenges for the Next Generation Vehicle. Washington, D.C.: U.S. Dept of Commerce, 1995.
12. Flynn, MS and Belzowski, BM, Barriers to Adopting Structural Composites at the Traditional U.S.
Automotive Manufacturers, in The Office for the Study of Automotive Transportation. Ann Arbor,
MI: University of Michigan Transportation Research Institute, 1994.
13. Coates, D. GM's Ultralight Concept Car. IND DESIGN 1992; October: 78-81.
14. Gjostein, NA. PNGV Material R&D Roadmap. in Structural Material Chalenges for the Next
Generation Vehicle. Washington, D.C.: U.S. Department of Commerce, 1995.
15. Prescot, R. The Future of the Carbon-Fiber Industry: Specialty or Commodity? in Proceedings of the
40th International SAMPE Symposium, 1995.
16. OTA, Case Study: Polymer Matrix Composites in Automobiles. Advanced Materials by Design,
U.S.G.P. Office, Editor. Washington, D.C.: U.S. Congress: Office of Technology Assessment, 1988.
17. Brylawski, M, Uncommon Knowledge: Automotive Platofrm Sharing's Potential Impact on Advanced
Technologies, RMI Publication # T99-10, Editor. Snowmass, CO: Rocky Mountain Institute, 1999.
18. Kaplan, R and Bruns, W, Accounting and Management: A Field Study Perspective. Cambridge, MA:
Harvard Business School Press, 1987.
19. Bloch, C and Ranganathan, R. Process-Based Cost Modeling. IEEE T COMPON PACK T 1992;
15(3): 288-294.
20. Busch, JV and F.R., F, Technical Cost Modeling, in The Blow Molding Handbook, D. Rosato and D.
Rosato, Editors. New York: Hansr Publishers, 1988.
21. Kirchain, R and Field, F. Process-Based Cost Modeling: Understanding the Economics of Technical
Decisions. Encyclopedia of Materials Science and Engineering 2000.
22. ACC. Automotive Composites Consortium. 1996-2002 [cited; Available from:
www.uscar.org/consortia&teams/consortiahomepages/con-acc.htm.
Working Paper: Do not cite without author permission.
23. Chawla, KK, Composite Materials: Science and Engineering. Materials Research and Engineering,
ed. B. Ilschner and N.J. Grant. New York: Springer-Verlag, 1987.
24. Kang, P. A Technical and Economic Analysis of Structural Composite Use in Automotive Body-in-
White Applications. Masters of Science Thesis, Materials Science and Engineering and Technology
and Policy, M.I.T., 1998.
25. Fuchs, E. The Significance of Production Cost Inputs in Regional Technology Choice: Composite
Automotive Body-In-Whites in the U.S. versus China. SM Thesis, Engineering Systems Division:
Technology and Policy, M.I.T., 2003.
26. General Motors, Interview with Randolph Urbance, E. Fuchs, Editor. Cambridge, MA: M.I.T. 2003.
p. Discussion on the percent of BIW components included in each platform for North American Car
production at General Motors.
27. Ward's Motor Vehicle Fact's and Figures 2006, ed. J.W. Bush, J. Sousanis, and P. Zajaz. Southfield,
MI: Ward's Automotive Group, 2006.
Working Paper: Do not cite without author permission.