Embed Size (px)
Citation preview

March, 2019
Strategic Key Performance Indicators

Club Benchmarking Background• Founder was a private club Board member for 10 years and President for 3
• Studying and providing Data Analytics and Financial Analysis to the private club industry since 2009
• Nationally Recognized Experts in Club Finance and Business Intelligence
• Gather data from +/- 1,000 clubs in 49 of 50 states, ranging in revenue from $300,000 to $115 Million. 20% of the database is Gated Community Clubs.
• Based in Boston, MA – 18 peopleo Annual Finance & Operations, Compensation & Benefits, Policies & Procedures Benchmarkso Strategic Monthly Dashboardo Integrating Real Estate and Demographic data into databaseo Leaders in Capital Reserve Studies for the industryo Capital Strategies Modeling platformo Motivation, Attachment & Loyalty Benchmarko Employee Engagement Benchmarko Continuous study of what drives Financial Sustainability and Success in private clubs

Our Mission and Vision• Member-Owned Clubs form a $30 billion industry with the largest at $115 million in revenue
• Fragmented, cottage industry – best practices disseminate slowly, if at all
• Approx. 3,000 Clubs with 11 governors on average…33,000 people “governing”
• Significant issue is misguided Governance due to lack of Context feeding widely held misperceptions:
§ Many Boards are tactical and myopic – ambiguity as to what Governing is/isn’t§ F&B should make money and drives club finances§ The Omnipresent “Debate” -- Choice vs. Efficiency§ Misplaced focus on Income Statement vs. Balance Sheet
• Club Benchmarking advocates Fact-Based Governance as a process that can be continuously improved through Data-Driven Insight and Educationo Success requires clear Vision and Constantly Forward Momentumo Broad alignment across club membership on Vision and Core Valueso Board Focuses on Strategic Choices - Staff Manageso Success requires Change – Adapt or Die

• Began gathering data in 2010 +/- 1,000 clubs every year (49/50 states and Canada)
• All data mapped “apples-to-apples” – from the Trial Balance
• Discover patterns thriving/dying clubs à led to Strategic Insight and common Key Performance Indicators (KPIs) that matter to every club
• Presentations at over 350 clubs – complementing data and analysis with experience
• The Four Most Important Lessons learned:o Context and Key Success Factorso The Key Financial Drivero The Common Key Performance Indicators o The Importance of Capital Resources, Needs and Planning
Ten Years of Learning

ContextBoomers 53 – 71Gen X 37 – 52Millennials 19 - 36
• Gen X 28% smaller than Boomers – they are at club joining age (37 to 52)
• Gen X replacing Baby Boomers who are moving and dying
• Mass Golf Association Handicaps in 2004 = 100,000 in 2017 = 87,000
• The most STRATEGIC issue in clubs is…where are the new members coming from? Is it discussed enough?

• Current financial position results from past choices
• Member Experience is built on the club’s Staff, Assets and Programming
• Are we relevant for Generation X? Do we understand our Value Proposition?
• Have we re-invested in the club? Are we growing the club?
• Is the Staff Engaged?
• Are the Members Emotionally Attached, Loyal and do they support the club financially?
CULTURECustomersPrice/Cost
OwnersGrowth of Equity
Staff Engagement
Programming –
Delivering Services & Amenities to Members
Income Statement
Financial Position & Sustainability
Physical Plant
Capital Needs & Resources
Balance Sheet
Member Experience(Motivation, Attachment, Loyalty, Value & Satisfaction)
GOVERNANCE
Valu
e Pr
opos
ition
Context

• Are the Key Success Factors (KSFs) the same in every industry?o Is every industry driven by price? New Cars vs. Internet Searcho Is every industry driven by process? Hospitals vs. Art Gallerieso Is every industry driven by efficiency? Commodities vs. Jewelry
Retailing
• Key Success Factors vary across industries
High End Fashion
PradaGucciCartier
BrandImageStyle
Leading Technology
AppleGoogle
The Next Great IdeaTechnology
Value Proposition
Railroads
Union PacificBNSF
Norfolk Southern
Material Handling/TrackingCost Management
Economies of Scale
Context

Revenue 100%
Cost of Revenue 30%
Gross Margin 70%
Fixed Expenses 45%
Operating Profit 25%
70%
The Industrial Spectrum – Gross Margin
15% Revenue 100%
Cost of Revenue 85%
Gross Margin 15%
Fixed Expenses 10%
Operating Profit 5%
Managing Costs& Efficiency
Rule
Value Proposition& Strategic Choices
Rule
Clubs à 60% Gross Margin, More Like Google than Nail Manufacturers
15
Context
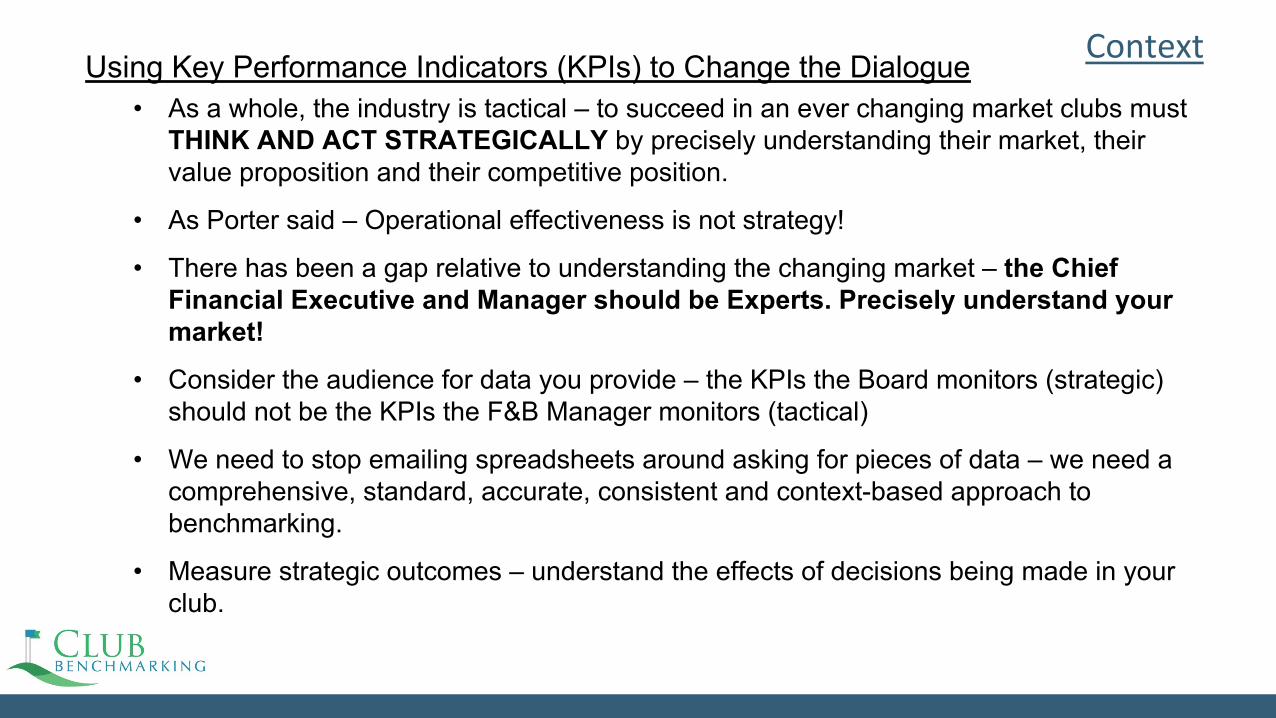
Using Key Performance Indicators (KPIs) to Change the Dialogue• As a whole, the industry is tactical – to succeed in an ever changing market clubs must
THINK AND ACT STRATEGICALLY by precisely understanding their market, their value proposition and their competitive position.
• As Porter said – Operational effectiveness is not strategy!
• There has been a gap relative to understanding the changing market – the Chief Financial Executive and Manager should be Experts. Precisely understand your market!
• Consider the audience for data you provide – the KPIs the Board monitors (strategic) should not be the KPIs the F&B Manager monitors (tactical)
• We need to stop emailing spreadsheets around asking for pieces of data – we need a comprehensive, standard, accurate, consistent and context-based approach to benchmarking.
• Measure strategic outcomes – understand the effects of decisions being made in your club.
Context

Considering Appropriate KPIs for Clubs
The KPIs That Are Common to EVERY CLUB

Operational Effectiveness is not Strategy (Porter)• Organizations must be flexible and respond rapidly to competitive and market
changes
• Organizations must benchmark continuously to achieve Best Practices
• Organizations must nurture a few core competencies to stay ahead of rivals
Background

Background
What is a Key Performance Indicator (KPIs)?• KPIs measure the success/performance of an organization or a
particular activity in which the organization engages – Wikipedia
• By setting KPIs the organization enables the team to make smart business decisions about the direction of all current projects – Oxford Dictionary
• There are different KPIs for different stakeholders – the Board of an organization is responsible for more mission critical and strategic KPIs than a department manager

Background
Key Performance Indicator
Strategic Objectives and Goals
Mission, Vision and
Core Values
Fostering a Strategic Club• Goals, Objectives and Activities must be linked with the
organization’s Strategy
• Clubs (and club Boards) tend to be tactically/ operationally oriented rather than strategically oriented
• Club Benchmarking’s analysis has led to Mission Critical KPIs common to every club and provide Strategic Market Context to make better Strategic Decisions
• KPIs monitoring mission critical performance are Strategic KPIs
• KPIs monitoring Activity are mostly tactical – still important but not Board level

Considering KPIs in Private Clubs
A Review of Data Supplied to Boards• Clubs tend to have “inward-looking”, activity and financial data
o Cover Counts, Rounds of Golf, Tennis Plays, Financial metrics focused on Actual vs. Budget for prior month and focused on the operating ledger
o Membership metrics – members entering and exiting
o There is a lack of market-based trends like Cost of Belonging, Initiation Fee – typically gathered via ad hoc emails between Managers (which then lack context)
• The data supplied likely invites an operational and tactical focus
• The existence of Mission-Critical, Strategic information will foster a strategic perspective and a focus on strategic issues

1. Operating Revenue2. Gross Profit/Gross Margin3. Sources of Gross Profit4. Dues to Operating Revenue Ratio5. Fixed Expenses to Revenue Ratio6. Proportionate Fixed Expense by
Department7. Operating Result and Margin8. Payroll to Revenue Ratio9. F&B Profit/Loss as % of Dues Revenue10. Full Member Dues11. Full Member Equivalents
Income StatementOperating Ledger
1. Net Worth Over Time2. Equity to Assets and Liabilities to Assets
Ratio3. Net Property, Plant & Equipment4. Net PPE to Gross PPE Ratio5. Total Capital Income6. Net Available Capital7. Net Available Capital to Revenue Ratio8. Debt to Revenue Ratio9. Debt to Equity Ratio10. Capital Reserves to Fully Funded Ratio
Balance SheetCapital Ledger
The Common Financial KPIs – These Matter to ALL CLUBSAnnual
33

1. Total Member Count2. Total Members Entering3. Total Members Exiting4. Members on Wait List5. Members on Exit (Sell) List6. Total Cost of Belonging
a. Operating Dues, Capital Dues, Debt Service, F&B Minimum, Level Service Fee, Trail Fee, Locker Bag Handicap Driving Range, Capital Assessment
7. Initiation Fee
Membership
1. Dues Revenue2. Non-Dues Revenue3. Initiation Fee Income4. All Other Capital Income5. Capital Investment6. Total Debt
Finance
The Common Mission Critical KPIs – These Matter to ALL CLUBSMonthly
34

Considering KPIs in Private Clubs
Other KPIs• Naturally, clubs will track Operational KPIs – interestingly operating
KPIs may not be common to every club, for instance…o Rounds of Golf only matter to clubs with golfo Room rates, occupancy, etc. only matter to clubs with roomso Some clubs have fitness/some don’t – some have tennis/some
don’t, etc.
• An Important Themeo The KPIs that matter to EVERY CLUB – independent of type
(city, country, yacht, etc.), of geographic location, of quality (high-end, pedestrian), size (large or small) – ARE THE STRATEGIC KPIs
o The KPIs that are Operational are likely to vary from one club to the next

The Annual KPIs

The Key Financial Driver
• First – we must understand the meaning of this data – IT IS CRITICAL
• Clubs set Operating Budget to break-even excluding Depreciation - It is not a financial driver
• The Operating Ledger is the vehicle for delivering Services & Amenities to members, it is consumed every year by Members enjoying the club
• The financial driver over time is Capital Income and Investment

1. Operating Revenue2. Gross Profit/Gross Margin3. Sources of Gross Profit4. Dues to Operating Revenue Ratio5. Fixed Expenses to Revenue Ratio6. Proportionate Fixed Expense by
Department7. Operating Result and Margin8. Payroll to Revenue Ratio9. F&B Profit/Loss as % of Dues Revenue10. Full Member Dues11. Full Member Equivalents
Income StatementOperating Ledger
1. Net Worth Over Time2. Equity to Assets and Liabilities to Assets
Ratio3. Net Property, Plant & Equipment4. Net PPE to Gross PPE Ratio5. Total Capital Income6. Net Available Capital7. Net Available Capital to Revenue Ratio8. Debt to Revenue Ratio9. Debt to Equity Ratio10. Capital Reserves to Fully Funded Ratio
Balance SheetCapital Ledger
The Common Financial KPIs – These Matter to ALL CLUBSAnnual
33

The Annual KPIsConsidering the Annual KPIs
• Defining an Annual KPIo These measures must be precisely quantified each and every year o While some metrics vary monthly – the outcomes really occur one year at a time
§ E.G. Operating Revenue may vary in-season to off-season but the variation isn’t meaningful – but year over year changes are critical (Operating Revenue should always grow year-to-year)
§ E.G. Dues to Revenue Ratio will vary month to month (seasonality) but the meaningful variation is year to year
o The meaning of each Annual KPI should be clear to staff and Board/Committees –because they are all important
• Of course a club can track the month-to-month changes of Annual KPIs if it so desires
• Embrace and Emphasize the difference between Operating KPIs and Capital/Balance Sheet KPIs – this helps foster a strategic view

Reviewing “The Most Important” Annual KPIs

30% 70%
Net PropertyPlant & Equipment
80%
Debt-to-Equity Ratio 20%
All Clubs
What WeHave
From Others(Banks)
From Members
Assets = Equity(Unrestricted Net Assets)
Liabilities +
Cash-to-Assets Ratio 9%
Reviewing the Important Annual KPIs - Capital
• Equity to Assets Ratio –how much have the
Member’s contributed over time?
• Liabilities to Assets Ratio
• Debt to Equity Ratio• Understanding the flow of
Capital – from Member’s Equity into Property, Plant & Equipment

Over Time the Financial Driver is the Capital Ledger
Net Available Capital
(EBTDA)
Less Than Depreciation
• Unrestricted Net Assets = Net Worth or Book Value of the Club
• Club operating ledgers are typically set to break-even. In that scenario, Net Available
Capital (EBDTA) must be greater than depreciation in order for net worth to increase
Net W
orthN
et W
orth
Net Available Capital
(EBTDA)
Greater Than Depreciation
Net Worth growth requires incoming members
AND existing members to contribute to capital

-200
-100
0
100
200
300
400
500
600
700
800
20042005
20062007
20082009
20102011
20122013
20142015
20162017
2018
Net Worth Over Time
CAGR25th Percentile = -1%
Industry Median = 2%75th Percentile = 5%
30% of clubs have net worth shrinking in absolute terms
50% of clubs have net worth growing less than inflation
38% of clubs meet our recommended minimum net worth growth of 3.5% per year
The Amelia Island Club ----------
Carmel CC
Significant capital income is required to increase net worth
Over Time the Financial Driver is Capital and Growing Net Worth

$-
$5,000,000
$10,000,000
$15,000,000
$20,000,000
$25,000,000
$30,000,000
$35,000,000
2004
2005
2006
2007
2008
2009
2010
2011
2012
2013
2014
2015
2016
Carmel CC - Net Worth
• Carmel has invested heavily over the last ten years.
• Their Net Worth (Member’s Equity) has increased at a Compounded Annual Growth Rate of 8.7% - very close to the top of the industry
• Their Initiation Fee has increased consistently over that period.
CAGR 8.7%
CAGR -15.3%
5,169,865
4,828,564
4,650,291 4,375,547
3,914,570 3,520,867
2,857,540 2,358,599
1,901,709
1,323,235 1,035,437
830,614
-
1,000,000
2,000,000
3,000,000
4,000,000
5,000,000
6,000,000
20062007
20082009
20102011
20122013
20142015
20162017
XYZ Country Club Net Worth
The most important financial measure over time
Over Time the Financial Driver is Capital and Growing Net Worth

• Net Available Capital > Depreciation = Net Worth Growing
• Net Available Capital < Depreciation = Net Worth Declining
• Net Worth MUST GROW at least 3.5% per year.
35% of clubs are generating capital to meet replacement costs (which are greater than Depreciation) but not enough to expand asset base). Net Worth Flat
30% of clubs ARE generating Capital to meet Replacement Costs and likely – some have enough to INVEST in EXPANDING THE ASSET BASE NET WORTH INCREASING
35% of clubs are literally consuming themselves -Net Worth Declining
Group AGroup B
Group C
Reviewing the Important Annual KPIs - Capital

Club Built Yesterday
Total Cost to Build = $3 MillionZero Reinvestment Over Time
Gross PPE = $3M (ex. Land)Accumulated Depreciation = $3MNet PPE = $0Net-to-Gross-PPE Ratio = 0%
Condition: Worn and Depleted
Total Cost to Build = $30 Million
Gross PPE = $30M (ex. Land)Accumulated Depreciation = $0Net PPE = $30MNet to Gross PPE Ratio = 100%
Condition: Brand New
Club Built 50 Years Ago
Property, Plant& Equipment
Net toGross PPE
Ratio
The Strength of Capital Manifests on the Balance Sheet

Net to Gross PPE Ratio
• Net PP&E is tied to Member’s Equity (Net Worth). Quick, accurate test of physical plant condition.
• Ratio > median = Assets fresher & more up to date. Below median assets are older, more worn & less relevant.
• A precise assessment of your club’s physical plant requires a Capital Reserve Study which should be conducted by an objective 3rd party professional well-versed in clubs
0%
10%
20%
30%
40%
50%
60%
70%
80%
90%
100%
Net PPE to Gross PPE RatioMedian = 46%
33%Club XYZ
This club that hasn’t invested, hasn’t remained “relevant” and is not generating Capital Income.
This club’s culture is intensely focused on Operating Results/Costs and F&B Profit. Not the Value Proposition –which is literally wilting on the vine.
56%Carmel
Reviewing the Important Annual KPIs - Capital

Group A Group B Group C
Reviewing the Important Annual KPIs - Capital
• This metric is only important to get Boards to realize…
• Food & Beverage is an AMENITY – not a Profit Center
• We need to get them off this topic – it gets in the way of the critical Capital KPIs

F&B Profit/Loss to Dues Ratio Analysis
Grouping A
Lower Quartile
Grouping B
Middle 50%
Grouping CUpper
Quartile
Club Operating Revenue$7,410,000 $6,780,000 $6,180,000
Dues to Revenue Ratio 56% 50% 44%F&B to Revenue Ratio 25% 31% 38%F&B Labor to Revenue Ratio 82% 65% 54%
F&B Cost of Goods Sold 45% 41% 38%Full Member Dues $9,780 $6,780 $6,630Full Member Equivalents 515 480 390Initiation Fee $52,500 $24,000 $10,000
• Proof that F&B is an Amenity
• The Healthiest clubs financially subsidize F&B the most
• The Weakest clubs financially subsidize F&B the least
Reviewing the Important Annual KPIs - Capital

Reviewing The Mission Critical Monthly KPIs

1. Total Member Count2. Total Members Entering3. Total Members Exiting4. Members on Wait List5. Members on Exit (Sell) List6. Total Cost of Belonging (Annual)
a. Operating Dues, Capital Dues, Debt Service, F&B Minimum, Level Service Fee, Trail Fee, Locker, Bag Storage, Handicap, Driving Range, Capital Assessment
7. Initiation Fee
Membership
1. Dues Revenue2. Non-Dues Revenue3. Initiation Fee Income4. Total Capital Income5. Capital Investment6. Total Debt
Finance
Strategic Monthly Metrics – These Matter to ALL CLUBSCollected Data
KPIs in Private Clubs

One Fine Club
The Strategic Monthly Dashboard
Membership Report• Illuminate Membership Trends
• How is our club faring in attracting and retaining members relative to the local market and industry?
• What is more important than knowing the precise answer to that question?
• Our Club trend Year-over-Year
• Our Peer Group Trend Year-over-Year
• Industry Trend Year-over-Year
• What percent of clubs have a Waiting List? Sell List?

One Fine Club
The Strategic Monthly DashboardCost of Belonging Report• Illuminate Dues, Mandatory Fees and
Initiation Fee Trends
• How does the cost of belonging to Our Club benchmark versus our local Peer Group? The Industry?
• Another critical question to which the precise answer must be known.
• While a given club typically only changes its costs once a year – the market is constantly changing.
• Real-time visibility into the changing market.
• Data based on a systematic “Apples-to-Apples” data gathering process versus “ad-hoc” one off emails.
The Strategic Monthly Dashboard
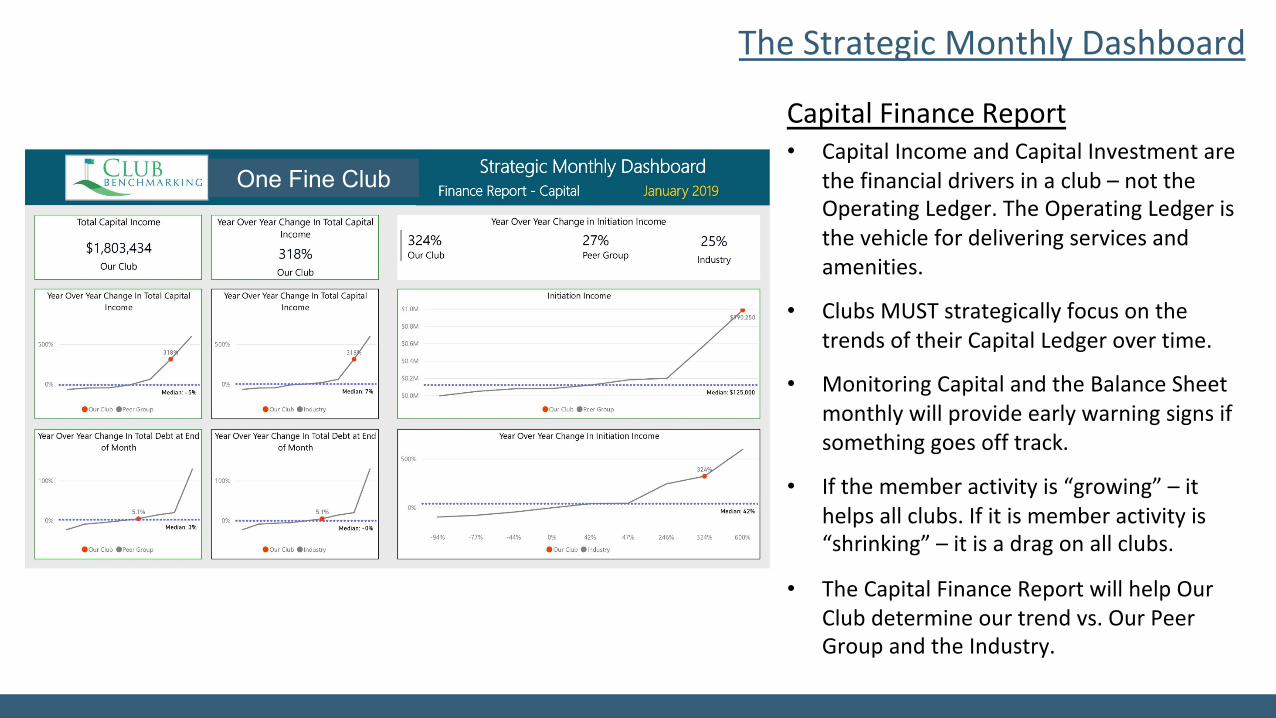
Capital Finance Report• Capital Income and Capital Investment are
the financial drivers in a club – not the Operating Ledger. The Operating Ledger is the vehicle for delivering services and amenities.
• Clubs MUST strategically focus on the trends of their Capital Ledger over time.
• Monitoring Capital and the Balance Sheet monthly will provide early warning signs if something goes off track.
• If the member activity is “growing” – it helps all clubs. If it is member activity is “shrinking” – it is a drag on all clubs.
• The Capital Finance Report will help Our Club determine our trend vs. Our Peer Group and the Industry.
One Fine Club

The Strategic Monthly DashboardOperating Finance Report• Precisely illuminates Operating Revenue
trends – Dues and Non-Dues
• Separate Our Club’s trends from market trends to yield STRATEGIC INSIGHT into our choices regarding our Value Proposition.
• Certain clubs are growing faster than competitors and the market because they have strategically evolved their value proposition.
• Certain clubs are shrinking in relation to competitors and the market as a result of LACK OF FOCUS on their value proposition.
• Which is your club?
• The Operating Ledger is not a financial driver – it accounts for the Value Proposition. This report yields strategic insight into Our Club’s Value Proposition in a dynamic market.
One Fine Club

BenefitsChange the Dialogue
• As a whole, the industry is tactical – clubs succeeding in the ever changing market must THINK AND ACT STRATEGICALLY by understanding their market, their value proposition and their competitive position.
• As Porter said – Operational effectiveness is not strategy!
• There has been a gap relative to understanding the changing market – the Manager should be an Expert. Precisely understand your market!
• Consider the audience for data you provide – the KPIs the Board monitors (strategic) should not be the KPIs the F&B Manager monitors (tactical)
• No more need to send spreadsheets around asking for Dues or Initiation Fee in an ad-hoc manner – participate in a standard, accurate, consistent and context-based process.
• Measure strategic outcomes – understand the effects of decisions being made in your club.

Some DetailsMaking it Work
• The data is submitted in an excel spreadsheet as this point in time – we will offer various other alternatives in the future. Again – 20 minutes or less is all it takes!
• A defined Peer Group must be at least 7 clubs (including your own club) – they can be local, but don’t have to be. There is no limit on how many clubs can be in a Peer Group.
• Only your club will ever see your data. We have been doing this for 10 years and have proven our platform protects anonymity (which allows for truthful data submission –emails with names of clubs can easily be “fudged”)
• If you aren’t in a Peer Group – we can make a Peer Group be a Chapter or a Geographic Region – we will pick the most “local” data set with at least 7 clubs as we get this rolling nationwide.
• Over time there are other KPIs we have already discovered that will add to the value of the service.

Summary and Conclusions

The Importance of CapitalThe Investment Return - CycleIncreasing Net Worth
If You Build the Right Things…They Will ComeDecreasing Net Worth
If You Don’t Build It – They Will Never Come
Generate Capital Income And Invest

Conclusions and Takeaways• Understand the Club Industry’s Key Success Factors
o They are common to every club
o We are in the hospitality and service business, not the manufacturing industryo It is about Strategic Choices and Value Proposition, not Efficiency
• Use KPIs to Focus the Staff and the Board on what Matterso The KPIs that are critical are the same for every clubo Operating KPIs will vary from club to club
o Clubs will measure both Strategic and Operating KPIs – make sure the Board sees the Strategic KPIs –the Operating KPIs invite micromanagement and focus on Operations
o The Mission Critical KPIs manifest on the Capital Ledger and Balance Sheet
• The Strategic Monthly Dashboardo Is Mission Critical as it delivers insight into the changing Market and your club’s competitive position
o Will change the Boardroom (and Finance Committee Room) dialogue – which is NECESSARY
• As the Chief Financial Executiveo Understand and Embrace the Key Financial Performance Indicators – don’t let Board “imprint” their
view on the industry

• Clear Mission – needs to be documented and ideally “tangible” in the club’s culture – the club lives it
• Clear Vision – every club needs to be DRIVING forward with purpose - also tangible in club’s culture
• Core Values (Understanding Choices)§ High Service <-> Pedestrian Service§ High Quality <-> Pedestrian Quality§ Large Club <-> Small Club§ Broad Amenities <-> Narrow Amenities§ Quality of Service & Level of Amenities <-> Price
• SWOT - Member input, especially “newer” and prospective members
• Strategic Key Performance Indicators – Standard, strategic, Board level Club Benchmarking KPIs
• Key Strategic Goals – this year, next 2-5 years (negate weaknesses, mitigate threats, leverage opportunities, build on strengths)
• Capital Reserve Study and Forward Looking Capital Model – professional and objective – 20 year view. How do Resources meet needs?
• Conscious deliberation regarding Optimal, Sustainable Member Count• Governance Foundation that allows for “administration to administration” embracement, implementation
and continuous evolution of the plan – Board members are Stewards of the Plan, Not Managers of the Club• Fact Based Governance Culture based on sound understanding…Staff “runs” the club, Board sets policy,
oversees strategy and fosters culture
Components of a Holistic Strategic Plan

ComprehensiveTools&Services
poweredbyClubBenchmarking
Capital Reserve Studies
Capital Strategies Modeling
Board Advisory Services & Balanced Scorecard Strategic Planning Framework
Member Surveys: Satisfaction, Motivation, Attachment, Value & Loyalty
Compensation & Benefits Benchmarking& Advanced Workforce Analysis
Employee Engagement Surveys& Industry Benchmarking
Financial & Operational Benchmarking PowerfulSolutions•ProvenInsight
CapitalSolutions
StakeholderSolutions
Core

Thank You!
www.clubbenchmarking.com
Our mission is to foster healthier clubs, more strategic boards and more empowered managers by elevating fact over opinion.