Embed Size (px)
Citation preview
Stock Return Synchronicity and Price Informativeness:
Evidence from the Corporate Bond Market
Wei Haoa, Andrew Prevost b*, Udomsak Wongchotic
a,c School of Economics and Finance, Massey University, Palmerston North, New Zealand
b Grossman School of Business, University of Vermont, Burlington, VT 05405, USA
Abstract
Prior research reports contradictory evidence regarding the association between stock price
synchronicity and price informativeness. We contribute to this debate by examining the relation
between return synchronicity and the pricing and design of corporate debt securities. Stock price
synchronicity is negatively associated with the cost of corporate debt, and is pronounced among
bonds with lower credit quality and shorter maturity. Further analysis demonstrates that lower
stock price synchronicity is also related to a greater likelihood of bonds issued with call provisions
and a higher likelihood of split S&P and Moody’s bond ratings. These results support the view that
lower stock price synchronicity reflects greater information impairment.
Keywords: Stock return synchronicity; Information asymmetry; Corporate debt
_________________________
* Corresponding author. Email: [email protected]

1
1. Introduction
The interpretation of stock price synchronicity (or R2) as a measure of price
informativeness has been the subject of considerable debate. The conventional view (e.g. Morck,
Yeung and Yu, 2000; Durnev, Morck, Yeung and Zarowin, 2003; Durnev, Morck and Yeung, 2004)
holds that greater co-movement between stock and market returns reflects less public firm-specific
information. The underlying rationale for this interpretation is that as firm-specific information is
imputed into the stock price via the trading process, the stock return’s co-movement (or
synchronicity) with the market index decreases. However, a number of recent studies have found
contradictory evidence and have proposed that lower R2 instead captures noise regarding firm-
specific news and thus a greater level of information inefficiency (see e.g. Kelly, 2014; Dasgupta,
Gan and Gao, 2010; Rajgopal and Venkatachalam, 2010; Teoh, Yang and Zhang, 2009; Ashbaugh-
Skaife et al., 2006; Devos, Hao, Prevost, Wongchoti, 2015).1
In this study, we contribute to the debate over whether stock price synchronicity is directly
or inversely related to price informativeness by examining the role of synchronicity in the pricing
and structure of corporate bonds. While equity and debt issued by the same firm represent different
claims, they are joint claims on the same underlying assets of the firm (Kwan, 1996). Therefore,
any changes in the value of firm’s underlying assets or changes in firm’s asset return variance will
cause changes in value for both equity and debt. In other words, value-relevant information (e.g.
public firm-specific information) as reflected by stock price movements should also impact the
value of the firm’s debt. Further, Downing, Underwood and Xing (2009) and Hotchkiss and Ronen
(2002) investigate the dynamics of firm-specific information flow between the stock and bond
markets and document evidence of firm-specific information spillover from the equity market to
1 Appendix 1 provides a survey of these two literatures.

2
the bond market. Their findings suggest that stock price efficiency extends from the stock market
to the bond market; therefore, a measure drawn from stock price movements should be relevant to
investors of the issuer’s bonds.
Additionally, studying the relation between stock price synchronicity and price
informativeness using the structure and pricing of the firm’s debt as an experimental setting offers
several advantages. First, price movements in the bond market are less subjective to noise trading
(e.g. individual investors with behavioral biases that can move prices away from fundamentals
regardless of information quality) in comparison to those observed in the equity market. To the
extent that stock price informativeness should reflect the quality of public firm-specific
information available in the capital market, studying the impact of R2 on the pricing of the firm’s
debt allows us to reconcile ambiguous findings of previous equity-based studies which might be
partly driven by noise trading. Second, the risk premium on corporate bonds is relatively
deterministic and can be explained by components related to default, liquidity and information.
Thus, the ability of the synchronicity measure to explain risk premia on corporate bonds, apart
from controls for the default and liquidity components, implies that synchronicity represents
informational risk (e.g. uncertainty around the quality of public firm-specific information about
the issuer). In addition, the firm-specific public information explanation for synchronicity also has
connotations for the ability of market intermediaries to reach consensus on the default risk of bonds;
if synchronicity is related to the quality of the information environment, then synchronicity should
have explanatory value for the propensity of rating agencies to reach convergent opinions on the
likelihood of default for corporate borrowers. Lastly, following theoretical models by Bodie and
Taggart (1978), Barnea, Haugen and Senbet (1980), and Robbins and Schatzberg (1986), the
information explanation implies that synchronicity should have explanatory value in the design of

3
corporate debt securities to the extent that structural characteristics such as callable provisions are
a means for managers to mitigate information asymmetry with the capital market.
Based on samples of at-issue corporate bonds and secondary market bond transactions, our
preliminary univariate results show that bonds issued by firms with low stock price synchronicity
tend to have characteristics associated with greater information risk. Specifically, they receive
poorer credit ratings, provide higher yields to maturity, are more likely to receive divergent
Moody’s and S&P ratings, and are more likely to include call provisions at issuance. Further
multivariate analyses corroborate the above findings and provide additional evidence that lower
stock price synchronicity is associated with less public firm-specific information. Consistent with
the view that non-investment grade bonds are more sensitive to firm-specific information (see, e.g.,
Kwan, 1996), the negative relation between synchronicity and yield spread is stronger among high
yield bonds.
Finally, our analysis of at-issue credit ratings and the choice to include call provisions in
newly issued bonds allows us to address whether return synchronicity is driven by asymmetry
between corporate insiders and outside market participants, or by asymmetry between market
outsiders. Extant research points to an ‘insider-outsider’ explanation for divergent credit ratings
and for the use of call provisions. The ability for synchronicity to explain these characteristics
provides direct evidence that R2 can be used to measure the extent and quality of public firm-
specific information provided by companies to market participants. Overall, our results are
consistent with the view that lower synchronicity is associated with greater information
impairment.

4
The remainder of this paper is organized as follows: Section 2 reviews related literature
and develops our hypotheses. Section 3 describes data and methodology. Section 4 presents
empirical results and Section 6 concludes.
2. Literature Review and Hypotheses Development
2.1 Stock price synchronicity and price informativeness
The information-based explanation for R2 originates with Roll (1988), who calculates R2 of
large stocks using both single- and multiple factor regression models. Roll (1988) observes low R2
and little relation between R2 and public news events, suggesting that there is high firm-specific
return variation among large US stocks. Despite the growing body of literature studying R2 (or
stock price synchronicity) following Roll (1988) and the wide range of application of R2 in the
finance and accounting literature, the fundamental question of what R2 actually captures, and how
it should be interpreted, remains an open question.
The conventional view contends that R2 is inversely associated with public firm-specific
information, i.e. low R2 reflects the incorporation of a greater amount of firm-specific information
into stock prices so that low R2 represents more informative stock prices. This view was initiated
by Morck, Yeung and Yu (2000), who documented that high GDP countries, compared with low
GDP countries, experience lower stock return synchronicity. They attribute this lower
synchronicity to greater firm-specific information capitalization in high GDP countries.
Subsequent research have further expanded this view into a firm-level phenomenon. Durnev,
Morck, Yeung and Zarowin (2003) examine the relationship between firm-specific stock return
variation (i.e. 1- R2) and different accounting measures of stock price informativeness. They find
that greater firm-specific variation is associated with more informative stock prices. Also, firms
with lower R2 exhibit a greater sensitivity between current stock returns and firm-specific

5
information (represented by future earnings), suggesting that more information is incorporated into
stock returns of low R2 firms. Further, Durnev, Morck and Yeung (2004) use firm-specific return
variation as a proxy for price informativeness and find that capital investment decisions become
more efficient when stock prices are more informative. Their findings indicate that a better
information environment (e.g. less information asymmetry between corporate insiders and outsider
investors) is associated with lower stock R2. Based on the premise that R2 reflects firm-specific
information impounded in stock prices, more recent work finds that lower R2 stocks are associated
with increased information transparency (Jin and Myers, 2006), enforcement of insider trading
laws (Fernandes and Ferreira, 2009), lower board independence (Ferreira and Smith, 2006), lower
chance of stock overpricing due to investor inattention (Stowe and Xing, 2010), lower probability
of opaque financial reports and crash risk (Hutton, Marcus, and Tehranian, 2009), less analyst
forecasting activities (Piotroski and Roulstone, 2004; Chan and Hameed, 2006), and diminished
separation between control and cash flow rights (Boubaker, Mansali and Rjiba, 2014)
A developing line of research provides evidence supporting the opposite conclusion: low
R2 is associated with less public firm-specific information and stock prices with lower information
content. Using four earnings-based measures as proxies for information quality, Teoh, Yang and
Zhang (2009) show that stock prices of low R2 firms are not more reflective of its future earnings.
Li, Rajgopal and Venkatachalam (2014) and Kelly (2014) add to this view by examining various
firm and stock characteristics associated with R2, demonstrating that low R2 stocks are associated
with characteristics consistent with a noisier information environment. For example, Kelly (2014)
associates smaller, less liquid, and less followed firms with lower R2 and diminished probability
of informed trading (PIN). Hou, Peng and Xiong (2013) provide additional support for this
contention by providing evidence that investor sentiment is a key driver of low R2. At the same

6
time, Gassen, LaFond and Skaife (2014) show that illiquidity (a market friction) is the first order
determinant of R2. Additional research provides evidence for this view through information event
settings. Dasgupta, Gan and Gao (2010) examine changes in return synchronicity before and after
events that should affect stock price informativeness. In contrast to the conventional wisdom, R2
generally increases after information events such as seasoned equity issues and ADR listings.
Devos, Hao, Prevost and Wongchoti (2015) document stronger abnormal return, volume, and
volatility reactions to analyst recommendation revisions among lower R2 stocks. To the extent that
corporate outsiders such as equity analysts facilitate the interpretation of limited amount of firm-
specific information among more opaque firms, these results support the view that analysts provide
a greater role as information intermediaries for firms that are less synchronized with the market.
Finally, Chan and Chan (2014) document a negative relation between R2 and the discount of
seasoned equity offerings. To the extent that the SEO discount represents the existence of
information asymmetry between managers and investors, their findings suggest that low R2 is an
indication of greater information asymmetry among insiders and outsiders of a corporation (e.g.
the deficiency of public firm-specific information).
2.2 Stock price synchronicity and the cost of debt
We contribute to this literature by examining the relation between stock price synchronicity
and the pricing and structure of corporate bonds. Following the standard view that the risk premia
of corporate bonds are based on components related to default, liquidity, and information (e.g.
Hubbard and O’Brien, 2014), R2 should be associated with the cost of debt to the extent that it
reflects a dimension of information risk to investors. Therefore, we begin our analysis by testing
how R2 affects the cost of debt as defined by credit ratings and corporate bond yield spreads.

7
Bond credit ratings are a broad summary of the ability to repay financial commitments and
can be used as an alternative measure of cost of debt. There is evidence from previous research
that the quality of firm-specific information affects credit ratings. For example, Odders-White and
Ready (2006) find that the amount of non-public firm-specific information captured by equity-
based adverse selection measures is significantly negatively related to credit ratings. Based on the
premise that adverse selection reflects the information imbalance between corporate insiders and
outside investors, their findings indicate that firms with higher information asymmetry are
associated with lower credit ratings after controlling for other explanatory variables. In a similar
vein, Yu (2005) suggests that rating agencies specifically include the quality of information
disclosure as a determinant of corporate bonds’ credit ratings, indicating that information
asymmetry affects the rating decisions made by the rating agencies. To the extent that corporate
bonds’ credit ratings inversely measure cost of debt, then firms with lower R2 should be associated
with greater cost of debt as reflected by lower credit ratings if low R2 represents greater information
impairment:
H1: Stock price synchronicity is positively associated with credit ratings.
There is a long line of literature on the determinants of bond risk premia. Research on the
default risk component builds on the seminal work of Black and Scholes (1973) and Merton (1974).
Merton (1974) introduces a structural model that incorporates default risk into corporate bond
valuation based on the option pricing model developed by Black and Scholes (1973). Merton’s
model has been further extended in many studies. For example, Anderson and Sundaresan (1996)
incorporate insights of corporate finance research into bond valuation and find that strategic debt
service increases default risk and hence yield spread. Campbell and Taksler (2003) find that equity
volatility can explain as much yield spread changes as can credit ratings. Since debt claims can be

8
valued as a put option short position (Merton, 1973), they suggest that the value of put option
increases with the equity volatility which benefits equity holders at the expense of bond holders.
Furthermore, Collin-Dufresne and Goldstein (2001) modify the structural model to incorporate a
more complex capital structure, where firms are allowed to adjust their capital structure to reflect
changes in asset value. However, the yield spreads predicted by the traditional Merton model are
found to be far below the empirically observed corporate yield spread and corporate yield spreads
cannot be solely explained by default risk. Collin-Dufresne, Goldstein and Martin (2001) examine
the theoretical determinants of default proposed by the traditional structural model (e.g. changes
in spot rate, changes in the slope of the yield curve, leverage, volatility, etc.) and find that these
credit risk-related variables have limited ability to explain corporate yield spread. Similarly,
Huang and Huang (2012) explore how much of historically observed yield spreads can be
explained by credit risk and conclude that the risk of default explains only a small portion of yield
spread for bonds. Elton, Gruber, Agrawal and Mann (2001) find that corporate bonds paying
higher coupon rates are subject to higher tax burden and are hence less attractive to investors. Even
after taxes and default risk are both included in the corporate bond pricing model, Elton, Gruber,
Agrawal and Mann (2001) conclude that a large portion of the yield spread still remains
unexplained.
A significant determinant of yield spread missing in the early bond pricing literature is
liquidity. Longstaff, Mithal and Neis (2005) decompose corporate yield spread into default and
non-default components using credit default swap data. They find that default risk explains a large
portion of the yield spread, with the remaining component related to measures of liquidity.
Confirming the findings of Longstaff, Mithal and Neis (2005), Chen, Lesmond and Wei (2007)
establish a negative relation between bond specific liquidity and yield spread. Focusing on
9
aggregate-level liquidity risk, Lin, Wang and Wu (2011) document a positive relation between
aggregate liquidity beta and corporate bond returns. Their findings suggest that more liquidity-
sensitive bonds earn higher returns than less liquidity-sensitive bonds. Huang, Huang and Oxman
(2015) further extend the structural bond pricing model by including stock market liquidity and
provide consistent evidence that the deterioration of stock market liquidity increases bond yield
spreads.
Recent research identifies information risk as a further important determinant overlooked
in previous work. Yu (2005) finds that firms with good information disclosure quality tend to have
lower credit spreads and the negative relation between accounting transparency and yield spread
is particularly strong for short-term bonds. Mansi, Maxwell and Miller (2011) investigate the
relation between analyst forecast characteristics and the cost of debt. Given that analyst forecast
activities contribute to firm’s information environment by reducing information inefficiency, they
demonstrate that corporate bond yield spreads are reduced with increases in analyst activities.
Zhou (2010) directly incorporates liquidity and information risk into the corporate bond pricing
model. Consistent with previous findings, he finds that liquidity affects the yield spreads of risky
corporate bonds, and more importantly he also finds that information uncertainty of individual
bonds provides significant additional explanatory power to yield spread. Using various measures
to capture information uncertainty (measured by accruals quality, firm age, analyst coverage,
forecast dispersion, PIN, and order imbalances), Lu, Chen and Liao (2010) show that corporate
bond yield spreads contain a significant risk premium for investors who bear information risk.
With respect to the term structure, their results indicate that information impairment have stronger
effects for short-maturity bonds than for long-maturity bonds.

10
As discussed above, the quality of public firm-specific information surrounding the firm
should have direct impact on bond pricing due to information risk. Within a poor information
environment, bond investors only have access to limited and imprecise information about firm
value and would require a higher return for increased risk, leading to a widened yield spread2. To
the extent low R2 represents greater information impairment, low R2 firms should be associated
with greater cost of debt as indicated by greater corporate yield spread. This motivates Hypothesis
2 as follows:
H2: Stock price synchronicity is negatively associated with yield spread.
The negative relation between R2 and yield spread should be stronger for high yield (non-
investment grade) bonds with greater exposure to information risk. As Kwan (1996) demonstrates,
low rated bonds are particularly sensitive to firm-specific information. In the same vein, Mansi,
Maxwell and Miller (2011) find that the information contained in analysts’ forecasts is most
valuable when the uncertainty about firm value is the highest (i.e. for firms with high information
uncertainty). Also, Han and Zhou (2014) show that bonds that are closer to default are more
sensitive to information impairment. Compared with investment-grade bonds, these findings
suggest that investors holding high yield bonds should be more sensitive to information risk and
require a relatively higher risk premium, leading to a stronger sensitivity of yield spread to R2, as
predicted by Hypothesis 2a:
H2a: The relation between stock price synchronicity and yield spread is stronger for high yield
bonds.
2 Han and Zhou (2014) provide evidence that informed bond trading is present in US corporate bond markets,
especially for high-yield and private-firm bonds. This suggests that information risk is higher for issuers with less
public firm-specific information as better-informed traders can better exploit their informational advantage.

11
In addition, the negative relation between R2 and yield spread should be stronger for bonds
with short term maturity. Traditional structural models (such as Leland, 1994; Longstaff and
Schwartz, 1995) suggest that bond credit spread diminishes and eventually goes to zero as the
maturity approaches to zero regardless of issuing firm’s credit quality. However, Duffie and Lando
(2001) indicate that this is not true under an imperfect information environment, especially for
short term maturity bonds. Consistent with Duffie and Lando (2001), Yu (2005) and Lu, Chen and
Liao (2010) show that the impact of information risk on yield spread intensifies as bond maturity
decreases. Therefore, if low R2 represents greater information uncertainty (e.g. firm-specific noise
as a result of poor quality public firm-specific information), the negative relation between R2 and
yield spread should be pronounced for short maturity bonds than for long maturity bonds:
H2b: The relation between stock price synchronicity and yield spread is stronger for short maturity
bonds.
2.2 Stock price synchronicity and split credit ratings
A bond rating that is ‘split’ signifies divergence of opinion between Moody’s and S&P in
assessing the creditworthiness of the issuing firm; bonds issued by firms with poor firm-specific
information quality are more likely to receive split ratings between the two rating agencies because
of a greater likelihood that different conclusions will be drawn from limited relevant information
about the issuer. Existing work on the determinants of split bond ratings (see e.g. Morgan, 2002;
Livingston and Zhou, 2010) also demonstrates a strong association with the degree of information
opacity. Therefore, if low R2 represents greater information impairment, then bonds issued by
lower R2 firms should have a higher probability of receiving split Moody’s and S&P ratings as
predicted by Hypothesis H3:
H3: Stock price synchronicity is negatively associated with the incidence of split credit ratings.

12
2.3 Stock price synchronicity and callable debt
While issuing callable bonds can impose higher up-front costs of borrowing to
corporations, the theoretical models developed by Barnea, Haugen and Senbet (1980) and Robbins
and Schatzberg (1986) point out that firms do so to either preserve their ability to refinance (while
retaining private information not yet to be strategically released) or to send a credible (i.e. costly)
signal to market participants about their optimistic future prospects. These explanations are
conditional on the presence of information asymmetry between managers and corporate outsiders.
As a result, the ability to call back the bonds should be more beneficial for firms with relatively
less public firm-specific information. Banko and Zhou (2010) show that the information
asymmetry explanation of callable bonds significantly explains the decision of corporations to
issue callable bonds beyond the 1990s when interest rate became progressively lower. We employ
the information asymmetry-based explanation to the context of our study: if low R2 represents
greater information impairment, then firms with lower R2 should be more likely to issue bonds
with embedded call provisions.
H4: Stock price synchronicity is negatively related to the likelihood of embedded call options.
As noted by Banko and Zhou (2010), the landscape of the callable bond market has changed
dramatically through the years. Specifically, it has fallen in size from 80 percent of issued
corporate bonds prior to 1985 to as low as 30 percent per year in their sample (about 44 percent in
our sample). This reduction is due to a significant decrease in the issuance of investment-grade
bonds with call provisions that were motivated by higher interest rate during the 1980s. In the
more recent years, the high yield segment of the market has become the major source of callable
debt. Following prior findings, these issuers are more subject to information asymmetry problems.
13
According to the information asymmetry explanation for callable debt, the next hypothesis predicts
a pronounced sensitivity between synchronicity and the incidence of callable high yield debt:
H4: The relation between stock price synchronicity and the likelihood of embedded call option is
stronger for high yield bonds.
We investigate if there is cross-sectional variation in the impact of R2 on the choice to
include call provision in bonds. As Banko and Zhou (2010) point out, agency-related explanations
can be used to explain the motivation to issue callable debt. In addition to the information
asymmetry explanation, call provisions can be explained by agency-based theories relating to risk
shifting and underinvestment. The risk-shifting hypothesis developed by Barnea, Haugen and
Senbet (1980) illustrates that a call provision (a call option to the shareholders of the issuing
company) deteriorates in value when the issuing firm acquires riskier assets. This, in turn, reduces
the potential benefits of risk-shifting activities by shareholders. In other words, a call provision
can help mitigate agency conflicts between shareholders and bondholders. According to the
underinvestment hypothesis (Bodie and Taggart, 1978; Barnea, Haugen and Senbet, 1980),
managers of financially distressed firms pass up positive NPV projects because the gains benefit
bondholders and not shareholders. Callable debt resolves this conflict allowing managers to
refinance the outstanding debt at the time of investment at a rate that reflects the improved financial
prospects of the firm. In addition to a broader finding that issuers with lower ratings are more
likely to issue callable debt, Banko and Zhou (2010) document a significant interactive effect
between proxies for information asymmetry and underinvestment, but not between information
asymmetry and risk-shifting. Overall, they conclude that information asymmetry provides a
motivation for the issuance of callable debt, but only in the presence of underinvestment potential.
Our primary research question is if R2 is a valid proxy for public firm-specific information. In the

14
context of the findings of Banko and Zhou (2010), we explore if information asymmetry (as
proxied by R2) heightens the motive to include call provisions when there is the potential to
underinvest, and when there is the potential to shift risk to debtholders. These are summarized in
the following hypotheses:
H4a: The relation between stock price synchronicity and the likelihood of embedded call option is
stronger for companies with underinvestment potential.
H4a: The relation between stock price synchronicity and the likelihood of embedded call option is
stronger for companies with risk shifting potential.
3. Data and Methodology
Our empirical analysis is based on two samples: A broad sample of U.S. at-issue bonds
covering 1985-2013 and transaction-level price data covering 1994-2013. The two data sources
offer distinct advantages and drawbacks: the at-issue sample offers considerable cross-sectional
variation, however does not allow for a time-series of observations for a given bond. The
transaction-level dataset offers depth (time-series variation) at the bond level, at the cost of breadth.
Therefore, we employ both datasets throughout the paper according to the context. Data for at-
issue bonds are collected from SDC Platinum and pricing data for secondary market transactions
are collected from TRACE (Trade Reporting and Compliance Engine) and FISD (Fixed Income
Securities Database). Other firm-level characteristics are obtained from the I/B/E/S, Compustat,
and CRSP databases.
We estimate R2 for each firm based on the firm’s daily stock return data over the one year
period prior to the bond issuance year (for at-issue bonds) or the transaction year (for seasoned
bonds). R2 is estimated based on the four-factor model, which is defined as:

15
, (1)
where Rjt is the daily return of stock j and Rft is the daily risk-free T-Bill return; Rmt is the return
on the CRSP daily value-weighted index; SMBt is the difference between returns of equally-
weighted portfolio of small stocks and large stocks on day t; HMLt is the difference between returns
of equally-weighted portfolio of high book-to-market stocks and low book-to-market stocks on
day t, and UMDt is the difference of average returns between a high momentum portfolio and low
momentum portfolio on day t.3 Since R2 is bounded between 0 and 1, we follow the convention
in this literature (e.g. Morck, Yeung and Yu, 2000; Durnev, Morck, Yeung and Zarowin, 2003;
Durnev, Morck and Yeung, 2004) by converting R2 to the stock price synchronicity measure using
logged (R2/(1- R2)).
We begin by testing the basic association between stock price synchronicity and the cost
of debt as reflected by the credit rating (Hypothesis H1). We specify the model as:
i
i
i
i effectsYear fixedαctsfixed effe industry h Fama-Frencα
ononcentratiIndustry c αue risk Stock uniqαread Quality spαenditureexpCapital α
riskCash flow αyofitabilitPrαFirm sizeαask spreadBidαthSales growα
k ratioMarket-booαeragecovAnalyst αVolatilityαDebt ratioαDurationαPutableα
CallableαdesNumber traαBond ageαIssue sizeαitySynchronicααingCredit rat
49
20191817
1615141312
11109876
543210
(2)
We code Moody’s letter ratings into numbers from 1 (“C”) to 21 (“Aaa”). We employ three
measures to control for liquidity risk: Issue Size is related to the depth of the secondary market and
the larger the issue size the smaller the liquidity risk (Lu, Chen and Liao, 2010; Huang, Huang and
Oxman, 2015). For the sample of seasoned bonds, we also include Bond Age and Number of Trades
as additional liquidity measures. Greater Bond Age represents higher liquidity risk since older
bonds trade less frequently than younger bonds (Lu, Chen and Liao, 2010; Huang, Huang and
3 Daily data for SMH, HML and UMD data are obtained from Kenneth French’s data library, at
http://mba.tuck.dartmouth.edu/pages/faculty/ken.french/data_library.html.
jttjtjtjftmtjjftjtεUMDmHMLhSMBδ)R(RβαRR

16
Oxman, 2015). Similarly, greater Number of Trades is expected to reduce the yield spread due to
lower liquidity risk (Chuluun, Prevost and Puthenpurackal, 2014).
Information risk is also a key determinant of corporate bond yield spreads and should
provide significant explanatory power beyond default- and liquidity risk. Because proxies for firm-
specific information uncertainty are not absolutely deterministic, we include several alternative
financial- and analyst-based measures as control variables for information risk beyond stock price
synchronicity. As Clarke and Shastri (2000) argue, measures for information asymmetry generally
fall into categories based on stock analyst activity, measures of expected growth, and market
microstructure. These authors point out that each category has strengths and weaknesses and that
there is no single best measure. Therefore, our information asymmetry proxies are selected based
on these three categories including Analyst Coverage (Mansi, Maxwell and Miller, 2011 and
Chuluun, Prevost and Puthenpurackal, 2014), Book to Market Ratio and Sales Growth (Banko and
Zhou, 2010), and Bid Ask Spread (Chuluun, Prevost and Puthenpurackal, 2014).
Following related research, we include other firm- and issue-level related characteristics as
additional controls. At the bond level, Duration represents the effective maturity of bond and is
used to control for exposure to interest rate changes faced by investors. Callable and Putable are
dummy variables indicating whether the bond has embedded call or put provisions. At the firm
level, we additional dimensions of risks faced by investors that may not be fully captured by the
contemporaneous credit rating. These include Firm Size, Profitability, Cash Flow Risk, Debt Ratio,
Stock Volatility and Capital Expenditure. Because Firm size (logged total assets) and
Synchronicity are highly correlated, following the approach of Banko and Zhou (2010) we use an
indicator variable equal to one if total assets is greater than the sample median for each year.
Quality Spread is defined as the yield difference between the Baa and Aaa corporate bond indices

17
and controls for systematic credit risk exposure (e.g. Mansi, Maxwell and Miller, 2004; Klock,
Mansi and Maxwell, 2005), and we include fixed effects for year and Fama-French 49 industries.
To test H2, H2a and H2b, our strategy is to employ stock price synchronicity as a measure
of information risk in the bond valuation model while controlling for default and liquidity
components and additional bond-level control variables used in related work. Positive significance
of the Synchronicity coefficient would support the contention that R2 measures information risk
that reduces the prices of corporate bonds. Using the at-issue sample of yield spreads and, for
robustness, the seasoned bond sample, we specify the regression model as:
i
i
i
i
effectsYear fixedα
ctsfixed effe industry h Fama-FrencαononcentratiIndustry c αue risk Stock uniqαreadQuality spα
enditureexpCapital αriskCash flow αyofitabilitPrαFirm sizeαask spreadBidαthSales growα
k ratioMarket-booαeragecovAnalyst αVolatilityαDebt ratioαDurationαPutableαCallableα
desNumber traαBond ageαIssue sizeαt ratingized crediOrthogonalαitySynchronicααadYield spre
49212019
181716151413
1211109876
543210
(3)
The dependent variable Yield Spread is calculated as the difference between the yield to maturity
of sample corporate bond and the interpolated yield to maturity of Treasury corresponding to the
same time to maturity as the sample corporate bond. To calculate the interpolated yield to maturity
of Treasuries, we collect data about constant-maturity Treasury bond indices from the Federal
Reserve of St. Louis Economic Data (FRED), which provides daily yield to maturity data for
Treasury bond indices with constant maturities (e.g. 3-month, 6-month, 1-year, 2-year, 3-year, 5-
year, 7-year, 10-year and 20-year). We use linear interpolation to obtain an implied Treasury rate
for any maturity between 3 months and 20 years. For at-issue bonds, there is only one yield
observation for each bond and we merge it with other yearly data by the year of that observation.
For seasoned bonds, we aggregate multiple purchase and sale transactions occurring on the same
day into aggregated a trade-weighted daily yield to maturity based on the par amounts of each

18
transaction as weights, then use the yield observation of the closest transaction day to the fiscal
year end date to merge with other yearly data.
We use the same set of control variables are in Equation (2). To control for default risk,
our main control variable is Credit Rating using the bond’s Moody’s rating obtained from Mergent.
Since the information contained in remaining bond- and firm-level control variables is partially
captured by firms’ credit ratings (Mansi, Maxwell and Miller, 2004; Klock, Mansi and Maxwell,
2005; Mansi, Maxwell and Miller, 2011), we purge this information from ratings by creating
Orthogonalized Credit Rating, which captures only the information provided by credit ratings and
is unrelated to the information contained in the remaining control variables. Orthogonalized Credit
Rating is the residual from regressing Credit Rating on all other independent variables (including
synchronicity) included in the regression model.
Hypothesis 3 posits that greater information uncertainty, as captured by lower R2, increases
the likelihood that the rating agencies arrive at different conclusions regarding the issuer’s
creditworthiness. To investigate this prediction, we estimate the following probit model using the
at-issue- and seasoned bond samples:
i
i
i
i effectsYear fixedαctsfixed effe industry h Fama-FrencαdesNumber traα
BondageαCallable αIssue sizeαt ratingized crediOrthogonalαMaturityα
Firm sizeαenditureexpCapital αDispersionαreadBid-ask spαeragecovAnalyst α
rrorForecast eαtsgible assetanInαt ratioBook-markeαitySynchronicααngSplit rati
4915
1413121110
98765
43210
(4)
Using Moody’s and S&P ratings coded to numerical equivalents, we employ two alternative
measures of split ratings. First, we classify split ratings broadly using rating categories, where
Split category rating is equal to one if the Moody’s and S&P ratings differ across letter rating
categories, e.g. if Moody’s rating is Baa and the S&P rating is A-, and zero otherwise. Second,
we use a finer classification: Split rating equals one if the Moody’s and S&P ratings differ by one

19
notch or more, and zero otherwise. Following Livingston, Naranjo and Zhou (2007) and
Livingston and Zhou (2010), our control variables include accounting-based measures (Book
market ratio, Intangible assets, Capital expenditure), analyst opinion-based measures (Analyst
forecast error, Analysts coverage, Dispersion), liquidity measures (Bond age, Number of trades,
Issue size), market microstructure measures (Bid-ask spread) and other measures that control for
alternative dimensions of information risk (Firm size) along with additional bond-level
explanatory variables (Orthogonal credit rating, Maturity, and Callable). Consistent with
previous regression models, industry- and year fixed effects are included as additional controls.
To test Hypothesis H4, H4a and H4b we use the following probit regression model to
examine if stock price synchronicity explains the likelihood the bond contains call provisions, and
if there is significant cross-sectional variation according to higher underinvestment potential and
agency problems. Since the choice to include a call provision is made at the time of issue, we
model the call provision choice using the at-issue dataset using the following logistic regression
model:
i
i
i
i effectsYear fixedαctsfixed effe industry h Fama-Frencα
ononcentratiIndustry cαue risk Stcok uniqαIssue sizeαDurationαe slopyield curvChange in α
pe) curve sloStd.(Yieldαe slopeYield curvαDebt ratioαFirm sizeαyofitabilitPrα
yieldSynch*Highαl t potentiarinvestmenSynch*Undeαpotential shifting Synch*Riskα
High yieldαntial tment poteUnderinvesαial ing potentRisk shiftαity SynchronicααCallable
49
1716151413
12111098
765
43210
(5)
Callable is a binary variable equal to one if the bond is issued with call provision and zero
otherwise. We define a bond as callable when the SDC data item “Call Protection” is other than
“Non-life Call.” Following the findings of Banko and Zhou (2010), we expect to find significant
cross-sectional variation when underinvestment potential is higher. We also expect to find that
information uncertainty exacerbates agency problems, which Banko and Zhou (2010) broadly
define as lower rated (i.e., high yield) issuers. For comparability to Banko and Zhou’s (2010)

20
findings, we also interact R2 with a proxy for risk shifting potential. We define Risk Shifting
Potential following Banko and Zhou (2010). Defining discretionary assets as 1-(fixed assets/total
assets) and free cash flow as the ratio of operating free cash flow (operating income before
depreciation minus preferred and common dividends) divided by total asserts, Risk shifting
potential equals zero if discretionary assets and free cash flow are both below the median of the
firm’s SIC2 industry in a given year, equals two if both are greater than their respective medians,
and equals one otherwise. Aivazian, Ge and Qiu (2005) show that debt with longer maturities
significantly reduces investment for firms with high growth opportunities. To gauge
underinvestment potential, we create a binary variable equal to one if the issuer’s three-year
geometric growth in sales is greater than its industry (SIC2) median in a given year and the
maturity of the issue is ten years or greater, and zero otherwise.
In addition to the Synchronicity measure, we include additional explanatory variables to
control for other potential motivations to include a call provision. Following Banko and Zhou
(2010), we include Firm Size as additional proxy for information asymmetry and Debt Ratio as
proxy for agency conflicts. To control for the interest rate hedging explanation for call provisions,
we include the slope of the yield curve (Yield curve slope), the standard deviation of the yield
curve slope (Std. Yield curve slope) and Change in Yield Curve Slope, along with additional firm-
and bond level characteristics including Profitability, Issue Size, Duration, Stock Unique Risk and
Industry Concentration. Similar to Equations 2-4, we also include industry- and firm-level fixed
effects.
4. Empirical Results
We provide summary statistics for the at-issue and seasoned bond samples in Table 1.
Most of the bond- and firm-level measures are qualitatively similar between the two samples. We

21
begin our analysis by demonstrating whether bonds issued by low R2 issuers are associated with
bond- and firm-level characteristics that are consistent with a lower or higher information
uncertainty. To address this question, we first sort sample firms according to their R2 levels within
each year and divide into terciles. We then calculate the mean (median) value of each
characteristic variable for low, medium and high R2 terciles. These results are illustrated in Table
2. We present the mean (median) results across the R2 terciles as well as the difference in mean
(median) between low and high R2 terciles for at-issue bonds in Panel A and for seasoned bonds
in Panel B.4 The mean (median) values of nearly all bond-level characteristics for both the at-
issue sample (Panel A1) and the seasoned bond sample (Panel B1) demonstrate a monotonic
pattern throughout the three R2 terciles. Specifically, bonds issued by firms with low R2 tend to
have larger Yield Spread and lower Credit Ratings, indicating low R2 bonds are perceived as riskier
by investors. Bonds issued by low R2 firms experience higher levels of split credit ratings,
suggesting that issuing firms may have less transparent firm-specific information which impedes
rating analysts from collecting accurate or relevant information, leading to conflicts in
creditworthiness opinions. In addition, bonds issued by low R2 firms have lower maturity (as
measured by Duration) and a higher incidence of embedded call provisions, features that are
consistent with a more asymmetric information environment. According to Flannery (1986),
Diamond (1991), Robbins and Schatzberg (1986), and Banko and Zhou (2010), among others, the
extent of information asymmetry plays a role in firms’ debt maturity choices and embedded
callable provision of issuance. In the presence of information impairment, firms are more likely
to issue short term maturity bonds and callable bonds in order to mitigate the adverse impact of
4 The proceeding discussion will focus on the mean value of the variables.

22
insider-outsider information asymmetry. The difference in means between low and high R2 terciles
is highly significant for all these characteristics.
Firm-level characteristics across the three R2 terciles provide further evidence that low R2
issuers are associated with a noisier and less transparent information environment. For both the at-
issue bond- (Panel A2) and seasoned bond samples (Panel B2), issuing firms with low-tercile R2
have higher Bid ask spread, lower Analyst coverage, higher Forecast error and smaller Firm size.
While low R2 issuers are associated with greater growth opportunities as measured by higher past
Sales Growth, they are valued at discount by investors as reflected by lower market-book ratios.
This is in line with Banko and Zhou’s (2010) premise that firms with high past growth and low
expected future growth are more likely to have severe underinvestment problems. The difference
in means between low and high R2 terciles is highly significant for all these measures. Viewed
collectively, our findings in Table 2 are in line with the notion that bond issuers with low stock
price synchronicity are associated with a relatively poor information environment and an impaired
supply of firm-specific information available to corporate outsiders, for which investors require a
higher yield spread as compensation.
In Table 3, we provide pairwise correlations between synchronicity and alternative
information asymmetry measures. Overall, the pairwise correlations of synchronicity and
characteristic variables are consistent with our findings from the univariate comparisons reported
in Table 2. For both at-issue and seasoned bond samples, lower synchronicity issuers have strong
correlations with firm-specific characteristics that are consistent with poorer information quality.
Specifically, lower synchronicity issuers have higher Bid ask spread, lower Analyst coverage,
lower Market to book ratio, lower Analyst coverage, higher Forecast error and higher Sales
growth.

23
In Table 4, we investigate the association between synchronicity and the cost of debt using
Credit Rating as the dependent variable. We report the sensitivities of Credit rating to the
Synchronicity measure for the at-issue bond sample in Panel A and for the seasoned bond sample
in Panel B. Consistent the results of Table 3, Synchronicity is positive and strongly significantly
related to Credit Rating at the time of issue and over time in the secondary market. This result
supports the prediction of Hypothesis 1 and indicates that rating analysts consider firm’s
information environment as an important determinant of firm’s credit quality: bonds issued by
firms with lower Synchronicity offer less firm-specific information that is publicly available and
higher information uncertainty, and are therefore assigned lower ratings. For both at-issue- and
seasoned bond samples, the firm-level control variables associated with high probability of default
also reduce bonds’ ratings. Specifically, consistent with Adams, Burton and Hardwick (2003),
Bhojraj and Sengupta (2003) and Alali, Anandarajan and Jiang (2012), we find that Credit rating
has a strong positive relation with Profitability, Analyst coverage, Duration and negative relation
with Debt ratio, Volatility and Sales growth. Among the bond-level characteristics, the inclusion
of embedded call provisions is also associated with the perception of greater risk and lowers the
Credit rating.
In Table 5, we present the multivariate regression results for Hypotheses 2, 2a and 2b. In
Panel A Model (1), we establish the relation between synchronicity and bond yield spread among
at-issue bonds. Using the overall at-issue sample, Synchronicity is negative but insignificantly
related to yield spread. The primary proxy of default risk (Orthogonal credit rating) is highly
significant which confirms the role of default risk as an important determinant of corporate bond
pricing. Debt Ratio, Profitability, Cash flow risk, and Stock Volatility can be viewed as alternative
indicators for default risk and are positively related to yield spread at the 1 percent levels. Analyst

24
Coverage is a control measure of the quality of the information environment and is significantly
negatively associated with yield spread at the 1 percent level. Stock unique risk has a positive
impact on yield spread and significant at the 1 percent level, indicating firms with greater unique
risk leading to more investor uncertainty about their fundamentals are associated with higher yield
spread. In general, the signs and significance of the remaining bond- and firm-level control
variables are as expected across all models.
In Table 5 Panel A, we divide the full sample of at-issue bonds into high yield- (Model 2)
and investment grade (Model 3) bonds and estimate Equation (2) for each sub-sample. In support
of Banko and Zhou’s (2010) contention that high yield issuers broadly reflect agency problems
related to information and the incentives to underinvest and take excessive risk, the Synchronicity
coefficient estimate is statistically significant in the high yield subset and becomes insignificant in
the investment grade subset. The signs and significance of the remaining control variables are
generally consistent with the results of in Model (1). These findings support Hypothesis (2a):
information risk is a relatively important risk factor to investors of bonds with a higher likelihood
of default.
Next, we divide the sample of at-issue bonds into long–term and short-term sub-samples
according to their maturity. Bonds are as classified as long-term if their time to maturity is seven
years or greater, and classified as short-term if the time to maturity is five years or lower.5 As
shown in Models (4)-(5), there is a significant negative relation between synchronicity and yield
spread among long-term bonds, but an insignificant association between synchronicity and yield
spread among short-term bonds. While not directly supportive of our Hypothesis 2b, this is
5 We follow Lu, Chen and Liao (2010) and Goyal and Wang (2013) to classify short- and long-term maturity. For both
at-issue bonds and seasoned bonds, we also classified bonds samples using alternative maturity definitions, e.g. with
maturity less than 3 years and greater than 10 years. The results are consistent with those presented in Table 5.

25
consistent with Flannery (1986), who shows that the pricing of long-term debt, at issuance, is more
sensitive to information risk. It is possible that firms with higher information risk are more likely
to issue bonds with short maturities (Flannery, 1986; Diamond, 1991; Berger, Espinosa-Vega,
Frame and Miller, 2005). Therefore, longer-term issues are penalized by a higher cost of debt
when firm-specific information is relatively scarce, as proxied by lower R2. The signs and
significance of the remaining explanatory variables are largely as expected and consistent with the
results in Model (1).
In Table 5 Panel B, we re-examine Equation (2) using the sample of seasoned bonds. In
Panel B Model (1), the Synchronicity coefficient is negative and statistically significant at the one
percent level after controlling for risks related to default, liquidity, fluctuations in macro-economic
variables along with additional firm- and bond-level factors. The main difference of this sample
to the at-issue sample bond is the role of informed bond trading (see, e.g., Han and Zhou, 2014)
that can further enhance the information uncertainty faced by uninformed bond investors. As a
result, information risk can be priced even more strongly into seasoned bonds via the trading
process, leading to a stronger impact on yield spread for seasoned bonds. In line with Han and
Zhou (2014), and in comparison to the results of Panel A, we find that lower synchronicity imposes
a significant positive effect on yield spread for the overall sample.6 Similar to our findings in
Panel A, Synchronicity has a pronounced impact on the yield spreads of high yield seasoned bonds:
the Synchronicity coefficient is significant at the 1 percent level for high yield bonds and is
insignificant for investment grade bonds. Within the seasoned bond sample, the Synchronicity
6 We also find that the magnitude of impact of synchronicity on yield spread increases with trade size. This is
consistent with the notion that informed based traders tend to avoid breaking up their trades in smaller but more
frequent transactions. As the informed traders can benefit more from the impaired information environment, our
supportive results are consistent with Han and Zhou (2014). For brevity, we do not report these results but they are
available upon request.

26
effect is approximately twice the magnitude for short- vs. long-term bonds. This supports
Hypothesis H2b and highlights the critical role of informed bond trading in debt pricing dynamics.
The control variables are largely as expected and consistent with previous findings. In addition to
Issue size, the liquidity measures Bond age is significantly positively related to yield spread and
Number of trades is significantly negatively related to yield spread across all Models. This is
consistent with the view that older bonds and less frequently traded bonds are also subject to higher
liquidity risk (Lu, Chen and Liao, 2010; Huang, Huang and Oxman, 2015). Overall, the results of
Table 5 shed further insight on the notion that low synchronicity reflects greater information
impairment for which bond investors require a higher risk premium to compensate for the higher
information risk they take. In addition, the relation is pronounced for seasoned bond prices, when
informed bond trading enhances the relative negative impact of information risk (e.g. lack of public
firm-specific information) among bond investors.
In Table 6, we report the regression results of Equation 4 where we model the likelihood
the degree that Moody’s and S&P ratings diverge. In Models (1)-(2), we report estimates using
the at-issue sample, and Models (3)-(4) we use the seasoned bond sample. Consistent with the
prediction of Hypothesis 3, we document a significant negative association between Synchronicity
and rating divergence. At the time of issue, the impact of Synchronicity on the incidence of ratings
that are split across categories is about twice as large as its predictive value on the likelihood of
split ratings of a notch or greater. The Synchronicity regression coefficient is negative and
significant at the 1 (5) percent level using Split category rating (Split rating) as the dependent
variable, respectively. Models (3)-(4) illustrate that the impact of Synchronicity on the likelihood
of a split rating lessens as bonds seasons, indicating that the rating consequences of opacity are
most severe at the time of issue. These findings further support the view that lower synchronicity

27
reflects a less transparent information environment. The signs and significance of the additional
control variables are largely consistent with the information opacity explanation for split ratings:
variables capturing a greater likelihood of information opacity, such as smaller Firm size, lower
Analyst coverage and lower Credit rating, are significantly related to Split rating for both at-issue
and seasoned bonds.7
In Table 7 we investigate if Synchronicity has an association with the propensity for newly
issued bonds to contain embedded call provisions. Consistent with the general prediction of
Hypothesis 4, the Synchronicity coefficient estimate is negative and significant at the 5 percent
level, indicating that stock price synchronicity has explanatory value in the decision to include call
provisions in newly issued bonds. We also find that lower-rated firms are more likely to issue
bonds with call features; according to Banko and Zhou (2010), non-investment grade firms issue
callable bonds primarily to alleviate the agency conflicts arising from an asymmetric information
environment, while investment-grade firms issue callable bonds primarily to hedge interest rate
risk. Bonds of longer maturity and larger issue sizes are more likely to include calls, ostensibly to
hedge greater interest rate exposure. Consistent with Hypothesis 4a and the view that information
asymmetry may exacerbate the agency problems found in high yield issuers, Table 7 Model (2)
reports a strong negative interaction term between Synchronicity and High yield; the decision to
issue callable bonds is dependent on the degree of information impairment (as proxied by
Synchronicity), especially among high yield bonds, which comprise the major source of callable
issues in recent years when interest rate have been generally lower.
7 In unreported results, we find that the negative relation between split rating and R2 is stronger for credit ratings of
younger firms. To the extent that credit rating agencies are more reliant on firm-specific information revealed by
younger firms due to less chance of learning about these firms’ prospects through time, the finding is consistent with
the notion that less synchronized firms are associated with greater information impairment.

28
With the interpretation that lower R2 stocks are associated with less public firm-specific
information, the findings in Models (3) and (4) are consistent with the theoretical models by Bodie
and Taggart (1978), Barnea, Haugen and Senbet (1980), and Robbins and Schatzberg (1986)
showing that firms with severe asymmetric information problems are more likely to issue callable
bonds to mitigate the adverse impact of information inefficiency on underinvestment. Specifically,
in support of Hypothesis 4b and consistent with the findings of Banko and Zhou (2010), the
negative relation between Synchronicity and embedded call provisions is particularly strong among
firms that are prone to underinvestment problems. Also consistent with Banko and Zhou (2010),
we find no evidence that firms with information asymmetry problems have an incentive to reduce
risk-shifting problems through callable bond issuance. Finally, Model (5) shows that the
Synchronicity interactions with High yield and Underinvestment potential continue to be
significant after including all interaction terms in the model.
Viewed collectively, the multivariate regression results are consistent with the univariate
results and pairwise correlations reported in Tables 1-2 and further corroborate the view that low
synchronicity is an indication of information inefficiency, or a relative lack of public firm-specific
information. In line with the view that Synchronicity represents a priced information risk factor
from the perspective of bondholders, we find that firms with low stock price synchronicity are
associated with higher cost of debt. Synchronicity also has explanatory value in explaining the
likelihood of credit rating splits and callable bond issuance. These empirical findings provide
further evidence to in support of the view that lower stock price synchronicity proxies for
information asymmetry and an environment in which public firm-specific information is relatively
scarce.

29
6. Conclusion
Motivated by the ongoing debate of the validity of stock price synchronicity (R2) as a
measure of price informativeness, we address the question of whether low stock price
synchronicity represents a more- or less public firm-specific information. While previous studies
address this research question by examining metrics drawn from the stock market, we take a
different approach by examining the issue in the context of corporate bond market. This is
motivated by the literature that establishes the spillover of firm-specific information from the stock
market to the bond market (see e.g. Kwan, 1996; Downing, Underwood, and Xing, 2009;
Hotchkiss and Ronen, 2002). Using yield spreads and structural characteristics of corporate bonds,
we provide evidence supporting the information impairment interpretation of low synchronicity.
Based on the premise that stock price synchronicity reflects the quality of firm-specific information
surrounding the firm, we find that synchronicity has a negative relation with yield spread,
indicating that investors require greater yield premium as compensation for bearing higher
information risk when holding bonds issued by issuers with low stock price synchronicity. We
find this negative relation is pronounced when information risk is more acute, i.e. among high
yield bonds and short-maturity bonds. Using credit rating as an alternative measure of the cost of
debt, we find consistent results demonstrating that lower synchronicity is related to poorer credit
ratings. This result supports the view that firms with low synchronicity are considered by rating
agencies as firms with higher information risk. The results are robust after controlling for default
and liquidity risk embedded in these corporate bonds.
In further analysis, we directly examine the information asymmetry explanation of
synchronicity more directly by linking synchronicity to the extent of divergence in the bond’s
credit rating. The negative relation between synchronicity and split ratings offers further support

30
for the view that firms with low synchronicity are associated with a poor information quality to
outsider investors, where rating agencies are less likely to reach consensus when assigning credit
ratings based on available firm-specific information. Lastly, the examination of the corporate
decision to issue callable bonds allows us to further distinguish the information asymmetry
interpretation of lower Synchronicity from other possible explanations such as lower liquidity. We
find that firms with low synchronicity are more likely to issue bonds with embedded call features:
to the extent that firms use call features to mitigate information asymmetry problems faced by
corporate outsiders, as described in theoretical models of Barnea, Haugen and Senbet (1980) and
Robbins and Schatzberg (1986), our results further supports the view that low synchronicity firms
are associated with lower level of public firm-specific information. Overall, our findings lend
support to the alternative view that lower stock price synchronization (i.e. lower R2) actually
represents a less informative information environment.
31
References
Adams, M., Burton, B., Hardwick, P., 2003. The determinants of credit ratings in the United
Kingdom insurance industry. Journal of Business Finance and Accounting 30, 539-572.
Alali, F., Anandarajan, A., Jiang, W., 2012. The effect of corporate governance on firm’s credit
ratings: further evidence using governance score in the United States. Accounting and
Finance 52, 291-312.
Aivazian, V.A., Ge, Y., Qiu, J., 2005. Debt maturity structure and firm investment. Financial
Management 34, 107-119.
Anderson, R., Sundaresan, S., 1996. Design and valuation of debt contracts. Review of Financial
Studies 9, 37-68.
Ashbaugh-Skaife, H., Gassen, J., LaFond, R., 2006. Does stock price synchronicity represent firm-
specific information? Working paper, MIT Sloan.
Banko, J.C., Zhou, L., 2010. Callable bonds revisited. Financial Management 39, 613-641.
Barnea, A., Haugen, R. A., Senbet, L. W., 1980. A rationale for debt maturity structure and call
provisions in the agency theoretic framework. Journal of Finance 35, 1223-1234.
Berger, A. N., Espinosa-Vega, M. A., Frame, W. S., Miller, N. H., 2005. Debt maturity, risk and
asymmetric information. Journal of Finance 60, 2895-2923.
Bhojraj, S., Sengupta, P., 2003. Effect of corporate governance on bond ratings and yields: the role
of institutional investors and outside directors. The Journal of Business 76, 455-476.
Black, F., Scholes, M., 1973. The pricing of options and corporate liabilities. Journal of Political
Economy 81, 637–654.
Bodie, Z., Taggart, R.A., 1978. Future investment opportunities and the value of the call provision
on a bond. Journal of Finance 33, 1187-1200.
Boubaker, S., Mansali, H., Rjiba, H., 2014. Large controlling shareholders and stock price
synchronicity. Journal of Banking and Finance 40, 80-96.
Campbell, J. Y., Taksler, G., 2003. Equity volatility and corporate bond yields. Journal of Finance
58, 2321-2350.
Chan, k., Chan, Y., 2014. Price informativeness and stock return synchronicity: Evidence from the
pricing of seasoned equity offerings. Journal of Financial Economics 114, 36-53.
Chan, K., Hameed, A., 2006. Stock price synchronicity and analyst coverage in emerging markets.
Journal of Financial Economics 80, 115-147.
32
Chan, K., Hameed, A., Kang, W., 2013. Stock price synchronicity and liquidity. Journal of
Financial Markets 16, 414-438.
Chen, L., Lesmond, D.A., Wei, J., 2007. Corporate yield spreads and bond liquidity. Journal of
Finance 62, 119-49.
Clarke, J., Shastri, K., 2000. On information asymmetry metrics. Working paper, Georgia Institute
of Technology.
Collin-Dufresne, P., Goldstein, R., 2001. Do credit spreads reflect stationary leverage ratios?
Journal of Finance 56, 1929-1957.
Collin-Dufresne, P., Goldstein, R., Martin, J. S., 2001. The determinants of credit spread changes.
Journal of Finance 56, 2177-2207.
Chuluun, T., Prevost, A., Puthenpurackal, J., 2014. Board ties and the cost of corporate debt.
Financial Management 43, 533-568.
Dasgupta, S., Gan, J., Gao, N., 2010. Transparency, price informativeness, and stock return
synchronicity: Theory and evidence. Journal of Financial and Quantitative Analysis 45,
1189-1220.
Devos, E., Hao, W., Prevost, A.K., and Wongchoti, U., Stock return synchronicity and the
market response to analyst recommendation revisions. Journal of Banking and Finance
58, 376-389.
Diamond, D. W., 1991. Debt maturity structure and liquidity risk. Quarterly Journal of Economics
106, 709–738.
Downing, C., Underwood, S., Xing, Y., 2009. The relative informational efficiency of stocks and
bonds: An intraday analysis. Journal of Financial and Quantitative Analysis 44, 1081-1102.
Duffie, D., Lando, D., 2001. Term structure of credit spreads with incomplete accounting
information. Econometrica 69, 633–664.
Durnev, A., Morck, R., Yeung, B., 2004. Value-enhancing capital budgeting and firm-specific stock
return variation. The Journal of Finance 59, 65-105.
Durnev, A., Morck, R., Yeung, B., Zarowin, P., 2003. Does greater firm-specific return variation
mean more or less informed stock pricing? Journal of Accounting Research 41, 797-836.
Elton, E., Gruber, M., Agrawal, D., Mann, C., 2001. Explaining the rate spread on corporate bonds.
Journal of Finance 56, 247-277.
33
Fernandes, N., Ferreira, M.A., 2009. Insider trading laws and stock price informativeness. Review
of Financial Studies 22, 1845-1887.
Ferreira, E.J., Smith, S., 2006. Effect of Reg FD on information in analysts’ rating changes.
Financial Analysts Journal 62, 44-57.
Flannery, M. J., 1986. Asymmetric information and risky debt maturity choice. Journal of Finance
41, 19–37.
Gassen, J., LaFond, R., Skaife, H. A., Veenman, D., 2015. Illiquidity and R2, Working Paper,
Erasmus University Rotterdam.
Goyal, V. K., Wang, W., 2013. Debt maturity and asymmetric information: evidence from default
risk changes. Journal of Financial and Quantitative Analysis 48, 789-817.
Han, S., Zhou, X., 2014. Informed bond trading, corporate yield spreads, and corporate default
prediction. Management Science 60, 675-694.
Hotchkiss, Edith S., Tavy Ronen, 2002. The informational efficiency of the bond market: An
intraday analysis. Review of Financial Studies 15, 1325–1354.
Hou, K., Peng, L., Xiong, W., 2013. Is R2 a measure of market inefficiency? Working paper,
Princeton University.
Huang, H. H., Huang H., Oxman, J.J., 2015. Stock liquidity and corporate bond yield spreads:
Theory and Evidence. Journal of Financial Research 38, 59-91.
Huang, J., Huang, M., 2012. How much of the corporate-treasury yield spread is due to credit risk?
Review of Asset Pricing Studies, forthcoming.
Hubbard, R.G., O’Brien, A.P. Money, Banking and the Financial System. Pearson, 2nd Edition.
Hutton, A., Marcus, A., and Tehranian, H. 2009. Opaque financial reports, R2, and crash risk,
Journal of Financial Economics 94, 67-86.
Jin, L., Myers, S., 2006. R2 around the world: New theory and new tests. Journal of Financial
Economics 79, 257-292.
Klock, M., Mansi, S., Maxwell, W., 2005. Does corporate governance matter to bondholders?
Journal of Financial and Quantitative Analysis 40, 693–719.
Kwan, S. H., 1996. Firm-specific information and the correlation between individual stocks and
bonds. Journal of Financial Economics 40, 63-80.
Kelly, P., 2014. Information efficiency and firm-specific return variation. Quarterly Journal of
Finance, forthcoming.
34
Leland, H.E., 1994. Corporate debt value, bond covenants, and optimal capital structure. Journal
of Finance 49, 1213–1252.
Li, B., Rajgopal, S., Venkatachalam, M., 2014. R2 and idiosyncratic risk are not interchangeable.
Accounting Review 89, 2261-2295.
Lin, H., Wang, J., Wu, C., 2011. Liquidity risk and expected corporate bond returns. Journal of
Financial Economics 99, 628-650.
Livingston, M., Naranjo, A., Zhou, L., 2007. Asset opaqueness and split bond ratings. Financial
Management 36, 49-62.
Livingston, M., Zhou, L., 2010. Split bond ratings and information opacity premiums. Financial
Management 39, 515-552.
Longstaff, F.A., Mithal, S., Neis, E., 2005. Corporate yield spreads: default risk or liquidity? new
evidence from the credit default swap market. Journal of Finance 60, 2213-53.
Longstaff, F., Schwartz, E., 1995. Valuing risky debt: A new approach. Journal of Finance 50,
789–820.
Lu, C., Chen, T., Liao, H., 2010. Information uncertainty, information asymmetry and corporate
bond yield spreads. Journal of Banking and Finance 34, 2265-2279.
Mansi, S., Maxwell, W., Miller, D., 2004. Does auditor quality and tenure matter to investors:
Evidence from the bond market, Journal of Accounting Research 42, 755–793.
Mansi, S.A., Maxwell, W. F., Miller, D. P., 2011. Analyst forecast characteristics and the cost of
debt. Review of Account Studies 16, 116-142.
Merton, R.C., 1974. On the pricing of corporate debt: The risk structure of interest rates. Journal
of Finance 29, 449–470.
Morck, R., Yeung, B., Yu, W., 2000. The information content of stock markets: Why do emerging
markets have synchronous stock price movements? Journal of Financial Economics 58,
215-260.
Morgan, D.P., 2002. Rating banks: risk and uncertainty in an opaque industry. American Economic
Review 92, 874-888.
Odders-White, E.R., Ready, M.J., 2006. Credit ratings and stock liquidity. Review of Financial
Studies 19, 119–157.
Piotroski, J. D., Roulstone, D. T., 2004. The influence of analysts, institutional investors and
insiders on the incorporation of market, industry and firm-specific information into stock
prices. The Accounting Review 79, 1119-1151.
35
Rajgopal, S., Venkatachalam. M., 2011. Financial reporting quality and idiosyncratic return
volatility. Journal of Accounting and Economics 51, 1-20.
Robbins, E., Schatzberg, J., 1986. Callable bonds: a risk-reducing signaling mechanism. Journal
of Finance 41, 935-949.
Roll, R., 1988. R2. Journal of Finance 43, 541-566.
Stowe, J.D., Xing, X., 2011. R2: Does it matter for firm valuation? The Financial Review 46, 233-
250.
Teoh, S.H., Yang, Y., Zhang, Y., 2007. R-square: Noise or firm-specific information. Working
paper, UC- Irvine.
Yu, F., 2005. Accounting transparency and the term structure of credit spreads. Journal of
Financial Economics 75, 53–84.
Zhou, X., 2010. Information, liquidity and corporate yield spreads. Working Paper.

36
Appendix 1
Published R2 Articles
Panel A: Articles supporting the interpretation that lower R2 is more informative
Journal Article
An, H., Zhang, T., 2013. Stock price synchronicity, crash risk, and institutional investors. Journal of Corporate Finance 21,
1-5. Boubaker, S., Mansali, H., Rjiba, H., 2014. Large controlling shareholders and stock price synchronicity. Journal of Banking
and Finance 40, 80-96.
Brockman, P., Yan, X., 2009. Block ownership and firm-specific information. Journal of Banking and Finance 33, 308–316.
Brown, N., Kimbrough, M., 2011. Intangible investment and the importance of firm-specific factors in the determination of
earnings. Review of Accounting Studies 16, 539–573.
Chan, K., Hameed, A., 2006. Stock price synchronicity and analyst coverage in emerging markets. Journal of Financial
Economics 80, 115-147.
Chen, Q., Goldstein,I., W. Jiang., 2007. Price informativeness and investment sensitivity to stock price. Review of Financial
Studies 20, 619–650.
Chun, H., Kim, J., Morck, R., Yeung, B., 2008. Creative destruction and firm-specific performance heterogeneity. Journal of
Financial Economics 89, 109–135.
Crawford, S., Roulstone, D., So, E., 2012. Analyst initiations of coverage and stock return synchronicity. The Accounting
Review 87, 1527–1553.
Dong, Y., Li, Z., Lin, Y., Ni, C., 2015. Does information processing cost affect firm-sepcific information acquisition?
Evidence from XBRL adoption. Journal of Financial and Quantitative Analysis51, 435-462.
Durnev, A., Morck, R., Yeung, B., Zarowin, P., 2003. Does greater firm-specific return variation mean more or less informed
stock pricing? Journal of Accounting Research 41, 797-836.
Durnev, A., Morck, R., Yeung, B., 2004. Value-enhancing capital budgeting and firm-specific stock return variation. The
Journal of Finance 59, 65-105.
Eun, C. S., Wang, L., Xiao, S. C., 2015. Culture and R2. Journal of Financial Economics115, 283-303.
Fernandes, N., Ferreira, M., 2008. Does international cross-listing improve the information environment? Journal of Financial
Economics 88, 216–244.
Ferreira, D., Ferreira, M., Raposo, C., 2011. Board structure and price informativeness. Journal of Financial Economics 99,
523–545.
Ferreira, M., Laux, P., 2007. Corporate governance, idiosyncratic risk, and information flow. The Journal of Finance 2, 951–
989. Gul, F., Kim, J., Qiu, A., 2010. Ownership concentration, foreign shareholding, audit quality, and stock price synchronicity:
Evidence from China. Journal of Financial Economics 95, 425–442.
Hutton, A., Marcus, A., Tehranian, H., 2009. Opaque financial reports, R2, and crash risk. Journal of Financial Economics 94,
67–86.
Jin, L., Myers, S., 2006. R2 around the world: New theory and new tests. Journal of Financial Economics 79, 257-292.
Jones, J. S., Lee, W. Y., Yeager, T. J., 2013. Valuation and systemic risk consequences of bank opacity. Journal of Banking
and Finance 37, 693-706.
Khanna, T., Thomas, C., 2009. Synchronicity and firm interlocks in an emerging market. Journal of Financial Economics 92,
182–204
Kim, J., Shi, S., 2012. IFRS reporting, firm-specific information flows, and institutional environment: International evidence.
Review of Accounting Studies 17, 474–517.
Morck, R., Yeung, B., Yu, W., 2000. The information content of stock markets: Why do emerging markets have synchronous
stock price movements? Journal of Financial Economics 58, 215-260.
Piotroski, J. D., Roulstone, D. T., 2004. The influence of analysts, institutional investors and insiders on the incorporation of
market, industry and firm-specific information into stock prices. The Accounting Review 79, 1119-1151.
Stowe, J.D., Xing, X., 2011. R2: Does it matter for firm valuation? The Financial Review 46, 233-250.
Sun, Q., Tong, W.H.S., Zhang, X., 2013. How cross-listings from an emerging economy affect the host market? Journal of
Banking and Finance 37, 2229-2245.
Wurgler, J., 2000. Financial markets and the allocation of capital. Journal of Financial Economics 58, 187– 214.

37
Panel B: Articles supporting the interpretation that lower R2 is less informative
Journal Article
Chan, k., Chan, Y., 2014. Price informativeness and stock return synchronicity: Evidence from the pricing of seasoned equity
offerings. Journal of Financial Economics 114, 36-53. Chan, K., Hameed, A., Kang, W., 2013. Stock price synchronicity and liquidity. Journal of Financial Markets 16, 414-438. Dasgupta, S., Gan, J., Gao, N., 2010. Transparency, price informativeness, and stock return synchronicity: Theory and
evidence. Journal of Financial and Quantitative Analysis 45, 1189-1220. Devos, E., Hao, W., Prevost, A.K., Wongchoti, U., 2015. Stock price synchronicity and the market response to analyst
recommendation revisions. Journal of Banking and Finance 58, 376-389. Kelly, P., 2014. Information efficiency and firm-specific return variation. Quarterly Journal of Finance 4, 1450018-1-
1450018-44. Li, B., Rajgopal, S., Venkatachalam, M., 2014. R2 and idiosyncratic risk are not interchangeable. Accounting Review 89, 2261-
2295. Rajgopal, S., Venkatachalam. M., 2011. Financial reporting quality and idiosyncratic return volatility. Journal of Accounting
and Economics 51, 1-20.

38
Appendix 2
Variable Descriptions
Variable Name Description and Source
Panel A: Bond Related Variables
Bond Age Logged difference in years between the issue date and the transaction date. Source: TRACE & FISD
Callable A dummy variable equal to 1 if the bonds are issued with callable provision, 0 otherwise. Source: SDC
(at-issue bonds), TRACE & FISD (seasoned bonds) Putable A dummy variable equal to 1 if the bonds are issued with putable provision, 0 otherwise. Source: SDC
(at-issue bonds), TRACE & FISD (seasoned bonds)
Credit Rating Moody’s bond ratings, where the letter ratings are coded using numbers from 1 (rated as “C”) to 21 (rated
as “Aaa”). Source: SDC (at-issue bonds), TRACE & FISD (seasoned bonds)
Duration Calculated using SAS’ DURP call function (using time to maturity, coupon, yield to maturity). Source:
SDC (at-issue bonds), TRACE & FISD (seasoned bonds)
High Yield A dummy variable equal to 1 if the Moody’s rating is lower than Baa3, 0 otherwise.
Issue Size Log of total USD proceeds of the issue. Source: SDC (at-issue bonds), TRACE & FISD (seasoned bonds)
Maturity Log of number of years to final maturity. Source: SDC (at-issue bonds), TRACE & FISD (seasoned
bonds)
Number of Trades Logged number of trades over the calendar year relevant to the bond transaction date. Source: TRACE &
FISD
Quality Spread The yield difference between Baa and Aaa corporate bond indexes. Source: St Louis Federal Reserve data
repository.
Split Rating Dummy variable equal to one if the S&P and Moody's ratings differ by at least one notch
Split Category Rating Dummy variable equal to one if the S&P and Moody's ratings differ across rating categories
Yield Spread Interpolated yield to Treasury bond yield. Winsorized at the 1 percent level. Source: SDC (at-issue
bonds), TRACE & FISD (seasoned bonds), St. Louis Federal Reserve (T-Bond yields).
Panel B: Firm Related Variables
Analysts Coverage Number of analysts posting forecasts for the sample firm. Source: IBES
Bid Ask Spread Mean of the daily bid ask spread (ASK-BID/((ASK+BID)/2) for 225 days prior to the bond issuance- or
transaction date. Source: CRSP
Market-book Ratio Sum of book value of debt plus market value of equity scaled by total assets. Source: Compustat
Cash Flow Risk Standard deviation of ROA over 5 years prior to the bond issuance or transaction year. Source: Compustat
Capital Expenditure Capital expenditure (CAPEX) divided by total assets. Source: Compustat
Debt Ratio Total debt divided by total assets (LC + DLTT/AT).. Source: Compustat
Dispersion Standard deviation of the inter-analyst forecast divided by the fiscal-year-end stock price. Source: I/B/E/S
Forecast Error Absolute value of the analyst forecast error (the actual EPS minus the median forecast divided by the stock
price). Source: I/B/E/S
Firm size indicator Binary variable equal to one if total assets is greater than the median in a given year. Source: Compustat
Industry concentration Herfindahl Hirschman Index for the issuer’s 3-digit SIC code, calculated as ∑ 𝑠𝑖
2𝑁𝑖=1 , where si is the proportion
of sales of firm I in the issuer’s 3-digit SIC industry and N is the number of firms in the industry. Source:
Compustat
Intangible Assets Intangible assets (INTAN) scaled by total assets (AT). Source: Compustat
Profitability Operating income before depreciation divided by total assets (OIBDP / AT) Source: Compustat
Risk Shifting Potential Indicator variable equal to one if equals zero if discretionary assets and free cash flow are both below the
median of the firm’s SIC2 industry in a given year, equals two if both are greater than their respective
medians, and equals one otherwise.
Sales Growth Growth rate in sales for the 5 years ending the bond issuance year or bond transaction year. Source:
Compustat
Stock Unique Risk Residual of a single factor market model estimated over the 225 days prior to the issue- or transaction date.
Source: CRSP
Stock Volatility Standard deviation of daily stock returns estimated over the 225 days prior to the issue- or transaction date.
Source: CRSP

39
Appendix 2 (cont’d)
Synchronicity log (R2/(1-R2)), where R2 is the regression statistics obtained based on the four factors model. Source: CRSP
(stock prices), Kenneth French’s data library (four factors data)
Underinvestment Potential Indicator variable equal to one if three-year growth in sales is greater than the respective SIC2 industry
median in a given year and if the bond’s maturity is 10 years or greater.
Panel C: Other Control Variables
Yield Curve Slope The yield difference between the 10 year Treasury bonds and 1 year Treasury bonds on the bond
issuance date. Source: SDC (at-issue bonds), TRACE & FISD (seasoned bonds)
Change in Yield Curve Slope Difference in yield curve slope (19-year minus 1-year Treasury rates) from slope six months prior.
Source: St Louis Federal Reserve data repository.
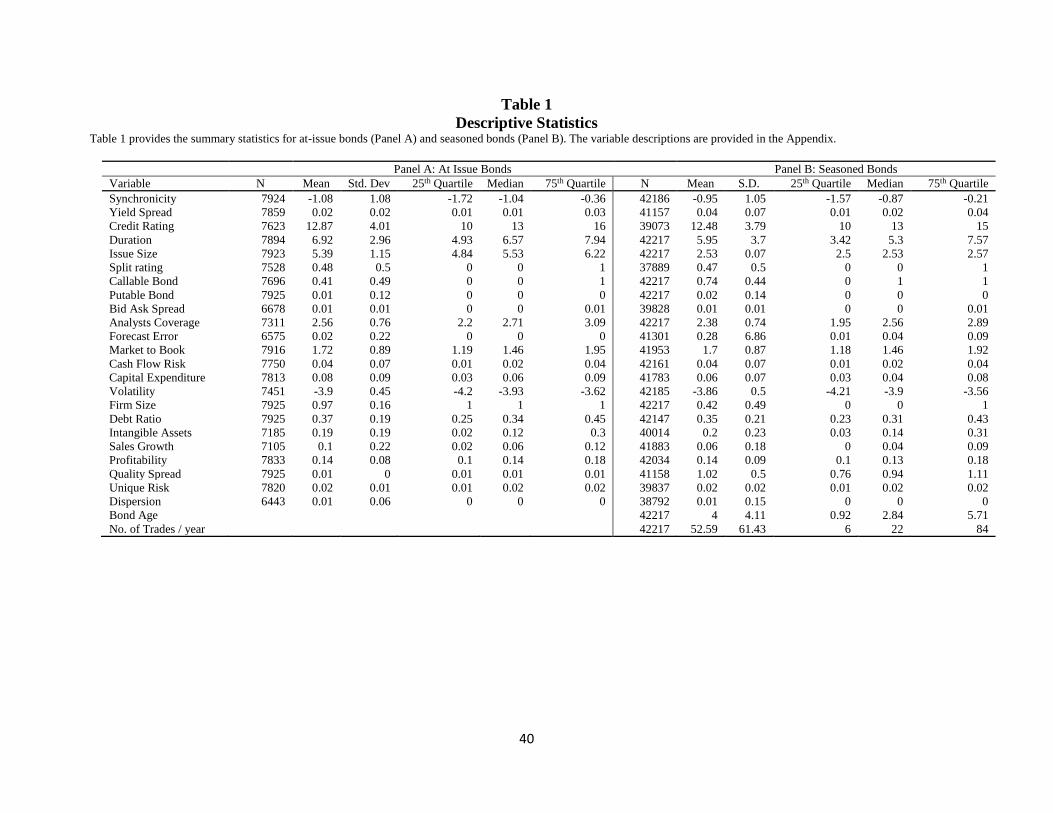
40
Table 1
Descriptive Statistics Table 1 provides the summary statistics for at-issue bonds (Panel A) and seasoned bonds (Panel B). The variable descriptions are provided in the Appendix.
Panel A: At Issue Bonds Panel B: Seasoned Bonds
Variable N Mean Std. Dev 25th Quartile Median 75th Quartile N Mean S.D. 25th Quartile Median 75th Quartile
Synchronicity 7924 -1.08 1.08 -1.72 -1.04 -0.36 42186 -0.95 1.05 -1.57 -0.87 -0.21
Yield Spread 7859 0.02 0.02 0.01 0.01 0.03 41157 0.04 0.07 0.01 0.02 0.04
Credit Rating 7623 12.87 4.01 10 13 16 39073 12.48 3.79 10 13 15
Duration 7894 6.92 2.96 4.93 6.57 7.94 42217 5.95 3.7 3.42 5.3 7.57
Issue Size 7923 5.39 1.15 4.84 5.53 6.22 42217 2.53 0.07 2.5 2.53 2.57
Split rating 7528 0.48 0.5 0 0 1 37889 0.47 0.5 0 0 1
Callable Bond 7696 0.41 0.49 0 0 1 42217 0.74 0.44 0 1 1
Putable Bond 7925 0.01 0.12 0 0 0 42217 0.02 0.14 0 0 0
Bid Ask Spread 6678 0.01 0.01 0 0 0.01 39828 0.01 0.01 0 0 0.01
Analysts Coverage 7311 2.56 0.76 2.2 2.71 3.09 42217 2.38 0.74 1.95 2.56 2.89
Forecast Error 6575 0.02 0.22 0 0 0 41301 0.28 6.86 0.01 0.04 0.09
Market to Book 7916 1.72 0.89 1.19 1.46 1.95 41953 1.7 0.87 1.18 1.46 1.92
Cash Flow Risk 7750 0.04 0.07 0.01 0.02 0.04 42161 0.04 0.07 0.01 0.02 0.04
Capital Expenditure 7813 0.08 0.09 0.03 0.06 0.09 41783 0.06 0.07 0.03 0.04 0.08
Volatility 7451 -3.9 0.45 -4.2 -3.93 -3.62 42185 -3.86 0.5 -4.21 -3.9 -3.56
Firm Size 7925 0.97 0.16 1 1 1 42217 0.42 0.49 0 0 1
Debt Ratio 7925 0.37 0.19 0.25 0.34 0.45 42147 0.35 0.21 0.23 0.31 0.43
Intangible Assets 7185 0.19 0.19 0.02 0.12 0.3 40014 0.2 0.23 0.03 0.14 0.31
Sales Growth 7105 0.1 0.22 0.02 0.06 0.12 41883 0.06 0.18 0 0.04 0.09
Profitability 7833 0.14 0.08 0.1 0.14 0.18 42034 0.14 0.09 0.1 0.13 0.18
Quality Spread 7925 0.01 0 0.01 0.01 0.01 41158 1.02 0.5 0.76 0.94 1.11
Unique Risk 7820 0.02 0.01 0.01 0.02 0.02 39837 0.02 0.02 0.01 0.02 0.02
Dispersion 6443 0.01 0.06 0 0 0 38792 0.01 0.15 0 0 0
Bond Age 42217 4 4.11 0.92 2.84 5.71
No. of Trades / year 42217 52.59 61.43 6 22 84
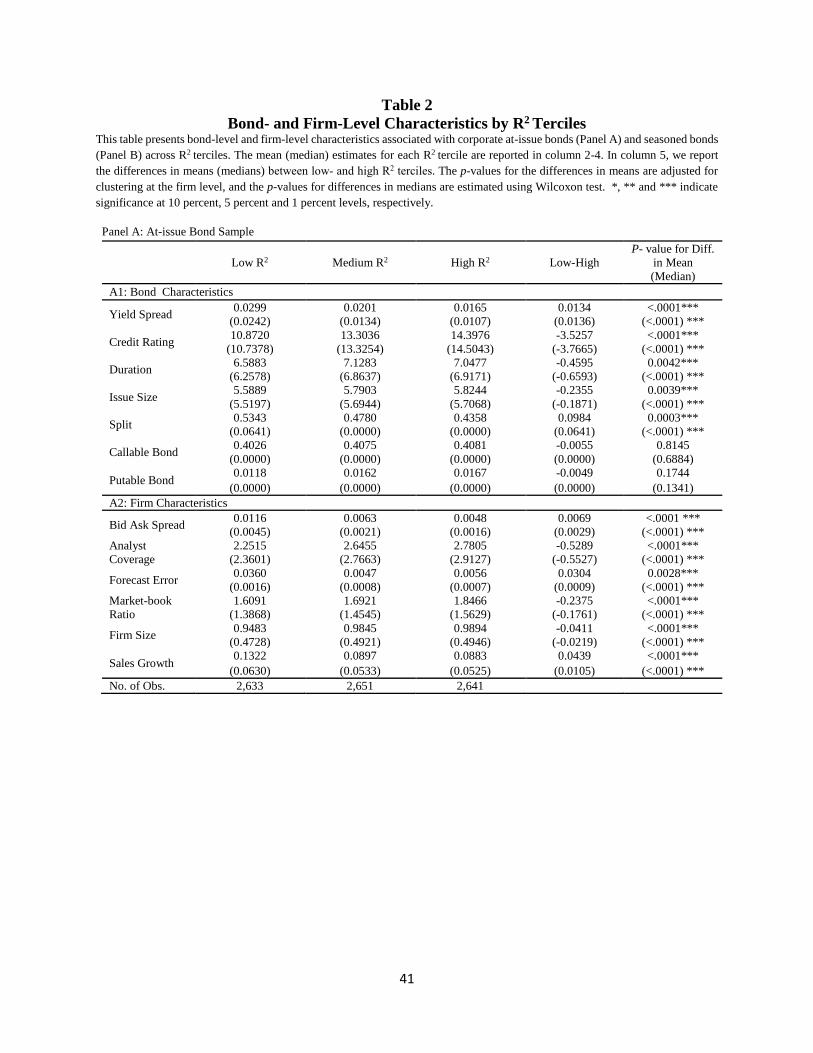
41
Table 2
Bond- and Firm-Level Characteristics by R2 Terciles This table presents bond-level and firm-level characteristics associated with corporate at-issue bonds (Panel A) and seasoned bonds
(Panel B) across R2 terciles. The mean (median) estimates for each R2 tercile are reported in column 2-4. In column 5, we report
the differences in means (medians) between low- and high R2 terciles. The p-values for the differences in means are adjusted for
clustering at the firm level, and the p-values for differences in medians are estimated using Wilcoxon test. *, ** and *** indicate
significance at 10 percent, 5 percent and 1 percent levels, respectively.
Panel A: At-issue Bond Sample
Low R2 Medium R2 High R2 Low-High
P- value for Diff.
in Mean
(Median)
A1: Bond Characteristics
Yield Spread 0.0299 0.0201 0.0165 0.0134 <.0001***
(0.0242) (0.0134) (0.0107) (0.0136) (<.0001) ***
Credit Rating 10.8720 13.3036 14.3976 -3.5257 <.0001***
(10.7378) (13.3254) (14.5043) (-3.7665) (<.0001) ***
Duration 6.5883 7.1283 7.0477 -0.4595 0.0042***
(6.2578) (6.8637) (6.9171) (-0.6593) (<.0001) ***
Issue Size 5.5889 5.7903 5.8244 -0.2355 0.0039***
(5.5197) (5.6944) (5.7068) (-0.1871) (<.0001) ***
Split 0.5343 0.4780 0.4358 0.0984 0.0003***
(0.0641) (0.0000) (0.0000) (0.0641) (<.0001) ***
Callable Bond 0.4026 0.4075 0.4081 -0.0055 0.8145
(0.0000) (0.0000) (0.0000) (0.0000) (0.6884)
Putable Bond 0.0118 0.0162 0.0167 -0.0049 0.1744
(0.0000) (0.0000) (0.0000) (0.0000) (0.1341)
A2: Firm Characteristics
Bid Ask Spread 0.0116 0.0063 0.0048 0.0069 <.0001 ***
(0.0045) (0.0021) (0.0016) (0.0029) (<.0001) ***
Analyst
Coverage
2.2515 2.6455 2.7805 -0.5289 <.0001***
(2.3601) (2.7663) (2.9127) (-0.5527) (<.0001) ***
Forecast Error 0.0360 0.0047 0.0056 0.0304 0.0028***
(0.0016) (0.0008) (0.0007) (0.0009) (<.0001) ***
Market-book
Ratio
1.6091 1.6921 1.8466 -0.2375 <.0001***
(1.3868) (1.4545) (1.5629) (-0.1761) (<.0001) ***
Firm Size 0.9483 0.9845 0.9894 -0.0411 <.0001***
(0.4728) (0.4921) (0.4946) (-0.0219) (<.0001) ***
Sales Growth 0.1322 0.0897 0.0883 0.0439 <.0001***
(0.0630) (0.0533) (0.0525) (0.0105) (<.0001) ***
No. of Obs. 2,633 2,651 2,641
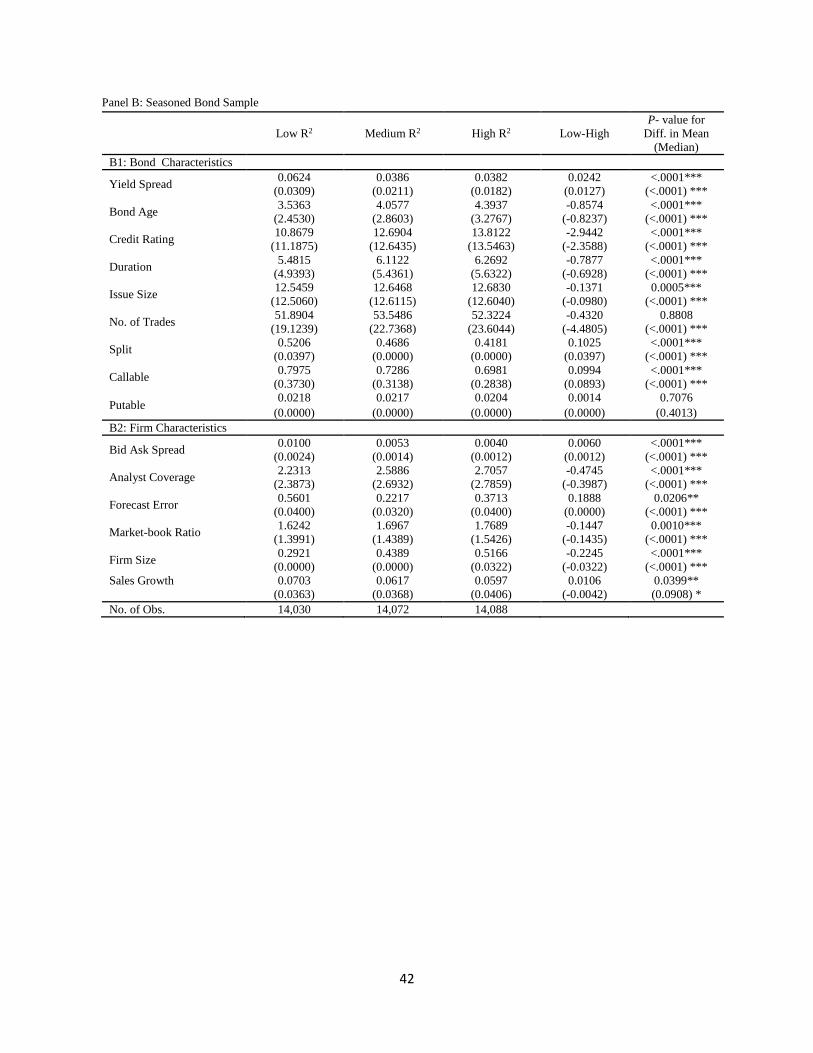
42
Panel B: Seasoned Bond Sample
Low R2 Medium R2 High R2 Low-High
P- value for
Diff. in Mean
(Median)
B1: Bond Characteristics
Yield Spread 0.0624 0.0386 0.0382 0.0242 <.0001***
(0.0309) (0.0211) (0.0182) (0.0127) (<.0001) ***
Bond Age 3.5363 4.0577 4.3937 -0.8574 <.0001***
(2.4530) (2.8603) (3.2767) (-0.8237) (<.0001) ***
Credit Rating 10.8679 12.6904 13.8122 -2.9442 <.0001***
(11.1875) (12.6435) (13.5463) (-2.3588) (<.0001) ***
Duration 5.4815 6.1122 6.2692 -0.7877 <.0001***
(4.9393) (5.4361) (5.6322) (-0.6928) (<.0001) ***
Issue Size 12.5459 12.6468 12.6830 -0.1371 0.0005***
(12.5060) (12.6115) (12.6040) (-0.0980) (<.0001) ***
No. of Trades 51.8904 53.5486 52.3224 -0.4320 0.8808
(19.1239) (22.7368) (23.6044) (-4.4805) (<.0001) ***
Split 0.5206 0.4686 0.4181 0.1025 <.0001***
(0.0397) (0.0000) (0.0000) (0.0397) (<.0001) ***
Callable 0.7975 0.7286 0.6981 0.0994 <.0001***
(0.3730) (0.3138) (0.2838) (0.0893) (<.0001) ***
Putable 0.0218 0.0217 0.0204 0.0014 0.7076
(0.0000) (0.0000) (0.0000) (0.0000) (0.4013)
B2: Firm Characteristics
Bid Ask Spread 0.0100 0.0053 0.0040 0.0060 <.0001***
(0.0024) (0.0014) (0.0012) (0.0012) (<.0001) ***
Analyst Coverage 2.2313 2.5886 2.7057 -0.4745 <.0001***
(2.3873) (2.6932) (2.7859) (-0.3987) (<.0001) ***
Forecast Error 0.5601 0.2217 0.3713 0.1888 0.0206**
(0.0400) (0.0320) (0.0400) (0.0000) (<.0001) ***
Market-book Ratio 1.6242 1.6967 1.7689 -0.1447 0.0010***
(1.3991) (1.4389) (1.5426) (-0.1435) (<.0001) ***
Firm Size 0.2921 0.4389 0.5166 -0.2245 <.0001***
(0.0000) (0.0000) (0.0322) (-0.0322) (<.0001) ***
Sales Growth 0.0703 0.0617 0.0597 0.0106 0.0399**
(0.0363) (0.0368) (0.0406) (-0.0042) (0.0908) *
No. of Obs. 14,030 14,072 14,088

43
Table 3
Pair-wise Correlations This table provides pair-wise correlations between the independent variables used in the cross-sectional analysis. *
indicates significance at the 5 percent level or lower.
Panel A: At-issue Bonds
Synchronicity Analysts
Coverage
Forecast
Error
Market-book
Ratio
Sales
Growth
Bid Ask
Spread
Firm
Size
Synchronicity 1 Analysts Coverage 0.3040* 1 Forecast Error -0.0657* -0.1067* 1 Market-book Ratio 0.0646* 0.2437* -0.0354* 1 Sales Growth -0.1287* -0.0877* 0.0868* 0.1103* 1 Bid Ask Spread -0.5624* -0.3616* 0.1082* -0.1320* 0.0970* 1 Firm Size 0.1297* 0.1907* -0.0103 0.0292* -0.0098 -0.1443* 1
Panel B: Seasoned Bonds
Synchronicity
Analysts
Coverage
Forecast
Error
Market-book
Ratio
Sales
Growth
Bid Ask
Spread
Firm
Size
Synchronicity 1 Analysts Coverage 0.3164* 1 Forecast Error -0.0142* -0.0665* 1 Market-book Ratio 0.0291* 0.2299* -0.0232* 1 Sales Growth -0.1056* -0.0229* 0.0176* 0.0836* 1 Bid Ask Spread -0.5167* -0.3489* 0.0154* -0.1168* 0.0607* 1 Firm Size 0.1787* 0.3582* -0.0248* 0.0411* -0.0503* -0.1541* 1

44
Table 4
Synchronicity and Credit Rating Table 4 provides coefficient estimates of bond credit rating regressed on Synchronicity and additional control variables, for at-issue
bonds (Panel A) and seasoned bonds (Panel B). Standard errors are robust and clustered at two-dimensions (firm and year). *, **
and *** indicate significance at 10 percent, 5 percent and 1 percent levels, respectively.
Panel A: Panel B:
At Issue Bonds Seasoned Bonds
Moody’s Rating Moody’s Rating
Synchronicity 0.5103*** 0.3796***
(0.000) (0.000)
Debt Ratio -4.1440*** -2.5604***
(0.000) (0.002)
Log (Volatility) -1.0452*** -1.9899***
(0.002) (0.000)
Log (Issue Size) 0.3932 2.0168
(0.194) (0.104)
Log (Analyst Coverage) 1.3531*** 0.8961***
(0.000) (0.000)
Market-book Ratio 0.3368*** 0.3985***
(0.001) (0.000)
Sales Growth -1.3878*** -1.0439***
(0.000) (0.000)
Bid Ask Spread 14.0688 4.2575
(0.070) (0.289)
Duration 0.0704*** 0.0721***
(0.000) (0.000)
Firm size indicator 0.2778 0.9569***
(0.181) (0.000)
Profitability 4.6240*** 4.8208***
(0.000) (0.000)
Cash Flow Risk -0.2234 -3.7814***
(0.801) (0.000)
Capital Expenditure -0.9123 0.4622
(0.364) (0.658)
Callable -0.9485*** -0.7628***
(0.000) (0.000)
Putable -0.4598* -0.3807**
(0.040) (0.033)
Quality Spread 36.6316*** 0.2906***
(0.003) (0.000)
Log (Stock unique risk) -2.6159*** -1.7775***
(0.000) (0.000)
Industry concentration 1.6530*** 0.9849
(0.002) (0.177)
Log (Number of Trades) 0.0135 (0.659)
Log (Bond Age) 0.0671***
(0.008)
Fama-French 49 fixed effects Yes Yes
Year Fixed Effects Yes Yes
No. Obs. 6013 33175
Adj. R-square 0.746 0.724
F-statistic 84.8327 76.1080
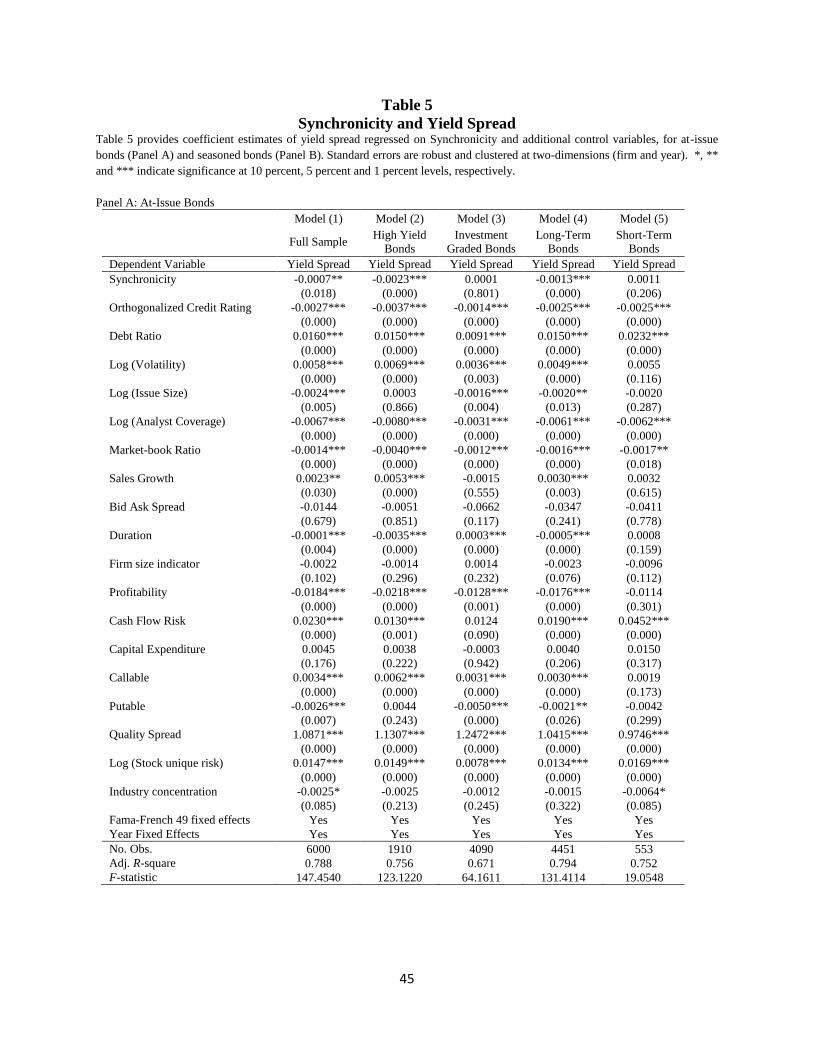
45
Table 5
Synchronicity and Yield Spread Table 5 provides coefficient estimates of yield spread regressed on Synchronicity and additional control variables, for at-issue
bonds (Panel A) and seasoned bonds (Panel B). Standard errors are robust and clustered at two-dimensions (firm and year). *, **
and *** indicate significance at 10 percent, 5 percent and 1 percent levels, respectively.
Panel A: At-Issue Bonds
Model (1) Model (2) Model (3) Model (4) Model (5)
Full Sample High Yield
Bonds
Investment
Graded Bonds
Long-Term
Bonds
Short-Term
Bonds
Dependent Variable Yield Spread Yield Spread Yield Spread Yield Spread Yield Spread
Synchronicity -0.0007** -0.0023*** 0.0001 -0.0013*** 0.0011
(0.018) (0.000) (0.801) (0.000) (0.206)
Orthogonalized Credit Rating -0.0027*** -0.0037*** -0.0014*** -0.0025*** -0.0025***
(0.000) (0.000) (0.000) (0.000) (0.000)
Debt Ratio 0.0160*** 0.0150*** 0.0091*** 0.0150*** 0.0232***
(0.000) (0.000) (0.000) (0.000) (0.000)
Log (Volatility) 0.0058*** 0.0069*** 0.0036*** 0.0049*** 0.0055
(0.000) (0.000) (0.003) (0.000) (0.116)
Log (Issue Size) -0.0024*** 0.0003 -0.0016*** -0.0020** -0.0020
(0.005) (0.866) (0.004) (0.013) (0.287)
Log (Analyst Coverage) -0.0067*** -0.0080*** -0.0031*** -0.0061*** -0.0062***
(0.000) (0.000) (0.000) (0.000) (0.000)
Market-book Ratio -0.0014*** -0.0040*** -0.0012*** -0.0016*** -0.0017**
(0.000) (0.000) (0.000) (0.000) (0.018)
Sales Growth 0.0023** 0.0053*** -0.0015 0.0030*** 0.0032
(0.030) (0.000) (0.555) (0.003) (0.615)
Bid Ask Spread -0.0144 -0.0051 -0.0662 -0.0347 -0.0411
(0.679) (0.851) (0.117) (0.241) (0.778)
Duration -0.0001*** -0.0035*** 0.0003*** -0.0005*** 0.0008
(0.004) (0.000) (0.000) (0.000) (0.159)
Firm size indicator -0.0022 -0.0014 0.0014 -0.0023 -0.0096
(0.102) (0.296) (0.232) (0.076) (0.112)
Profitability -0.0184*** -0.0218*** -0.0128*** -0.0176*** -0.0114
(0.000) (0.000) (0.001) (0.000) (0.301)
Cash Flow Risk 0.0230*** 0.0130*** 0.0124 0.0190*** 0.0452***
(0.000) (0.001) (0.090) (0.000) (0.000)
Capital Expenditure 0.0045 0.0038 -0.0003 0.0040 0.0150
(0.176) (0.222) (0.942) (0.206) (0.317)
Callable 0.0034*** 0.0062*** 0.0031*** 0.0030*** 0.0019
(0.000) (0.000) (0.000) (0.000) (0.173)
Putable -0.0026*** 0.0044 -0.0050*** -0.0021** -0.0042
(0.007) (0.243) (0.000) (0.026) (0.299)
Quality Spread 1.0871*** 1.1307*** 1.2472*** 1.0415*** 0.9746***
(0.000) (0.000) (0.000) (0.000) (0.000)
Log (Stock unique risk) 0.0147*** 0.0149*** 0.0078*** 0.0134*** 0.0169***
(0.000) (0.000) (0.000) (0.000) (0.000)
Industry concentration -0.0025* -0.0025 -0.0012 -0.0015 -0.0064*
(0.085) (0.213) (0.245) (0.322) (0.085)
Fama-French 49 fixed effects Yes Yes Yes Yes Yes
Year Fixed Effects Yes Yes Yes Yes Yes
No. Obs. 6000 1910 4090 4451 553
Adj. R-square 0.788 0.756 0.671 0.794 0.752
F-statistic 147.4540 123.1220 64.1611 131.4114 19.0548
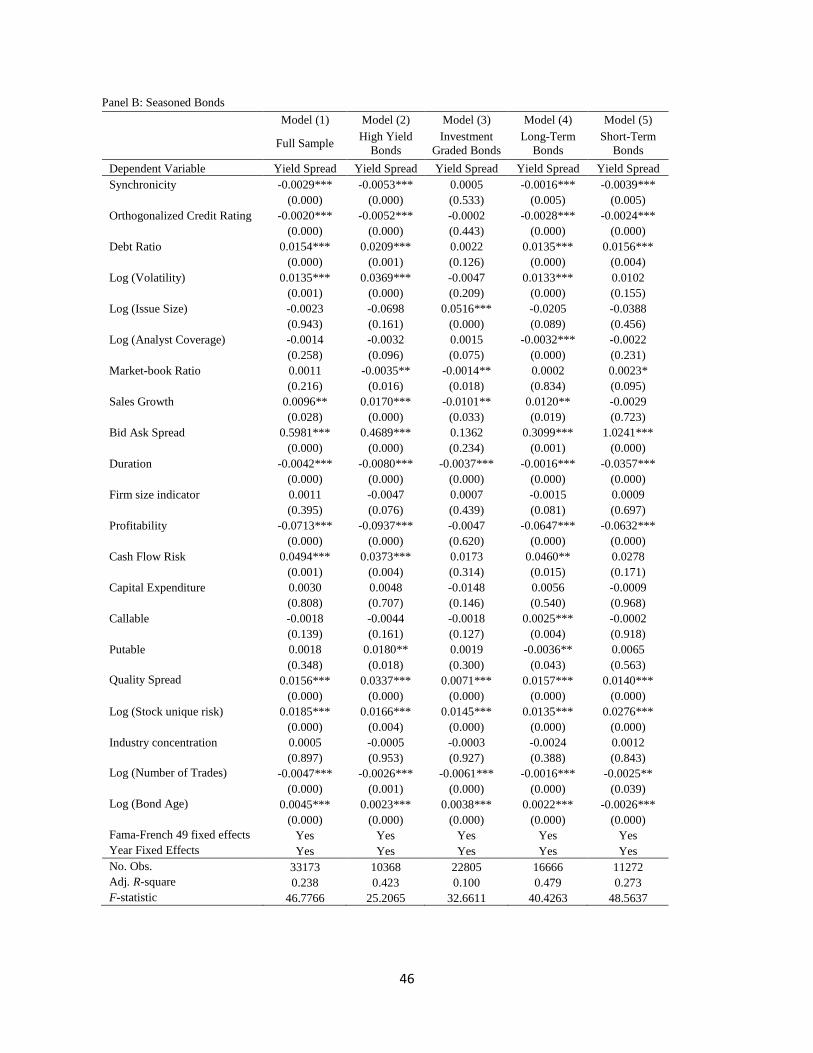
46
Panel B: Seasoned Bonds
Model (1) Model (2) Model (3) Model (4) Model (5)
Full Sample High Yield
Bonds
Investment
Graded Bonds
Long-Term
Bonds
Short-Term
Bonds
Dependent Variable Yield Spread Yield Spread Yield Spread Yield Spread Yield Spread
Synchronicity -0.0029*** -0.0053*** 0.0005 -0.0016*** -0.0039***
(0.000) (0.000) (0.533) (0.005) (0.005)
Orthogonalized Credit Rating -0.0020*** -0.0052*** -0.0002 -0.0028*** -0.0024***
(0.000) (0.000) (0.443) (0.000) (0.000)
Debt Ratio 0.0154*** 0.0209*** 0.0022 0.0135*** 0.0156***
(0.000) (0.001) (0.126) (0.000) (0.004)
Log (Volatility) 0.0135*** 0.0369*** -0.0047 0.0133*** 0.0102
(0.001) (0.000) (0.209) (0.000) (0.155)
Log (Issue Size) -0.0023 -0.0698 0.0516*** -0.0205 -0.0388
(0.943) (0.161) (0.000) (0.089) (0.456)
Log (Analyst Coverage) -0.0014 -0.0032 0.0015 -0.0032*** -0.0022
(0.258) (0.096) (0.075) (0.000) (0.231)
Market-book Ratio 0.0011 -0.0035** -0.0014** 0.0002 0.0023*
(0.216) (0.016) (0.018) (0.834) (0.095)
Sales Growth 0.0096** 0.0170*** -0.0101** 0.0120** -0.0029
(0.028) (0.000) (0.033) (0.019) (0.723)
Bid Ask Spread 0.5981*** 0.4689*** 0.1362 0.3099*** 1.0241***
(0.000) (0.000) (0.234) (0.001) (0.000)
Duration -0.0042*** -0.0080*** -0.0037*** -0.0016*** -0.0357***
(0.000) (0.000) (0.000) (0.000) (0.000)
Firm size indicator 0.0011 -0.0047 0.0007 -0.0015 0.0009
(0.395) (0.076) (0.439) (0.081) (0.697)
Profitability -0.0713*** -0.0937*** -0.0047 -0.0647*** -0.0632***
(0.000) (0.000) (0.620) (0.000) (0.000)
Cash Flow Risk 0.0494*** 0.0373*** 0.0173 0.0460** 0.0278
(0.001) (0.004) (0.314) (0.015) (0.171)
Capital Expenditure 0.0030 0.0048 -0.0148 0.0056 -0.0009
(0.808) (0.707) (0.146) (0.540) (0.968)
Callable -0.0018 -0.0044 -0.0018 0.0025*** -0.0002
(0.139) (0.161) (0.127) (0.004) (0.918)
Putable 0.0018 0.0180** 0.0019 -0.0036** 0.0065
(0.348) (0.018) (0.300) (0.043) (0.563)
Quality Spread 0.0156*** 0.0337*** 0.0071*** 0.0157*** 0.0140***
(0.000) (0.000) (0.000) (0.000) (0.000)
Log (Stock unique risk) 0.0185*** 0.0166*** 0.0145*** 0.0135*** 0.0276***
(0.000) (0.004) (0.000) (0.000) (0.000)
Industry concentration 0.0005 -0.0005 -0.0003 -0.0024 0.0012
(0.897) (0.953) (0.927) (0.388) (0.843)
Log (Number of Trades) -0.0047*** -0.0026*** -0.0061*** -0.0016*** -0.0025** (0.000) (0.001) (0.000) (0.000) (0.039)
Log (Bond Age) 0.0045*** 0.0023*** 0.0038*** 0.0022*** -0.0026***
(0.000) (0.000) (0.000) (0.000) (0.000)
Fama-French 49 fixed effects Yes Yes Yes Yes Yes
Year Fixed Effects Yes Yes Yes Yes Yes
No. Obs. 33173 10368 22805 16666 11272
Adj. R-square 0.238 0.423 0.100 0.479 0.273
F-statistic 46.7766 25.2065 32.6611 40.4263 48.5637
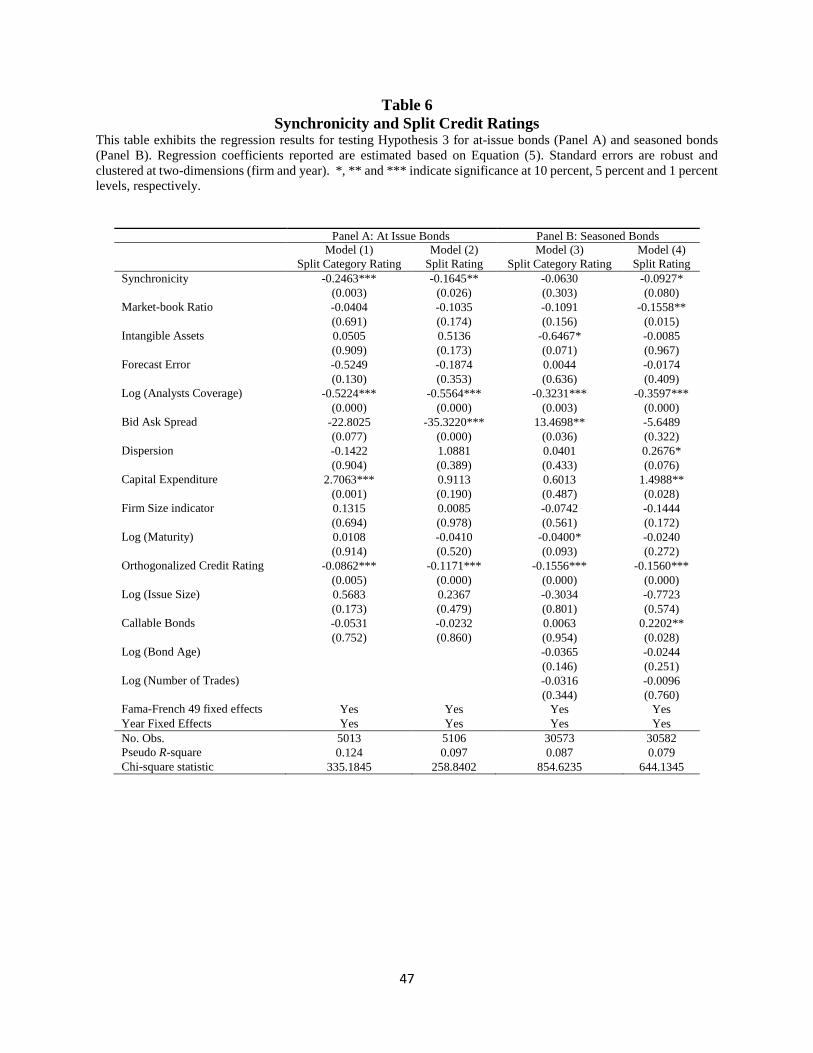
47
Table 6
Synchronicity and Split Credit Ratings This table exhibits the regression results for testing Hypothesis 3 for at-issue bonds (Panel A) and seasoned bonds
(Panel B). Regression coefficients reported are estimated based on Equation (5). Standard errors are robust and
clustered at two-dimensions (firm and year). *, ** and *** indicate significance at 10 percent, 5 percent and 1 percent
levels, respectively.
Panel A: At Issue Bonds Panel B: Seasoned Bonds
Model (1) Model (2) Model (3) Model (4)
Split Category Rating Split Rating Split Category Rating Split Rating
Synchronicity -0.2463*** -0.1645** -0.0630 -0.0927* (0.003) (0.026) (0.303) (0.080)
Market-book Ratio -0.0404 -0.1035 -0.1091 -0.1558** (0.691) (0.174) (0.156) (0.015)
Intangible Assets 0.0505 0.5136 -0.6467* -0.0085 (0.909) (0.173) (0.071) (0.967)
Forecast Error -0.5249 -0.1874 0.0044 -0.0174 (0.130) (0.353) (0.636) (0.409)
Log (Analysts Coverage) -0.5224*** -0.5564*** -0.3231*** -0.3597*** (0.000) (0.000) (0.003) (0.000)
Bid Ask Spread -22.8025 -35.3220*** 13.4698** -5.6489 (0.077) (0.000) (0.036) (0.322)
Dispersion -0.1422 1.0881 0.0401 0.2676* (0.904) (0.389) (0.433) (0.076)
Capital Expenditure 2.7063*** 0.9113 0.6013 1.4988** (0.001) (0.190) (0.487) (0.028)
Firm Size indicator 0.1315 0.0085 -0.0742 -0.1444 (0.694) (0.978) (0.561) (0.172)
Log (Maturity) 0.0108 -0.0410 -0.0400* -0.0240 (0.914) (0.520) (0.093) (0.272)
Orthogonalized Credit Rating -0.0862*** -0.1171*** -0.1556*** -0.1560*** (0.005) (0.000) (0.000) (0.000)
Log (Issue Size) 0.5683 0.2367 -0.3034 -0.7723 (0.173) (0.479) (0.801) (0.574)
Callable Bonds -0.0531 -0.0232 0.0063 0.2202** (0.752) (0.860) (0.954) (0.028)
Log (Bond Age) -0.0365 -0.0244 (0.146) (0.251)
Log (Number of Trades) -0.0316 -0.0096 (0.344) (0.760)
Fama-French 49 fixed effects Yes Yes Yes Yes
Year Fixed Effects Yes Yes Yes Yes
No. Obs. 5013 5106 30573 30582
Pseudo R-square 0.124 0.097 0.087 0.079
Chi-square statistic 335.1845 258.8402 854.6235 644.1345
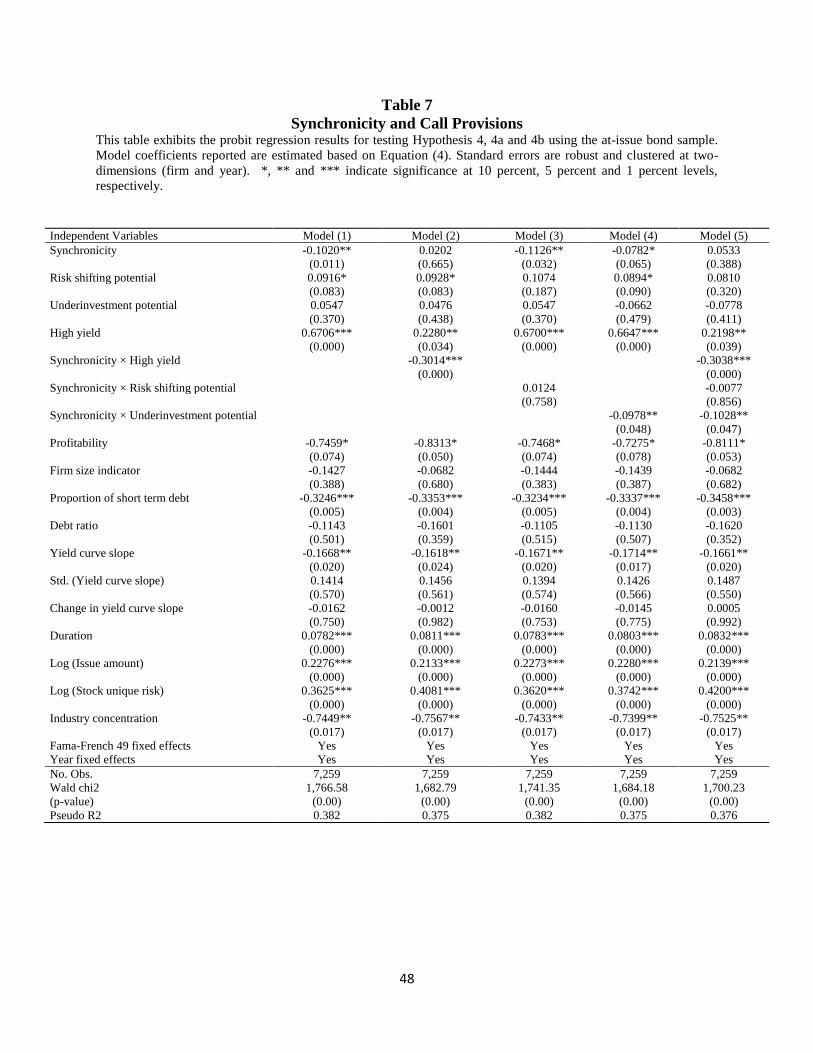
48
Table 7
Synchronicity and Call Provisions This table exhibits the probit regression results for testing Hypothesis 4, 4a and 4b using the at-issue bond sample.
Model coefficients reported are estimated based on Equation (4). Standard errors are robust and clustered at two-
dimensions (firm and year). *, ** and *** indicate significance at 10 percent, 5 percent and 1 percent levels,
respectively.
Independent Variables Model (1) Model (2) Model (3) Model (4) Model (5)
Synchronicity -0.1020** 0.0202 -0.1126** -0.0782* 0.0533
(0.011) (0.665) (0.032) (0.065) (0.388)
Risk shifting potential 0.0916* 0.0928* 0.1074 0.0894* 0.0810
(0.083) (0.083) (0.187) (0.090) (0.320)
Underinvestment potential 0.0547 0.0476 0.0547 -0.0662 -0.0778
(0.370) (0.438) (0.370) (0.479) (0.411)
High yield 0.6706*** 0.2280** 0.6700*** 0.6647*** 0.2198**
(0.000) (0.034) (0.000) (0.000) (0.039)
Synchronicity × High yield -0.3014*** -0.3038***
(0.000) (0.000)
Synchronicity × Risk shifting potential 0.0124 -0.0077
(0.758) (0.856)
Synchronicity × Underinvestment potential -0.0978** -0.1028**
(0.048) (0.047)
Profitability -0.7459* -0.8313* -0.7468* -0.7275* -0.8111*
(0.074) (0.050) (0.074) (0.078) (0.053)
Firm size indicator -0.1427 -0.0682 -0.1444 -0.1439 -0.0682
(0.388) (0.680) (0.383) (0.387) (0.682)
Proportion of short term debt -0.3246*** -0.3353*** -0.3234*** -0.3337*** -0.3458***
(0.005) (0.004) (0.005) (0.004) (0.003)
Debt ratio -0.1143 -0.1601 -0.1105 -0.1130 -0.1620
(0.501) (0.359) (0.515) (0.507) (0.352)
Yield curve slope -0.1668** -0.1618** -0.1671** -0.1714** -0.1661**
(0.020) (0.024) (0.020) (0.017) (0.020)
Std. (Yield curve slope) 0.1414 0.1456 0.1394 0.1426 0.1487
(0.570) (0.561) (0.574) (0.566) (0.550)
Change in yield curve slope -0.0162 -0.0012 -0.0160 -0.0145 0.0005
(0.750) (0.982) (0.753) (0.775) (0.992)
Duration 0.0782*** 0.0811*** 0.0783*** 0.0803*** 0.0832***
(0.000) (0.000) (0.000) (0.000) (0.000)
Log (Issue amount) 0.2276*** 0.2133*** 0.2273*** 0.2280*** 0.2139***
(0.000) (0.000) (0.000) (0.000) (0.000)
Log (Stock unique risk) 0.3625*** 0.4081*** 0.3620*** 0.3742*** 0.4200***
(0.000) (0.000) (0.000) (0.000) (0.000)
Industry concentration -0.7449** -0.7567** -0.7433** -0.7399** -0.7525**
(0.017) (0.017) (0.017) (0.017) (0.017)
Fama-French 49 fixed effects Yes Yes Yes Yes Yes
Year fixed effects Yes Yes Yes Yes Yes
No. Obs. 7,259 7,259 7,259 7,259 7,259
Wald chi2 1,766.58 1,682.79 1,741.35 1,684.18 1,700.23
(p-value) (0.00) (0.00) (0.00) (0.00) (0.00)
Pseudo R2 0.382 0.375 0.382 0.375 0.376