Embed Size (px)
Citation preview
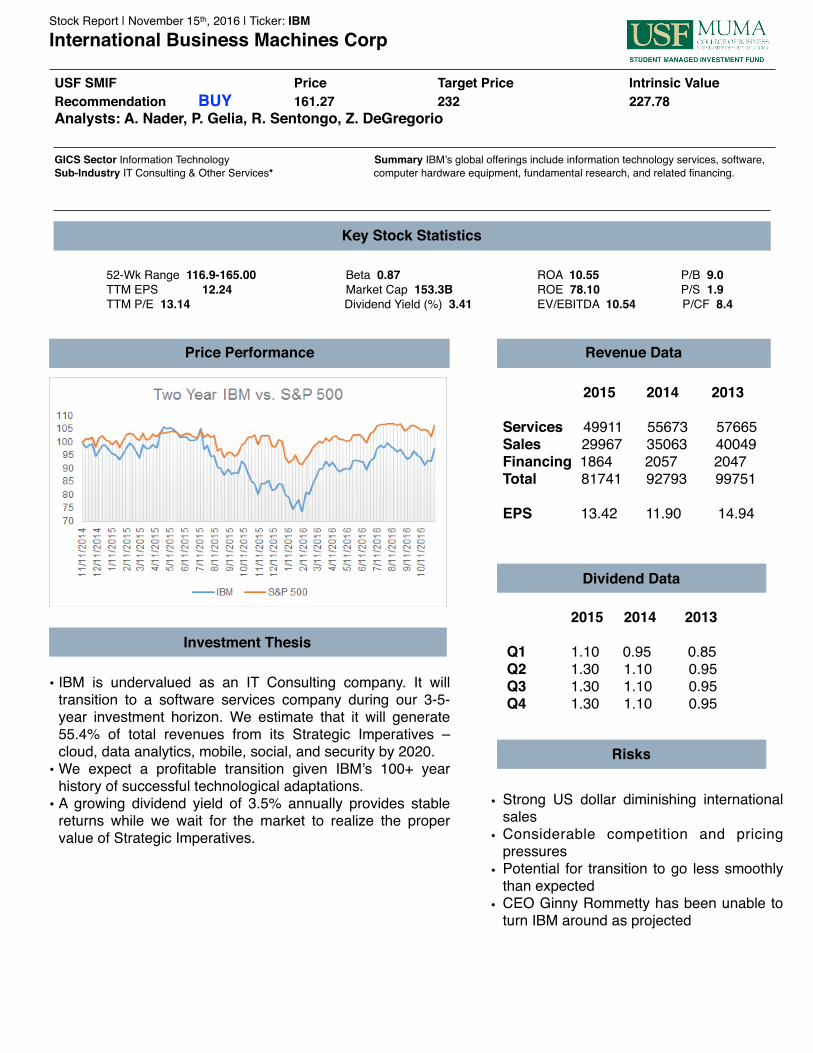
Stock Report | November 15th, 2016 | Ticker: IBMInternational Business Machines Corp
USF SMIF Price Target Price Intrinsic ValueRecommendation BUY 161.27 232 227.78Analysts: A. Nader, P. Gelia, R. Sentongo, Z. DeGregorio
GICS Sector Information Technology Summary IBM’s global offerings include information technology services, software,Sub-Industry IT Consulting & Other Services* computer hardware equipment, fundamental research, and related financing.
52-Wk Range 116.9-165.00 Beta 0.87 ROA 10.55 P/B 9.0TTM EPS 12.24 Market Cap 153.3B ROE 78.10 P/S 1.9TTM P/E 13.14 Dividend Yield (%) 3.41 EV/EBITDA 10.54 P/CF 8.4
Price Performance
Key Stock Statistics
Revenue Data
2015 2014 2013
Services 49911 55673 57665 Sales 29967 35063 40049 Financing 1864 2057 2047 Total 81741 92793 99751
EPS 13.42 11.90 14.94
Dividend Data
2015 2014 2013
Q1 1.10 0.95 0.85 Q2 1.30 1.10 0.95Q3 1.30 1.10 0.95Q4 1.30 1.10 0.95
Investment Thesis
• IBM is undervalued as an IT Consulting company. It will transition to a software services company during our 3-5-year investment horizon. We estimate that it will generate 55.4% of total revenues from its Strategic Imperatives – cloud, data analytics, mobile, social, and security by 2020.
• We expect a profitable transition given IBM’s 100+ year history of successful technological adaptations.
• A growing dividend yield of 3.5% annually provides stable returns while we wait for the market to realize the proper value of Strategic Imperatives.
Risks
• Strong US dollar diminishing international sales
• Considerable competition and pricing pressures
• Potential for transition to go less smoothly than expected
• CEO Ginny Rommetty has been unable to turn IBM around as projected
Stock Report | November 15th, 2016 | Ticker: IBMInternational Business Machines Corp
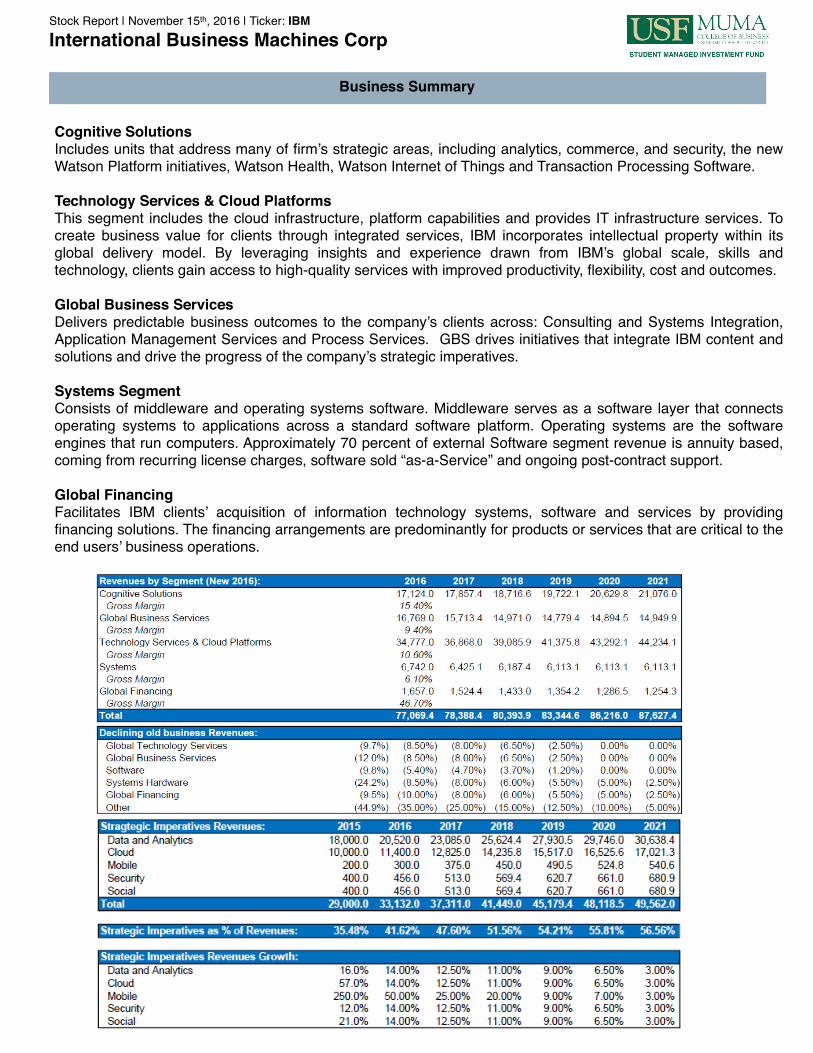
Cognitive SolutionsIncludes units that address many of firm’s strategic areas, including analytics, commerce, and security, the new Watson Platform initiatives, Watson Health, Watson Internet of Things and Transaction Processing Software.
Technology Services & Cloud PlatformsThis segment includes the cloud infrastructure, platform capabilities and provides IT infrastructure services. To create business value for clients through integrated services, IBM incorporates intellectual property within its global delivery model. By leveraging insights and experience drawn from IBM’s global scale, skills and technology, clients gain access to high-quality services with improved productivity, flexibility, cost and outcomes.
Global Business ServicesDelivers predictable business outcomes to the company’s clients across: Consulting and Systems Integration, Application Management Services and Process Services. GBS drives initiatives that integrate IBM content and solutions and drive the progress of the company’s strategic imperatives.
Systems Segment Consists of middleware and operating systems software. Middleware serves as a software layer that connects operating systems to applications across a standard software platform. Operating systems are the software engines that run computers. Approximately 70 percent of external Software segment revenue is annuity based, coming from recurring license charges, software sold “as-a-Service” and ongoing post-contract support.
Global FinancingFacilitates IBM clients’ acquisition of information technology systems, software and services by providing financing solutions. The financing arrangements are predominantly for products or services that are critical to the end users’ business operations.
Business Summary
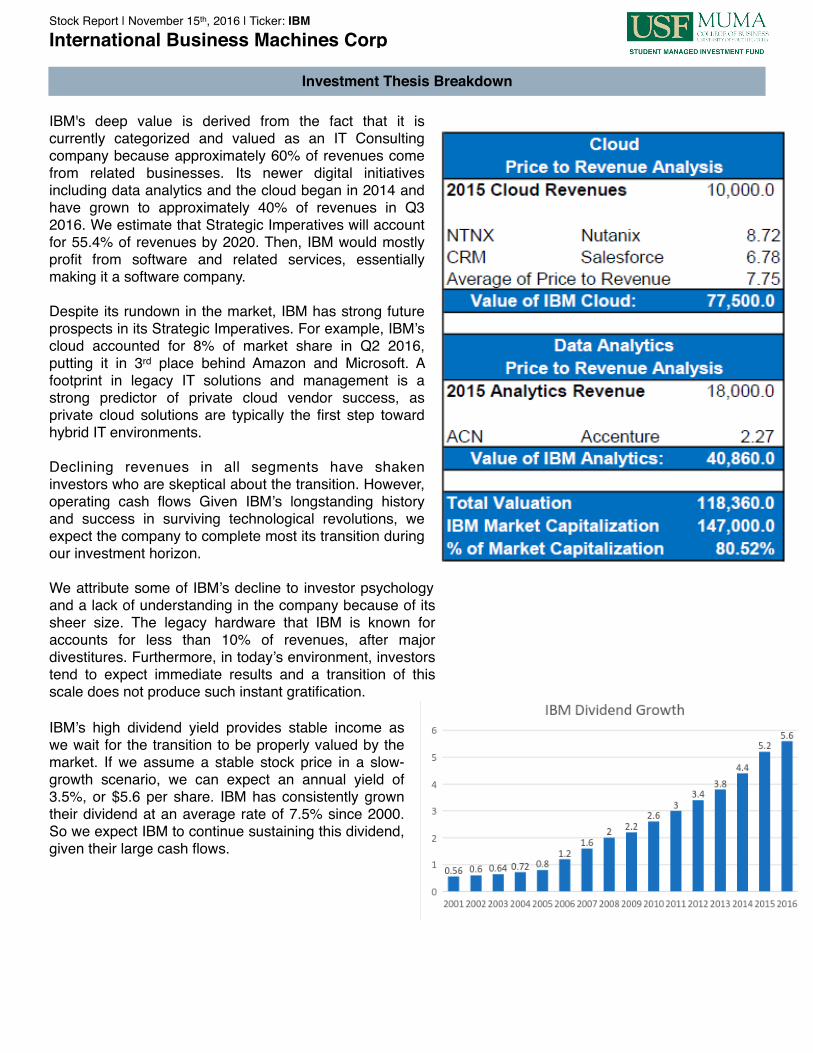
IBM's deep value is derived from the fact that it is currently categorized and valued as an IT Consulting company because approximately 60% of revenues come from related businesses. Its newer digital initiatives including data analytics and the cloud began in 2014 and have grown to approximately 40% of revenues in Q3 2016. We estimate that Strategic Imperatives will account for 55.4% of revenues by 2020. Then, IBM would mostly profit from software and related services, essentially making it a software company.
Despite its rundown in the market, IBM has strong future prospects in its Strategic Imperatives. For example, IBM’s cloud accounted for 8% of market share in Q2 2016, putting it in 3rd place behind Amazon and Microsoft. A footprint in legacy IT solutions and management is a strong predictor of private cloud vendor success, as private cloud solutions are typically the first step toward hybrid IT environments.
Declining revenues in all segments have shaken investors who are skeptical about the transition. However, operating cash flows Given IBM’s longstanding history and success in surviving technological revolutions, we expect the company to complete most its transition during our investment horizon.
We attribute some of IBM’s decline to investor psychology and a lack of understanding in the company because of its sheer size. The legacy hardware that IBM is known for accounts for less than 10% of revenues, after major divestitures. Furthermore, in today’s environment, investors tend to expect immediate results and a transition of this scale does not produce such instant gratification.
IBM’s high dividend yield provides stable income as we wait for the transition to be properly valued by the market. If we assume a stable stock price in a slow-growth scenario, we can expect an annual yield of 3.5%, or $5.6 per share. IBM has consistently grown their dividend at an average rate of 7.5% since 2000. So we expect IBM to continue sustaining this dividend, given their large cash flows.
Stock Report | November 15th, 2016 | Ticker: IBMInternational Business Machines Corp
Investment Thesis Breakdown
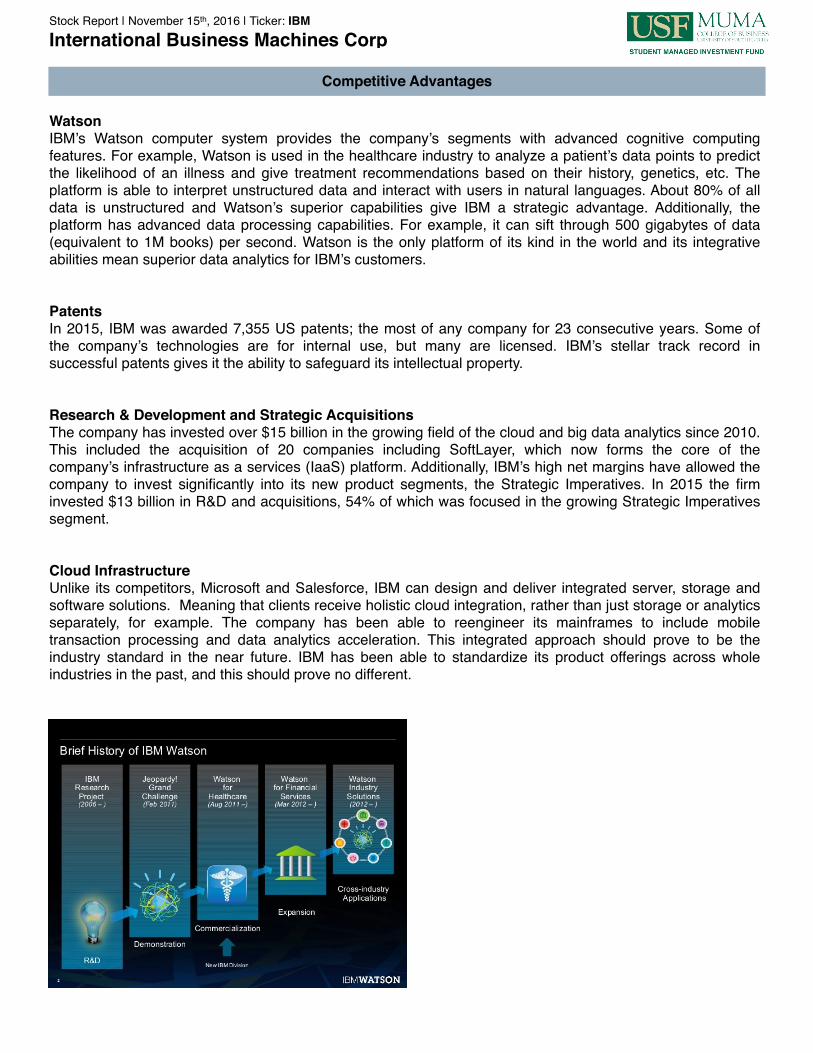
WatsonIBM’s Watson computer system provides the company’s segments with advanced cognitive computing features. For example, Watson is used in the healthcare industry to analyze a patient’s data points to predict the likelihood of an illness and give treatment recommendations based on their history, genetics, etc. The platform is able to interpret unstructured data and interact with users in natural languages. About 80% of all data is unstructured and Watson’s superior capabilities give IBM a strategic advantage. Additionally, the platform has advanced data processing capabilities. For example, it can sift through 500 gigabytes of data (equivalent to 1M books) per second. Watson is the only platform of its kind in the world and its integrative abilities mean superior data analytics for IBM’s customers.
PatentsIn 2015, IBM was awarded 7,355 US patents; the most of any company for 23 consecutive years. Some of the company’s technologies are for internal use, but many are licensed. IBM’s stellar track record in successful patents gives it the ability to safeguard its intellectual property.
Research & Development and Strategic AcquisitionsThe company has invested over $15 billion in the growing field of the cloud and big data analytics since 2010. This included the acquisition of 20 companies including SoftLayer, which now forms the core of the company’s infrastructure as a services (IaaS) platform. Additionally, IBM’s high net margins have allowed the company to invest significantly into its new product segments, the Strategic Imperatives. In 2015 the firm invested $13 billion in R&D and acquisitions, 54% of which was focused in the growing Strategic Imperatives segment.
Cloud InfrastructureUnlike its competitors, Microsoft and Salesforce, IBM can design and deliver integrated server, storage and software solutions. Meaning that clients receive holistic cloud integration, rather than just storage or analytics separately, for example. The company has been able to reengineer its mainframes to include mobile transaction processing and data analytics acceleration. This integrated approach should prove to be the industry standard in the near future. IBM has been able to standardize its product offerings across whole industries in the past, and this should prove no different.
Stock Report | November 15th, 2016 | Ticker: IBMInternational Business Machines Corp
Competitive Advantages
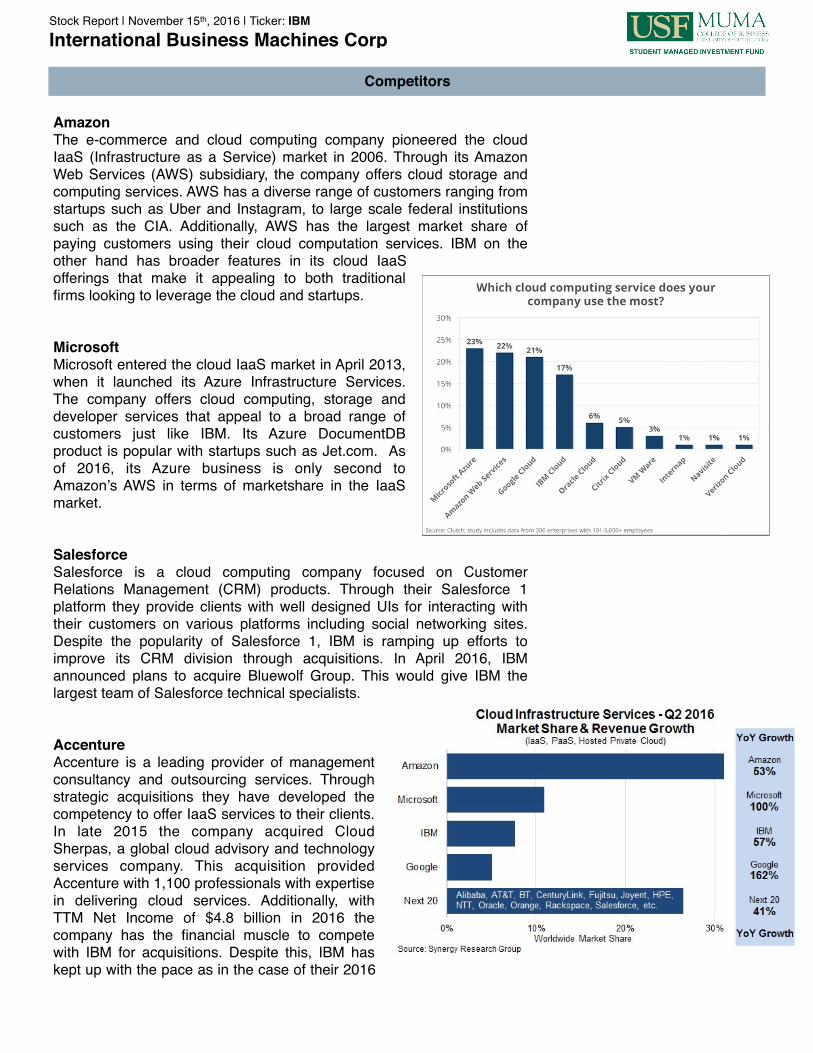
AmazonThe e-commerce and cloud computing company pioneered the cloud IaaS (Infrastructure as a Service) market in 2006. Through its Amazon Web Services (AWS) subsidiary, the company offers cloud storage and computing services. AWS has a diverse range of customers ranging from startups such as Uber and Instagram, to large scale federal institutions such as the CIA. Additionally, AWS has the largest market share of paying customers using their cloud computation services. IBM on the other hand has broader features in its cloud IaaS offerings that make it appealing to both traditional firms looking to leverage the cloud and startups.
MicrosoftMicrosoft entered the cloud IaaS market in April 2013, when it launched its Azure Infrastructure Services. The company offers cloud computing, storage and developer services that appeal to a broad range of customers just like IBM. Its Azure DocumentDB product is popular with startups such as Jet.com. As of 2016, its Azure business is only second to Amazon’s AWS in terms of marketshare in the IaaS market.
SalesforceSalesforce is a cloud computing company focused on Customer Relations Management (CRM) products. Through their Salesforce 1 platform they provide clients with well designed UIs for interacting with their customers on various platforms including social networking sites. Despite the popularity of Salesforce 1, IBM is ramping up efforts to improve its CRM division through acquisitions. In April 2016, IBM announced plans to acquire Bluewolf Group. This would give IBM the largest team of Salesforce technical specialists.
AccentureAccenture is a leading provider of management consultancy and outsourcing services. Through strategic acquisitions they have developed the competency to offer IaaS services to their clients. In late 2015 the company acquired Cloud Sherpas, a global cloud advisory and technology services company. This acquisition provided Accenture with 1,100 professionals with expertise in delivering cloud services. Additionally, with TTM Net Income of $4.8 billion in 2016 the company has the financial muscle to compete with IBM for acquisitions. Despite this, IBM has kept up with the pace as in the case of their 2016
Competitors
Stock Report | November 15th, 2016 | Ticker: IBMInternational Business Machines Corp
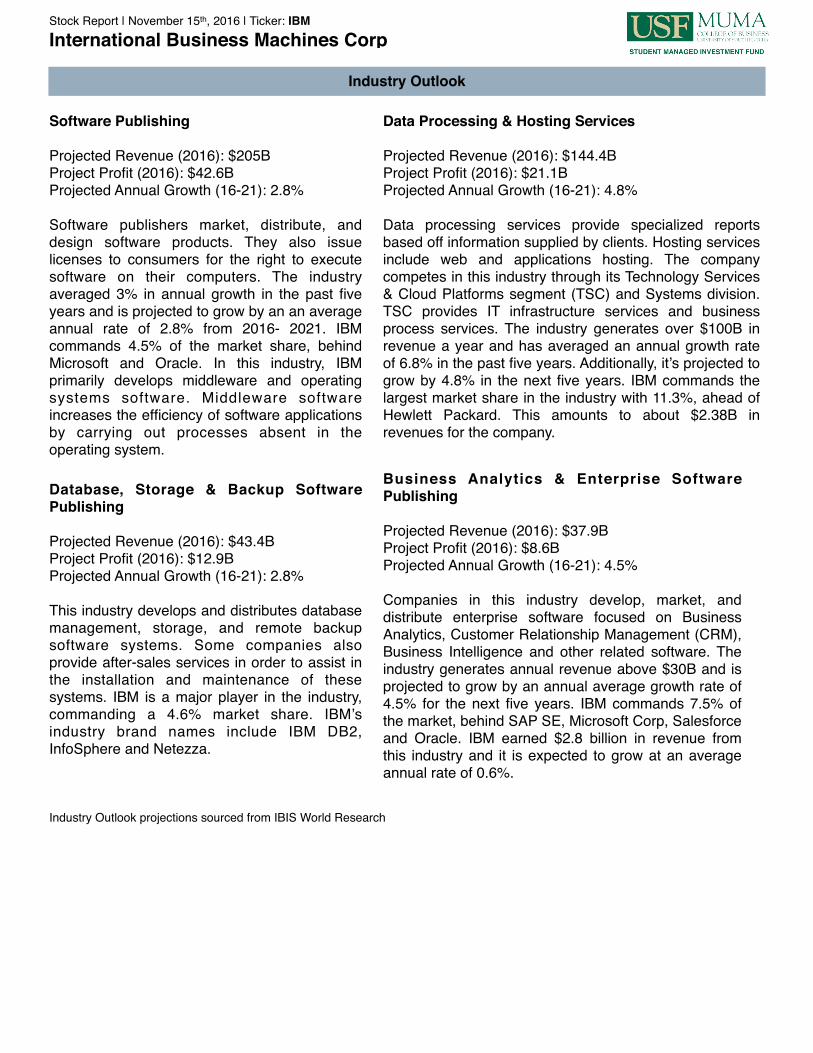
Software Publishing
Projected Revenue (2016): $205B Project Profit (2016): $42.6BProjected Annual Growth (16-21): 2.8%
Software publishers market, distribute, and design software products. They also issue licenses to consumers for the right to execute software on their computers. The industry averaged 3% in annual growth in the past five years and is projected to grow by an an average annual rate of 2.8% from 2016- 2021. IBM commands 4.5% of the market share, behind Microsoft and Oracle. In this industry, IBM primarily develops middleware and operating systems software. Middleware software increases the efficiency of software applications by carrying out processes absent in the operating system.
Data Processing & Hosting Services
Projected Revenue (2016): $144.4BProject Profit (2016): $21.1BProjected Annual Growth (16-21): 4.8%
Data processing services provide specialized reports based off information supplied by clients. Hosting services include web and applications hosting. The company competes in this industry through its Technology Services & Cloud Platforms segment (TSC) and Systems division. TSC provides IT infrastructure services and business process services. The industry generates over $100B in revenue a year and has averaged an annual growth rate of 6.8% in the past five years. Additionally, it’s projected to grow by 4.8% in the next five years. IBM commands the largest market share in the industry with 11.3%, ahead of Hewlett Packard. This amounts to about $2.38B in revenues for the company.
Database, Storage & Backup Software Publishing
Projected Revenue (2016): $43.4B Project Profit (2016): $12.9BProjected Annual Growth (16-21): 2.8%
This industry develops and distributes database management, storage, and remote backup software systems. Some companies also provide after-sales services in order to assist in the installation and maintenance of these systems. IBM is a major player in the industry, commanding a 4.6% market share. IBM’s industry brand names include IBM DB2, InfoSphere and Netezza.
Business Analytics & Enterprise Software Publishing
Projected Revenue (2016): $37.9BProject Profit (2016): $8.6BProjected Annual Growth (16-21): 4.5%
Companies in this industry develop, market, and distribute enterprise software focused on Business Analytics, Customer Relationship Management (CRM), Business Intelligence and other related software. The industry generates annual revenue above $30B and is projected to grow by an annual average growth rate of 4.5% for the next five years. IBM commands 7.5% of the market, behind SAP SE, Microsoft Corp, Salesforce and Oracle. IBM earned $2.8 billion in revenue from this industry and it is expected to grow at an average annual rate of 0.6%.
Industry Outlook projections sourced from IBIS World Research
Stock Report | November 15th, 2016 | Ticker: IBMInternational Business Machines Corp
Industry Outlook

Our FCFE model shows IBM’s intrinsic value at an amount of $227.78 per share. The current stock price for IBM is discounted by 40.46% according to our research. We calculated the FCFE from the amounts we projected for our pro forma financial statements. IBM is a mature company with massive cash flows which will sustain business operations and dividend payments while they transition to their strategic imperatives. We expect that 2016 will show similar values to the amounts listed on the third quarter income statement and balance sheet, because there is only one quarter left in the year. We also assumed that we should increase the discount rate calculated by CAPM by 0.5% to account for the uncertainty related to their transition. IBM has consistently increased their dividends for 16 years, but their strategic imperatives are new business ventures. According to our research and calculations, even with increased uncertainty, there is still a sufficient margin of safety to call IBM deeply undervalued to the current stock price.
IBM has been growing their dividends consistently for 16 years. IBM's revenues decreased due to their transition to their strategic imperatives. We assumed IBM would continue growing their dividend at 9.0% initially, and have growth level off at a constant rate of 2.8% into perpetuity. We calculated CAPM based on the S&P 500 return as the market risk premium, and current 10 treasury-bill yield as the risk free rate. IBM currently has a beta of 0.84 in relation to the S&P 500. Our intrinsic value from the dividend discount model shows the current stock price is at a discount of 10.19%. We expect our return to be higher given the receipt of dividends over our holding period.
Stock Report | November 15th, 2016 | Ticker: IBMInternational Business Machines Corp
Valuation

Stoc
k R
epor
t | N
ovem
ber 1
5th ,
2016
| Ti
cker
: IB
MIn
tern
atio
nal B
usin
ess
Mac
hine
s C
orp
2011
2012
2013
2014
2015
2016
2017
2018
2019
2020
2021
Reve
nue:
Serv
ices
60,7
21.0
59,4
53.0
57,6
55.0
55,6
73.0
49,9
11.0
51,5
46.0
53,5
93.3
55,9
03.6
59,4
46.2
62,4
89.2
63,6
32.7
Sale
s44
,063
.043
,014
.038
,666
.035
,063
.029
,967
.023
,866
.024
,334
.824
,948
.225
,685
.726
,580
.727
,020
.6Fi
nanc
ing
2,13
2.0
2,04
0.0
2,04
7.0
2,05
7.0
1,86
4.0
1,65
7.0
1,52
4.4
1,43
3.0
1,35
4.2
1,28
6.5
1,25
4.3
Tota
l Rev
enue
$106
,916
.0$1
04,5
07.0
$98,
368.
0$9
2,79
3.0
$81,
742.
0$7
7,06
9.0
$79,
452.
5$8
2,28
4.7
$86,
486.
1$9
0,35
6.3
$91,
907.
6Co
st o
f Goo
ds S
old:
Serv
ices
40,7
40.0
39,1
66.0
37,5
64.0
36,0
34.0
33,1
26.0
33,5
04.9
34,8
35.6
36,3
37.3
38,6
40.0
40,6
18.0
41,3
61.2
Sale
s14
,973
.013
,956
.011
,009
.09,
312.
06,
920.
05,
369.
95,
353.
75,
363.
95,
394.
05,
449.
05,
539.
2Fi
nanc
ing
1,06
5.0
1,08
7.0
1,11
0.0
1,04
0.0
1,01
1.0
894.
882
3.2
773.
873
1.2
694.
767
7.3
Tota
l Cos
t of G
oods
Sol
d56
,778
.054
,209
.049
,683
.046
,386
.041
,057
.039
,769
.541
,012
.542
,475
.044
,765
.346
,761
.747
,577
.8G
ross
Pro
fit50
,138
.050
,298
.048
,685
.046
,407
.040
,685
.037
,299
.538
,440
.039
,809
.741
,720
.843
,594
.644
,329
.8Ex
pens
e an
d ot
her (
inco
me)
:Se
lling,
gen
eral
and
adm
inis
trativ
e23
,594
.023
,553
.023
,451
.023
,180
.020
,430
.020
,825
.019
,863
.120
,571
.221
,621
.522
,589
.122
,976
.9R
esea
rch,
dev
elop
men
t and
eng
inee
ring
6,25
8.0
6,30
2.0
5,74
3.0
5,43
7.0
5,24
7.0
5,71
7.0
4,76
7.2
4,93
7.1
5,18
9.2
5,42
1.4
5,51
4.5
Inte
llect
ual p
rope
rty a
nd c
usto
m d
evel
opm
ent i
ncom
e(1
,108
.0)
(1,0
74.0
)(8
22.0
)(7
42.0
)(6
82.0
)(1
,638
.0)
(635
.6)
(658
.3)
(691
.9)
(722
.9)
(735
.3)
Oth
er (i
ncom
e) a
nd e
xpen
se(2
0.0)
(843
.0)
(333
.0)
(1,9
38.0
)(7
24.0
)27
3.0
273.
027
3.0
273.
027
3.0
273.
0In
tere
st e
xpen
se41
1.0
459.
040
2.0
484.
046
8.0
631.
063
1.0
631.
063
1.0
631.
063
1.0
Tota
l exp
ense
and
oth
er (i
ncom
e)29
,135
.028
,397
.028
,441
.026
,421
.024
,739
.025
,808
.024
,898
.725
,754
.027
,022
.828
,191
.628
,660
.1In
com
e fr
om c
ontin
uing
ope
ratio
ns b
efor
e in
com
e ta
xes
21,0
03.0
21,9
01.0
20,2
44.0
19,9
86.0
15,9
46.0
11,4
91.5
13,5
41.4
14,0
55.8
14,6
98.0
15,4
03.0
15,6
69.7
Prov
isio
n fo
r inc
ome
taxe
s5,
148.
05,
298.
03,
363.
04,
234.
02,
581.
037
8.0
2,70
8.3
2,81
1.2
2,93
9.6
3,08
0.6
3,13
3.9
Inco
me
from
con
tinui
ng o
pera
tions
15,8
55.0
16,6
03.0
16,8
81.0
15,7
52.0
13,3
65.0
11,1
13.5
10,8
33.1
11,2
44.6
11,7
58.4
12,3
22.4
12,5
35.8
Loss
from
dis
cont
inue
d op
erat
ions
, net
of t
ax0.
00.
0(3
98.0
)(3
,729
.0)
(174
.0)
0.0
0.0
0.0
0.0
0.0
1.0
Net i
ncom
e15
,855
.016
,603
.016
,483
.012
,023
.013
,191
.011
,113
.510
,833
.111
,244
.611
,758
.412
,322
.412
,536
.8
2011
2012
2013
2014
2015
2016
2017
2018
2019
2020
2021
Reve
nue:
Serv
ices
56.7
9%56
.89%
58.6
1%60
.00%
61.0
6%66
.88%
67.4
5%67
.94%
68.7
3%69
.16%
69.2
4%Sa
les
41.2
1%41
.16%
39.3
1%37
.79%
36.6
6%30
.97%
30.6
3%30
.32%
29.7
0%29
.42%
29.4
0%Fi
nanc
ing
1.99
%1.
95%
2.08
%2.
22%
2.28
%2.
15%
1.92
%1.
74%
1.57
%1.
42%
1.36
%To
tal R
even
ue10
0.00
%10
0.00
%10
0.00
%10
0.00
%10
0.00
%10
0.00
%10
0.00
%10
0.00
%10
0.00
%10
0.00
%10
0.00
%Co
st o
f Goo
ds S
old:
0.00
%0.
00%
0.00
%0.
00%
0.00
%0.
00%
0.00
%0.
00%
0.00
%0.
00%
0.00
%Se
rvic
es38
.10%
37.4
8%38
.19%
38.8
3%40
.53%
43.4
7%43
.84%
44.1
6%44
.68%
44.9
5%45
.00%
Sale
s14
.00%
13.3
5%11
.19%
10.0
4%8.
47%
6.97
%6.
74%
6.52
%6.
24%
6.03
%6.
03%
Fina
ncin
g1.
00%
1.04
%1.
13%
1.12
%1.
24%
1.16
%1.
04%
0.94
%0.
85%
0.77
%0.
74%
Tota
l Cos
t of G
oods
Sol
d53
.11%
51.8
7%50
.51%
49.9
9%50
.23%
51.6
0%51
.62%
51.6
2%51
.76%
51.7
5%51
.77%
Gro
ss P
rofit
46.8
9%48
.13%
49.4
9%50
.01%
49.7
7%48
.40%
48.3
8%48
.38%
48.2
4%48
.25%
48.2
3%Ex
pens
e an
d ot
her (
inco
me)
:0.
00%
0.00
%0.
00%
0.00
%0.
00%
0.00
%0.
00%
0.00
%0.
00%
0.00
%0.
00%
Sellin
g, g
ener
al a
nd a
dmin
istra
tive
22.0
7%22
.54%
23.8
4%24
.98%
24.9
9%27
.02%
25.0
0%25
.00%
25.0
0%25
.00%
25.0
0%R
esea
rch,
dev
elop
men
t and
eng
inee
ring
5.85
%6.
03%
5.84
%5.
86%
6.42
%7.
42%
6.00
%6.
00%
6.00
%6.
00%
6.00
%In
telle
ctua
l pro
perty
and
cus
tom
dev
elop
men
t inc
ome
(1.0
4%)
(1.0
3%)
(0.8
4%)
(0.8
0%)
(0.8
3%)
(2.1
3%)
(0.8
0%)
(0.8
0%)
(0.8
0%)
(0.8
0%)
(0.8
0%)
Oth
er (i
ncom
e) a
nd e
xpen
se(0
.02%
)(0
.81%
)(0
.34%
)(2
.09%
)(0
.89%
)0.
35%
0.34
%0.
33%
0.32
%0.
30%
0.30
%In
tere
st e
xpen
se0.
38%
0.44
%0.
41%
0.52
%0.
57%
0.82
%0.
79%
0.77
%0.
73%
0.70
%0.
69%
Tota
l exp
ense
and
oth
er (i
ncom
e)27
.25%
27.1
7%28
.91%
28.4
7%30
.26%
33.4
9%31
.34%
31.3
0%31
.25%
31.2
0%31
.18%
Inco
me
from
con
tinui
ng o
pera
tions
bef
ore
inco
me
taxe
s19
.64%
20.9
6%20
.58%
21.5
4%19
.51%
14.9
1%17
.04%
17.0
8%16
.99%
17.0
5%17
.05%
Prov
isio
n fo
r inc
ome
taxe
s4.
81%
5.07
%3.
42%
4.56
%3.
16%
0.49
%3.
41%
3.42
%3.
40%
3.41
%3.
41%
Inco
me
from
con
tinui
ng o
pera
tions
14.8
3%15
.89%
17.1
6%16
.98%
16.3
5%14
.42%
13.6
3%13
.67%
13.6
0%13
.64%
13.6
4%Lo
ss fr
om d
isco
ntin
ued
oper
atio
ns, n
et o
f tax
0.00
%0.
00%
(0.4
0%)
(4.0
2%)
(0.2
1%)
0.00
%0.
00%
0.00
%0.
00%
0.00
%0.
00%
Net i
ncom
e14
.83%
15.8
9%16
.76%
12.9
6%16
.14%
14.4
2%13
.63%
13.6
7%13
.60%
13.6
4%13
.64%
Cons
olid
ated
Sta
tem
ent o
f Ear
ning
s - U
SD ($
) in
Mill
ions
12 M
onth
s En
ded
Dece
mbe
r 31
Com
mon
Siz
e Co
nsol
idat
ed S
tate
men
t of E
arni
ngs
- As
a Pe
rcen
t of T
otal
Rev
enue
s12
Mon
ths
Ende
d De
cem
ber 3
1
Fina
ncia
l Sta
tem
ents
Con
solid
ated
Sta
tem
ent o
f Fin
anci
al P
ositi
on -
USD
($) i
n M
illio
ns20
1120
1220
1320
1420
1520
1620
1720
1820
1920
2020
21
Cur
rent
Ass
ets:
Cas
h an
d ca
sh e
quiv
alen
ts11
,922
.010
,412
.010
,716
.08,
476.
07,
686.
09,
039.
08,
926.
59,
420.
610
,601
.711
,219
.211
,391
.1M
arke
tabl
e se
curit
ies
0.0
717.
035
0.0
0.0
508.
092
9.0
850.
183
2.5
866.
587
5.9
890.
7N
otes
and
acc
ount
s rec
eiva
ble
- tra
de (n
et o
f allo
wan
ces)
11,1
79.0
10,6
67.0
10,4
65.0
9,09
0.0
8,33
3.0
8,29
1.0
8,28
8.9
8,43
4.7
8,89
9.1
9,24
6.0
9,40
1.4
Shor
t-ter
m fi
nanc
ing
rece
ivab
les (
net o
f allo
wan
ces)
16,9
01.0
18,0
38.0
19,7
87.0
19,8
35.0
19,0
20.0
16,0
32.0
17,0
02.8
17,5
26.6
18,7
35.0
19,4
65.2
19,7
92.5
Oth
er a
ccou
nts r
ecei
vabl
e (n
et o
f allo
wan
ces)
1,48
1.0
1,87
3.0
1,58
4.0
2,90
6.0
1,20
1.0
873.
01,
062.
71,
095.
41,
170.
91,
216.
61,
237.
0In
vent
orie
s2,
595.
02,
287.
02,
310.
02,
103.
01,
551.
01,
729.
01,
806.
61,
862.
21,
990.
62,
068.
22,
103.
0Pr
epai
d ex
pens
es a
nd o
ther
cur
rent
ass
ets
5,24
9.0
4,02
4.0
4,48
8.0
4,96
7.0
4,20
5.0
4,53
9.0
4,56
9.5
4,64
4.6
5,57
3.7
5,57
1.9
5,66
5.6
Tot
al C
urre
nt A
sset
s49
,327
.048
,018
.049
,700
.047
,377
.042
,504
.041
,432
.042
,507
.143
,816
.646
,837
.648
,663
.049
,481
.2Pr
oper
ty, p
lant
and
equ
ipm
ent
40,1
24.0
40,5
01.0
40,4
75.0
39,0
34.0
29,3
42.0
30,8
42.0
32,3
84.1
34,1
79.5
35,7
04.8
37,4
18.9
38,4
18.9
Less
: Acc
umul
ated
dep
reci
atio
n26
,241
.026
,505
.026
,654
.028
,263
.018
,615
.019
,738
.020
,922
.322
,177
.623
,508
.324
,918
.824
,918
.8Pr
oper
ty, p
lant
and
equ
ipm
ent -
net
13,8
83.0
13,9
96.0
13,8
21.0
10,7
71.0
10,7
27.0
11,1
04.0
11,4
61.8
12,0
01.8
12,1
96.6
12,5
00.2
13,5
00.2
Long
-term
fina
ncin
g re
ceiv
able
s10
,776
.012
,812
.012
,755
.011
,109
.010
,013
.08,
936.
08,
221.
17,
727.
97,
302.
87,
137.
77,
159.
2Pr
epai
d pe
nsio
n as
sets
2,84
3.0
945.
05,
551.
02,
160.
01,
734.
03,
487.
01,
734.
01,
734.
01,
734.
01,
734.
01,
734.
0D
efer
red
taxe
s5,
104.
05,
388.
04,
702.
06,
675.
04,
822.
04,
289.
04,
822.
04,
822.
04,
822.
04,
822.
04,
822.
0G
oodw
ill26
,213
.029
,247
.031
,184
.030
,556
.032
,021
.036
,401
.036
,401
.036
,401
.036
,401
.036
,401
.036
,401
.0In
tang
ible
ass
ets -
net
3,39
2.0
3,78
7.0
3,87
1.0
3,10
4.0
3,48
7.0
4,88
1.0
4,88
1.0
4,88
1.0
4,88
1.0
4,88
1.0
4,88
1.0
Inve
stmen
ts an
d su
ndry
ass
ets
4,89
5.0
5,02
1.0
4,63
9.0
5,52
0.0
5,18
7.0
5,07
5.0
5,07
5.0
5,07
5.0
5,07
5.0
5,07
5.0
5,07
5.0
Tot
al A
sset
s11
6,43
3.0
119,
214.
012
6,22
3.0
117,
272.
011
0,49
5.0
115,
605.
011
5,10
3.0
116,
459.
311
9,25
0.0
121,
213.
812
3,05
3.7
Cur
rent
Lia
bilit
ies:
Taxe
s3,
313.
04,
948.
04,
633.
05,
084.
02,
847.
02,
137.
02,
391.
52,
562.
32,
647.
82,
733.
22,
733.
2Sh
ort-t
erm
deb
t8,
463.
09,
181.
06,
862.
05,
731.
06,
461.
06,
920.
07,
174.
67,
174.
67,
174.
67,
174.
67,
174.
6A
ccou
nts p
ayab
le8,
517.
07,
952.
07,
461.
06,
864.
06,
028.
05,
271.
05,
466.
35,
637.
25,
808.
05,
978.
85,
978.
8C
ompe
nsat
ion
and
bene
fits
5,09
9.0
4,74
5.0
3,89
3.0
4,03
1.0
3,56
0.0
3,95
8.0
3,75
8.1
3,75
8.1
3,75
8.1
3,75
8.1
3,75
8.1
Def
erre
d in
com
e12
,197
.011
,952
.012
,557
.011
,877
.011
,021
.010
,815
.010
,591
.010
,505
.610
,420
.210
,134
.810
,134
.8O
ther
acc
rued
exp
ense
s and
liab
ilitie
s4,
535.
04,
847.
04,
748.
05,
994.
04,
353.
05,
346.
04,
783.
04,
526.
84,
356.
04,
185.
24,
185.
2T
otal
Cur
rent
Lia
bilit
ies
42,1
24.0
43,6
25.0
40,1
54.0
39,5
81.0
34,2
70.0
34,4
47.0
34,1
64.6
34,9
71.0
35,8
91.7
36,8
46.1
37,4
82.1
Long
-term
deb
t22
,857
.024
,088
.032
,856
.034
,991
.033
,428
.035
,563
.035
,563
.035
,563
.035
,563
.035
,563
.035
,563
.0R
etire
men
t and
non
pens
ion
PBO
18,3
74.0
20,4
18.0
16,2
42.0
18,2
61.0
16,5
04.0
16,6
88.0
16,6
88.0
16,6
88.0
16,6
88.0
16,6
88.0
16,6
88.0
Def
erre
d in
com
e3,
847.
04,
491.
04,
108.
03,
691.
03,
771.
03,
611.
03,
611.
03,
611.
03,
611.
03,
611.
03,
611.
0O
ther
liab
ilitie
s 8,
996.
07,
607.
09,
934.
08,
733.
08,
099.
08,
138.
08,
138.
08,
138.
08,
138.
08,
138.
08,
138.
0T
otal
Lia
bilit
ies
96,1
98.0
100,
229.
010
3,29
4.0
105,
257.
096
,072
.098
,447
.098
,164
.698
,971
.099
,891
.710
0,84
6.1
101,
482.
1C
ontin
genc
ies a
nd c
omm
itmen
ts0.
00.
00.
00.
00.
00.
00.
00.
00.
00.
00.
0IB
M S
tock
hold
ers'
Equ
ity:
Com
mon
stoc
k, p
ar v
alue
$0.
20 p
er sh
are,
and
API
C48
,129
.050
,110
.051
,594
.052
,666
.053
,262
.053
,759
.053
,759
.053
,759
.053
,759
.053
,759
.053
,759
.0R
etai
ned
earn
ings
104,
857.
011
7,64
1.0
130,
042.
013
7,79
3.0
146,
124.
015
1,02
7.0
156,
058.
016
0,27
8.6
164,
487.
816
8,53
0.4
172,
802.
9Tr
easu
ry st
ock,
at c
ost
(110
,963
.0)
(123
,131
.0)
(137
,242
.0)
(150
,715
.0)
(155
,518
.0)
(158
,170
.0)
(163
,420
.6)
(167
,091
.3)
(169
,430
.6)
(172
,463
.7)
(175
,533
.3)
Acc
umul
ated
oth
er c
ompr
ehen
sive
inco
me/
(loss
)(2
1,88
5.0)
(25,
759.
0)(2
1,60
2.0)
(27,
875.
0)(2
9,60
7.0)
(29,
607.
0)(2
9,60
7.0)
(29,
607.
0)(2
9,60
7.0)
(29,
607.
0)(2
9,60
7.0)
Tot
al I
BM
sto
ckho
lder
s' e
quity
20,1
38.0
18,8
61.0
22,7
92.0
11,8
69.0
14,2
61.0
17,0
09.0
16,7
89.4
17,3
39.3
19,2
09.2
20,2
18.7
21,4
21.6
Non
cont
rolli
ng in
tere
sts97
.012
4.0
137.
014
6.0
162.
014
9.0
149.
014
9.0
149.
014
9.0
150.
0T
otal
Equ
ity20
,235
.018
,985
.022
,929
.012
,015
.014
,423
.017
,158
.016
,938
.417
,488
.319
,358
.220
,367
.721
,571
.6T
otal
Lia
bilit
ies
and
Equ
ity11
6,43
3.0
119,
214.
012
6,22
3.0
117,
272.
011
0,49
5.0
115,
605.
011
5,10
3.0
116,
459.
311
9,25
0.0
121,
213.
812
3,05
3.7
Stoc
k R
epor
t | N
ovem
ber 1
5th ,
2016
| Ti
cker
: IB
MIn
tern
atio
nal B
usin
ess
Mac
hine
s C
orp
Fina
ncia
l Sta
tem
ents
Con
solid
ated
Sta
tem
ent o
f Fin
anci
al P
ositi
on -
USD
($) i
n M
illio
ns20
1120
1220
1320
1420
1520
1620
1720
1820
1920
2020
21
Cur
rent
Ass
ets:
Cas
h an
d ca
sh e
quiv
alen
ts10
.24%
8.73
%8.49
%7.23
%6.96
%7.82
%7.69
%7.97
%8.73
%9.04
%9.04
%M
arke
tabl
e se
curit
ies
0.00
%0.60
%0.28
%0.00
%0.46
%0.80
%0.73
%0.70
%0.71
%0.70
%0.70
%N
otes
and
acc
ount
s rec
eiva
ble
- tra
de (n
et o
f allo
wan
ces)
9.60
%8.95
%8.29
%7.75
%7.54
%7.17
%7.14
%7.14
%7.30
%7.42
%7.43
%Sh
ort-t
erm
fina
ncin
g re
ceiv
able
s (ne
t of a
llow
ance
s)14
.52%
15.13%
15.68%
16.91%
17.21%
13.87%
14.65%
14.83%
15.37%
15.62%
15.64%
Oth
er a
ccou
nts r
ecei
vabl
e (n
et o
f allo
wan
ces)
1.27
%1.57
%1.25
%2.48
%1.09
%0.76
%0.92
%0.93
%0.96
%0.98
%0.98
%In
vent
orie
s2.23
%1.92
%1.83
%1.79
%1.40
%1.50
%1.56
%1.58
%1.63
%1.66
%1.66
%Pr
epai
d ex
pens
es a
nd o
ther
cur
rent
ass
ets
4.51
%3.38
%3.56
%4.24
%3.81
%3.93
%3.94
%3.93
%4.57
%4.47
%4.48
%T
otal
Cur
rent
Ass
ets
42.37%
40.28%
39.37%
40.40%
38.47%
35.84%
36.62%
37.08%
38.42%
39.05%
39.09%
Prop
erty
, pla
nt a
nd e
quip
men
t34
.46%
33.97%
32.07%
33.29%
26.56%
26.68%
28.27%
29.60%
30.37%
31.44%
31.80%
Less
: Acc
umul
ated
dep
reci
atio
n22
.54%
22.23%
21.12%
24.10%
16.85%
17.07%
18.27%
19.21%
19.99%
20.93%
20.63%
Prop
erty
, pla
nt a
nd e
quip
men
t - n
et11
.92%
11.74%
10.95%
9.18
%9.71
%9.61
%10
.01%
10.40%
10.37%
10.50%
11.18%
Long
-term
fina
ncin
g re
ceiv
able
s9.26
%10
.75%
10.11%
9.47
%9.06
%7.73
%7.18
%6.69
%6.21
%6.00
%5.93
%Pr
epai
d pe
nsio
n as
sets
2.44
%0.79
%4.40
%1.84
%1.57
%3.02
%1.51
%1.50
%1.47
%1.46
%1.44
%D
efer
red
taxe
s4.38
%4.52
%3.73
%5.69
%4.36
%3.71
%4.21
%4.18
%4.10
%4.05
%3.99
%G
oodw
ill22
.51%
24.53%
24.71%
26.06%
28.98%
31.49%
31.78%
31.53%
30.96%
30.58%
30.13%
Inta
ngib
le a
sset
s - n
et2.91
%3.18
%3.07
%2.65
%3.16
%4.22
%4.26
%4.23
%4.15
%4.10
%4.04
%In
vest
men
ts a
nd su
ndry
ass
ets
4.20
%4.21
%3.68
%4.71
%4.69
%4.39
%4.43
%4.40
%4.32
%4.26
%4.20
%T
otal
Ass
ets
100.00
%10
0.00
%10
0.00
%10
0.00
%10
0.00
%10
0.00
%10
0.00
%10
0.00
%10
0.00
%10
0.00
%10
0.00
%C
urre
nt L
iabi
litie
s:0.00
%0.00
%0.00
%0.00
%0.00
%0.00
%0.00
%0.00
%0.00
%0.00
%0.00
%Ta
xes
2.85
%4.15
%3.67
%4.34
%2.58
%1.85
%2.06
%2.19
%2.22
%2.27
%2.23
%Sh
ort-t
erm
deb
t7.27
%7.70
%5.44
%4.89
%5.85
%5.99
%6.18
%6.13
%6.02
%5.95
%5.86
%A
ccou
nts p
ayab
le7.31
%6.67
%5.91
%5.85
%5.46
%4.56
%4.71
%4.82
%4.87
%4.96
%4.88
%C
ompe
nsat
ion
and
bene
fits
4.38
%3.98
%3.08
%3.44
%3.22
%3.42
%3.24
%3.21
%3.15
%3.11
%3.07
%D
efer
red
inco
me
10.48%
10.03%
9.95
%10
.13%
9.97
%9.36
%9.12
%8.98
%8.74
%8.40
%8.28
%O
ther
acc
rued
exp
ense
s and
liab
ilitie
s3.89
%4.07
%3.76
%5.11
%3.94
%4.62
%4.12
%3.87
%3.65
%3.47
%3.42
%T
otal
Cur
rent
Lia
bilit
ies
36.18%
36.59%
31.81%
33.75%
31.01%
29.80%
29.43%
29.59%
29.42%
29.53%
29.58%
Long
-term
deb
t19
.63%
20.21%
26.03%
29.84%
30.25%
30.76%
31.05%
30.80%
30.24%
29.88%
29.44%
Ret
irem
ent a
nd n
onpe
nsio
n PB
O15
.78%
17.13%
12.87%
15.57%
14.94%
14.44%
14.57%
14.45%
14.19%
14.02%
13.82%
Def
erre
d in
com
e3.30
%3.77
%3.25
%3.15
%3.41
%3.12
%3.15
%3.13
%3.07
%3.03
%2.99
%O
ther
liab
ilitie
s 7.73
%6.38
%7.87
%7.45
%7.33
%7.04
%7.11
%7.05
%6.92
%6.84
%6.74
%T
otal
Lia
bilit
ies
82.62%
84.07%
81.83%
89.75%
86.95%
85.16%
85.31%
85.03%
83.84%
83.30%
82.56%
Con
tinge
ncie
s and
com
mitm
ents
0.00
%0.00
%0.00
%0.00
%0.00
%0.00
%0.00
%0.00
%0.00
%0.00
%0.00
%IB
M S
tock
hold
ers'
Equ
ity:
0.00
%0.00
%0.00
%0.00
%0.00
%0.00
%0.00
%0.00
%0.00
%0.00
%0.00
%C
omm
on st
ock,
par
val
ue $
0.20
per
shar
e, a
nd A
PIC
41.34%
42.03%
40.88%
44.91%
48.20%
46.50%
46.94%
46.56%
45.72%
45.16%
44.50%
Ret
aine
d ea
rnin
gs90
.06%
98.68%
103.03
%11
7.50
%13
2.24
%13
0.64
%13
6.20
%13
8.70
%13
9.63
%14
1.23
%14
2.61
%Tr
easu
ry st
ock,
at c
ost
(95.30
%)
(103
.29%
)(108
.73%
)(128
.52%
)(140
.75%
)(136
.82%
)(142
.73%
)(144
.78%
)(144
.14%
)(144
.94%
)(145
.29%
)A
ccum
ulat
ed o
ther
com
preh
ensiv
e in
com
e/(lo
ss)
(18.80
%)
(21.61
%)
(17.11
%)
(23.77
%)
(26.79
%)
(25.61
%)
(25.85
%)
(25.64
%)
(25.18
%)
(24.87
%)
(24.51
%)
Tot
al I
BM
sto
ckho
lder
s' e
quity
17.30%
15.82%
18.06%
10.12%
12.91%
14.71%
14.56%
14.84%
16.03%
16.58%
17.32%
Non
cont
rolli
ng in
tere
sts0.08
%0.10
%0.11
%0.12
%0.15
%0.13
%0.13
%0.13
%0.13
%0.13
%0.12
%T
otal
Equ
ity17
.38%
15.93%
18.17%
10.25%
13.05%
14.84%
14.69%
14.97%
16.16%
16.70%
17.44%
Tot
al L
iabi
litie
s an
d E
quity
100.00
%10
0.00
%10
0.00
%10
0.00
%10
0.00
%10
0.00
%10
0.00
%10
0.00
%10
0.00
%10
0.00
%10
0.00
%
Stoc
k R
epor
t | N
ovem
ber 1
5th ,
2016
| Ti
cker
: IB
MIn
tern
atio
nal B
usin
ess
Mac
hine
s C
orp
Fina
ncia
l Sta
tem
ents

Ginni RomettyChairman, President, and CEOGinni Rometty began her career with IBM in 1981 in Detroit. Since then she has held a series of leadership positions, most recently as senior vice president and group executive, IBM sales, marketing, and strategy. Earlier she served as senior vice president, IBM Global Business Services, where she led the successful integration of PricewaterhouseCoopers Consulting. This acquisition was the largest in professional services history, creating a global team of more than 100,000 business consultants and services experts.
Martin Schroeter Senior Vice President and Chief Financial Officer Martin Schroeter was named Senior Vice President and Chief Financial Officer on January 1, 2014. He was previously General Manager of IBM Global Financing, a position he held since April 2011, where he led the world’s largest captive IT financier with a total asset base in excess of $37 billion and 125,000 customers in 50 countries.Mr. Schroeter also served as IBM Treasurer, responsible for the company's balance sheet, cash flow, capital structure, interest rate and currency risk management and treasury operations. He has also held
Dr. John E. Kelly IIISenior Vice President, Cognitive Solutions and IBM ResearchAs IBM senior vice president, Cognitive Solutions and IBM Research, Dr. John E. Kelly III is focused on the company’s investments in several of the fastest-growing and most strategic parts of the information technology market. His portfolio includes IBM Analytics, IBM Commerce, IBM Security and IBM Watson, as well as IBM Research and the company’s Intellectual Property team. He also oversees the development of units devoted to serving clients in specific industries, beginning with the April 2015 launch of IBM Watson Health.
Mark FosterSenior Vice President, Global Business Services IBMMark Foster is Senior Vice President, IBM Global Business Services, responsible for the strategy, client value and business performance of IBM’s consulting, systems integration, digital agency, business process outsourcing and application management services businesses across all industries. GBS brings clients the expertise of more than 100,000 consultants and practitioners creating value at the intersection of business insight and information technology.
Robert J. LeBlancSenior Vice President, CloudRobert LeBlanc is Senior Vice President, IBM Cloud. In this role, he has global responsibility for IBM’s industry leading cloud portfolio of technology and services, including strategy, product design, offering development, marketing, sales, and service. Previously, Mr. LeBlanc served as Senior Vice President, IBM Software and Cloud Solutions Group, managing the strategy, development, and delivery of IBM’s industry leading middleware and software solutions portfolio.
Stock Report | November 15th, 2016 | Ticker: IBMInternational Business Machines Corp
Management