Embed Size (px)
Citation preview
Stock Market Indicators:Bull/Bear Ratios
Yardeni Research, Inc.
November 3, 2021
Dr. Edward Yardeni516-972-7683
Joe Abbott732-497-5306
Debbie Johnson480-664-1333
Please visit our sites atwww.yardeni.comblog.yardeni.com
thinking outside the box
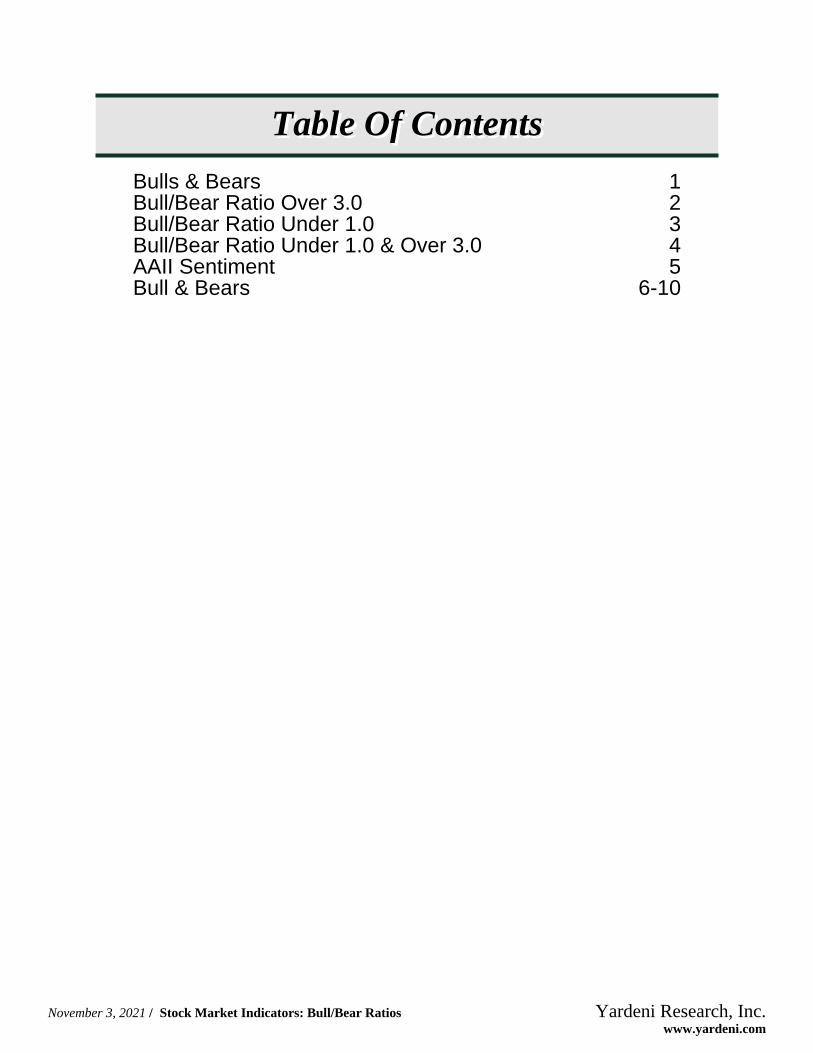
Table Of Contents Table Of ContentsTable Of Contents
November 3, 2021 / Stock Market Indicators: Bull/Bear Ratios www.yardeni.com
Yardeni Research, Inc.
Bulls & Bears 1Bull/Bear Ratio Over 3.0 2Bull/Bear Ratio Under 1.0 3Bull/Bear Ratio Under 1.0 & Over 3.0 4AAII Sentiment 5Bull & Bears 6-10

Figure 1.
87 88 89 90 91 92 93 94 95 96 97 98 99 00 01 02 03 04 05 06 07 08 09 10 11 12 13 14 15 16 17 18 19 20 21 22 230
1
2
3
4
5
6
0
1
2
3
4
5
6
INVESTORS INTELLIGENCE BULLS & BEARS
11/2
Ratio Oct 19 1.81 Oct 26 2.05 Nov 2 2.24
11/2
RatioBull/BearRatio*
87 88 89 90 91 92 93 94 95 96 97 98 99 00 01 02 03 04 05 06 07 08 09 10 11 12 13 14 15 16 17 18 19 20 21 22 2310
15
20
25
30
35
40
45
50
55
60
65
70
75
80
10
15
20
25
30
35
40
45
50
55
60
65
70
75
80
Bulls Bears Oct 19 43.2 23.9 Oct 26 48.9 23.8 Nov 2 54.0 24.1
11/2
PercentageBullsBears
87 88 89 90 91 92 93 94 95 96 97 98 99 00 01 02 03 04 05 06 07 08 09 10 11 12 13 14 15 16 17 18 19 20 21 22 235
10
15
20
25
30
35
40
45
50
5
10
15
20
25
30
35
40
45
50
Correction Oct 19 32.9 Oct 26 27.3 Nov 2 21.9
11/2
PercentageCorrection
yardeni.com
Source: Investors Intelligence.
Bulls & Bears
Page 1 / November 3, 2021 / Stock Market Indicators: Bull/Bear Ratios www.yardeni.com
Yardeni Research, Inc.

87 88 89 90 91 92 93 94 95 96 97 98 99 00 01 02 03 04 05 06 07 08 09 10 11 12 13 14 15 16 17 18 19 20 21 22 23200
700
1200
1700
2200
2700
3200
3700420047005200
200
700
1200
1700
2200
2700
3200
3700420047005200
S&P 500 INDEX vs. BULL/BEAR RATIO OF3.0 OR MORE*
(ratio scale)
11/3
yardeni.com
* Red shaded areas indicate Bull/Bear Ratio equal to or greater than 3.0.Source: Standard & Poor’s and Investors Intelligence.
Figure 2.
87 88 89 90 91 92 93 94 95 96 97 98 99 00 01 02 03 04 05 06 07 08 09 10 11 12 13 14 15 16 17 18 19 20 21 22 231600
6600
11600
16600
21600
26600
31600
3660041600
1600
6600
11600
16600
21600
26600
31600
3660041600
DOW JONES INDEX vs. BULL/BEAR RATIO OF3.0 OR MORE*
(ratio scale)
11/3
yardeni.com
* Red shaded areas indicates Bull/Bear Ratio equal to or greater than 3.0.Source: Wall Street Journal and Investors Intelligence.
Figure 3.
Bull/Bear Ratio Over 3.0
Page 2 / November 3, 2021 / Stock Market Indicators: Bull/Bear Ratios www.yardeni.com
Yardeni Research, Inc.
87 88 89 90 91 92 93 94 95 96 97 98 99 00 01 02 03 04 05 06 07 08 09 10 11 12 13 14 15 16 17 18 19 20 21 22 23200
700
1200
1700
2200
2700
3200
3700420047005200
200
700
1200
1700
2200
2700
3200
3700420047005200
S&P 500 INDEX vs BULL/BEAR RATIOOF 1.0 OR LESS*
(ratio scale)
11/3
yardeni.com
* Green shaded areas indicate Bull/Bear Ratio equal to or less than 1.0.Source: Standard & Poor’s and Investors Intelligence.
Figure 4.
87 88 89 90 91 92 93 94 95 96 97 98 99 00 01 02 03 04 05 06 07 08 09 10 11 12 13 14 15 16 17 18 19 20 21 22 231600
6600
11600
16600
21600
26600
31600
3660041600
1600
6600
11600
16600
21600
26600
31600
3660041600
DOW JONES INDEX vs. BULL/BEAR RATIOOF 1.0 OR LESS*
(ratio scale)
11/3
yardeni.com
* Green shaded areas indicates Bull/Bear Ratio equal to or less than 1.0.Source: Wall Street Journal and Investors Intelligence.
Figure 5.
Bull/Bear Ratio Under 1.0
Page 3 / November 3, 2021 / Stock Market Indicators: Bull/Bear Ratios www.yardeni.com
Yardeni Research, Inc.
87 88 89 90 91 92 93 94 95 96 97 98 99 00 01 02 03 04 05 06 07 08 09 10 11 12 13 14 15 16 17 18 19 20 21 22 23-40
-20
0
20
40
-40
-20
0
20
40
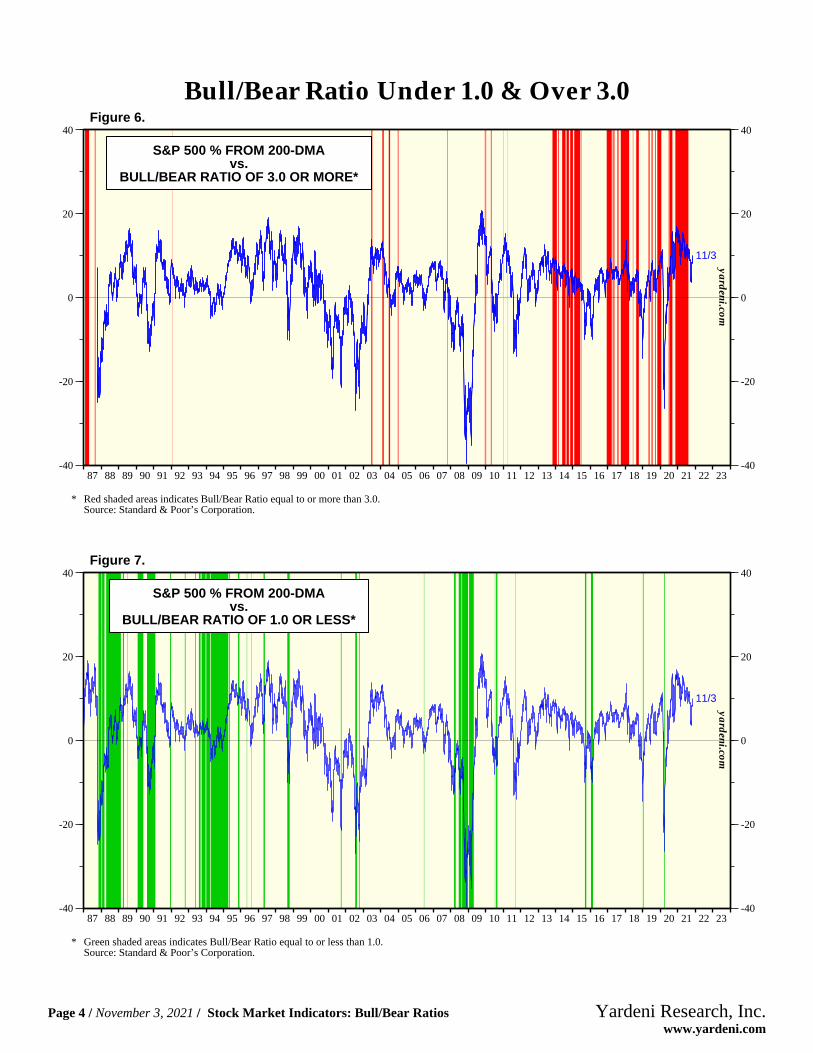
S&P 500 % FROM 200-DMAvs.
BULL/BEAR RATIO OF 3.0 OR MORE*
11/3
* Red shaded areas indicates Bull/Bear Ratio equal to or more than 3.0.Source: Standard & Poor’s Corporation.
yardeni.com
Figure 6.
87 88 89 90 91 92 93 94 95 96 97 98 99 00 01 02 03 04 05 06 07 08 09 10 11 12 13 14 15 16 17 18 19 20 21 22 23-40
-20
0
20
40
-40
-20
0
20
40
S&P 500 % FROM 200-DMAvs.
BULL/BEAR RATIO OF 1.0 OR LESS*
11/3
* Green shaded areas indicates Bull/Bear Ratio equal to or less than 1.0.Source: Standard & Poor’s Corporation.
yardeni.com
Figure 7.
Bull/Bear Ratio Under 1.0 & Over 3.0
Page 4 / November 3, 2021 / Stock Market Indicators: Bull/Bear Ratios www.yardeni.com
Yardeni Research, Inc.
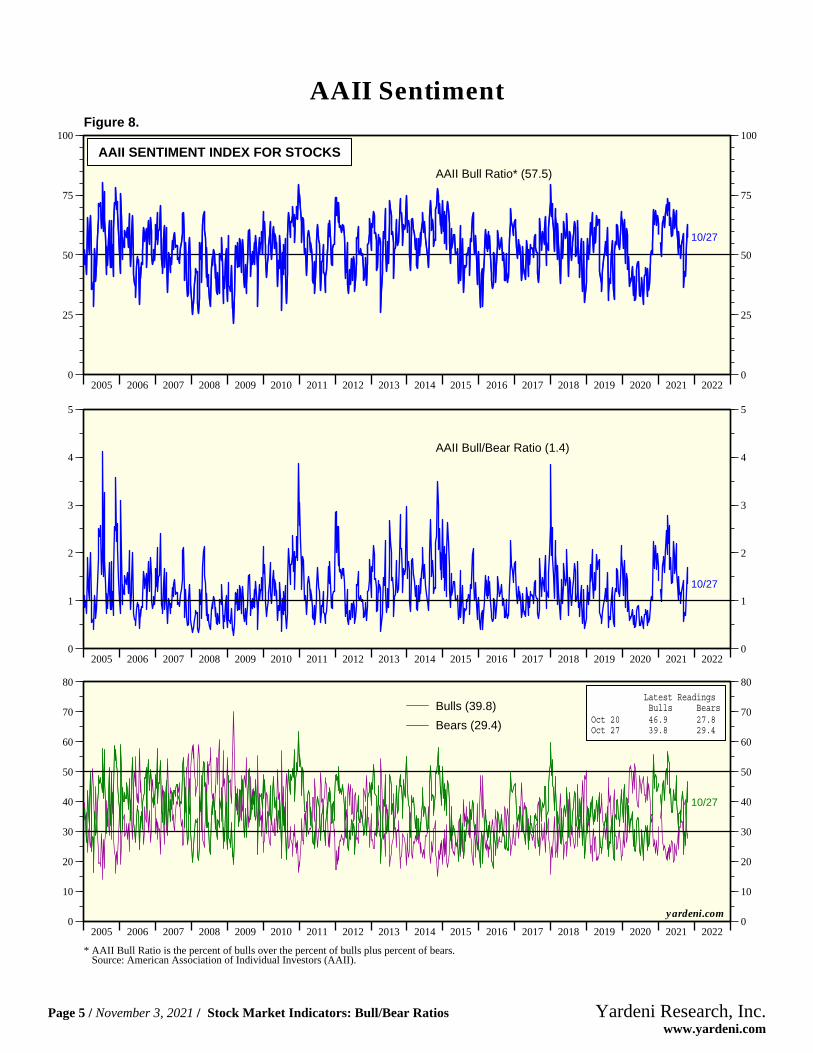
Figure 8.
2005 2006 2007 2008 2009 2010 2011 2012 2013 2014 2015 2016 2017 2018 2019 2020 2021 20220
25
50
75
100
0
25
50
75
100
AAII SENTIMENT INDEX FOR STOCKS
10/27
AAII Bull Ratio* (57.5)
2005 2006 2007 2008 2009 2010 2011 2012 2013 2014 2015 2016 2017 2018 2019 2020 2021 20220
1
2
3
4
5
0
1
2
3
4
5
10/27
AAII Bull/Bear Ratio (1.4)
2005 2006 2007 2008 2009 2010 2011 2012 2013 2014 2015 2016 2017 2018 2019 2020 2021 20220
10
20
30
40
50
60
70
80
0
10
20
30
40
50
60
70
80 Latest Readings Bulls Bears Oct 20 46.9 27.8 Oct 27 39.8 29.4
10/27
Bulls (39.8)
Bears (29.4)
* AAII Bull Ratio is the percent of bulls over the percent of bulls plus percent of bears. Source: American Association of Individual Investors (AAII).
yardeni.com
AAII Sentiment
Page 5 / November 3, 2021 / Stock Market Indicators: Bull/Bear Ratios www.yardeni.com
Yardeni Research, Inc.
2000 2001 2002 2003 2004 2005 2006 2007 2008 2009 2010 2011 2012 2013 2014 2015 2016 2017 2018 2019 2020 2021 2022 2023 202420
40
60
80
100
120
140
.0
.5
1.0
1.5
2.0
2.5
3.0
3.5
4.0
4.5
5.0
5.5
11/2
Oct
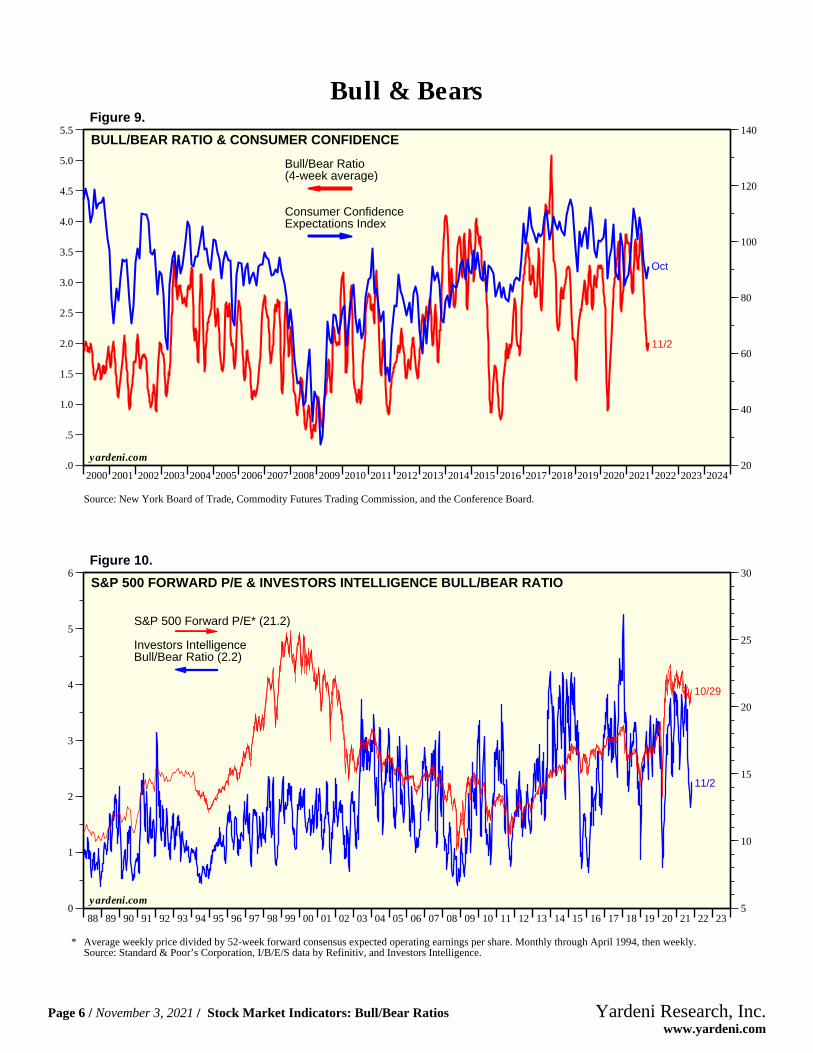
BULL/BEAR RATIO & CONSUMER CONFIDENCE
Bull/Bear Ratio(4-week average)
Consumer ConfidenceExpectations Index
yardeni.com
Source: New York Board of Trade, Commodity Futures Trading Commission, and the Conference Board.
Figure 9.
88 89 90 91 92 93 94 95 96 97 98 99 00 01 02 03 04 05 06 07 08 09 10 11 12 13 14 15 16 17 18 19 20 21 22 235
10
15
20
25
30
0
1
2
3
4
5
6
11/2
10/29
S&P 500 FORWARD P/E & INVESTORS INTELLIGENCE BULL/BEAR RATIO
S&P 500 Forward P/E* (21.2)
Investors IntelligenceBull/Bear Ratio (2.2)
yardeni.com
* Average weekly price divided by 52-week forward consensus expected operating earnings per share. Monthly through April 1994, then weekly.Source: Standard & Poor’s Corporation, I/B/E/S data by Refinitiv, and Investors Intelligence.
Figure 10.
Bull & Bears
Page 6 / November 3, 2021 / Stock Market Indicators: Bull/Bear Ratios www.yardeni.com
Yardeni Research, Inc.
87 88 89 90 91 92 93 94 95 96 97 98 99 00 01 02 03 04 05 06 07 08 09 10 11 12 13 14 15 16 17 18 19 20 21 22 23.0
.5
1.0
1.5
2.0
2.5
3.0
3.5
4.0
4.5
5.0
5.5
.0
.5
1.0
1.5
2.0
2.5
3.0
3.5
4.0
4.5
5.0
5.5
11/2
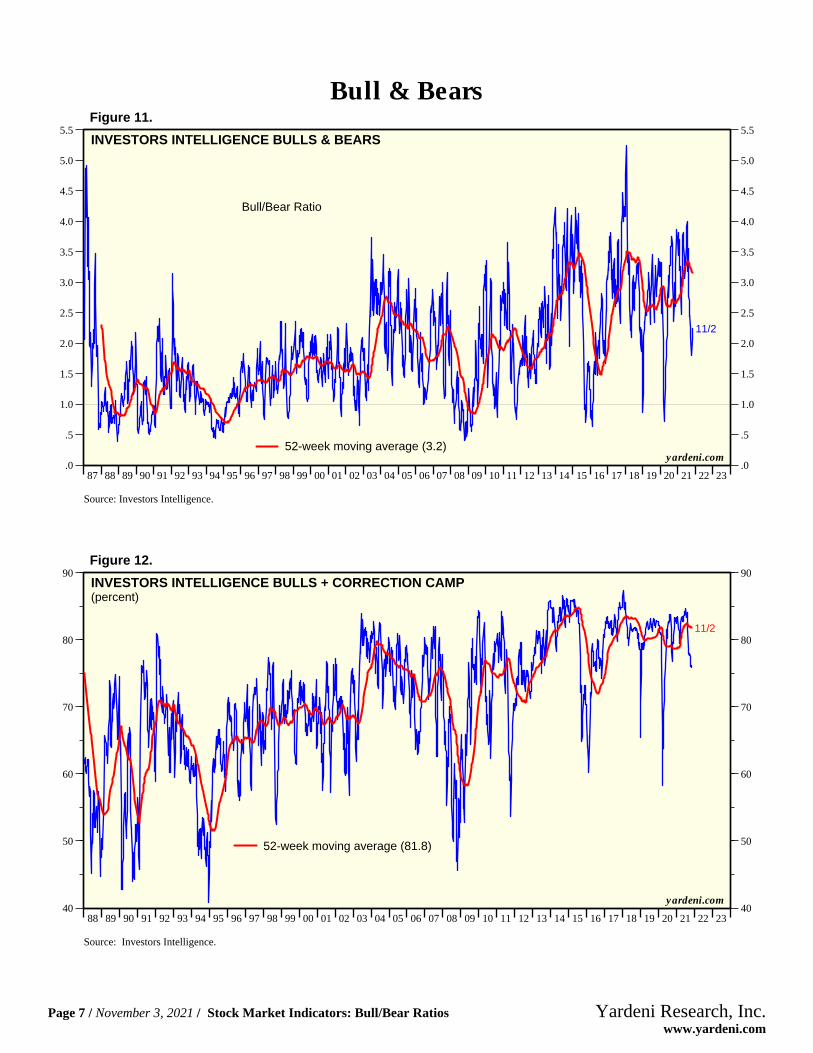
INVESTORS INTELLIGENCE BULLS & BEARS
Bull/Bear Ratio
52-week moving average (3.2)yardeni.com
Source: Investors Intelligence.
Figure 11.
88 89 90 91 92 93 94 95 96 97 98 99 00 01 02 03 04 05 06 07 08 09 10 11 12 13 14 15 16 17 18 19 20 21 22 2340
50
60
70
80
90
40
50
60
70
80
90
11/2
INVESTORS INTELLIGENCE BULLS + CORRECTION CAMP(percent)
52-week moving average (81.8)
Source: Investors Intelligence.
yardeni.com
Figure 12.
Bull & Bears
Page 7 / November 3, 2021 / Stock Market Indicators: Bull/Bear Ratios www.yardeni.com
Yardeni Research, Inc.
88 89 90 91 92 93 94 95 96 97 98 99 00 01 02 03 04 05 06 07 08 09 10 11 12 13 14 15 16 17 18 19 20 21 22 2310
20
30
40
50
60
70
10
20
30
40
50
60
70
11/2
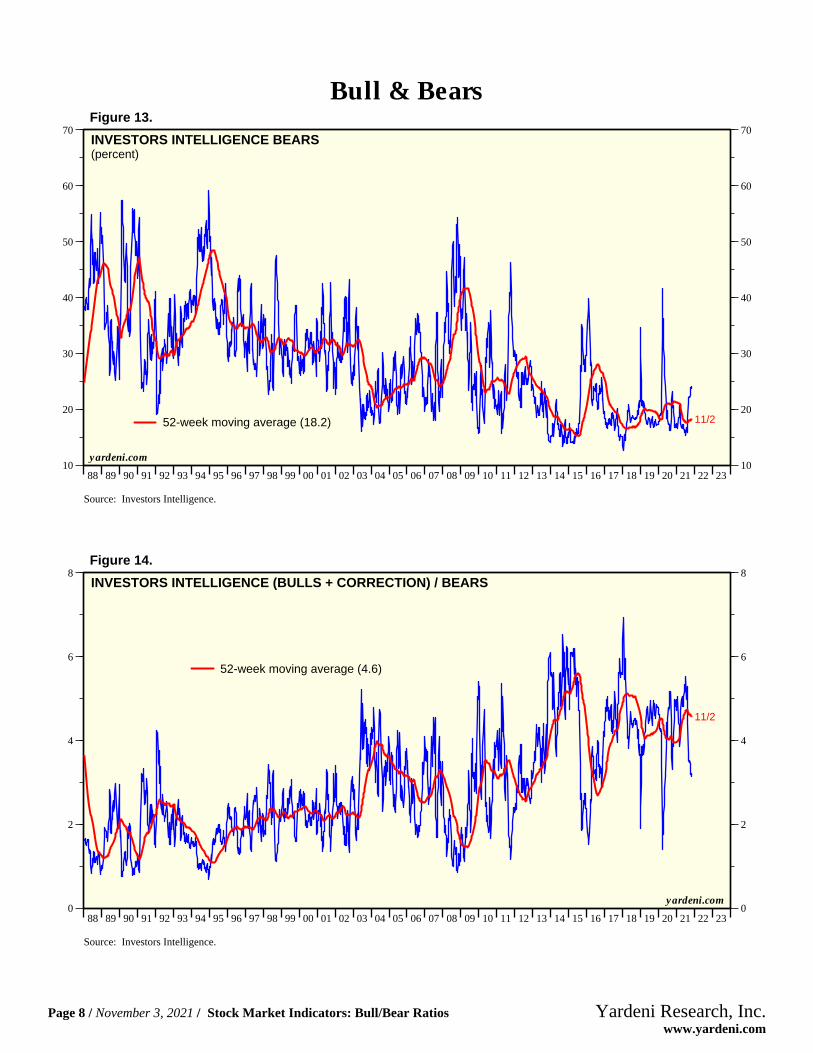
INVESTORS INTELLIGENCE BEARS(percent)
52-week moving average (18.2)
Source: Investors Intelligence.
yardeni.com
Figure 13.
88 89 90 91 92 93 94 95 96 97 98 99 00 01 02 03 04 05 06 07 08 09 10 11 12 13 14 15 16 17 18 19 20 21 22 230
2
4
6
8
0
2
4
6
8
11/2
INVESTORS INTELLIGENCE (BULLS + CORRECTION) / BEARS
52-week moving average (4.6)
Source: Investors Intelligence.
yardeni.com
Figure 14.
Bull & Bears
Page 8 / November 3, 2021 / Stock Market Indicators: Bull/Bear Ratios www.yardeni.com
Yardeni Research, Inc.
88 89 90 91 92 93 94 95 96 97 98 99 00 01 02 03 04 05 06 07 08 09 10 11 12 13 14 15 16 17 18 19 20 21 22 2320
30
40
50
60
70
20
30
40
50
60
70
11/2
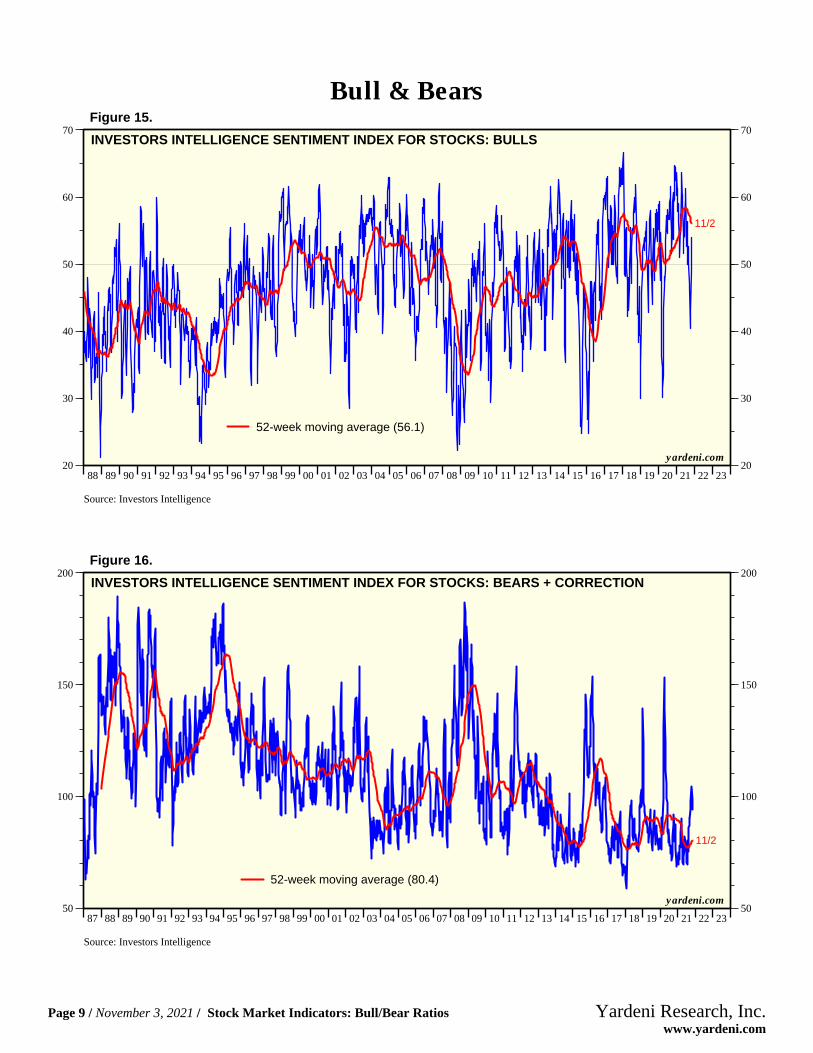
INVESTORS INTELLIGENCE SENTIMENT INDEX FOR STOCKS: BULLS
52-week moving average (56.1)
yardeni.com
Source: Investors Intelligence
Figure 15.
87 88 89 90 91 92 93 94 95 96 97 98 99 00 01 02 03 04 05 06 07 08 09 10 11 12 13 14 15 16 17 18 19 20 21 22 2350
100
150
200
50
100
150
200
11/2
INVESTORS INTELLIGENCE SENTIMENT INDEX FOR STOCKS: BEARS + CORRECTION
52-week moving average (80.4)
yardeni.com
Source: Investors Intelligence
Figure 16.
Bull & Bears
Page 9 / November 3, 2021 / Stock Market Indicators: Bull/Bear Ratios www.yardeni.com
Yardeni Research, Inc.
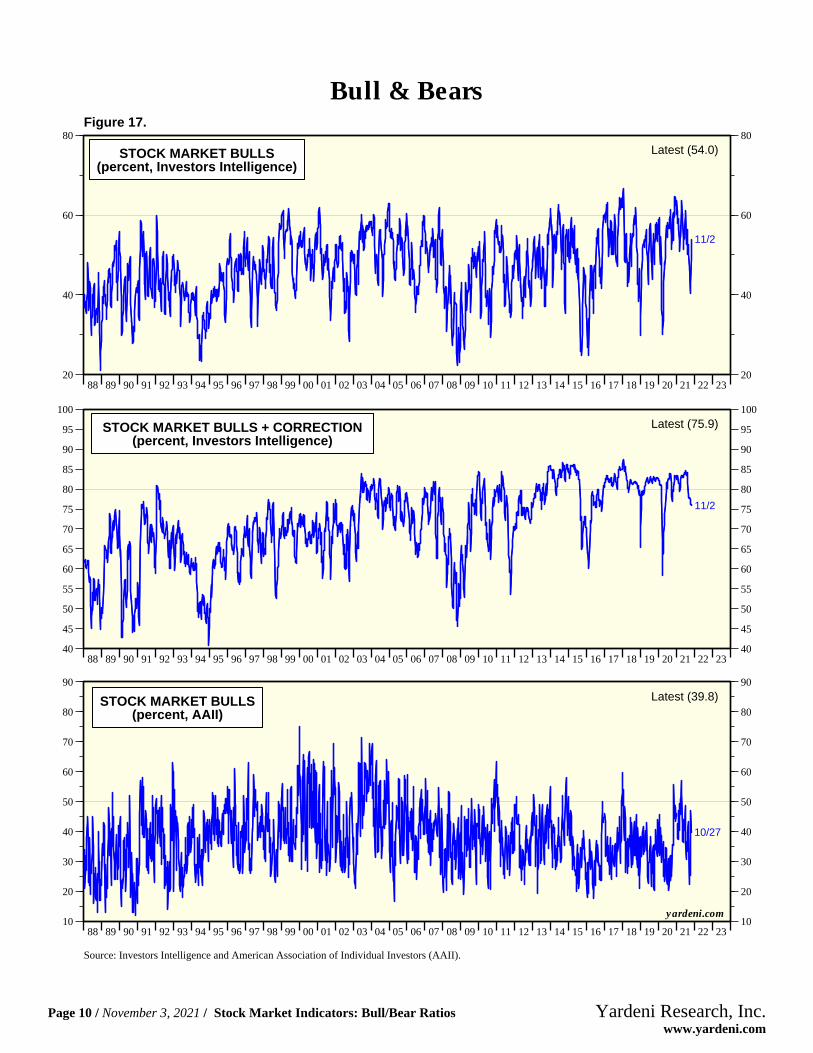
Figure 17.
88 89 90 91 92 93 94 95 96 97 98 99 00 01 02 03 04 05 06 07 08 09 10 11 12 13 14 15 16 17 18 19 20 21 22 2320
40
60
80
20
40
60
80
STOCK MARKET BULLS(percent, Investors Intelligence)
11/2
Latest (54.0)
88 89 90 91 92 93 94 95 96 97 98 99 00 01 02 03 04 05 06 07 08 09 10 11 12 13 14 15 16 17 18 19 20 21 22 2340
45
50
55
60
65
70
75
80
85
90
95
100
40
45
50
55
60
65
70
75
80
85
90
95
100
STOCK MARKET BULLS + CORRECTION(percent, Investors Intelligence)
11/2
Latest (75.9)
88 89 90 91 92 93 94 95 96 97 98 99 00 01 02 03 04 05 06 07 08 09 10 11 12 13 14 15 16 17 18 19 20 21 22 2310
20
30
40
50
60
70
80
90
10
20
30
40
50
60
70
80
90
STOCK MARKET BULLS(percent, AAII)
10/27
Latest (39.8)
Source: Investors Intelligence and American Association of Individual Investors (AAII).
yardeni.com
Bull & Bears
Page 10 / November 3, 2021 / Stock Market Indicators: Bull/Bear Ratios www.yardeni.com
Yardeni Research, Inc.

http://blog.yardeni.com
http://blog.yardeni.com
Copyright (c) Yardeni Research, Inc. 2021. All rights reserved. The informationcontained herein has been obtained from sources believed to be reliable, but is notnecessarily complete and its accuracy cannot be guaranteed. No representation orwarranty, express or implied, is made as to the fairness, accuracy, completeness, orcorrectness of the information and opinions contained herein. The views and the otherinformation provided are subject to change without notice. All reports and podcasts posted onwww.yardeni.com, blog.yardeni.com, and YRI’s Apps are issuedwithout regard to the specific investment objectives, financial situation, or particular needsof any specific recipient and are not to be construed as a solicitation or an offer to buy or sellany securities or related financial instruments. Past performance is not necessarily a guideto future results. Company fundamentals and earnings may be mentioned occasionally, butshould not be construed as a recommendation to buy, sell, or hold the company’s stock.Predictions, forecasts, and estimates for any and all markets should not be construed asrecommendations to buy, sell, or hold any security--including mutual funds, futurescontracts, and exchange traded funds, or any similar instruments.
The text, images, and other materials contained or displayed on any Yardeni Research, Inc.product, service, report, email or website are proprietary to Yardeni Research, Inc. andconstitute valuable intellectual property. No material from any part of www.yardeni.com, blog.yardeni.com, and YRI’s Apps may be downloaded, transmitted,broadcast, transferred, assigned, reproduced or in any other way used or otherwisedisseminated in any form to any person or entity, without the explicit written consent ofYardeni Research, Inc. All unauthorized reproduction or other use of material from YardeniResearch, Inc. shall be deemed willful infringement(s) of this copyright and other proprietaryand intellectual property rights, including but not limited to, rights of privacy. YardeniResearch, Inc. expressly reserves all rights in connection with its intellectual property,including without limitation the right to block the transfer of its products and services and/orto track usage thereof, through electronic tracking technology, and all other lawful means,now known or hereafter devised. Yardeni Research, Inc. reserves the right, without furthernotice, to pursue to the fullest extent allowed by the law any and all criminal and civilremedies for the violation of its rights.
The recipient should check any email and any attachments for the presence of viruses.Yardeni Research, Inc. accepts no liability for any damage caused by any virus transmittedby this company’s emails, website, blog and Apps. Additional information available onrequest.