Embed Size (px)
Citation preview
Stochastic Modeling & SimulationLecture 17 : Probabilistic Inventory Models part 2
Administrative• Problem set 6 due Friday
• Projects: I’ll expect an update this Wednesday
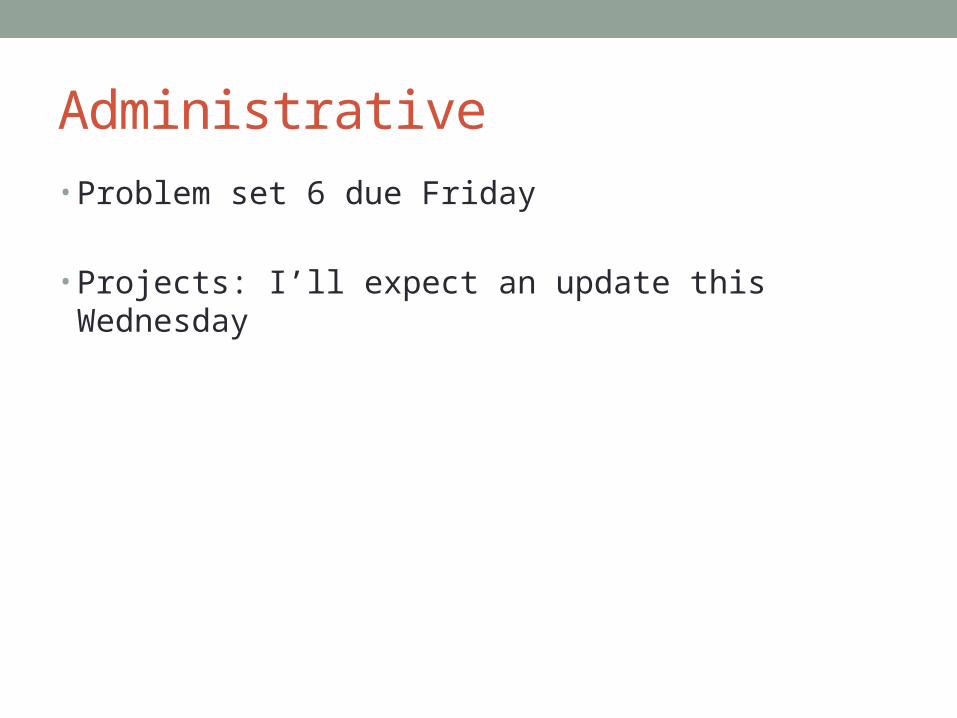
Last time• Derivation of the critical ratio (critical fractile)
(R,Q) Policies
Multi-period inventory analysis with continuous review often results in an (R,Q) ordering policy. • Q: the order quantity
• Last class we focused on a 1 period decision model with uncertain demain.
• R: the reorder point.
• Intuitively, R should be a function of what?
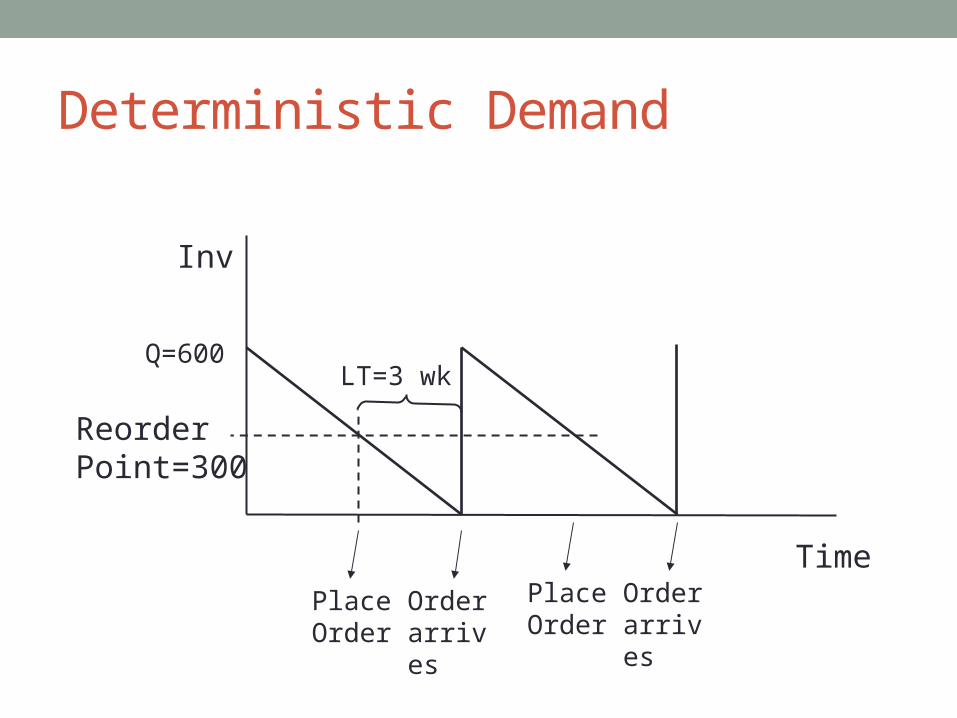
Deterministic Demand
Inv
Time
Q=600
Order arrives
Place Order
ReorderPoint=300
LT=3 wk
Place Order
Order arrives
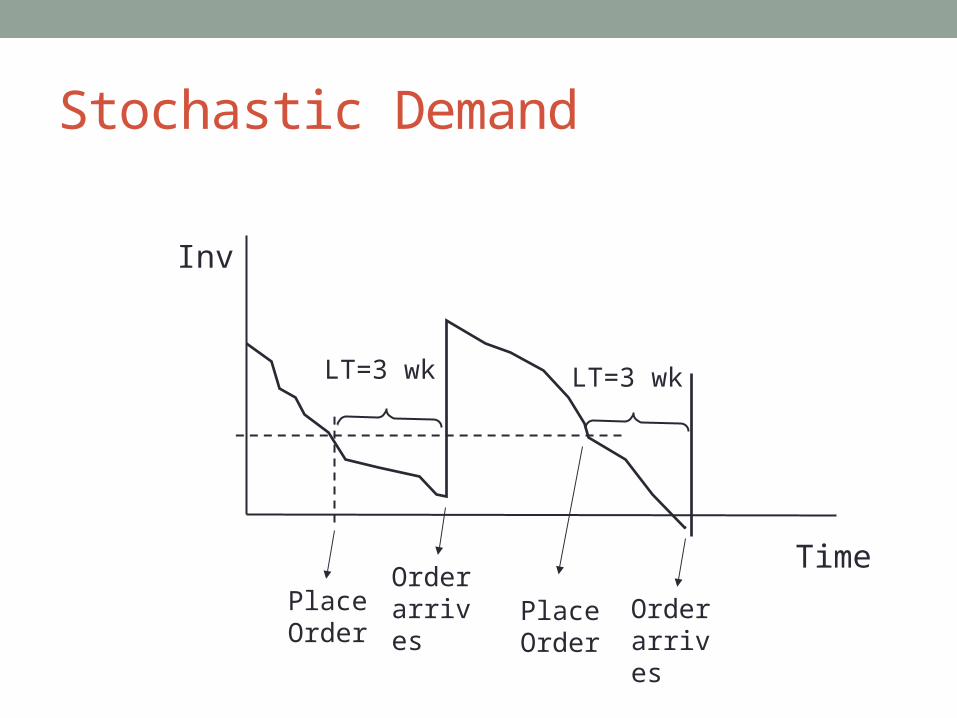
Stochastic Demand
Inv
TimeOrder arrivesPlace
Order
LT=3 wk
Place Order
Order arrives
LT=3 wk
(R,Q) Policies• The reorder point (R) must depend on the demand that might be
observed during the time between stock is reorder and its arrival (i.e., the lead time)
• The following is taken from example 12.7 in the scanned reading. Note: it assume that demand is Normally distributed.• Normality is needed to make the math doable and easier, • Assume: expected annual demand = 1200 units /year with standard
deviation of 70 units. N(1200,702).• Fixed ordering cost of $125 / order• Holding cost of $8/unit per year• Lead time = 1 week.
Demand During Lead Time
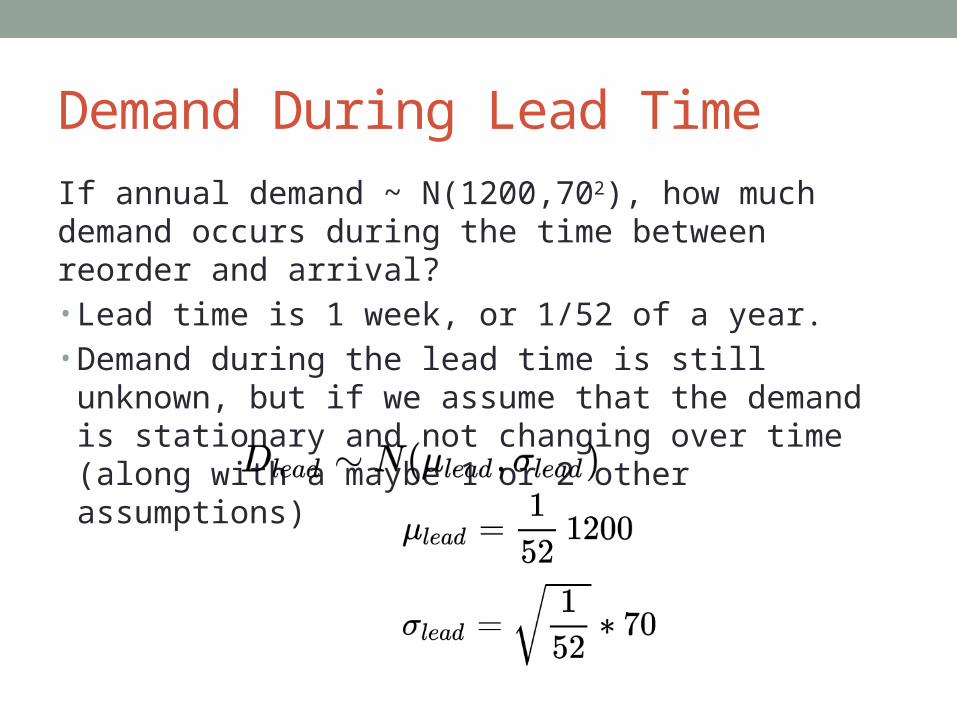
If annual demand ~ N(1200,702), how much demand occurs during the time between reorder and arrival?• Lead time is 1 week, or 1/52 of a year. • Demand during the lead time is still unknown, but if we assume
that the demand is stationary and not changing over time (along with a maybe 1 or 2 other assumptions)
Demand During Lead Time
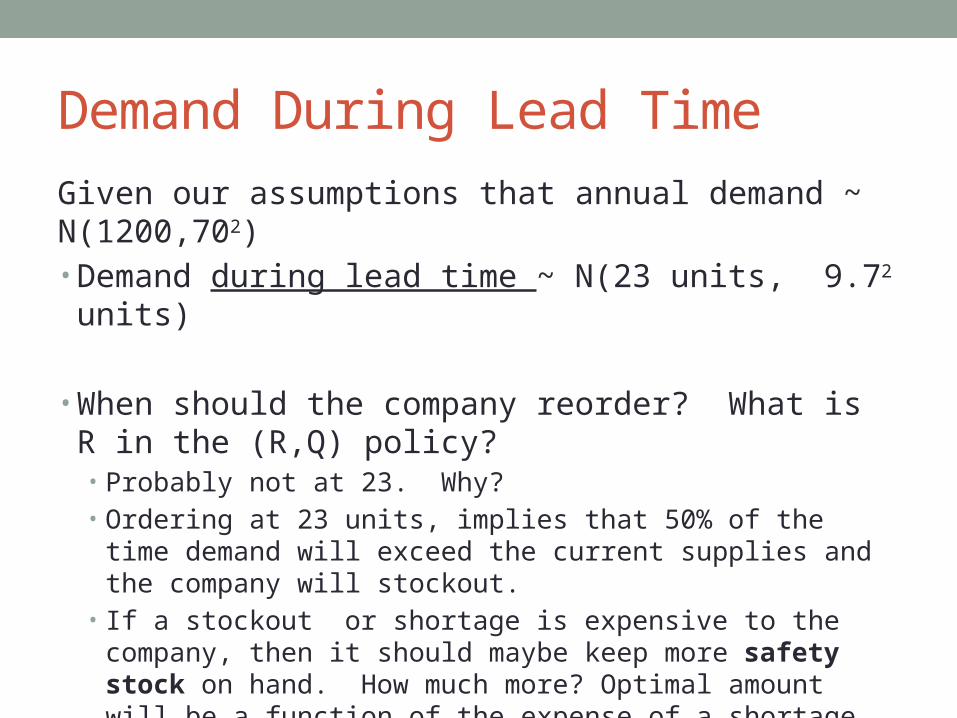
Given our assumptions that annual demand ~ N(1200,702)• Demand during lead time ~ N(23 units, 9.72 units)
• When should the company reorder? What is R in the (R,Q) policy? • Probably not at 23. Why?• Ordering at 23 units, implies that 50% of the time demand will exceed the
current supplies and the company will stockout. • If a stockout or shortage is expensive to the company, then it should
maybe keep more safety stock on hand. How much more? Optimal amount will be a function of the expense of a shortage. • Suppose safety stock was 1 standard deviation of the lead time demand. What
is the probability of a shortage?
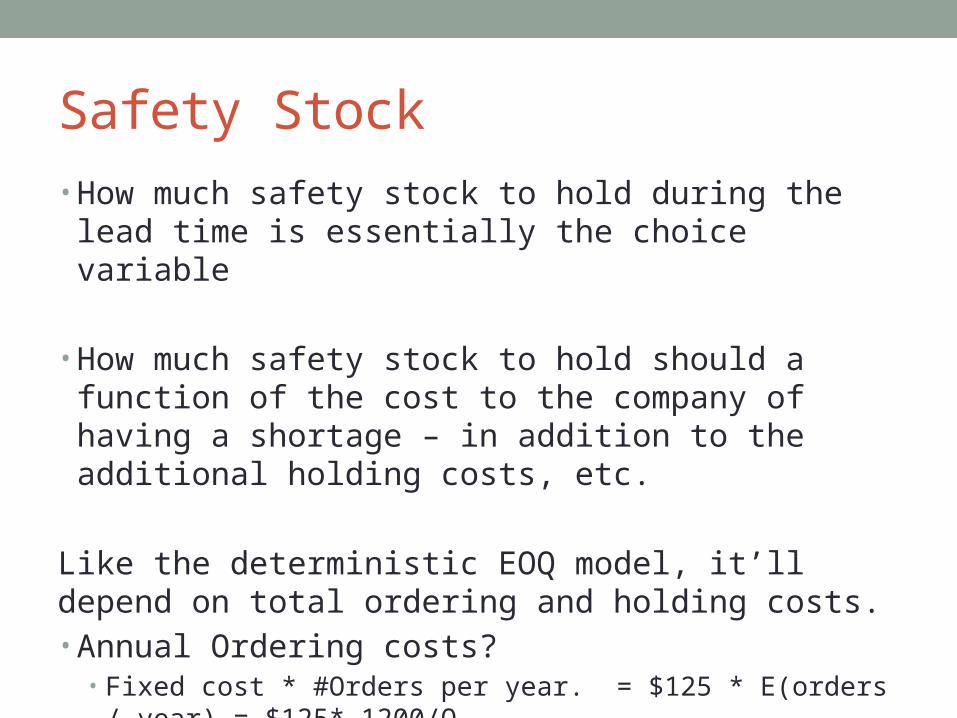
Safety Stock• How much safety stock to hold during the lead time is
essentially the choice variable
• How much safety stock to hold should a function of the cost to the company of having a shortage – in addition to the additional holding costs, etc.
Like the deterministic EOQ model, it’ll depend on total ordering and holding costs.• Annual Ordering costs?
• Fixed cost * #Orders per year. = $125 * E(orders / year) = $125* 1200/Q.
Holding Costs
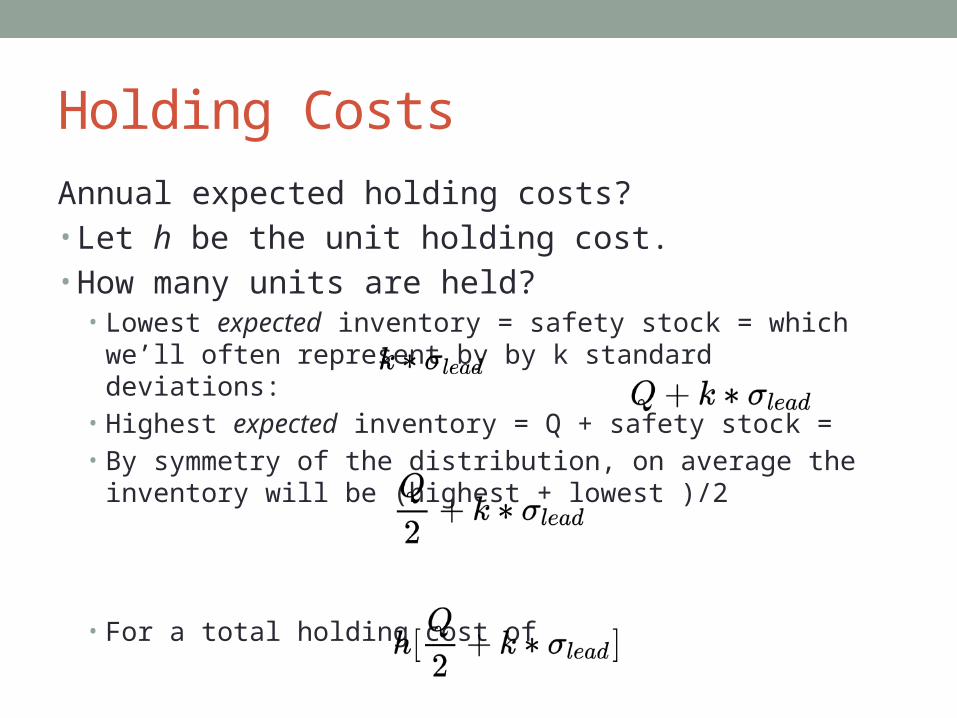
Annual expected holding costs?• Let h be the unit holding cost. • How many units are held?
• Lowest expected inventory = safety stock = which we’ll often represent by by k standard deviations:
• Highest expected inventory = Q + safety stock =• By symmetry of the distribution, on average the inventory will be (highest
+ lowest )/2
• For a total holding cost of
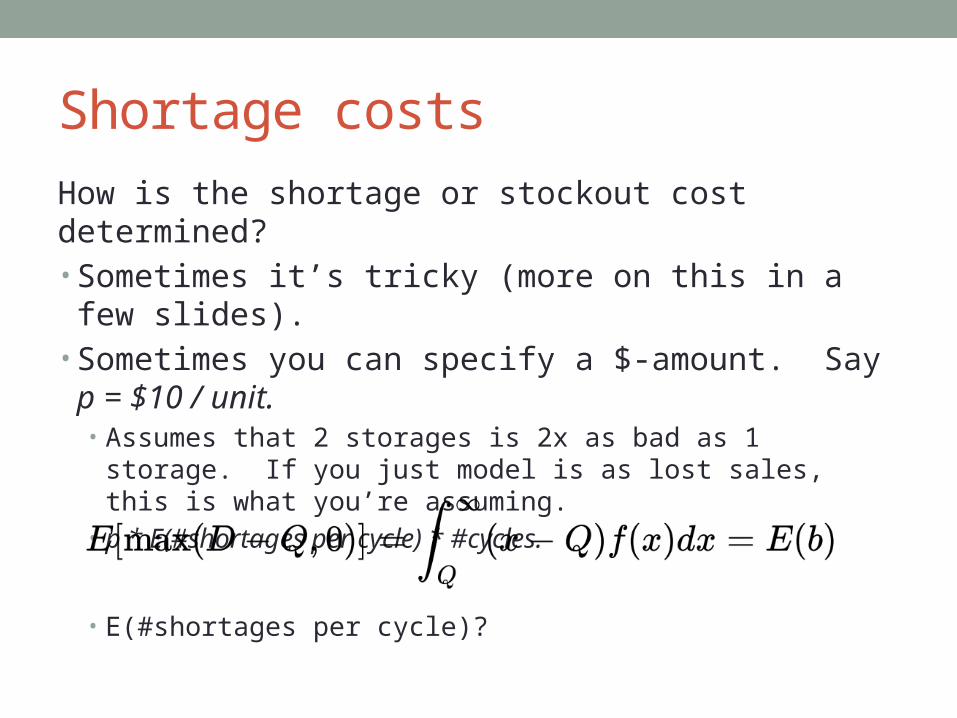
Shortage costs
How is the shortage or stockout cost determined? • Sometimes it’s tricky (more on this in a few slides). • Sometimes you can specify a $-amount. Say p = $10 / unit.
• Assumes that 2 storages is 2x as bad as 1 storage. If you just model is as lost sales, this is what you’re assuming.
• p * E(#shortages per cycle) * #cycles.
• E(#shortages per cycle)?
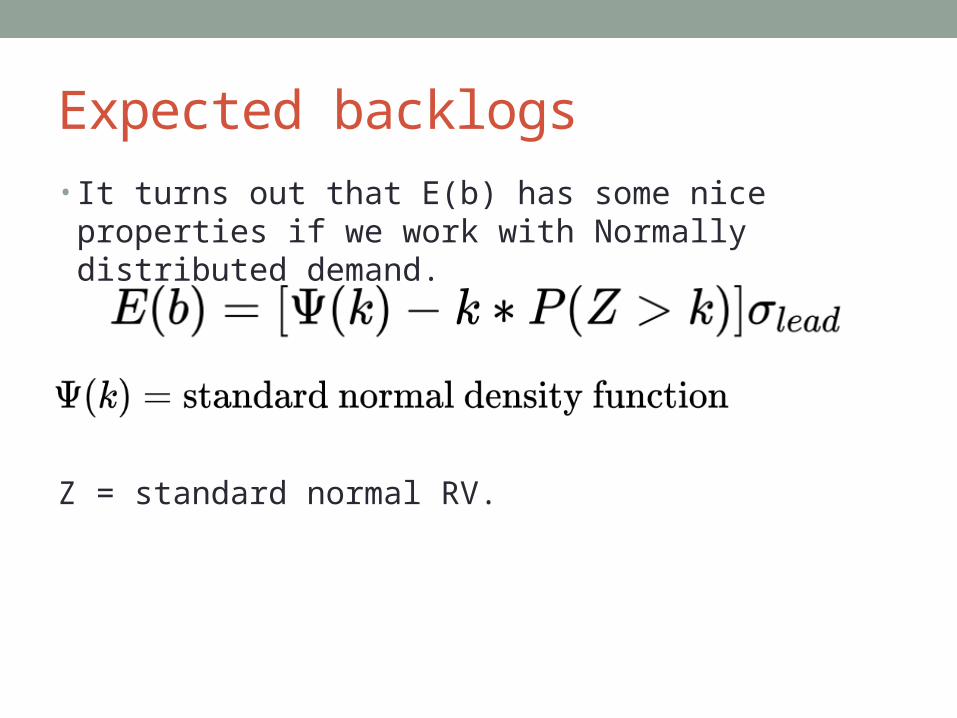
Expected backlogs • It turns out that E(b) has some nice properties if we work with
Normally distributed demand.
Z = standard normal RV.

Spreadsheet Implementation• See Ordering Cameras 1.xls
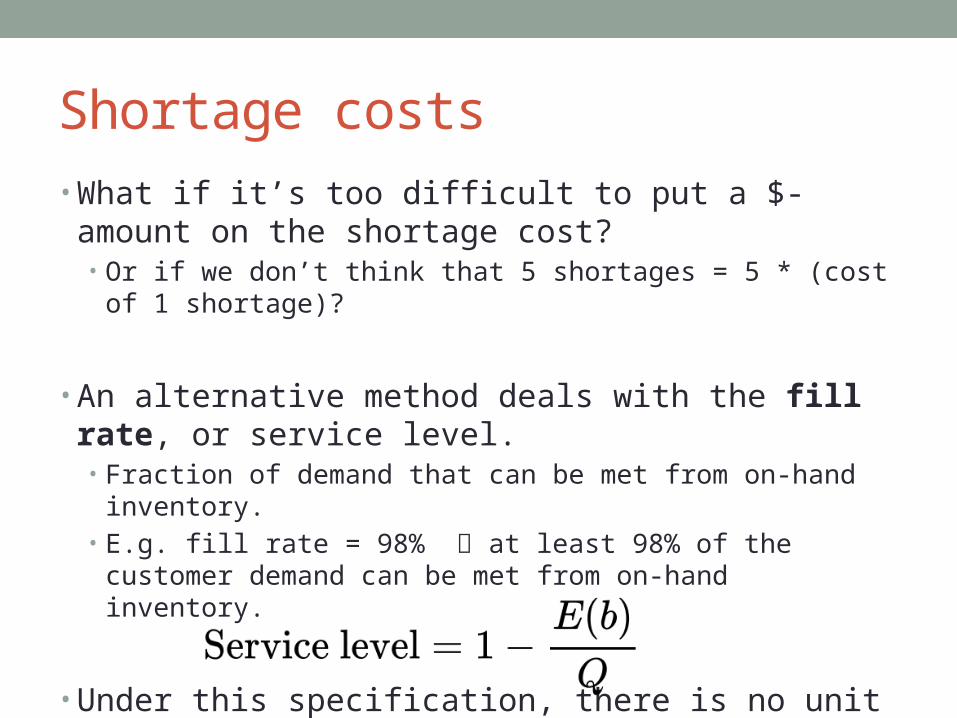
Shortage costs• What if it’s too difficult to put a $-amount on the shortage cost?
• Or if we don’t think that 5 shortages = 5 * (cost of 1 shortage)?
• An alternative method deals with the fill rate, or service level.• Fraction of demand that can be met from on-hand inventory.• E.g. fill rate = 98% at least 98% of the customer demand can be met
from on-hand inventory.
• Under this specification, there is no unit shortage cost but we still have to keep track of expected # shortages per cycle, E(b)
Spreadsheet Implementation• See Ordering Cameras 2.xls


![[203012] Inventory control process from probabilistic](https://img.dokumen.tips/doc/110x75/62343c555b43ca11c13cab15/203012-inventory-control-process-from-probabilistic-.jpg)