Embed Size (px)
Citation preview
STOCHASTIC ANALYSIS OF MARKETING STRATEGIES IN
INTERNET TRAFFIC
Diwakar Shukla* and Sanjay Thakur**
*Department of Mathematics and Statistics, Sagar University, Sagar, M.P., 470003, India.
e-mail: [email protected]
**Department of Computer Science & Applications., Sagar University, Sagar, M.P., 470003, India.
e-mail: [email protected]
ABSTRACT
In the present days of electronic media, more and more people are using to Internet access
for their official, personal, entertainment or other related works. Besides expanding services
through broadband, a majority of people are still using modem based dialup connections for
availing the Internet connectivity at their homes or organizations. There are many Internet
service providers grooming in the market causing inherent competition in business. Due to high
demand, users are growing drastically day-by-day creating excess traffic load and congestion on
the dialup network. Service providers (or operators) are offering attractive packages to improve
upon their customer-base as a part of marketing strategies. This paper presents a stochastic
analysis of Internet traffic distribution among operators in light of 'Hold-on' and 'Pull-Back'
marketing strategies along with controlled usual parameters like first-choice and quality-of-
service. It is observed that traffic distribution of different categories of users is influenced by the
new marketing strategies. The first choice also depends on marketing plans and network
blocking probabilities. Simulation study is performed with the help of a Markov chain model to
examine the interrelationship among various market related parameters and traffic distribution.
KEYWORDS
Markov chain model, Transition probability, Initial preference, Blocking probability, Call-by-call
basis, Internet Service Provider [ or Operators], Internet access, Internet traffic, Quality of Service
(QoS), Simulation, Network congestion, Transition probability matrix, Users behavior.
ACM SUBJECT CLASSIFICATION
SD I.6.5 (Methodologies, Modeling), I.6.3 (Modeling and Simulation applications), G.3
(Probability and Statistics), SD F.1.2 (Computation, Probabilistic).
2
1.0 INTRODUCTION
The increasing demand of Internet access has generated an inherent competition among
the service providers, specially in terms of their quality of service (QoS). In many countries,
besides broadband service, a majority of organizations, businessmen and individuals are using
modem as a technical device to connect their Internet in the dial-up setup of Public Switched
Telecommunications Network (PSTN) [see Naldi (1999)]. In the market, a group of companies
are owner of the network services at wide area level (called Service Providers) whereas
metropolitan area networks are in the control of operators. The immense use of Internet has
caused congestion in packet flow in networks and users have to make repeated attempts before
getting their call connected by an operator. Due to other technical problems, the network of an
operator fails to provide connectivity even after intense efforts and users think of to change the
operator. The growth of operators, in high proportion in the Internet business market, has
generated inherent competition in attracting more and more users for enhancing their customer-
base. Traffic distribution, in the network, is usually influence by the market related factors like
‘first-choice’ and ‘quality-of-service’ offered by an operator. The first-choice relates to
advertising and marketing strategies launched by service providers to attract the stuff of users.
Quality-of-service relates to the network blocking because of inadequate number of modems,
failure of switches, fault in cable connection, instant failure of servers, defects in networking
articles etc. Moreover, blocking may occur due to other sources like excess traffic load, packet
collision and path congestion. Operators are assumed to invest more and more capital to keep up
high quality network infrastructure in order to maintain uniformly an adequate low level of
blocking probability. Due to inherent competition in business, operators used to provide a
variety of attractive offers to consumers in the form of Internet service packages. A user with
free Internet access continues to enjoy a low cost service but suffers with a high blocking
probability.
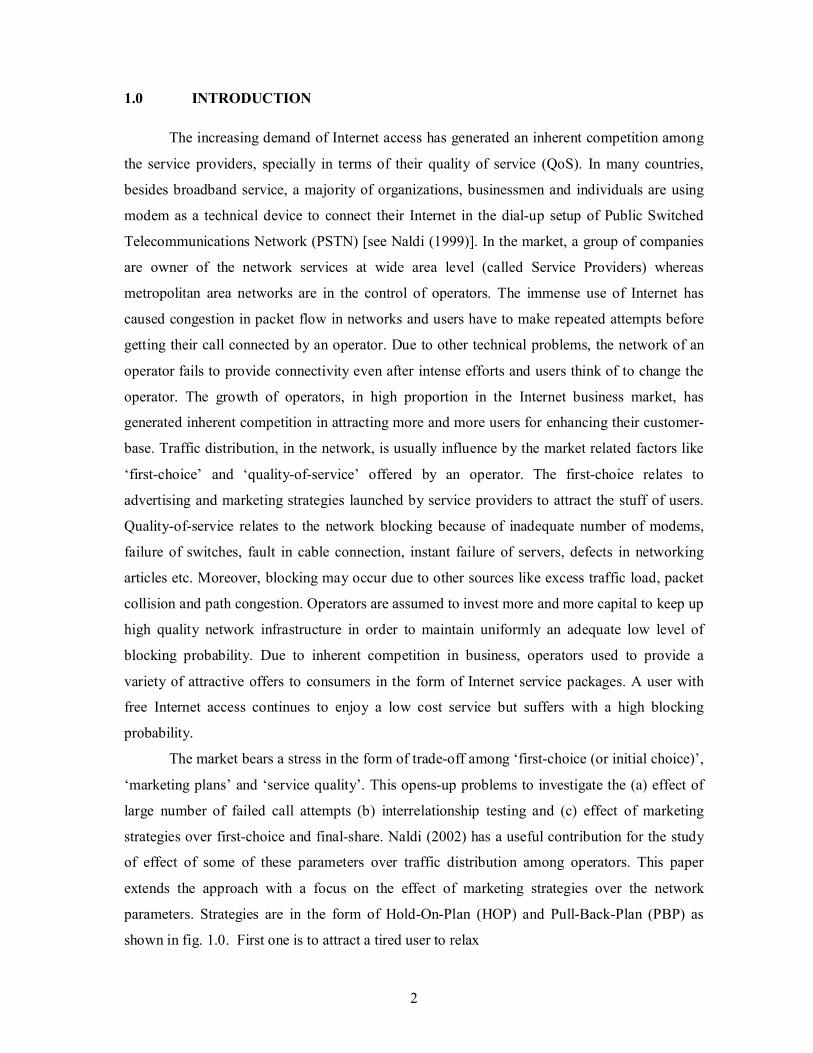
The market bears a stress in the form of trade-off among ‘first-choice (or initial choice)’,
‘marketing plans’ and ‘service quality’. This opens-up problems to investigate the (a) effect of
large number of failed call attempts (b) interrelationship testing and (c) effect of marketing
strategies over first-choice and final-share. Naldi (2002) has a useful contribution for the study
of effect of some of these parameters over traffic distribution among operators. This paper
extends the approach with a focus on the effect of marketing strategies over the network
parameters. Strategies are in the form of Hold-On-Plan (HOP) and Pull-Back-Plan (PBP) as
shown in fig. 1.0. First one is to attract a tired user to relax
3
a bit, after a large number of failed call attempts (in the form of tea-shop, refreshment, game)
whereas second is to pull-back the user to an operator (like lottery, gift voucher, cost free offer)
to resume the call connecting task. These plans may be implement nearby to the place of work
selected by the user.
In this paper, all these are introduced by building a simple stochastic model for user’s
behavior with different categories of their attitudes. In the beginning part of this text, analysis is
performed with only two operators and later extended to the case of N operators. Contributions
of Medhi (1991), Naldi (1999), Yuan and Lygeres (2005), Farber et. al.(1998,1999), are used as
helping tools to design and perform the model based analysis.
1.1 USER’S BEHAVIOR AS A SYSTEM
Consider following hypotheses for the behavior of user, with rest, blocking, and initial
choice parameters, while sharing the traffic between the two operators:
The competitive market has a café, containing Internet facility of operators O1 and O2.
A user enters into café with initial choice (first-choice) p and (1-p) for O1 and O2
respectively (0 ≤ p ≤ 1).
The p is affected by advertising, marketing, quality-of-service and past preference (or
attractiveness).
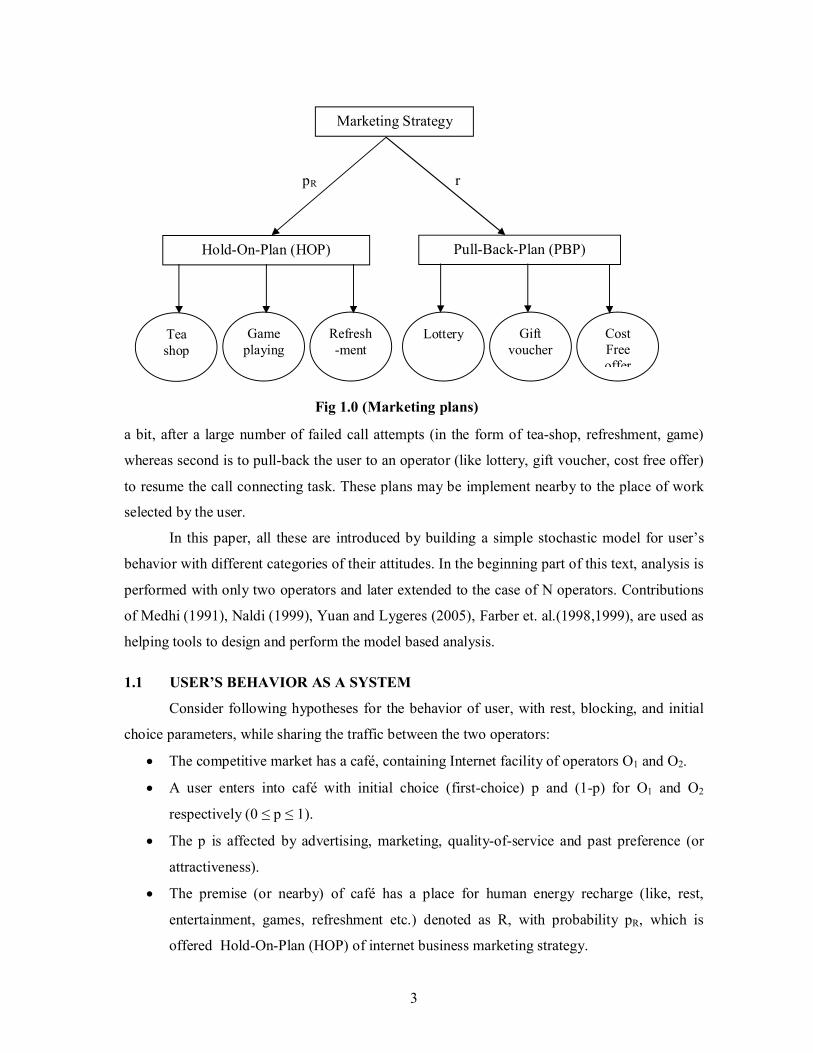
The premise (or nearby) of café has a place for human energy recharge (like, rest,
entertainment, games, refreshment etc.) denoted as R, with probability pR, which is
offered Hold-On-Plan (HOP) of internet business marketing strategy.
Marketing Strategy
Hold-On-Plan (HOP) Pull-Back-Plan (PBP)
Tea shop
Game playing
Refresh-ment
Lottery Gift voucher
Cost Free offer
pR r
Fig 1.0 (Marketing plans)
4
After each failed call attempt, the user has three choices: he can abandon with
probability pA, switch over to other operator for a new attempt or moves for a little rest
(on R).
From R, user switches to either of operators [with probability r and (1-r)] but can not
abandon. The r relates to another Pull-Back-Plan (PBP) of marketing offered by operator.
Switching among O1, O2 and R is on call-by-call basis depending just on the latest
attempt. The physical movement of user is also an attempt.
During the repeated calls, the blocking probability offered by O1 is L1 and of O2 is L2.
The blocking implies situation when call attempt process fails to connect an operator.
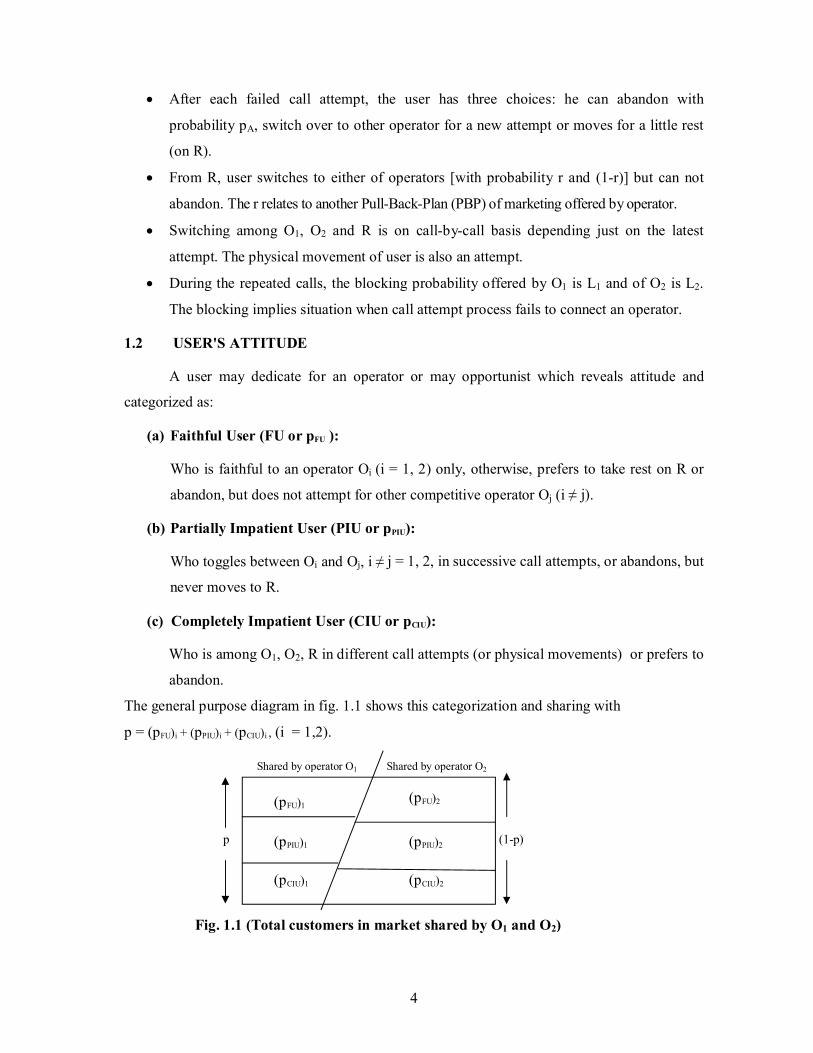
1.2 USER'S ATTITUDE
A user may dedicate for an operator or may opportunist which reveals attitude and
categorized as:
(a) Faithful User (FU or pFU ):
Who is faithful to an operator Oi (i = 1, 2) only, otherwise, prefers to take rest on R or
abandon, but does not attempt for other competitive operator Oj (i ≠ j).
(b) Partially Impatient User (PIU or pPIU):
Who toggles between Oi and Oj, i ≠ j = 1, 2, in successive call attempts, or abandons, but
never moves to R.
(c) Completely Impatient User (CIU or pCIU):
Who is among O1, O2, R in different call attempts (or physical movements) or prefers to
abandon.
The general purpose diagram in fig. 1.1 shows this categorization and sharing with
p = (pFU)i + (pPIU)i + (pCIU)i , (i = 1,2).
(pPIU)1
(pFU)2
(pPIU)2
(pCIU)2
Shared by operator O1 Shared by operator O2
(1-p) p
(pCIU)1
(pFU)1
Fig. 1.1 (Total customers in market shared by O1 and O2)
5
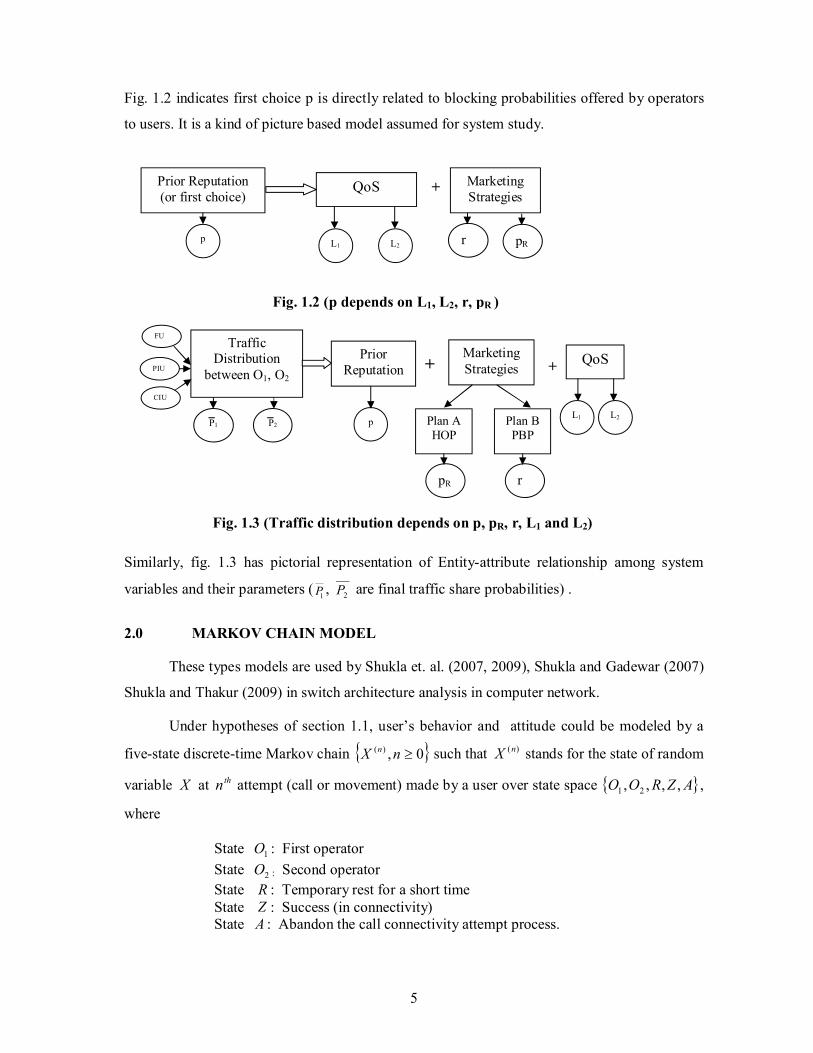
Fig. 1.2 indicates first choice p is directly related to blocking probabilities offered by operators
to users. It is a kind of picture based model assumed for system study.
Similarly, fig. 1.3 has pictorial representation of Entity-attribute relationship among system
variables and their parameters (1P ,
2P are final traffic share probabilities) .
2.0 MARKOV CHAIN MODEL
These types models are used by Shukla et. al. (2007, 2009), Shukla and Gadewar (2007)
Shukla and Thakur (2009) in switch architecture analysis in computer network.
Under hypotheses of section 1.1, user’s behavior and attitude could be modeled by a
five-state discrete-time Markov chain 0,)( nX n such that )(nX stands for the state of random
variable X at thn attempt (call or movement) made by a user over state space AZROO ,,,, 21 ,
where
State 1O : First operator
State 2O : Second operator
State R : Temporary rest for a short time State Z : Success (in connectivity) State A : Abandon the call connectivity attempt process.
+
Traffic Distribution
between O1, O2
QoS
L1 L2
Prior Reputation
p P1 P2
Marketing Strategies
Plan A HOP
Plan B PBP
pR
r
+
FU
PIU
CIU
Fig. 1.2 (p depends on L1, L2, r, pR )
Fig. 1.3 (Traffic distribution depends on p, pR, r, L1 and L2)
Prior Reputation (or first choice)
QoS
L1 L2 p
+ Marketing Strategies
pR
r
6
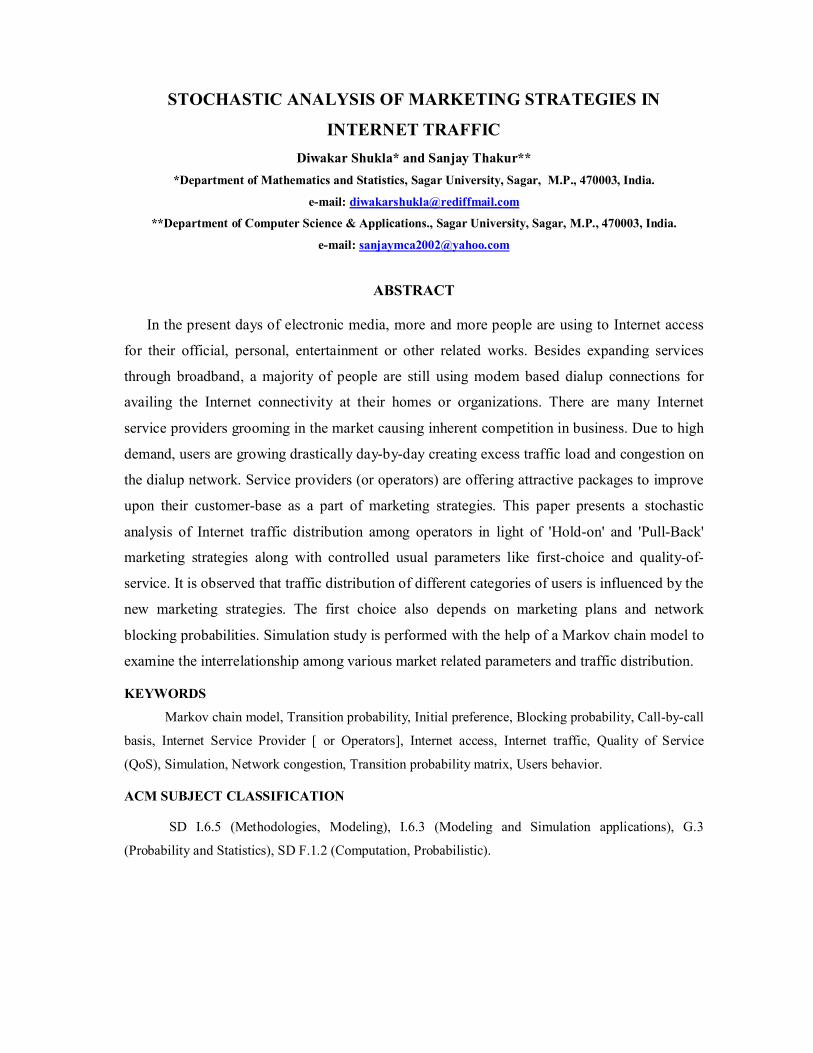
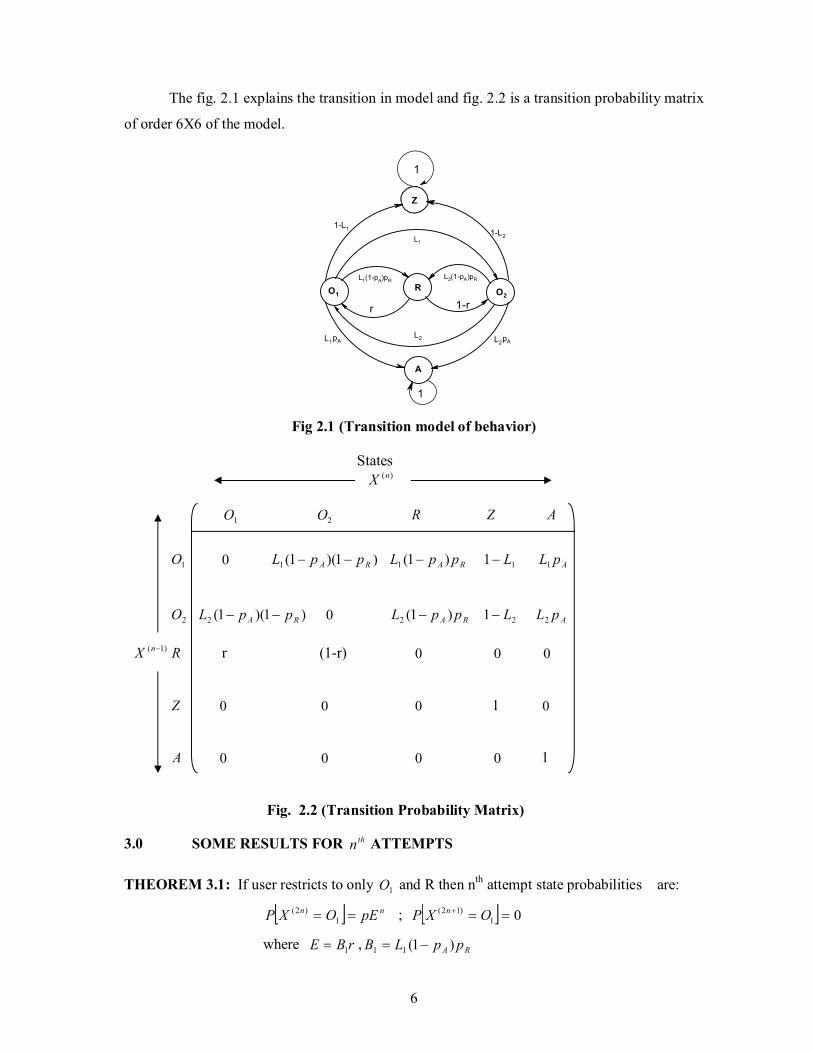
The fig. 2.1 explains the transition in model and fig. 2.2 is a transition probability matrix
of order 6X6 of the model.
Z
A
O2O1
L1
L2
1-L2
1-L1
1
L1 pA L2
pA
1
R
r 1-r
L1(1-pA)pRL2(1-pA)pR
Fig 2.1 (Transition model of behavior)
States
)(nX 1O 2O R Z A
1O 0 )1)(1(1 RA ppL RA ppL )1(1 11 L ApL1
2O )1)(1(2 RA ppL 0 RA ppL )1(2 21 L ApL2
)1( nX R r (1-r) 0 0 0
Z 0 0 0 1 0
A 0 0 0 0 1 Fig. 2.2 (Transition Probability Matrix)
3.0 SOME RESULTS FOR thn ATTEMPTS
THEOREM 3.1: If user restricts to only 1O and R then nth attempt state probabilities are:
nn pEOXP 1)2( ; 01
)12( OXP n
where rBE 1 , RA ppLB )1(11
7
THEOREM 3.2: If user restricts to only 2O and R then thn attempt state probabilities are:
nn DpOXP )1(2)2( ; 02
)12( OXP n
where, )1(2 rBD , RA ppLB )1(22
THEOREM 3.3: If user restricts to only between 1O and 2O , not interested for
R then nn pCOXP 1)2( ; nn CApOXP 21
)12( )1(
nn CpOXP )1(2)2( ; nn CpAOXP 12
)12(
where 21 AAC , )1)(1(11 RA ppLA , )1)(1(22 RA ppLA
THEOREM 3.4: If call attempt is among 1O , 2O and R only then for thn state probability
the approximate expressions are:
nn ECpOXP )(1)2(
nn EDCApOXP )()1( 21)12(
nn DCpOXP ))(1(2)2(
nn EDCpAOXP )(12)12(
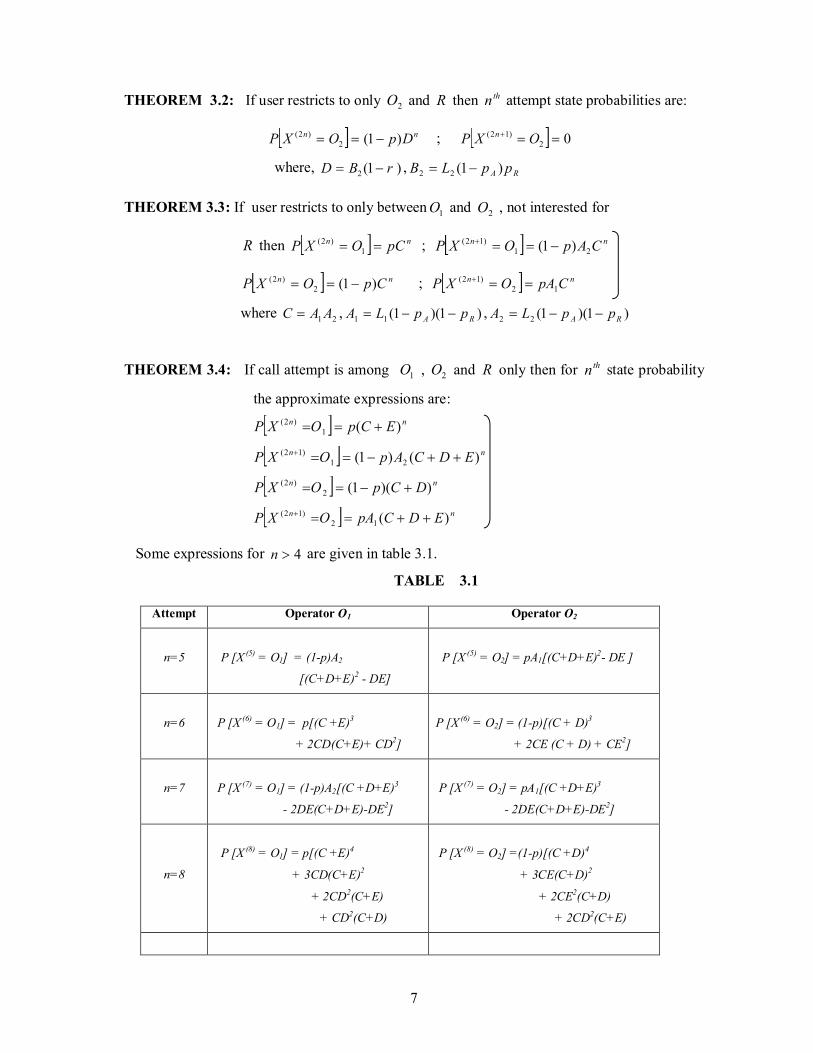
Some expressions for 4n are given in table 3.1.
TABLE 3.1
Attempt Operator O1 Operator O2
n=5
P [X (5) = O1] = (1-p)A2
[(C+D+E)2 - DE]
P [X (5) = O2] = pA1[(C+D+E)2- DE ]
n=6
P [X (6) = O1] = p[(C +E)3
+ 2CD(C+E)+ CD2]
P [X (6) = O2] = (1-p)[(C + D)3
+ 2CE (C + D) + CE2]
n=7
P [X (7) = O1] = (1-p)A2[(C +D+E)3
- 2DE(C+D+E)-DE2]
P [X (7) = O2] = pA1[(C +D+E)3
- 2DE(C+D+E)-DE2]
n=8
P [X (8) = O1] = p[(C +E)4
+ 3CD(C+E)2
+ 2CD2(C+E)
+ CD2(C+D)
P [X (8) = O2] =(1-p)[(C +D)4
+ 3CE(C+D)2
+ 2CE2(C+D)
+ 2CD2(C+E)
8
n=9 P [X (9) = O1] = (1-p)A2[(C +D+E)4
- 3DE(C +D+E)2
- 2C2DE - D2E2]
P [X (9) = O2] = pA1[(C +D+E)4
- 3DE(C +D+E)2
- 2C2DE - D2E2]
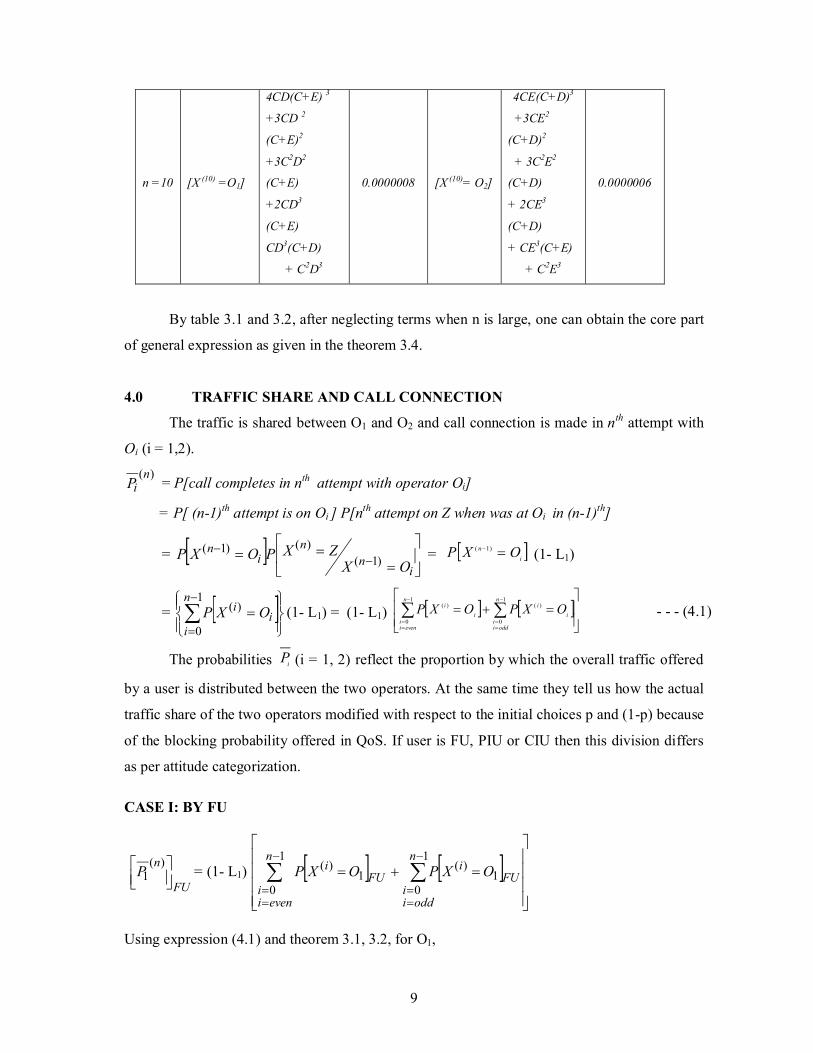
n=10
P [X (10) = O1] = p[(C +E)5
+ 4CD(C+E)3
+ 3CD2(C+E)2
+ 3C2D2(C+E)
+ 2CD3(C+E)
+ CD3(C+D)
+ C2D3 ]
P [X (10) = O2] = (1-p)[(C +D)5
+ 4CD(C+D)3
+ 3CD2(C+D)2
+ 3C2E2(C+D)
+ 2CE3(C+D)
+ CE3(C+E)
+ C2E3 ]
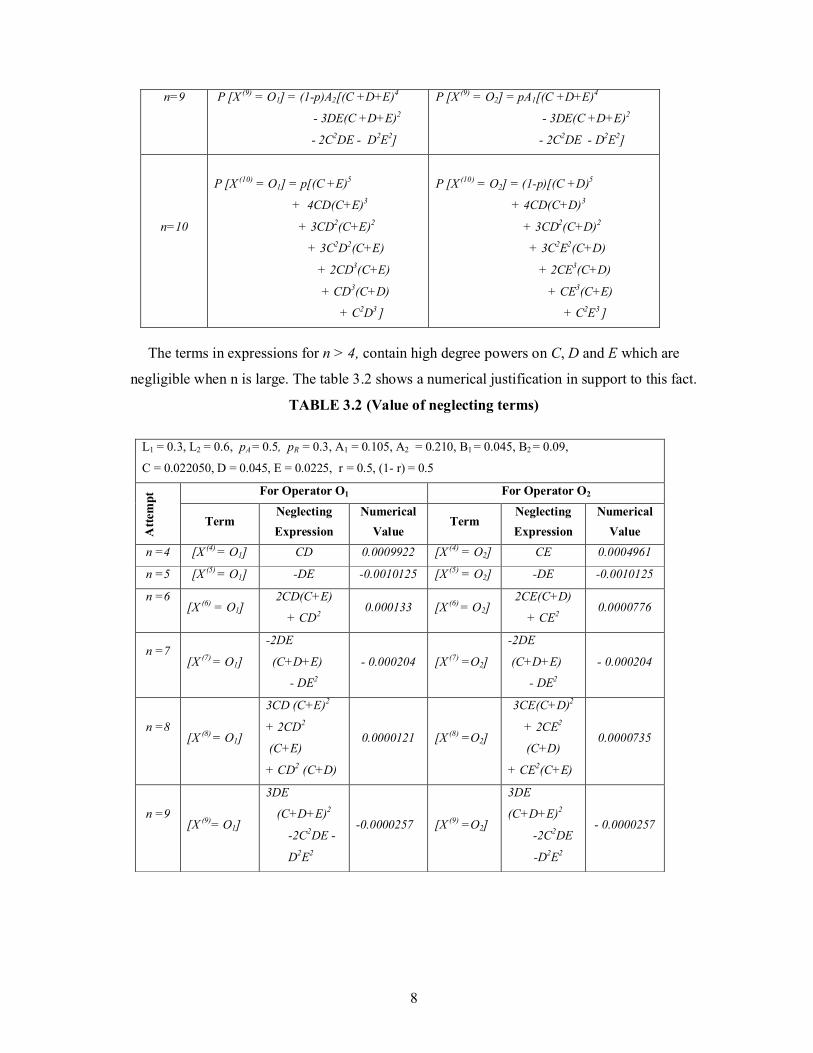
The terms in expressions for n > 4, contain high degree powers on C, D and E which are
negligible when n is large. The table 3.2 shows a numerical justification in support to this fact.
TABLE 3.2 (Value of neglecting terms)
L1 = 0.3, L2 = 0.6, pA = 0.5, pR = 0.3, A1 = 0.105, A2 = 0.210, B1 = 0.045, B2 = 0.09,
C = 0.022050, D = 0.045, E = 0.0225, r = 0.5, (1- r) = 0.5
For Operator O1 For Operator O2
Att
emp
t
Term Neglecting
Expression
Numerical
Value Term
Neglecting
Expression
Numerical
Value
n =4 [X (4) = O1] CD 0.0009922 [X (4) = O2] CE 0.0004961
n =5 [X (5) = O1] -DE -0.0010125 [X (5) = O2] -DE -0.0010125
n =6
[X (6) = O1]
2CD(C+E)
+ CD2 0.000133 [X (6) = O2]
2CE(C+D)
+ CE2 0.0000776
n =7
[X (7) = O1]
-2DE
(C+D+E)
- DE2
- 0.000204 [X (7) =O2]
-2DE
(C+D+E)
- DE2
- 0.000204
n =8
[X (8) = O1]
3CD (C+E)2
+ 2CD2
(C+E)
+ CD2 (C+D)
0.0000121 [X (8) =O2]
3CE(C+D)2
+ 2CE2
(C+D)
+ CE2(C+E)
0.0000735
n =9
[X (9)= O1]
3DE
(C+D+E)2
-2C2DE -
D2E2
-0.0000257 [X (9) =O2]
3DE
(C+D+E)2
-2C2DE
-D2E2
- 0.0000257
9
n =10 [X (10) =O1]
4CD(C+E) 3
+3CD 2
(C+E)2
+3C2D2
(C+E)
+2CD3
(C+E)
CD3(C+D)
+ C2D3
0.0000008 [X (10)= O2]
4CE(C+D)3
+3CE2
(C+D)2
+ 3C2E2
(C+D)
+ 2CE3
(C+D)
+ CE3(C+E)
+ C2E3
0.0000006
By table 3.1 and 3.2, after neglecting terms when n is large, one can obtain the core part
of general expression as given in the theorem 3.4.
4.0 TRAFFIC SHARE AND CALL CONNECTION
The traffic is shared between O1 and O2 and call connection is made in nth attempt with
Oi (i = 1,2).
)(niP = P[call completes in nth attempt with operator Oi]
= P[ (n-1)th attempt is on Oi ] P[nth attempt on Z when was at Oi in (n-1)th]
=
in
ni
n
OXZXPOXP )1(
)()1( = i
n OXP )1(
(1- L1)
=
1
0
)(n
ii
i OXP (1- L1) = (1- L1)
1
0
1
0
)()(n
evenii
n
oddii
i
i
i
i OXPOXP
The probabilities iP (i = 1, 2) reflect the proportion by which the overall traffic offered
by a user is distributed between the two operators. At the same time they tell us how the actual
traffic share of the two operators modified with respect to the initial choices p and (1-p) because
of the blocking probability offered in QoS. If user is FU, PIU or CIU then this division differs
as per attitude categorization.
CASE I: BY FU
FU
nP
)(1 = (1- L1)
1
0
1
01
)(1
)(n
evenii
n
oddii
FUi
FUi OXPOXP
Using expression (4.1) and theorem 3.1, 3.2, for O1,
- - - (4.1)
10
FU
nP
)2(1 = (1- L1) p
E
nE1
1
FU
nP
)12(1 = (1- L1) p
E
nE1
11
Similar for O2 :
FU
nP
)2(2 = (1-L2)
D
nDp1
1)1(
FU
nP
)12(2 = (1- L2) p
D
nDp1
11)1(
CASE II: BY PIU
PIU
nP
)(1 = (1- L1)
1
0
1
01
)(1
)(n
evenii
n
oddii
PIUi
PIUi OXPOXP
Using (7.1) and theorem 3.3, for O1,
PIU
nP
)2(1 = (1- L1)
C
nCApp1
12)1(
PIU
nP
)12(1 = (1- L1)
C
nCApnCp
1
)1(2
)1()11(
For O2 :
PIU
nP
)2(2 = (1- L2)
C
nCpAp1
11)1(
PIU
nP
)12(2 = (1- L2)
C
nCpAnCp
1
)1(1
)11)(1(
CASE III: BY CIU
CIU
nP
)(1 = (1- L1)
1
0
1
01
)(1
)(n
evenii
n
oddii
CIUi
CIUi OXPOXP
-- - (4.2)
-- - (4.3)
-- - (4.4)
-- - (4.5)
11
Using (4.1) and theorem 3.4, for O1,
CIU
nP
)2(1 = (1- L1)
)(1)(1
2)1(
)(1)(1
EDC
nEDCAp
EC
nECp
CIU
nP
)12(1 = (1- L1)
)(1
)(12
)1()(1
1)(1EDC
nEDCAp
EC
nECp
For O2:
CIU
nP
)2(2 = (1- L2)
)(1
)(11)(1
)(1)1(
EDC
nEDCpA
DC
nDCp
CIU
nP
)12(2 = (1- L2)
)(1)(1
1)(1
1)(1)1(
EDC
nEDCpA
DC
nDCp
5.0 TRAFFIC SHARE OVER LARGE NUMBER OF ATTEMPTS
Suppose n is large, then
)(
limn
iniPP , i = 1, 2 and
E
pLP
FU
n
1
)1( 1)(1 ;
D
pLP
FU
n
1
)1)(1( 2)(2 - - - (5.1)
C
AppLP
PIU
n
1
)1()1( 2
1)(
1 ;
C
pApLP
PIU
n
1
)1()1( 1
2)(
2
- - - (5.2)
)(1
)1(
)(1)1( 2
1)(
1EDC
Ap
EC
pLP
CIU
n
)(1)(1
1)1( 1
2)(
2EDC
pA
DC
pLP
CIU
n - - - (5.3)
6.0 COMPARISON
For O1:
PIUFU PP 11 if
E
CE
A
p
1
11
1
2
- - - (6.1)
-- - (4.6)
- - (4.7)
12
CIUFU PP 11 if
EC
D
EA
Cp
11
1
11
1
2
- - - (6.2)
CIUPIU PP 11 if
EC
D
EDA
Ep
11
11
1
2
- - - (6.3)
Similarly for O2:
PIUFU PP 22 if
DC
DAp
)1(1
1
1
- - - (6.4)
CIUFU PP 22 if
EDC
E
C
DAp
11
11
1
1
- - - (6.5)
CIUPIU PP 22 if
EDC
E
D
EDAp
11
)(1
1
1 - - - (6.6)
7.0 SIMULATION
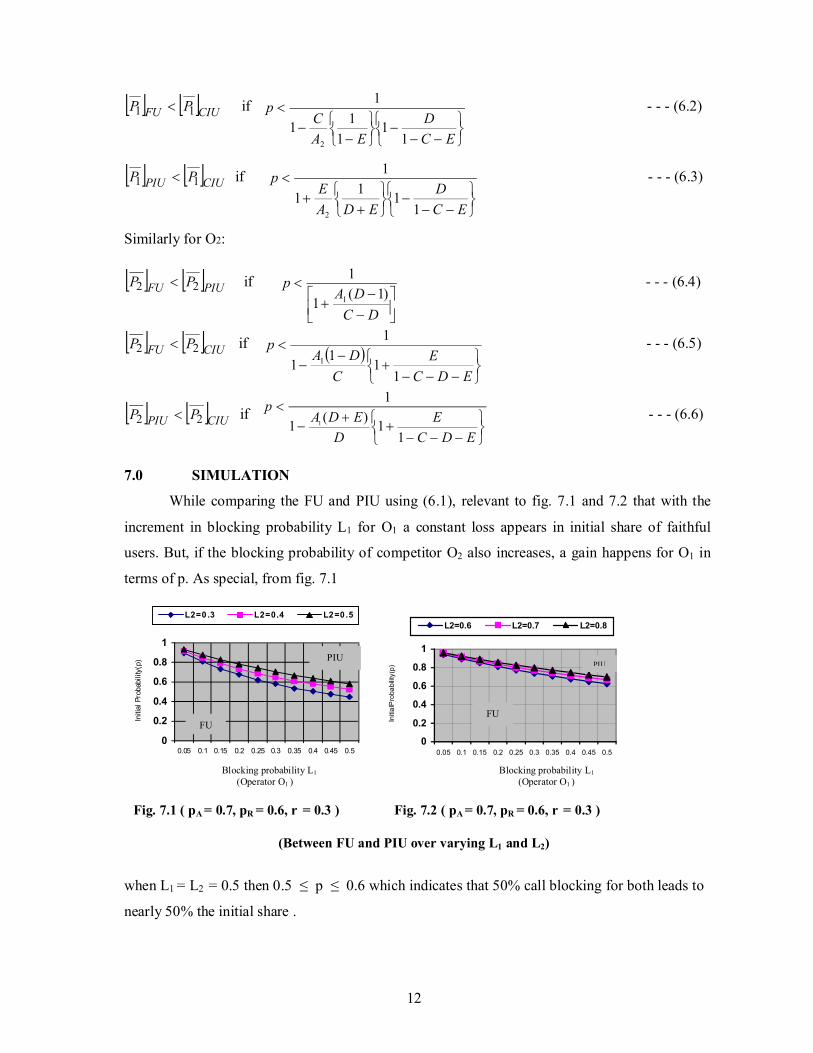
While comparing the FU and PIU using (6.1), relevant to fig. 7.1 and 7.2 that with the
increment in blocking probability L1 for O1 a constant loss appears in initial share of faithful
users. But, if the blocking probability of competitor O2 also increases, a gain happens for O1 in
terms of p. As special, from fig. 7.1
0
0.2
0.4
0.6
0.8
1
0.05 0.1 0.15 0.2 0.25 0.3 0.35 0.4 0.45 0.5
Initia
l P
robab
ility
(p)
L2=0 .3 L2=0.4 L2=0 .5
0
0.2
0.4
0.6
0.8
1
0.05 0.1 0.15 0.2 0.25 0.3 0.35 0.4 0.45 0.5
Initi
alP
rob
ab
ility
(p)
L2=0.6 L2=0.7 L2=0.8
Blocking probability L1 Blocking probability L1 (Operator O1 ) (Operator O1 )
Fig. 7.1 ( pA = 0.7, pR = 0.6, r = 0.3 ) Fig. 7.2 ( pA = 0.7, pR = 0.6, r = 0.3 )
(Between FU and PIU over varying L1 and L2)
when L1 = L2 = 0.5 then 0.5 ≤ p ≤ 0.6 which indicates that 50% call blocking for both leads to
nearly 50% the initial share .
FU
PIU
FU
PIU
13
Define ΔL1= (L1)a+h - (L1)a , ΔL2= (L2)a+h - (L2)a ,where a is initial value and h is interval of
differencing, and define (BD)p = Blocking Derivative = tconsp
L
L
tan1
2
From fig. 7.1, when p = 0.8, one can find that (BD)p=0.8 ≈ 0.3, But in fig. 7.2, when p = 0.8 ,
(BD)p=0.8 = 2.0. It shows the rate of variation of L2 with respect to L1 reduces with the increase
of L1 and L2 for a fixed p. The competitor’s blocking probability has a strong impact for
improving the proportion of faithful users of operator O1 after a large number of attempts.
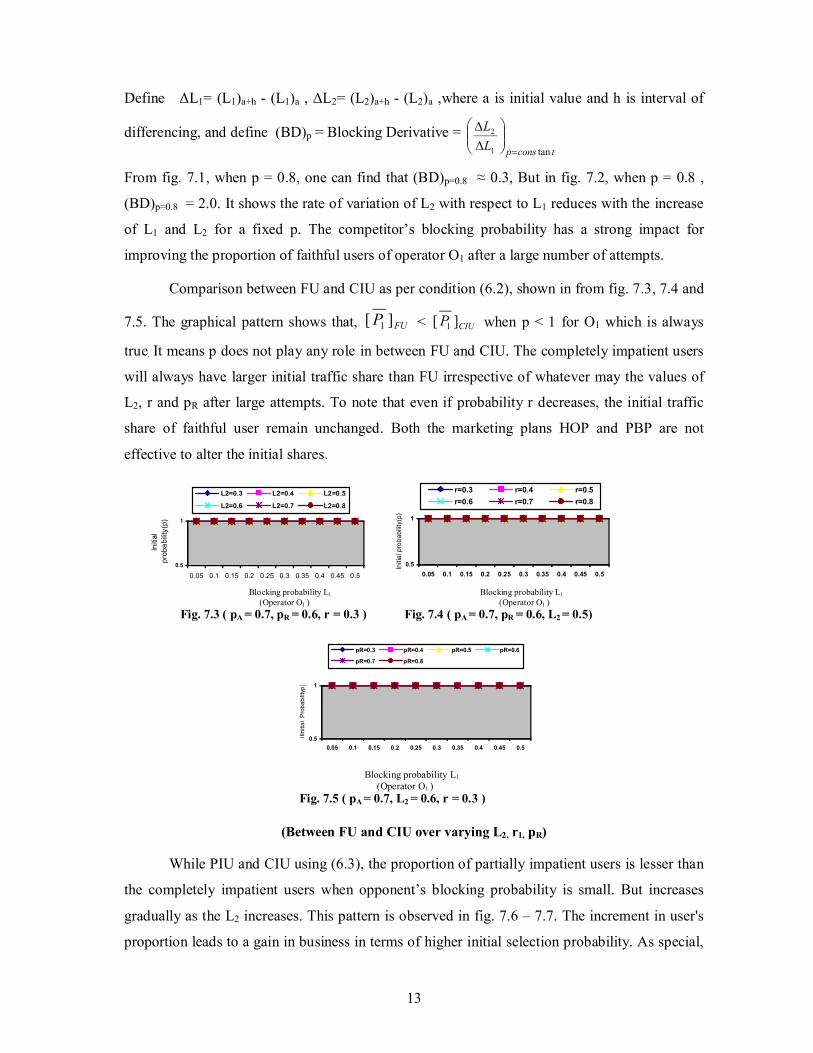
Comparison between FU and CIU as per condition (6.2), shown in from fig. 7.3, 7.4 and
7.5. The graphical pattern shows that, FUP ][ 1 < CIUP ][ 1 when p < 1 for O1 which is always
true. It means p does not play any role in between FU and CIU. The completely impatient users
will always have larger initial traffic share than FU irrespective of whatever may the values of
L2, r and pR after large attempts. To note that even if probability r decreases, the initial traffic
share of faithful user remain unchanged. Both the marketing plans HOP and PBP are not
effective to alter the initial shares.
0.5
1
0.05 0.1 0.15 0.2 0.25 0.3 0.35 0.4 0.45 0.5
Initia
l
pro
ba
bili
ty(p
)
L2=0.3 L2=0.4 L2=0.5
L2=0.6 L2=0.7 L2=0.8
0.5
1
0.05 0.1 0.15 0.2 0.25 0.3 0.35 0.4 0.45 0.5
Initia
l pro
babili
ty(p
)
r=0.3 r=0.4 r=0.5
r=0.6 r=0.7 r=0.8
Blocking probability L1 Blocking probability L1 (Operator O1 ) (Operator O1 )
Fig. 7.3 ( pA = 0.7, pR = 0.6, r = 0.3 ) Fig. 7.4 ( pA = 0.7, pR = 0.6, L2 = 0.5)
0.5
1
0.05 0.1 0.15 0.2 0.25 0.3 0.35 0.4 0.45 0.5
IIIn
itia
l P
rob
abili
typ
)
pR=0.3 pR=0.4 pR=0.5 pR=0.6
pR=0.7 pR=0.8
Blocking probability L1 (Operator O1 )
Fig. 7.5 ( pA = 0.7, L2 = 0.6, r = 0.3 )
(Between FU and CIU over varying L2, r1, pR)
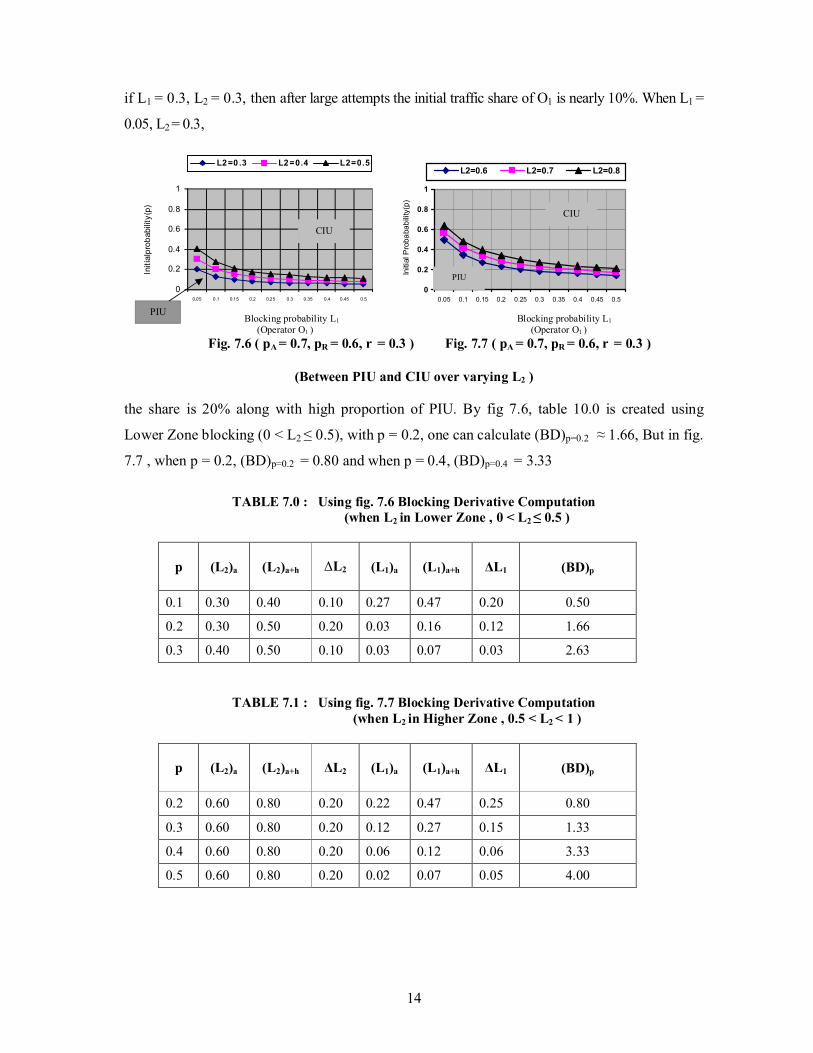
While PIU and CIU using (6.3), the proportion of partially impatient users is lesser than
the completely impatient users when opponent’s blocking probability is small. But increases
gradually as the L2 increases. This pattern is observed in fig. 7.6 – 7.7. The increment in user's
proportion leads to a gain in business in terms of higher initial selection probability. As special,
14
if L1 = 0.3, L2 = 0.3, then after large attempts the initial traffic share of O1 is nearly 10%. When L1 =
0.05, L2 = 0.3,
0
0.2
0.4
0.6
0.8
1
0.05 0.1 0.15 0.2 0.25 0.3 0.35 0.4 0.45 0.5
Init
ialp
rob
abili
ty(p
)
L2=0 .3 L2=0.4 L2=0.5
0
0.2
0.4
0.6
0.8
1
0.05 0.1 0.15 0.2 0.25 0.3 0.35 0.4 0.45 0.5
Initia
l Pro
ba
bab
ility
(p)
L2=0.6 L2=0.7 L2=0.8
Blocking probability L1 Blocking probability L1 (Operator O1 ) (Operator O1 )
Fig. 7.6 ( pA = 0.7, pR = 0.6, r = 0.3 ) Fig. 7.7 ( pA = 0.7, pR = 0.6, r = 0.3 )
(Between PIU and CIU over varying L2 )
the share is 20% along with high proportion of PIU. By fig 7.6, table 10.0 is created using
Lower Zone blocking (0 < L2 ≤ 0.5), with p = 0.2, one can calculate (BD)p=0.2 ≈ 1.66, But in fig.
7.7 , when p = 0.2, (BD)p=0.2 = 0.80 and when p = 0.4, (BD)p=0.4 = 3.33
TABLE 7.0 : Using fig. 7.6 Blocking Derivative Computation
(when L2 in Lower Zone , 0 < L2 ≤ 0.5 )
p (L2)a (L2)a+h ΔL2 (L1)a (L1)a+h ΔL1
(BD)p
0.1 0.30 0.40 0.10 0.27 0.47 0.20 0.50
0.2 0.30 0.50 0.20 0.03 0.16 0.12 1.66
0.3 0.40 0.50 0.10 0.03 0.07 0.03 2.63
TABLE 7.1 : Using fig. 7.7 Blocking Derivative Computation (when L2 in Higher Zone , 0.5 < L2 < 1 )
p (L2)a (L2)a+h ΔL2 (L1)a (L1)a+h ΔL1
(BD)p
0.2 0.60 0.80 0.20 0.22 0.47 0.25 0.80
0.3 0.60 0.80 0.20 0.12 0.27 0.15 1.33
0.4 0.60 0.80 0.20 0.06 0.12 0.06 3.33
0.5 0.60 0.80 0.20 0.02 0.07 0.05 4.00
CIU
CIU
PIU
PIU
15
It is observed from Table 7.0, that
(a) Blocking derivative is directly proportional to the blocking value L1 of operator O1 and
could be expressed in a differential equation1
1
2 LsL
L
, where s is a constant.
(b) Blocking derivative are also directly proportional to the initial share (p) and could be
expressed tpL
L
1
2
, with t a constant.
(c) When opponents blocking probability is in Lower Zone (0 < L2 ≤ 0.5) then in order to
maintain the same 20% level of initial traffic share p, the operator O1 has to reduce his call
blocking by 1/1.66 (= 0.6) for every unit reduction by O2 in L2.Similarly, to maintain 30%
initial share p for unit reduction of opponents blocking, O1 has to reduce his blocking
proportion by 1/2.63 (= 0.38) which leads to 30%.
(d) When L2 is in Higher Zone (0.5 < L2 < 1 ), for maintaining 20% share in initial traffic , for
unit change in blocking by O2 in L2 ,the O1 has to put reduction level of blocking more by
1.25 times than competitor. In case of 30% initial value, O1 has to reduce blocking by 0.75
times only; therefore, a significant effect is observed of the blocking zone level of L2 to the
initial traffic distribution under large number of attempts.
8.0 REST STATE ANALYSES OF USERS
This is in view to an effect of newly introduces marketing strategies HOP and PBP in
the form of R over the traffic distribution (initial and final both) while large connecting
attempts are made. The analytical approach contains (a) to examine p over varying r (b) to
examine p over pR (c) examine p over joint variation of (r, pR).
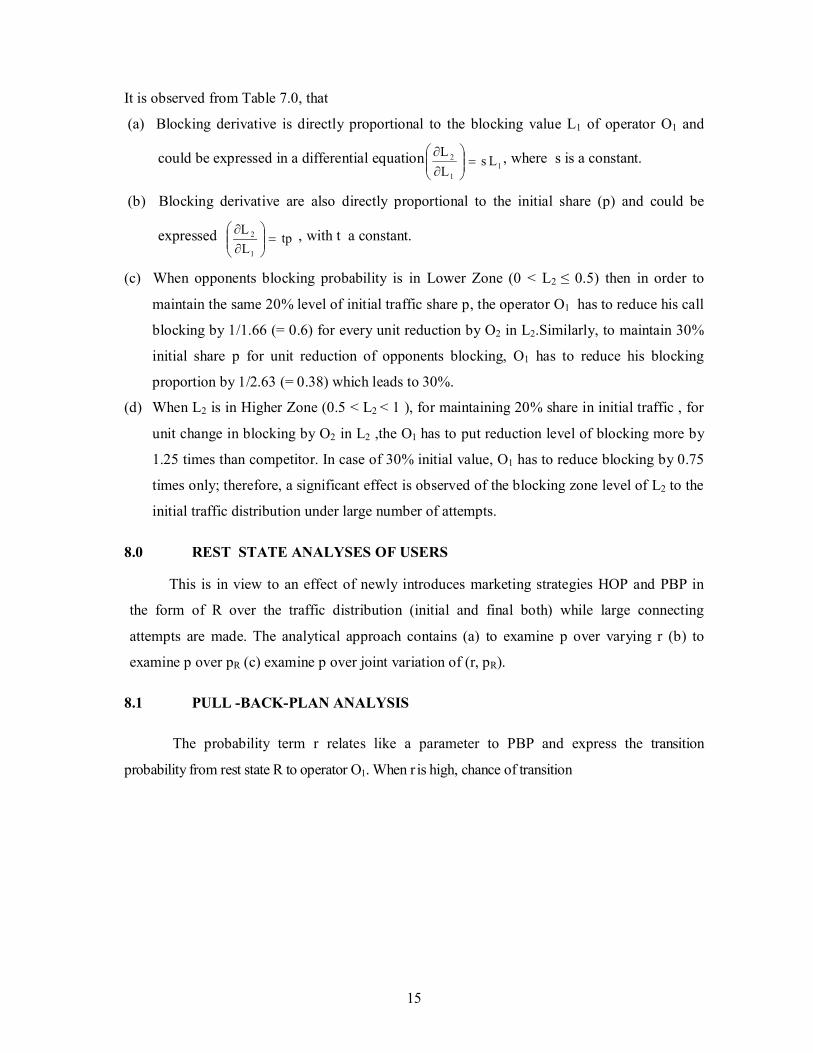
8.1 PULL -BACK-PLAN ANALYSIS
The probability term r relates like a parameter to PBP and express the transition
probability from rest state R to operator O1. When r is high, chance of transition
16
0
0.2
0.4
0.6
0.8
1
0.05 0.1 0.15 0.2 0.25 0.3 0.35 0.4 0.45 0.5
Init
ial p
rob
ab
ilit
y(p
)
r=0.3 r=0.4 r=0.5
0
0.2
0.4
0.6
0.8
1
0.05 0.1 0.15 0.2 0.25 0.3 0.35 0.4 0.45 0.5
Init
ial
pro
ba
ba
bilit
y(p
)
r=0.6 r=0.7 r=0.8
Blocking probability L1 Blocking probability L1 (Operator O1 ) (Operator O1 )
Fig. 8.1 ( pA = 0.7, pR = 0.6, L2 = 0.3 ) Fig. 8.2 ( pA = 0.7, pR = 0.6,L2 = 0.3 )
(Between FU and PIU over varying r )
towards O1 is also high. The fig. 8.1 and fig. 8.2 show a comparative variation of initial
probability p over r when pR = 0.6. These figures are iso-resters due to constant pR indicating
gain of O1 in initial share when r is high. For example, in fig. 8.1, p ≈ 0.8 when L1 = 0.1, r = 0.5,
in fig 8.2, p ≈ 0.9 when L1 = 0.1, r = 0.8. The higher p for higher r leads to success of Pull-back
marketing plan because sub-group
0
0.2
0.4
0.6
0.8
1
0.05 0.1 0.15 0.2 0.25 0.3 0.35 0.4 0.45 0.5
Initia
l pro
ba
bab
ility
(p)
r=0.3 r=0.4 r=0.5
0
0.2
0.4
0.6
0.8
1
0.05 0.1 0.15 0.2 0.25 0.3 0.35 0.4 0.45 0.5
Init
ial p
rob
aba
bilit
y(p
)
r=0.6 r=0.7 r=0.8
Blocking probability L1 Blocking probability L1 (Operator O1 ) (Operator O1) Fig. 8.3 ( pA = 0.7, pR = 0.6, L2 = 0.3 ) Fig. 8.4 ( pA = 0.7, pR = 0.6,L2 = 0.3)
(Between PIU and CIU over varying r )
of faithful users increases with this marketing strategy. The FU is a committed group to an
operator whose growth is a pleasant event. With increasing self blocking probability L1 of O1, a
proportion of faithful users move to the rest state R. When r = 0.3 made doubled (r = 0.6), the
PIU proportion becomes half, showing proportional decline over increasing r .
By fig. 8.3 – 8.4, the increment in r grows the proportion of completely impatient user
in a fast way. For example, in fig. 8.1, p ≈ 0.22 when L1 = 0.1, r = 0.3 and p ≈ 0.11 when L1 =
FU
PIU PIU
FU
CIU CIU
PIU PIU
17
Probability(pR)
Probability(pR)
0.1, r = 0.6. This show, due to high r, O1 gains his FU and CIU more and loses proportion of
PIU. This is important feature of marketing strategy R.
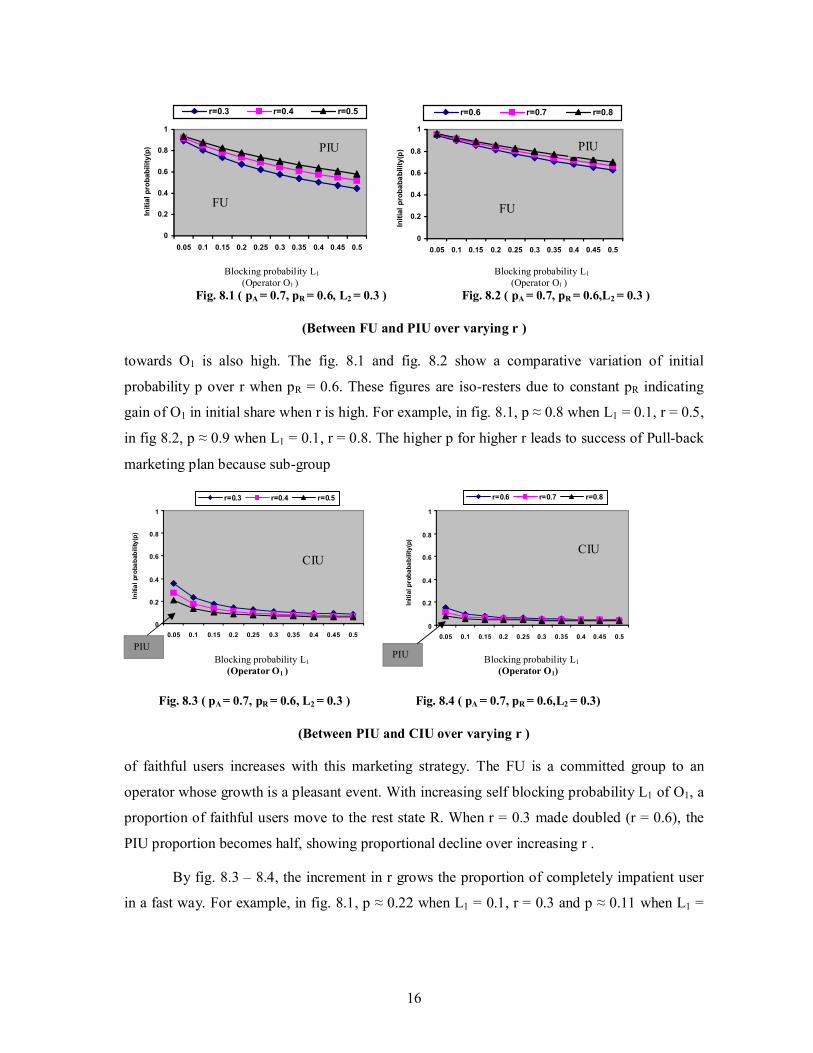
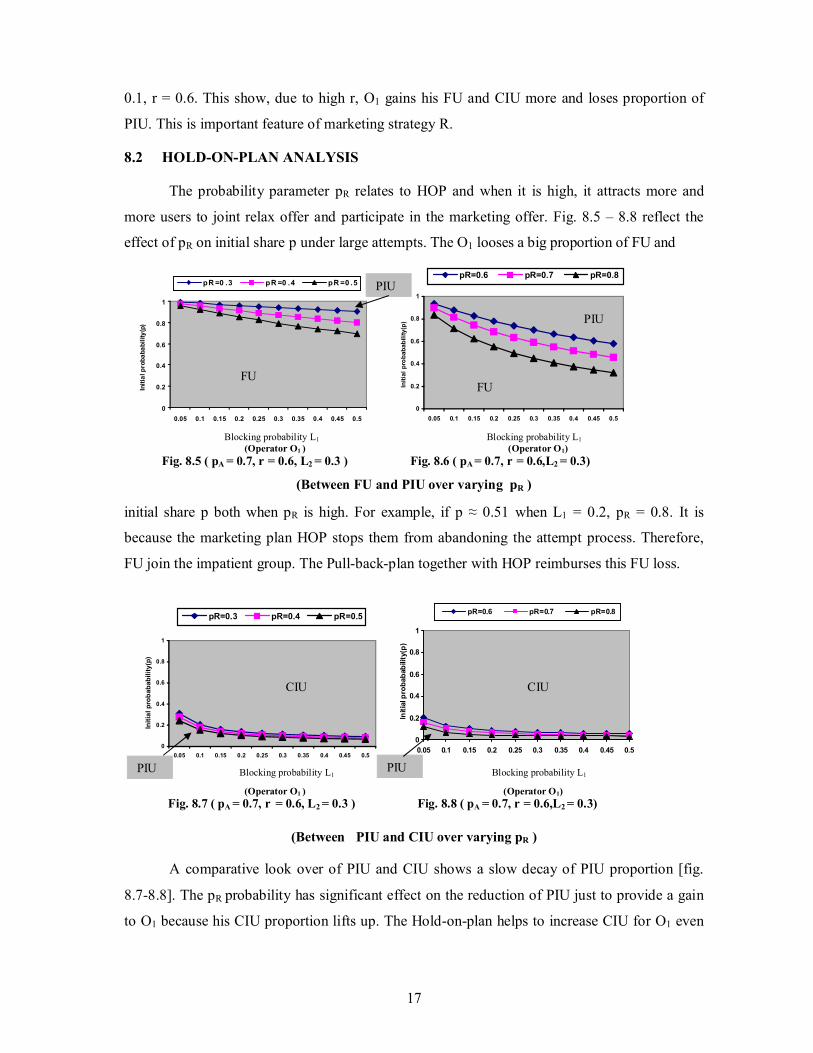
8.2 HOLD-ON-PLAN ANALYSIS
The probability parameter pR relates to HOP and when it is high, it attracts more and
more users to joint relax offer and participate in the marketing offer. Fig. 8.5 – 8.8 reflect the
effect of pR on initial share p under large attempts. The O1 looses a big proportion of FU and
0
0.2
0.4
0.6
0.8
1
0.05 0.1 0.15 0.2 0.25 0.3 0.35 0.4 0.45 0.5
Init
ial p
rob
aba
bil
ity
(p)
pR =0 .3 pR =0 .4 pR =0 .5
0
0.2
0.4
0.6
0.8
1
0.05 0.1 0.15 0.2 0.25 0.3 0.35 0.4 0.45 0.5
Init
ial
pro
ba
ba
bilit
y(p
)
pR=0.6 pR=0.7 pR=0.8
Blocking probability L1 Blocking probability L1 (Operator O1 ) (Operator O1) Fig. 8.5 ( pA = 0.7, r = 0.6, L2 = 0.3 ) Fig. 8.6 ( pA = 0.7, r = 0.6,L2 = 0.3)
initial share p both when pR is high. For example, if p ≈ 0.51 when L1 = 0.2, pR = 0.8. It is
because the marketing plan HOP stops them from abandoning the attempt process. Therefore,
FU join the impatient group. The Pull-back-plan together with HOP reimburses this FU loss.
0
0.2
0.4
0.6
0.8
1
0.05 0.1 0.15 0.2 0.25 0.3 0.35 0.4 0.45 0.5
Init
ial p
rob
ab
ab
ilit
y(p
)
pR=0.3 pR=0.4 pR=0.5
0
0.2
0.4
0.6
0.8
1
0.05 0.1 0.15 0.2 0.25 0.3 0.35 0.4 0.45 0.5
Init
ial p
rob
ab
ab
ility
(p)
pR=0.6 pR=0.7 pR=0.8
Blocking probability L1 Blocking probability L1
(Operator O1 ) (Operator O1) Fig. 8.7 ( pA = 0.7, r = 0.6, L2 = 0.3 ) Fig. 8.8 ( pA = 0.7, r = 0.6,L2 = 0.3)
(Between PIU and CIU over varying pR )
A comparative look over of PIU and CIU shows a slow decay of PIU proportion [fig.
8.7-8.8]. The pR probability has significant effect on the reduction of PIU just to provide a gain
to O1 because his CIU proportion lifts up. The Hold-on-plan helps to increase CIU for O1 even
FU
PIU
FU
PIU
PIU
CIU CIU
PIU
(Between FU and PIU over varying pR )
18
Fig. 8.9 (L1 = 0.06, L2 = 0.03, pA = 0.5) Fig. 8.10 (r = 0.4, L2 = 0.03, pA = 0.5)
Fig. 8.11 (L1 = 0.06, r = 0.4, pA = 0.5)
Probability(pR) Probability (pR)
Probability (pR)
0
0.2
0.4
0.6
0.8
1
0.05 0.1 0.15 0.2 0.25 0.3 0.35 0.4
L1 = 0.2 L1 = 0.5 L1 = 0.8
Probability (L2)
Fig. 8.12 (pR = 0.5, L1 = 0.06, pA = 0.5)
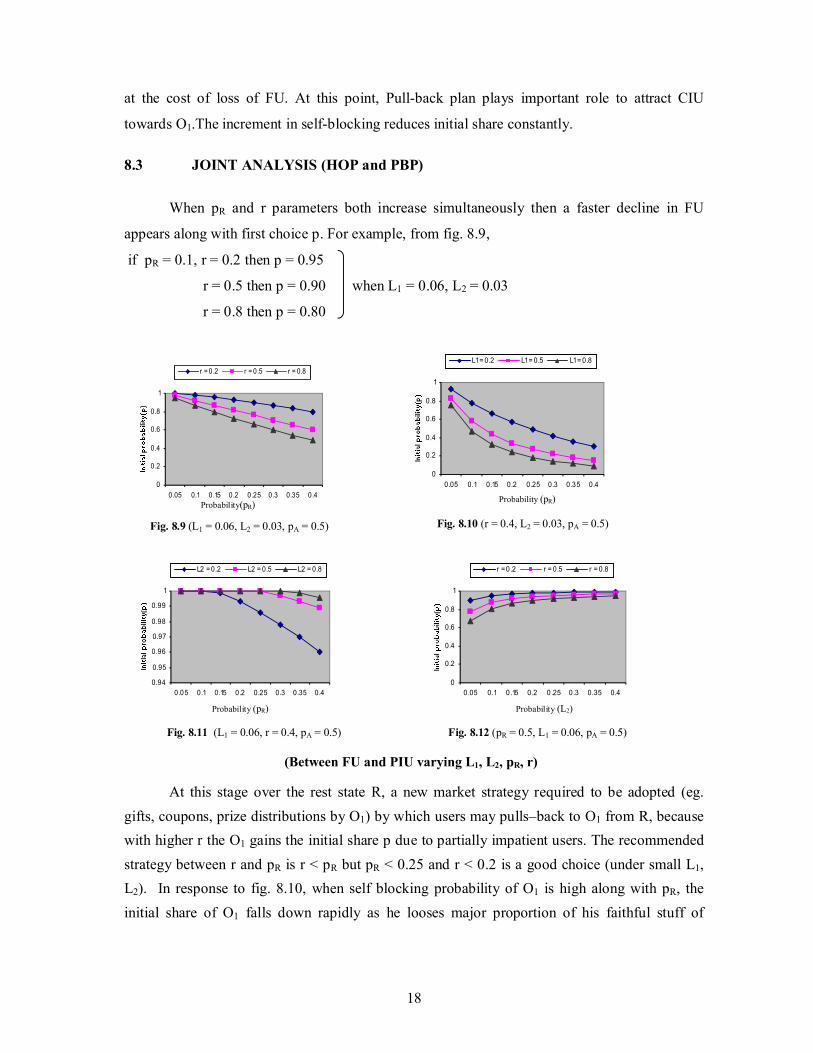
at the cost of loss of FU. At this point, Pull-back plan plays important role to attract CIU
towards O1.The increment in self-blocking reduces initial share constantly.
8.3 JOINT ANALYSIS (HOP and PBP)
When pR and r parameters both increase simultaneously then a faster decline in FU
appears along with first choice p. For example, from fig. 8.9,
if pR = 0.1, r = 0.2 then p = 0.95
r = 0.5 then p = 0.90 when L1 = 0.06, L2 = 0.03
r = 0.8 then p = 0.80
0
0.2
0.4
0.6
0.8
1
0.05 0.1 0.15 0.2 0.25 0.3 0.35 0.4
r = 0.2 r = 0.5 r = 0.8
0.94
0.95
0.96
0.97
0.98
0.99
1
0.05 0.1 0.15 0.2 0.25 0.3 0.35 0.4
L2 = 0.2 L2 = 0.5 L2 = 0.8
0
0.2
0.4
0.6
0.8
1
0.05 0.1 0.15 0.2 0.25 0.3 0.35 0.4
r = 0.2 r = 0.5 r = 0.8
At this stage over the rest state R, a new market strategy required to be adopted (eg.
gifts, coupons, prize distributions by O1) by which users may pulls–back to O1 from R, because
with higher r the O1 gains the initial share p due to partially impatient users. The recommended
strategy between r and pR is r < pR but pR < 0.25 and r < 0.2 is a good choice (under small L1,
L2). In response to fig. 8.10, when self blocking probability of O1 is high along with pR, the
initial share of O1 falls down rapidly as he looses major proportion of his faithful stuff of
(Between FU and PIU varying L1, L2, pR, r)
19
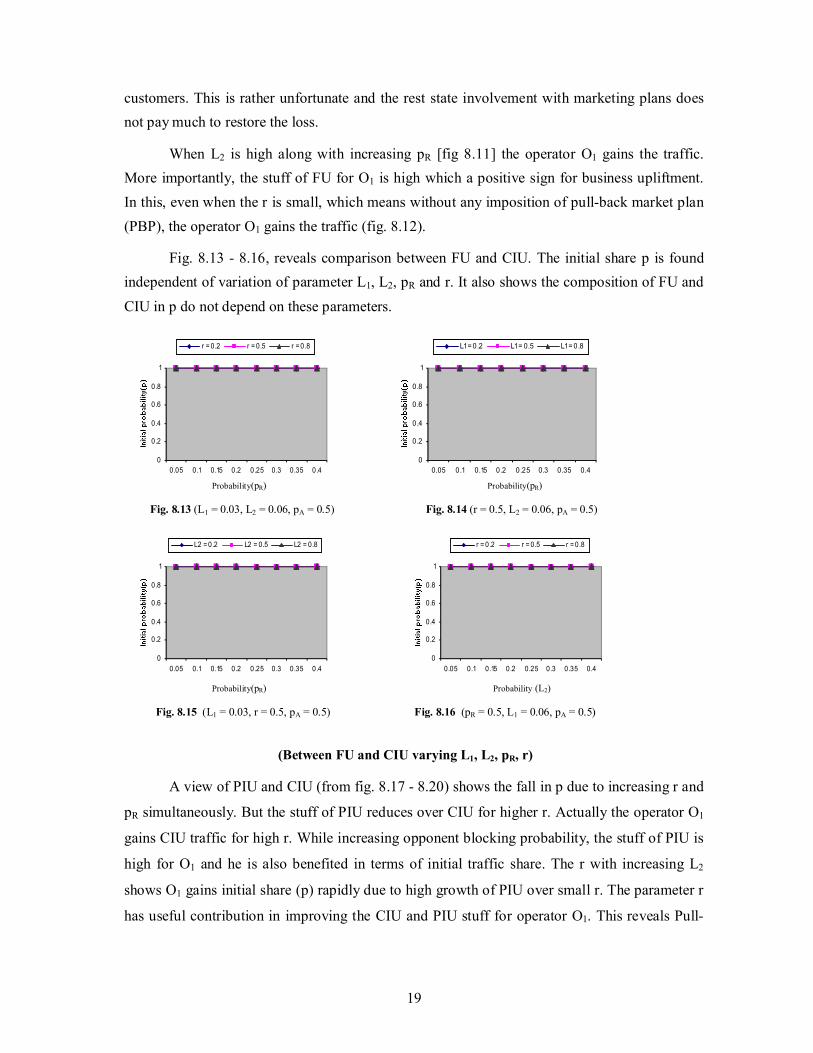
Fig. 8.13 (L1 = 0.03, L2 = 0.06, pA = 0.5) Fig. 8.14 (r = 0.5, L2 = 0.06, pA = 0.5)
Fig. 8.15 (L1 = 0.03, r = 0.5, pA = 0.5)
Probability(pR) Probability(pR)
Probability(pR) Probability (L2)
Fig. 8.16 (pR = 0.5, L1 = 0.06, pA = 0.5)
customers. This is rather unfortunate and the rest state involvement with marketing plans does
not pay much to restore the loss.
When L2 is high along with increasing pR [fig 8.11] the operator O1 gains the traffic.
More importantly, the stuff of FU for O1 is high which a positive sign for business upliftment.
In this, even when the r is small, which means without any imposition of pull-back market plan
(PBP), the operator O1 gains the traffic (fig. 8.12).
Fig. 8.13 - 8.16, reveals comparison between FU and CIU. The initial share p is found
independent of variation of parameter L1, L2, pR and r. It also shows the composition of FU and
CIU in p do not depend on these parameters.
0
0.2
0.4
0.6
0.8
1
0.05 0.1 0.15 0.2 0.25 0.3 0.35 0.4
r = 0.2 r = 0.5 r = 0.8
0
0.2
0.4
0.6
0.8
1
0.05 0.1 0.15 0.2 0.25 0.3 0.35 0.4
L1 = 0.2 L1 = 0.5 L1 = 0.8
0
0.2
0.4
0.6
0.8
1
0.05 0.1 0.15 0.2 0.25 0.3 0.35 0.4
L2 = 0.2 L2 = 0.5 L2 = 0.8
0
0.2
0.4
0.6
0.8
1
0.05 0.1 0.15 0.2 0.25 0.3 0.35 0.4
r = 0.2 r = 0.5 r = 0.8
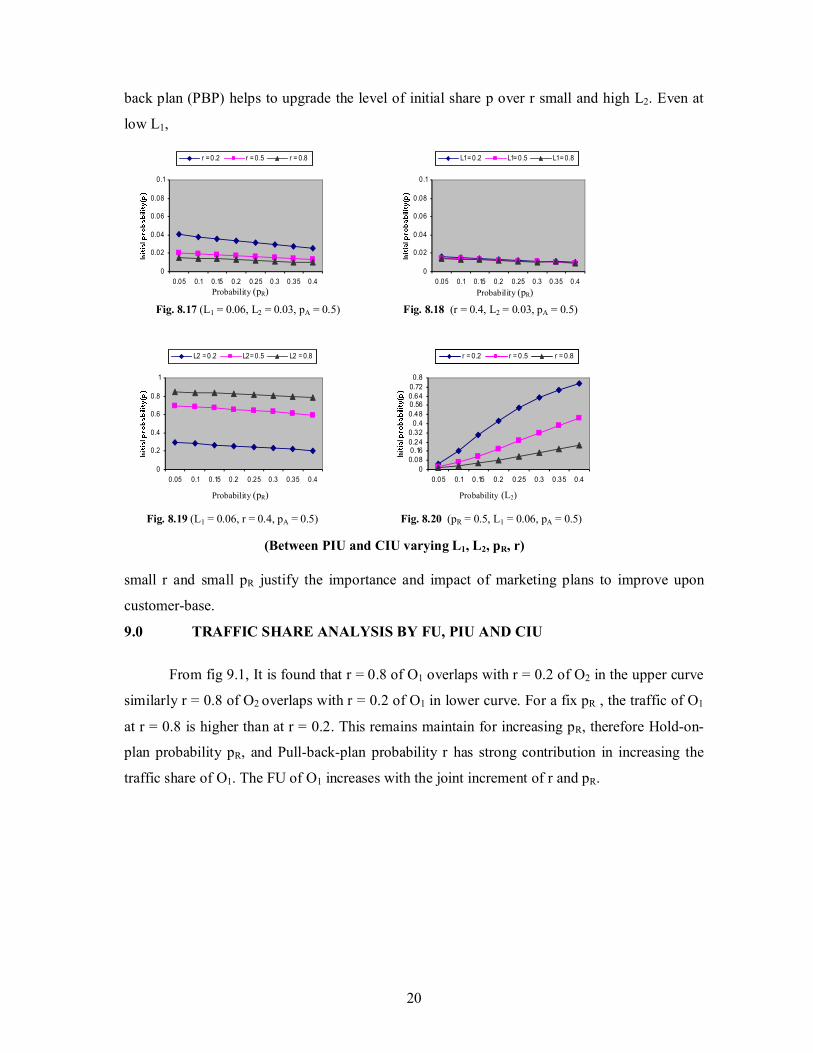
A view of PIU and CIU (from fig. 8.17 - 8.20) shows the fall in p due to increasing r and
pR simultaneously. But the stuff of PIU reduces over CIU for higher r. Actually the operator O1
gains CIU traffic for high r. While increasing opponent blocking probability, the stuff of PIU is
high for O1 and he is also benefited in terms of initial traffic share. The r with increasing L2
shows O1 gains initial share (p) rapidly due to high growth of PIU over small r. The parameter r
has useful contribution in improving the CIU and PIU stuff for operator O1. This reveals Pull-
(Between FU and CIU varying L1, L2, pR, r)
20
Fig. 8.17 (L1 = 0.06, L2 = 0.03, pA = 0.5) Fig. 8.18 (r = 0.4, L2 = 0.03, pA = 0.5)
Fig. 8.19 (L1 = 0.06, r = 0.4, pA = 0.5)
Probability (pR)
Probability (pR)
Probability (pR)
Fig. 8.20 (pR = 0.5, L1 = 0.06, pA = 0.5)
Probability (L2)
back plan (PBP) helps to upgrade the level of initial share p over r small and high L2. Even at
low L1,
0
0.02
0.04
0.06
0.08
0.1
0.05 0.1 0.15 0.2 0.25 0.3 0.35 0.4
r = 0.2 r = 0.5 r = 0.8
0
0.02
0.04
0.06
0.08
0.1
0.05 0.1 0.15 0.2 0.25 0.3 0.35 0.4
L1 = 0.2 L1= 0.5 L1 = 0.8
0
0.2
0.4
0.6
0.8
1
0.05 0.1 0.15 0.2 0.25 0.3 0.35 0.4
L2 = 0.2 L2= 0.5 L2 = 0.8
0
0.080.160.24
0.320.4
0.48
0.560.640.72
0.8
0.05 0.1 0.15 0.2 0.25 0.3 0.35 0.4
r = 0.2 r = 0.5 r = 0.8
small r and small pR justify the importance and impact of marketing plans to improve upon
customer-base.
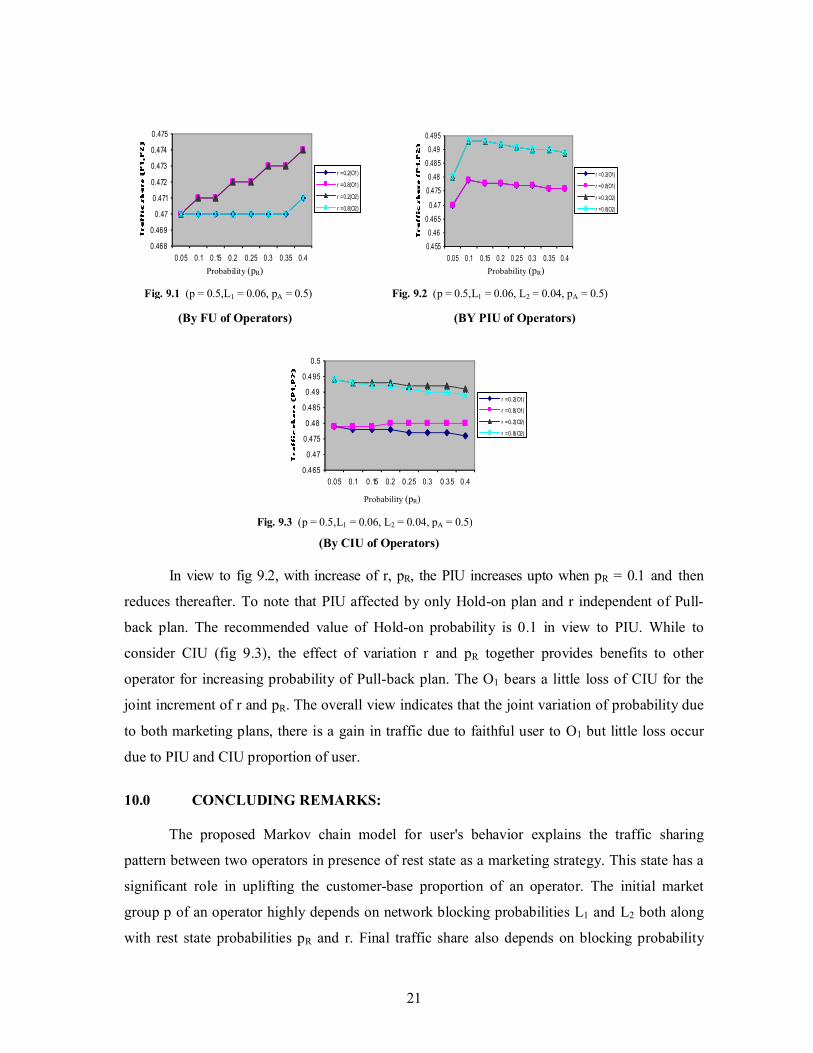
9.0 TRAFFIC SHARE ANALYSIS BY FU, PIU AND CIU
From fig 9.1, It is found that r = 0.8 of O1 overlaps with r = 0.2 of O2 in the upper curve
similarly r = 0.8 of O2 overlaps with r = 0.2 of O1 in lower curve. For a fix pR , the traffic of O1
at r = 0.8 is higher than at r = 0.2. This remains maintain for increasing pR, therefore Hold-on-
plan probability pR, and Pull-back-plan probability r has strong contribution in increasing the
traffic share of O1. The FU of O1 increases with the joint increment of r and pR.
(Between PIU and CIU varying L1, L2, pR, r)
21
Fig. 9.1 (p = 0.5,L1 = 0.06, pA = 0.5) Fig. 9.2 (p = 0.5,L1 = 0.06, L2 = 0.04, pA = 0.5)
Probability (pR)
Probability (pR)
Fig. 9.3 (p = 0.5,L1 = 0.06, L2 = 0.04, pA = 0.5)
Probability (pR)
0.468
0.469
0.47
0.471
0.472
0.473
0.474
0.475
0.05 0.1 0.15 0.2 0.25 0.3 0.35 0.4
r = 0.2(O1)
r = 0.8(O1)
r = 0.2(O2)
r = 0.8(O2)
0.455
0.46
0.465
0.47
0.475
0.48
0.485
0.49
0.495
0.05 0.1 0.15 0.2 0.25 0.3 0.35 0.4
r = 0.2(O1)
r = 0.8(O1)
r = 0.2(O2)
r = 0.8(O2)
0.465
0.47
0.475
0.48
0.485
0.49
0.495
0.5
0.05 0.1 0.15 0.2 0.25 0.3 0.35 0.4
r = 0.2(O1)
r = 0.8(O1)
r = 0.2(O2)
r = 0.8(O2)
In view to fig 9.2, with increase of r, pR, the PIU increases upto when pR = 0.1 and then
reduces thereafter. To note that PIU affected by only Hold-on plan and r independent of Pull-
back plan. The recommended value of Hold-on probability is 0.1 in view to PIU. While to
consider CIU (fig 9.3), the effect of variation r and pR together provides benefits to other
operator for increasing probability of Pull-back plan. The O1 bears a little loss of CIU for the
joint increment of r and pR. The overall view indicates that the joint variation of probability due
to both marketing plans, there is a gain in traffic due to faithful user to O1 but little loss occur
due to PIU and CIU proportion of user.
10.0 CONCLUDING REMARKS: The proposed Markov chain model for user's behavior explains the traffic sharing
pattern between two operators in presence of rest state as a marketing strategy. This state has a
significant role in uplifting the customer-base proportion of an operator. The initial market
group p of an operator highly depends on network blocking probabilities L1 and L2 both along
with rest state probabilities pR and r. Final traffic share also depends on blocking probability
(By FU of Operators) (BY PIU of Operators)
(By CIU of Operators)
22
parameters along with marketing plans HOP and PBP who have shown their important effect.
All the three categories FU, PIU, CIU have displayed variations due to implementation of these
plans.
The competitor's blocking probability has a strong impact over improving proportion of
faithful users of operator O1. The completely impatient user always have to keep larger initial
traffic share than FU irrespective of whatever may the values of L2, r and pR. The proportion of
partially impatient user is lesser than the completely impatient user when opponent's blocking
probability is small, but increases gradually as the L2 increases. The blocking derivative is
directly proportional to the blocking value L1 and initial share (p).
The Pull-back plan of marketing is successful because with the increases of r the sub-
group of faithful user increases in proportion with this marketing strategy. Since FU is a
committed group to an operator therefore, the growth is a positive sign in support of impact of
PBP. Due to this actually the PIU convert into CIU for an operator which contributes for gain in
the level of traffic. The HOP provides loss in FU and p both for high pR but increment in CIU
proportion. The joint variation of r and pR has positive growing effect. The recommended
marketing strategy between HOP and PBP is pR < 0.25, r < 0.5 and r < pR along with small
value of L1 and L1 < L2. When L2 is high, the operator O1 gains the traffic specially due to high
proportion of FU and CIU. Both the marketing plans contribute more on CIU traffic to Pull-on
towards an specific operator.
It is recommended for internet service providers to open-up entertainment and
refreshment facilities in the form of Hold-on marketing plan in and around to their Internet cafe.
Apart from this the gift vouchers, free time offer like Pull-back marketing plans are also
required to grow up the high customer-base. Both the plans, HOP and PBP if implemented
together at moderate level have significant role to improve upon the traffic share of an operator.
One more important suggestion is that Internet operator always has to keep his network
blocking probability lower than to the competitor (L1 < L2). While competitor's blocking is high,
the operator does not have to bother much about his service quality offered.
REFERENCES
[1] Medhi, J. Stochastic Processes, Wiley Eastern Limited (Fourth reprint), New Delhi,
1991.
[2] Naldi, M., “Measurement Based Modeling Of Internet Dial-up Access Connections”,
Computer Networks, 31(22) pp. 2381-2390, 1999.
23
[3] Naldi, M. “Internet Access Traffic Sharing In A Multi-user Environment”, Computer
Networks, Vol. 38, pp. 809-824, 2002.
[4] Farber, J., Bodamer, S., Charzinski, J., “Measurement And Modeling Of Internet
Traffic At Access Network”, EUNICE-98, pp. 196-203, 1998.
[5] Farber, J., Bodamer, S., Charzinski, J., “Statistical Evaluation And Modeling Of
Internet Dial-up Traffic”, IND, Institute of Communication Network and Computer
Engineering, University of Stuttgart, Technical Report, pp. 10, 1999.
[6] Perzen, Emanual,Stochastic Processes, Holden -Day, Inc., San Francisco, and
California,1992
[7] Shukla, D. Gadewar, Surendra ,“Stochastic Model For Cell Movement In A Knockout
Switch In Computer Networks”, Journal of High Speed Network, Vol.16, no.3, pp. 310-
332, 2007.
[8] Shukla, D. Gadewar, S. Pathak, R.K. “A Stochastic Model For Space-Division Switches
In Computer Networks”, Applied Mathematics and Computation (Elsevier Journal),
Vol. 184, Issue 2, pp. 235-269, 2007.
[9] Shukla, D., Thakur, Sanjay, “State Probability Analysis Of Users In Internet Between
Two Operators”, International Journal of Advanced Networking and Applications (IJANA),
Vol. 1, issue 1, pp. 90-95, 2009.
[10] Shukla, D., Tiwari, M., Thakur, Sanjay. Tiwari, V., “Rest State Analysis In Internet
Traffic Distribution In Multi-operator environment”, Research Journal of Management and
Information Technology (GNIM's), Vol 1 issue 1, pp. 72-82, 2009.
[11] Shukla, D., Thakur, Sanjay. Tiwari,V, Deshmukh A., “Share Loss Analysis Of Internet
Traffic Distribution In Computer Networks”, International Journal of Computer Science
and Security (IJCSS), Vol 3, Issue 5, pp. 414-427, 2009.
[12] Shukla, D., Tiwari,V, Thakur, Sanjay., “A Comparison Of Methods For Internet Traffic
Sharing In Computer Network”, International Journal of Advanced Networking and
Applications (IJANA), Vol. 1, issue 3, pp. 164-169, 2009.
[13] Yeian, C. and Lygeres, J., “Stabilization Of A Class Of Stochastic Differential
Equations With Markovian Switching” System And Control Letters, 9, pp. 819-833,
2005.