Embed Size (px)
Citation preview

Still Young, Idle, and Jobless: The Continued Failure of the Nation’s Teens to Benefit From
Renewed Job Growth
Prepared by: Andrew Sum
Joseph McLaughlin Ishwar Khatiwada
Center for Labor Market Studies Northeastern University Boston, Massachusetts
Prepared for:
Jobs for America’s Graduates Alexandria, Virginia
January 2006
Table of Contents
Introduction..................................................................................................................................... 1 Data Sources and Employment Concepts and Measures................................................................ 2 Recent and Historical Trends in Teen Employment Rates ............................................................. 4 Sources of the Decline in the Teen E/P Ratio, 2000-2005 ............................................................. 6 Changes in Teen E/P Ratios by Gender and Race-Ethnic Group, 2000-2005................................ 7 Teen E/P Ratios by Household Income in 2005 ............................................................................. 9 Employment Experiences of Teens By School Enrollment Status During 2005.......................... 11 Employment Experiences of Teens Enrolled in School During 2005 .......................................... 12 The Impact of Changing School Enrollment Behavior on the E/P Ratios of Teens..................... 13 How Did Teen Employment Rates in 2000 and 2005 Vary by Geographic Division and Across
Individual JAG States? ............................................................................................................... 15 Path Dependency of Teen Employment: The Positive Effects of Early Work Experience.......... 18 Labor Force Underutilization Problems Among Teens ................................................................ 20 Summary and Conclusions ........................................................................................................... 23

1
Introduction The formulation of national workforce development policies for youth and the planning
and design of youth employment and training programs at the state and local level are dependent
upon the availability of timely and reliable information on youth labor market experiences and
problems. Among the desired information on youth labor market experiences are the
employment rates of teens, both in the aggregate and across a wide array of demographic,
socioeconomic, schooling and geographic subgroups, as well as their problems in securing
employment, including open unemployment, hidden unemployment, and underemployment.1 For
out-of-school youth, knowledge of their access to full-time jobs, to jobs across different
industries and occupations, and to employment positions providing training and offsite
educational opportunities is also highly desirable to gauge changes in job quality over time.
The Jobs for America’s Graduates national network (JAG) provides an array of education
and employment services for high school students and for youth who have left high school
before obtaining a regular high school diploma. Among the major goals of these JAG programs
are having participants successfully graduate from high school, improve their employability and
basic academic skills during the course of their involvement in the program, and obtain access to
full-time jobs and post-secondary educational and training opportunities upon exiting from the
program.
Over the past three years, the Center for Labor Market Studies has released a set of
research reports for the National JAG network that examined the recent labor market problems of
teens since the end of the national labor market boom in early 2001.2 These reports identified the
sharp declines in teenage job opportunities during the national recession of 2001 and the jobless
recovery of 2002 as well as the paradox of persistent teen joblessness in 2004 both year-round
and during the summer months despite renewed job growth and improved labor market 1 In this research report, the employment rate of teens is represented by their employment/population ratio (E/P), the share of teens in the civilian, non-institutional population that are employed. These E/P ratios can be measured monthly and on an annual average basis. Most of the E/P measures in this report are annual averages. 2 See: i. Andrew Sum and Ishwar Khatiwada with Sheila Palma and Susan Perron, Still Young, Restless, and Jobless: The
Growing Employment Malaise Among U.S. Teens and Young Adults, Center for Labor Market Studies, Northeastern University, Report Prepared for Jobs for America’s Graduates, January, 2004.
ii. Andrew Sum, Ishwar Khatiwada, Joseph McLaughlin, The Paradox of Rising Teen Joblessness in An Expanding Labor Market: The Absence of Teen Employment Growth in the National Jobs Recovery of 2003-2004, Center for Labor Market Studies, Northeastern University, Report Prepared for Jobs for America’s Graduates, January, 2005.
iii. Andrew Sum, Joseph McLaughlin, Ishwar Khatiwada, with Sheila Palma, The Summer 2005 Job Market for the Nation’s Teens: Another Historically Low Employment Rate, Report Prepared for Jobs for America’s Graduates, November, 2005.

2
conditions across the nation. This research report carries the analysis through calendar year 2005
using recently released CPS household survey data from the U.S. Bureau of Labor Statistics.
Unfortunately, the findings will reveal that teens encountered a fourth year of depressed labor
market conditions as teen employment rates remained at or near historical lows during 2005. In
fact, the employment rate of male teens fell to a new historical low of 35.1%.3 The lack of any
substantive improvement in teen employment prospects year-round and during the summer
months partly remains an unsolved mystery!
This research paper is designed to track and assess changes in employment rates for the
nation’s teens over both the past few years and decades to place the findings for the past few
years in proper historical perspective. We will begin by describing the data sources and
employment concepts and measures underlying our estimates of teen employment rates. This
will be followed by a review of estimated changes in teen employment/population ratios over the
2000-2005 period together with comparisons over the past 25 years. Changes in the
employment/population ratios of the nation’s teens over the past five years will be compared to
those for other age subgroups of the nation’s working-age population over the same time period.
These age comparisons will be followed by an analysis of changes in the E/P ratios of teens in
gender and race-ethnic groups over the 2000-2005 period. An analysis of the employment rates
of gender and race-ethnic groups by their school enrollment status follows. Changes in teen
employment across geographic areas over the past five years will be examined, including the
nine geographic divisions of the United States and the 28 states that participate in the Jobs for
America’s Graduates national youth employment network. The last two sections of this paper
describe research findings on the importance of in-school work experiences and briefly discuss
the need to develop new strategies to substantially boost the employment opportunities available
to our nation’s teenagers in the years ahead.
Data Sources and Employment Concepts and Measures The estimates of the employment levels and employment rates of the nation’s teenagers
and other age subgroups appearing in this research paper are based upon the findings of the
Current Population Survey (CPS). The CPS survey is a monthly national household survey
3 The CPS teen employment series begins with 1948. Thus, reference to a historical low implies that the employment rate is the lowest observed since 1948.
3
conducted by the U.S. Bureau of Census for the U.S. Bureau of Labor Statistics.4 Currently,
approximately 60,000 households are interviewed each month. Data are collected on the labor
force activities of each household member ages 16 and older. Each working-age individual is
classified into one of the three, following mutually exclusive labor force categories: employed,
unemployed, or out of the labor force. The number of employed in a given demographic
subgroup (e.g., teens 16-19) can be divided by the number of persons in the civilian non-
institutional population in that same group to generate a value for the employment/population
ratio (E/P).5 The E/P ratio represents the percent of the members of the civilian non-institutional
population that are employed at a given point in time.6 If there were 1,000 members in a given
population group and 600 were employed, the E/P ratio would be 60 percent. The E/P ratio is
influenced by both a group’s labor force participation rate and its unemployment rate.7 If
members of a group stop looking for work due to poor job prospects, their behavior would
actually lower the unemployment rate but would also simultaneously lower their E/P ratio.
During times of depressed labor market conditions, many teens will stop looking for work,
keeping their unemployment rate artificially low. Between 2000 and 2005, the annual average
civilian labor force participation rate of teens fell very sharply from 52 percent to only 44
percent, a decline of slightly more than eight percentage points. In comparison, the official
unemployment rate of teens is estimated to have increased from only 13.1 to 16.6 percent over
the same four year period. Over this time period, the size of the teen labor force reserve
increased. This is a pool of youth who report a desire for immediate employment even though
4 For further details on the design of the CPS survey and its uses in generating monthly labor force data for the nation, See: U.S. Department of Labor, Bureau of Labor Statistics, Employment and Earnings, January 2004, U.S. Government Printing Office, Washington, D.C., 2004. 5 The employed include the self-employed, independent contractors, off-the-books workers, wage and salary workers, unpaid family workers employed for at least 15 hours, and those with a job but not at work due to a temporary illness, vacation, weather conditions, or an industrial dispute at the workplace. 6 The civilian non-institutional population excludes the homeless and those living in institutions, such as juvenile homes, jails, prisons, long-stay hospitals, mental institutions, and nursing homes. Persons serving in the nation’s armed forces are also excluded from the count of the civilian non-institutional population. 7 Algebraically, the E/P ratio can be seen to be determined by the product of the labor force participation rate and the employment rate of labor force members. The employment rate is equal to one minus the unemployment rate. E/P = L/P • E/L E/L = 1 – U/L Where U/L = unemployment rate E/L = employment rate L/P = labor force participation rate

4
they are not actively looking for work. The official unemployment rate for teens, thus,
substantially underestimates the deterioration in the teen job market over the past four years.8
Recent and Historical Trends in Teen Employment Rates During the labor market boom of the 1990s, the employment rate of the nation’s teens
rose fairly steadily from 1993 through 2000, peaking at 45.2% at the end of the decade, a gain of
4.2 percentage points from 1992 (Chart 1). It is interesting to note, however, that, despite the
fact that the nation was characterized by the lowest overall unemployment rate since the late
1960s the teen employment rate in 2000 did not regain the value of 47.5% that prevailed at the
end of the 1980s. Since 2000, however, the E/P ratio of the nation’s teenagers has declined
sharply, falling to 36.4% in 2004 and holding steady at 36.5 during 2005, representing a decline
of nearly nine percentage points over this five year period (Table 1 and Chart 1). The fact that
the teen employment rate fell at an above average rate during the recession of 2001 and jobless
recovery of 2002 is not surprising. Similar labor market developments took place during the
recession and recovery of the early 1980s and the early 1990s; however, the failure of the E/P
ratio of teens to rise four years after the end of the recession of 2001 is unique. The E/P ratio of
the nation’s teens began to rise strongly in 1984 less than two years after the trough of the
economic recession of 1982 in November of that year. During 1993, the E/P ratio of the nation’s
teens began to rise only two years after the end of the recession in March 1991. Yet, in the
fourth year after the end of the relatively moderate recession of 2001, the E/P ratio of teens has
failed to improve despite the fact that the nation’s overall unemployment rate in 2005 was well
below that prevailing during the early years of recovery from the 1981-1982 and 1990-1991
recessions.9 There appear to be new structural forces at work in U.S. labor markets that are
making it more difficult for teens to obtain jobs during the economic recovery. Since 2003, the
number of employed civilians (16+) has increased by approximately 4 million. New payroll job
growth since the early fall of 2003 has completely bypassed the nation’s teenage population.
8 Part of the problem with estimating the official unemployment rate for teens is related to the use of proxy respondents in the CPS household survey. Information on the labor force activities of teen household members is frequently provided by their mothers, who tend to underreport their job search activities, especially in periods of high unemployment. Interviews with the teens themselves tend to yield both higher employment and unemployment rates. 9 The stronger recovery of the teen employment rate from the recession of 1982 was facilitated in part by a declining teenage population, due to the baby bust generation entering their teenaged years. The population of 16-19 year olds fell sharply from 16.695 million in 1978 to 13.84 million in 1992, a drop of 2.8 million or 17%.

5
Chart 1: Trends in the Employment to Population Ratios of Teens (16-19) in the U.S., Selected Years
1989 to 2005 (Annual Averages, in %)
48.5
41.5
47.5
41.0
45.2
39.636.8 36.4 36.5
0.0
10.0
20.0
30.0
40.0
50.0
60.0
1979 1982 1989 1992 2000 2002 2003 2004 2005
%
Teens have experienced dismal employment prospects over the past few years,
particularly in comparison to other age groups. As noted above, the teen employment/population
ratio (E/P) has dropped approximately nine percentage points since 2000. In 2005, the annual
average teen E/P ratio was only 36.5 percent, down from 45.2 percent in 2000. The teen E/P
ratio fell far more substantially between 2000 and 2005 than that of any other age group (Table
1, and Chart 2). Young adults between the ages of 20 and 24 experienced the second largest
decline in their E/P ratio, but this decline of 4.2 percentage points was less than one-half of the
decline in the teen E/P ratio. While other age groups also experienced substantive employment
declines, especially those between 25 and 34 years of age, two age groups of adults were
employed at higher rates in 2005. They were older workers between the ages of 55 and 64 and
those 65 and over. The employment rates of these two older groups rose by 3.0 and 2.0
percentage points, respectively, over the 2000-2005 period. The size of this age twist in
employment rates is historically unique.
6
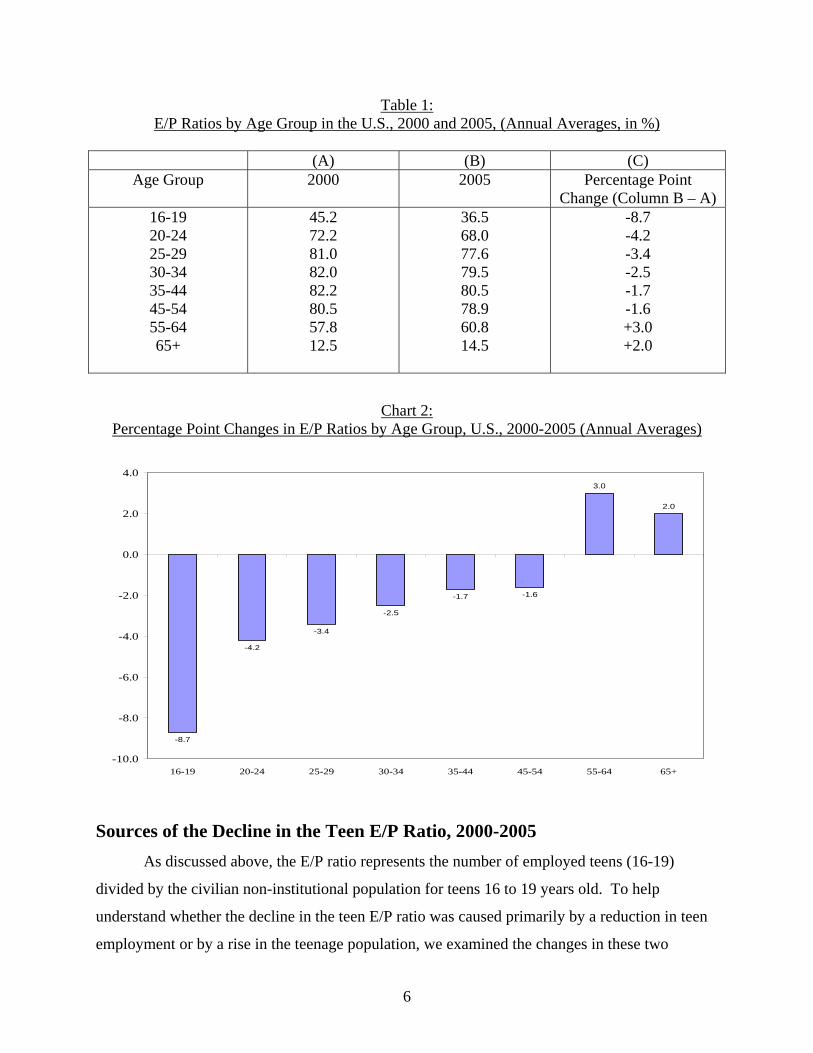
Table 1: E/P Ratios by Age Group in the U.S., 2000 and 2005, (Annual Averages, in %)
(A) (B) (C)
Age Group 2000 2005 Percentage Point Change (Column B – A)
16-19 20-24 25-29 30-34 35-44 45-54 55-64 65+
45.2 72.2 81.0 82.0 82.2 80.5 57.8 12.5
36.5 68.0 77.6 79.5 80.5 78.9 60.8 14.5
-8.7 -4.2 -3.4 -2.5 -1.7 -1.6 +3.0 +2.0
Chart 2: Percentage Point Changes in E/P Ratios by Age Group, U.S., 2000-2005 (Annual Averages)
-8.7
-4.2
-3.4
-2.5
-1.7 -1.6
3.0
2.0
-10.0
-8.0
-6.0
-4.0
-2.0
0.0
2.0
4.0
16-19 20-24 25-29 30-34 35-44 45-54 55-64 65+
Sources of the Decline in the Teen E/P Ratio, 2000-2005 As discussed above, the E/P ratio represents the number of employed teens (16-19)
divided by the civilian non-institutional population for teens 16 to 19 years old. To help
understand whether the decline in the teen E/P ratio was caused primarily by a reduction in teen
employment or by a rise in the teenage population, we examined the changes in these two

7
variables between 2000 and 2005 (Table 2). Teen employment fell from nearly 7.2 million in
2000 to slightly below 6 million in 2005 or by approximately 1,200,000 teens. This represented
a 17 percent decline in employment among teenagers. The teenage population grew only
modestly by 486,000 teens, or 3% over this five year period. Thus, it is clear that the sharp
decline in the teen E/P ratio was almost entirely due to the substantial decline in the number of
employed teens and not to a sharp population increase in this age group. If the teen E/P ratio of
2000 had prevailed in 2005, there would have been another 1.43 million teens employed each
month during 2005.
Table 2 Comparisons of the Employment and Population Levels of Teens in the U.S., 2000 and
2005 (Annual Averages)
(A) (B) (C) (D) 2000 2005 Change 2000-
2005 % Change 2000-
2005 Employment (in millions) Population (in millions)
7.189 15.912
5.978 16.398
-1.211 .486
-16.8% +3.0%
Source: U.S. Bureau of Labor Statistics, website, www.bls.gov
Changes in Teen E/P Ratios by Gender and Race-Ethnic Group, 2000-2005 The above findings on teen employment developments over the past five years have
focused on the employment outcomes for all teens combined. To identify how different
demographic and socioeconomic subgroups of teens have fared, we have analyzed employment
outcomes for gender, race-ethnic, household income, and schooling subgroups of teens.
Declines in the E/P ratios of teens between 2000 and 2005 prevailed across all gender and race-
ethnic subgroups of teens, but the magnitudes of these declines did vary somewhat. Male teens
have experienced a steady and steeper decline in their employment opportunities since 2000 than
their female peers as their E/P ratio fell by 10 percentage points. The male teen E/P ratio of
35.1% in 2005 marked a new historical low. This 35.1% employment rate was the lowest ever
recorded in the 58 year history of data on teen employment statistics from the national CPS
survey. Female teens also were adversely affected by changing labor market conditions,
however they were employed at a higher rate than male teens in 2005, (37.8% to 35.1%). The
E/P ratio for female teens in 2005 was down 7 percentage points since 2000 (Table 3). In
contrast to the experiences of male teens, the E/P ratio of female teens rose modestly in 2005.

8
Table 3: E/P Ratios of Teens (16 to 19) by Gender in the U.S., 2000-2005 (Annual Averages in %)
(A) (B) (C) 2000 2005 Percentage Point
Change (Column B – A) All
Males Females
45.2 45.4 45.0
36.5 35.1 37.8
-8.7 -10.3 -7.2
Source: U.S. Bureau of Labor Statistics, website. Teen employment rates also can be identified for four major race-ethnic groups: White,
Blacks, Hispanics, and Asians. Hispanics can be members of any race though most are classified
as Whites. Across our four race-ethnic groups, teen E/P ratios fell between 7 and 9 percentage
points between 2000 and 2005. Black teenagers fared the worst in 2005, experiencing the lowest
employment rate among the four major race-ethnic groups. The Black teen E/P ratio during the
past year was only 21.6 percent. This employment rate was down by more than eight percentage
points from approximately 30 percent in 2000. The Black teen E/P ratio has been in the 21.5 to
21.7 percentage point range since 2003, implying only 1 of 5 Black teens worked during an
average month. This three-year average is the lowest for Black teens since the early 1980’s.
White teens also have fared poorly in the labor market since 2000. Their E/P ratio has fallen by
approximately 9 percentage points to 40.2 percent in 2005, the steepest decline in percentage
points among the four race-ethnic groups. The E/P ratio of White teens in 2005 was still
approximately 19 percentage points higher than the Black teen E/P ratio and 17 percentage
points greater than the E/P ratio for Asian teens. Asian teens were employed at a rate of only 23
out of every 100, which was only slightly better than their Black counterparts. During the past
year, Hispanic teens had a 31.5 percent employment rate, which was down 7 percentage points
from its level in 2000 (Table 4). No gender or race-ethnic group of teens was immune from the
drop in overall teen job opportunities.

9
Table 4: E/P Ratios of Teens 16 to 19 Years Old by Race-Ethnic Group,
U.S., 2000-2005 (Annual Averages in %)
(A) (B) (C) Race/Ethnic Group 2000 2005 Percentage Point
Change (Column B- A) White Black
Hispanic Asian
49.1 29.8 38.6 30.7
40.2 21.6 31.5 22.8
-8.9 -8.2 -7.1 -7.9
Teen E/P Ratios by Household Income in 2005
National, state, and local research on teen and young adult labor markets has consistently
shown that teen employment rates vary considerably across household income groups and across
neighborhoods based on their socioeconomic characteristics, especially the incidence of poverty
problems. 10 The monthly CPS household surveys collect information on the estimated gross
annual income of the households in which teens live.11 We have used this information on
household incomes to classify youth into one of the following six income categories.
• Under $20,000
• $20,000 – 40,000
• $40,000 – 60,000
• $60,000 – 75,000
• $75,000 – 100,000
• $100,000+
Estimates of teen E/P ratios during 2005 by household income status are displayed in
Table 5. The findings for all 16-19 year olds reveal that the share of teens who worked during
2005 rose steadily with household income until the $100,000+ household income category was
reached. On average, only 30 percent of all teens living in low income households (under
$20,000) were employed in 2005. The E/P ratio of teens was 34% for those living in households
with incomes between $20 and $40 thousand, rose to 40% for those with incomes between $40
10 See: (i) William Julius Wilson, When Work Disappears, Alfred Knopf, New York, 1996; (ii) Paul A. Jargowsky, Poverty and Place: Ghettos, Barrios, and the American City, Russell Sage Foundation, New York, 1996; (iii) Andrew Sum, Neeta Fogg, and Sheila Palma, “Early Findings from the Kulick Youth Opportunity Area Demonstration for Out-of-School Youth,” in Making Connections: Youth Program Strategies for a Generation of Challenge, Sar Levitan Center for Social Policy Studies, Johns Hopkins University, 1999. 11 Household income data from the 2005 CPS Surveys were available for about 85% of the sample of teens.

10
and $60 thousand, and peaked at 45% for those living in households with incomes between
$75,000 and $100,000.
The positive statistical association between teen E/P ratios and household incomes held
true for both men and women and for Whites, Blacks, and Hispanics. Only among Asian youth,
the group with the highest sampling error, was there no significant link between employment
rates and household incomes during 2005. When we classify teens into categories combining
their race-ethnic status and household income status, the E/P ratios varied considerably, ranging
from a low of 18% among low income, Black teens to highs of 50% for upper middle income,
White teens. In every household income group, White teens were more likely to work than their
peers in each of the other three, race-ethnic groups.
Table 5: Teen E/P Ratios by Household Income, All and by Gender and Race-ethnic Group, U.S: 2005
(Annual Averages in %)
(A) (B) (C) (D) (E) (F)
Gender/Race-Ethnic Group
<$20,000 $20-$40,000
$40-$60,000
$60-$75,000
$75-$100,000
$100,000+
All 30.2 33.8 39.9 44.7 45.4 40.8 Men 28.2 33.5 37.9 44.6 44.9 39.7 Women 32.1 34.2 41.8 44.9 46.0 41.9
White 40.1 40.5 43.6 48.8 49.7 42.6 Black 17.8 23.9 28.0 29.0 26.7 28.4 Asian 28.2 23.9 27.6 25.2 21.3 23.3 Hispanic 27.3 29.8 36.0 40.4 34.7 36.4 Source: 2005 Monthly CPS Household Surveys, Public Use Files, tabulations by authors.
When the data for high school students are analyzed separately, very similar patterns
emerge. In contrast to the predictions of neoclassical labor supply theory, high school youth
from higher income families were the most likely to work in 2005 (Chart 3). The E/P ratios of
high school students rose from a low of 15% among those in low income families to a high of 35
percent among those living in families with incomes between $60-$100 thousand dollars.
Employment rates of high school students in the most affluent families ($100,000 or higher)
were slightly lower than those in upper middle income families but twice as high as those of

11
teens in the low income families. Only 1 of every 7 low income high school students worked
during an average month in the past calendar year. They run the greatest risk of being jobless
upon graduation due to their limited work experience during high school.
Chart 3: E/P Ratios of 16-19 Year Old High School Students by Household Income, 2005 (Annual
Averages, in %)
15
22
29
35 35
32
0
5
10
15
20
25
30
35
40
<20 20-40 40-60 60-75 75-100 100,000+
Household Income (in $1000s)
%
Employment Experiences of Teens By School Enrollment Status During 2005 In this section of the paper, we will examine the employment experiences of teens in
2005 by their school enrollment status. Given the greater concerns of joblessness among out-of-
school teens, we will begin our analysis with an overview of employment rates among key
subgroups of out-of-school teens. Overall, only slightly more than one-half (52.6%) of teens
who were not enrolled in school were employed during 2005. This E/P rate was down 8.5
percentage points since 2000. Table 6 displays E/P ratios for two categories of teens not enrolled
in school: high school dropouts and those with a high school diploma. The high school
graduates category includes some students who may have attended a post-secondary institution
for a year or more but had not earned a degree, and were not currently enrolled in school. As can
be seen, young high school graduates were far more likely to work than high school dropouts in
2005. The E/P ratio for high school graduates was 65.0%. This ratio was 25 percentage points

12
higher than the E/P ratio for high school dropouts, which was only 40% during that year. Male
teens that were not enrolled in school had a modestly higher employment rate compared to out-
of-school female teens (54.5% to 50.6%). This gender gap difference in favor of males prevailed
among both high school dropouts and high school graduates.
Among race-ethnic groups, out of school White teens were most likely to be employed
followed by Hispanic, Asian, and Black teens. The E/P ratio of Black teens was 20 percentage
points below that of Whites.
Across all four race-ethnic groups, high school graduates were far more likely to be
employed than their high school dropout counterparts. The gaps between the E/P ratios of high
school graduates and high school dropouts exceeded 20 percentage points among each race-
ethnic group and among both men and women. Only one in every four Black teenagers who
dropped out of high school was employed in 2005. Asian teenage dropouts also had severe
employment problems (26%). Black and Asian teenagers who earned a high school diploma
were twice as likely to be employed as Black and Asian high school dropouts.
Table 6: E/P Ratios of Teens 16 to 19 Years Old Not Enrolled in School by Gender and Race-Ethnic
Group, Annual Averages, U.S., 2005
(A) (B) (C) Gender/Race-Ethnic Group
All Not Enrolled High School Dropout
High School Graduate
All Men
Women
White Black
Hispanic Asian
52.6 54.5 50.6
56.5 36.2 49.8 40.2
40.1 43.5 36.4
44.2 24.0 41.6 26.0
65.0 66.2 63.8
68.7 49.1 61.6 52.0
Employment Experiences of Teens Enrolled in School During 2005 The decline in job opportunities for the nation’s teens also has taken a substantial toll on
employment prospects for those youth enrolled in high school and college. Between 2000 and
2005, the E/P ratio of 16-19 year olds enrolled in high school or college fell 7.5 percentage
points to 30.5 percent. College students were much more likely than high school students to be

13
employed in 2005 (Table 7). The E/P ratio of high school students (16-19) was approximately
25 percent while teenagers enrolled in college had an employment rate of 45%, which was about
20 percentage points higher than that of high school students. Only slightly more than one out of
every four high school students worked on an average month during 2005, a decline of 8.5
percentage points from 2000.
The employment experiences of teens that were enrolled in school during 2005 varied
substantially by gender and race-ethnic group. Among enrolled high school and college students
combined, female teens had an employment rate that was 5 percentage points higher than that of
males. White teens enrolled in school were twice as likely to be employed as Black teens.
Among high school students, White teenagers were employed at substantially higher rates than
members of the three other race-ethnic groups studied. Low income Black and Hispanic students
were least likely to be employed in high school, complicating their ability to successfully
transition to the labor market after graduation.
Table 7:
E/P Ratios of Teens (16-19) Enrolled in School by Type of School Attended, Gender and Race-Ethnic Group, U.S., 2005 (Annual Averages in %)
(A) (B) (C)
Gender/Race-Ethnic Group
Total Enrolled Enrolled In High School
Enrolled in College
All Men
Women
White Black
Hispanic Asian
30.5 27.9 33.2
34.2 16.1 22.7 19.3
25.4 23.4 27.6
28.8 12.3 16.7 15.5
45.9 43.7 47.7
49.8 31.0 45.1 26.7
The Impact of Changing School Enrollment Behavior on the E/P Ratios of Teens
Some observers of youth labor market developments in recent years have noted that more
teenagers have been enrolled in school, thereby reducing the teen employment rate since youth
enrolled in high school or college are less likely to work than their peers out of school. Some of
these analysts thus downplay concerns over declining teen E/P rates. During 2005, there were
14
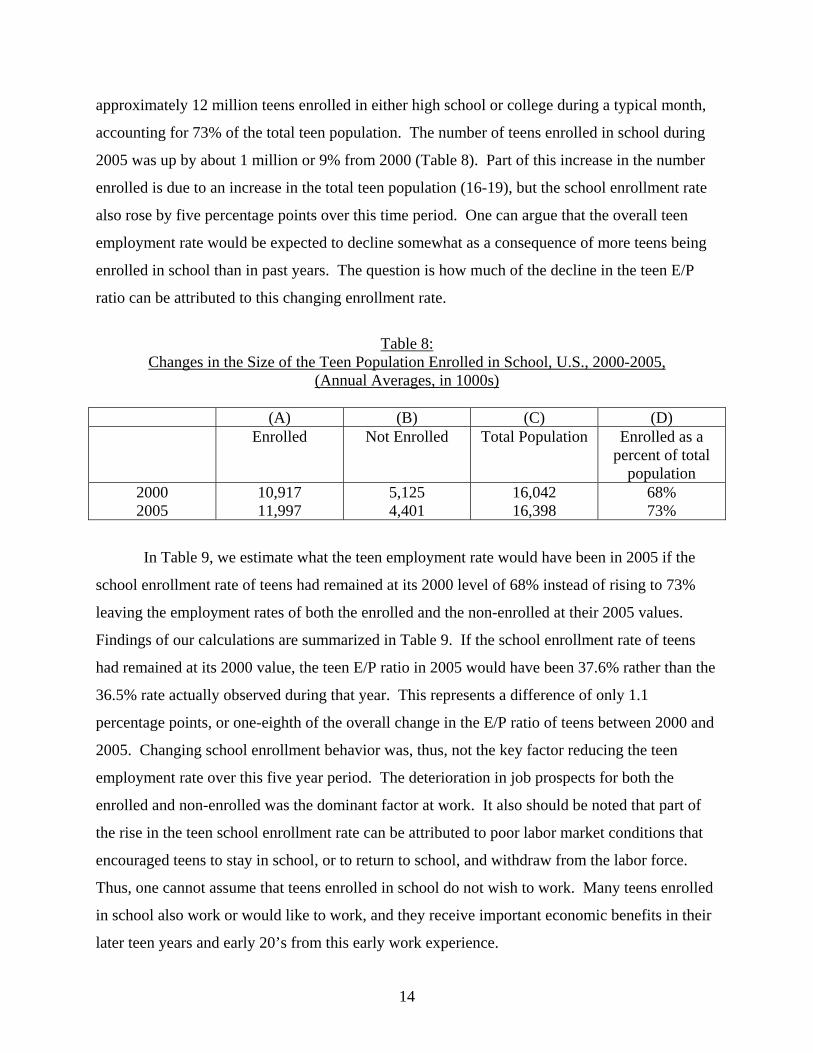
approximately 12 million teens enrolled in either high school or college during a typical month,
accounting for 73% of the total teen population. The number of teens enrolled in school during
2005 was up by about 1 million or 9% from 2000 (Table 8). Part of this increase in the number
enrolled is due to an increase in the total teen population (16-19), but the school enrollment rate
also rose by five percentage points over this time period. One can argue that the overall teen
employment rate would be expected to decline somewhat as a consequence of more teens being
enrolled in school than in past years. The question is how much of the decline in the teen E/P
ratio can be attributed to this changing enrollment rate.
Table 8:
Changes in the Size of the Teen Population Enrolled in School, U.S., 2000-2005, (Annual Averages, in 1000s)
(A) (B) (C) (D) Enrolled Not Enrolled Total Population Enrolled as a
percent of total population
2000 2005
10,917 11,997
5,125 4,401
16,042 16,398
68% 73%
In Table 9, we estimate what the teen employment rate would have been in 2005 if the
school enrollment rate of teens had remained at its 2000 level of 68% instead of rising to 73%
leaving the employment rates of both the enrolled and the non-enrolled at their 2005 values.
Findings of our calculations are summarized in Table 9. If the school enrollment rate of teens
had remained at its 2000 value, the teen E/P ratio in 2005 would have been 37.6% rather than the
36.5% rate actually observed during that year. This represents a difference of only 1.1
percentage points, or one-eighth of the overall change in the E/P ratio of teens between 2000 and
2005. Changing school enrollment behavior was, thus, not the key factor reducing the teen
employment rate over this five year period. The deterioration in job prospects for both the
enrolled and non-enrolled was the dominant factor at work. It also should be noted that part of
the rise in the teen school enrollment rate can be attributed to poor labor market conditions that
encouraged teens to stay in school, or to return to school, and withdraw from the labor force.
Thus, one cannot assume that teens enrolled in school do not wish to work. Many teens enrolled
in school also work or would like to work, and they receive important economic benefits in their
later teen years and early 20’s from this early work experience.

15
Table 9: Estimated Teen E/P Ratio in 2005 If the 2000 School Enrollment Ratio
Had Prevailed (in %)
(A) (B) (C) School Enrollment Group Hypothetical % of
Teens in Group E/P Ratio in
2005 Weighted
Contribution to E/P Ratio
Enrolled in School Not Enrolled in School Hypothetical E/p Ratio in 2005 Actual E/P Ratio in 2005 Hypothetical - Actual
68.0
32.0
30.5
52.6
20.7
16.8
37.6
36.5
+1.1
How Did Teen Employment Rates in 2000 and 2005 Vary by Geographic Division and Across Individual JAG States? Teen employment rates typically have varied quite widely across geographic regions,
states, metropolitan areas, central cities, and neighborhoods within cities.12 This section of the
paper examines how teen E/P ratios varied across geographic divisions and individual states over
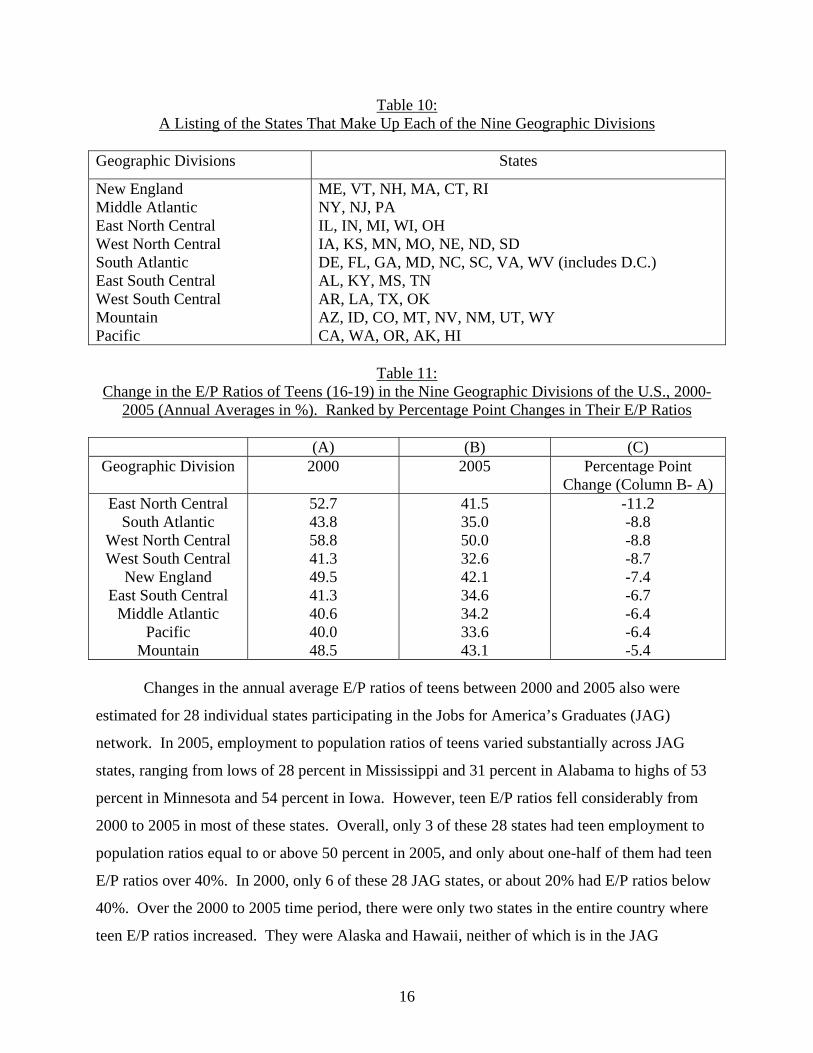
the past five years. The U.S. Census Bureau divides the nation into nine geographic divisions.
A listing of the states that comprise each geographic division is available in Table 10. In 2005,
these E/P ratios ranged from a low of 32.6 percent in the West South Central division to a high of
50.0 percent in the West North Central. Five of the nine divisions had employment rates in 2005
equal to or below 35.0 percent. In comparison, none of nine geographic divisions had a teen
employment rate below 40.0 percent during 2000. Table 11 shows the estimated changes in the
employment to population ratios of teens residing in each of the nine geographic divisions
between 2000 and 2005. Teen E/P ratios declined in all nine divisions over this time period.
The size of these declines ranged from a low of 5.4 percentage points in the Mountain division to
a high of 11.2 percentage points in the East North Central division of the Midwest, which
includes three JAG states.
12 See: Andrew Sum, Neeta Fogg, and Garth Mangum, Confronting the Youth Demographic Challenge: Labor Market Prospects of Out-of-School Youth, Sar Levitan Center for Social Policy Studies, Johns Hopkins University, Baltimore, 2000.
16
Table 10: A Listing of the States That Make Up Each of the Nine Geographic Divisions
Geographic Divisions States
New England Middle Atlantic East North Central West North Central South Atlantic East South Central West South Central Mountain Pacific
ME, VT, NH, MA, CT, RI NY, NJ, PA IL, IN, MI, WI, OH IA, KS, MN, MO, NE, ND, SD DE, FL, GA, MD, NC, SC, VA, WV (includes D.C.) AL, KY, MS, TN AR, LA, TX, OK AZ, ID, CO, MT, NV, NM, UT, WY CA, WA, OR, AK, HI
Table 11:
Change in the E/P Ratios of Teens (16-19) in the Nine Geographic Divisions of the U.S., 2000- 2005 (Annual Averages in %). Ranked by Percentage Point Changes in Their E/P Ratios
(A) (B) (C)
Geographic Division 2000 2005 Percentage Point Change (Column B- A)
East North Central South Atlantic
West North Central West South Central
New England East South Central
Middle Atlantic Pacific
Mountain
52.7 43.8 58.8 41.3 49.5 41.3 40.6 40.0 48.5
41.5 35.0 50.0 32.6 42.1 34.6 34.2 33.6 43.1
-11.2 -8.8 -8.8 -8.7 -7.4 -6.7 -6.4 -6.4 -5.4
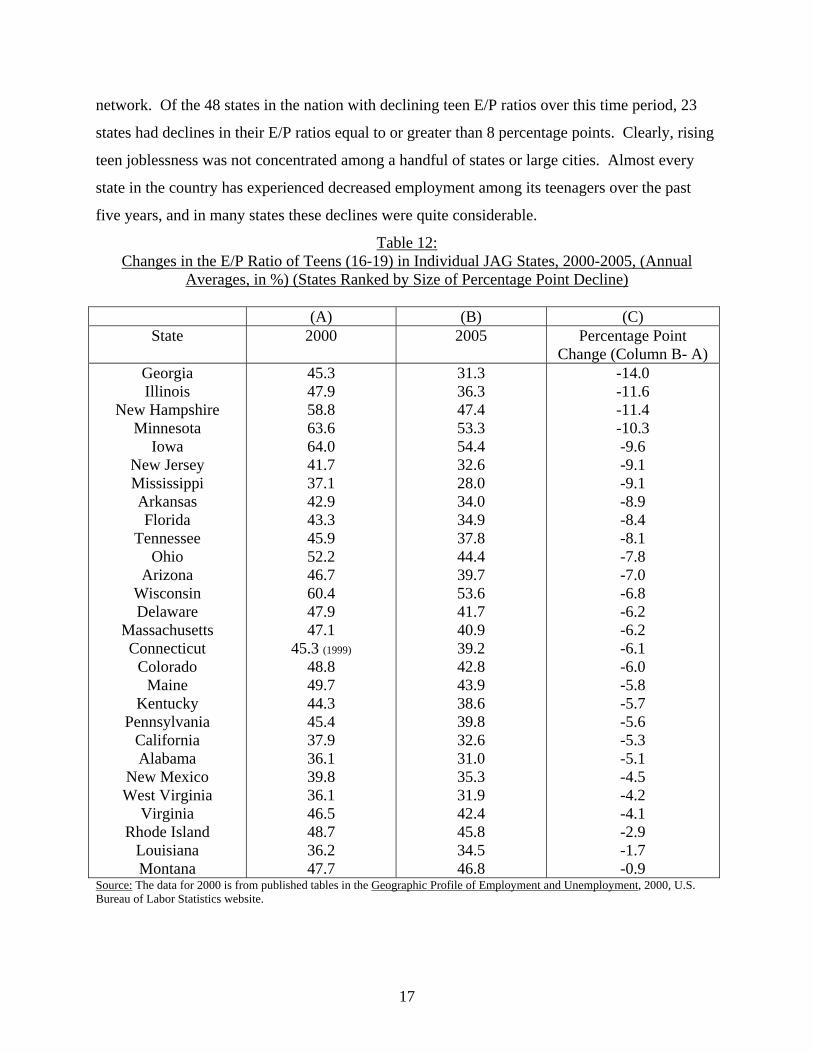
Changes in the annual average E/P ratios of teens between 2000 and 2005 also were
estimated for 28 individual states participating in the Jobs for America’s Graduates (JAG)
network. In 2005, employment to population ratios of teens varied substantially across JAG
states, ranging from lows of 28 percent in Mississippi and 31 percent in Alabama to highs of 53
percent in Minnesota and 54 percent in Iowa. However, teen E/P ratios fell considerably from
2000 to 2005 in most of these states. Overall, only 3 of these 28 states had teen employment to
population ratios equal to or above 50 percent in 2005, and only about one-half of them had teen
E/P ratios over 40%. In 2000, only 6 of these 28 JAG states, or about 20% had E/P ratios below
40%. Over the 2000 to 2005 time period, there were only two states in the entire country where
teen E/P ratios increased. They were Alaska and Hawaii, neither of which is in the JAG
17
network. Of the 48 states in the nation with declining teen E/P ratios over this time period, 23
states had declines in their E/P ratios equal to or greater than 8 percentage points. Clearly, rising
teen joblessness was not concentrated among a handful of states or large cities. Almost every
state in the country has experienced decreased employment among its teenagers over the past
five years, and in many states these declines were quite considerable.
Table 12: Changes in the E/P Ratio of Teens (16-19) in Individual JAG States, 2000-2005, (Annual
Averages, in %) (States Ranked by Size of Percentage Point Decline)
(A) (B) (C) State 2000 2005 Percentage Point
Change (Column B- A) Georgia Illinois
New Hampshire Minnesota
Iowa New Jersey Mississippi Arkansas Florida
Tennessee Ohio
Arizona Wisconsin Delaware
Massachusetts Connecticut
Colorado Maine
Kentucky Pennsylvania
California Alabama
New Mexico West Virginia
Virginia Rhode Island
Louisiana Montana
45.3 47.9 58.8 63.6 64.0 41.7 37.1 42.9 43.3 45.9 52.2 46.7 60.4 47.9 47.1
45.3 (1999) 48.8 49.7 44.3 45.4 37.9 36.1 39.8 36.1 46.5 48.7 36.2 47.7
31.3 36.3 47.4 53.3 54.4 32.6 28.0 34.0 34.9 37.8 44.4 39.7 53.6 41.7 40.9 39.2 42.8 43.9 38.6 39.8 32.6 31.0 35.3 31.9 42.4 45.8 34.5 46.8
-14.0 -11.6 -11.4 -10.3 -9.6 -9.1 -9.1 -8.9 -8.4 -8.1 -7.8 -7.0 -6.8 -6.2 -6.2 -6.1 -6.0 -5.8 -5.7 -5.6 -5.3 -5.1 -4.5 -4.2 -4.1 -2.9 -1.7 -0.9
Source: The data for 2000 is from published tables in the Geographic Profile of Employment and Unemployment, 2000, U.S. Bureau of Labor Statistics website.

18
Path Dependency of Teen Employment: The Positive Effects of Early Work Experience
The employment behavior of teens is characterized by strong path dependency; i.e., the
employment status of teens in time period (t + 1) is strongly linked to their job status in time
period t. Teens who work more in a given year (i.e. 2004) are more likely to be working the
following year, 2005. To illustrate the nature of these employment relationships, we cross-
tabulated the employment status of 16-20 year old high school students in March 2005 by their
employment experiences in the prior calendar year; i.e., 2004. Each high school student in March
2005 was assigned to one of the following four mutually exclusive employment categories: did
not work at all in the prior year, worked 1-13 weeks, worked 14-26 weeks, and worked 27 or
more weeks during the year.
The employment rates of these high school students in March 2005 varied markedly by
their weeks of work experience in the prior calendar year. Among those 16-20 year olds with no
reported weeks of paid employment in 2004, only 8% were working at the time of the March
2005 CPS survey (Chart 22). If they had worked for 1-13 weeks in the previous year, then their
employment rate would rise to 32 percent. Of those with more than six months of paid
employment in 2004, 88 percent were employed at the time of the March 2005 survey. The
employment rate of this last group of high school students with substantive work experience in
the prior year was eleven times higher than that of their peers with no paid employment during
2004.

19
Chart 4: Percent of 16-20 Year Old High School Students Who Worked in March 2005 by Number of
Weeks Worked in Previous Calendar Year
8
32
64
88
0
10
20
30
40
50
60
70
80
90
100
N o W ork 1-13 W eeks 14-26 W eeks 27+ W eeks
W eeks W orked in Prior Y ear
% E
mpl
oyed
The strong time path dependence of employment among all high school students
combined holds true among men and women, each major race-ethnic group, and family income
group.13 Findings for key race-ethnic groups of high school students are displayed in Table 21.
For members of each of these four groups, only a very small percent (5 to 10 percent) of those
with no paid employment in 2004 were working at the time of the March 2005 CPS survey.
Employment rates of these four groups rose very strongly with the amount of their paid
employment in the prior calendar year. Between 80 and 93 percent of those teens with more than
six months of employment in the prior year were employed in March 2005. Each of these four
groups of students with substantial work experience in 2004 were eight to seventeen times more
likely to be employed in March 2005 than their peers with no weeks of paid work in the prior
year. Work experience among teens clearly begets more work experience. A type of “Matthew
effect” cited by some researchers in the literacy field also appears to prevail in the youth labor
market.14 These same types of behaviors also prevail in the labor market for young adults in
13 Findings from the NLS97 longitudinal surveys of youth also show strong path dependence in employment of teens from age 14 onward. See: U.S. Department of Labor, Bureau of Labor Statistics, Employment of Teenagers During the School Year and Summer, Washington, D.C., 2004. 14 In the literacy field, some researchers including Keith Stanovich of the University of Toronto refer to the cumulative effects of a weak base of literacy skills as the “Matthew effect” from the Biblical dictum, that “the rich get richer and the poor get poorer.” See: (i) Keith Stanovich, “Matthew Effects in Reading: Some Consequences of Individual Differences in the Acquisition of Literacy,” Reading Research Quarterly, Vol. 21, 1986, pp. 360-406; (ii) John Comings, Andrew Sum and Johan Uvin, New Skills

20
their 20s. Cumulative work experience has very substantial effects on the wages and annual
earnings of young men and women,15 and the expected economic returns from work experience
influence the decision of men and women to actively participate in the labor force.16 These
developments have created a “Catch 22” type of problem for young adults. Those who acquire
limited work experience in their late teens and early 20s cannot command high wages in the
labor market, and their limited wage prospects reduce the economic incentive for them to
participate in the labor market. The less work today, the lower the expected wage tomorrow.
Table 13: Percent of 16-20 Year Old Asian, Black, Hispanic, and White, non-Hispanic High School Students Who Worked in March 2005 by Weeks Worked in the Previous Calendar Year
Employment Rate Weeks Worked in Prior Year
(A)
Asian
(B)
Black
(C)
Hispanic
(D)
White 0 5.3 5.5 5.2 10.1 1-13 27.0 32.6 37.4 40.3 14-26 60.9 60.6 59.7 65.3 27+ 92.7 89.3 80.4 88.1 All 16.5 15.4 17.2 32.2
Source: March 2005 CPS Survey, Work Experience and Income Supplement, tabulations by authors.
Labor Force Underutilization Problems Among Teens An understanding of the behavior and forces underlying the steep decline in teen E/P
ratios in recent years is indispensable for policymaking at the national, state, and local level.
Why are so many fewer teens working in recent years? During the past few years, some
reporters in the news media have written stories that attributed the decline in teen employment,
especially during the summer months to teens’ lack of desire to work.17 Some of the views
for A New Economy: Adult Education’s Key Role in Sustaining Economic Growth and Expanding Opportunity, Massachusetts Institute for A New Commonwealth, Boston, 2000. 15 See: John Bishop, “Achievement, Test Scores, and Relative Wages,” in Workers and Their Wages, (Editor: Marvin H. Kosters), American Enterprise Institute, Washington, D.C., 1991. 16 See: Stephanie Aaronson, Looking Ahead: Young Men, Wage Growth, and Labor Market Participation, Ph.D. Dissertation, Columbia University, 2000. 17 For examples of such articles, see: (i). David Cho, “Working on Nothing but a Tan: Many Teenagers Decide They Can Do Without Summer Jobs,” The Washington Post, June 16, 2002, p. C1; (ii) “More Teens Shun Summer Jobs,” CNN web site, July 7, 2002; (iii) Leigh-Ann

21
expressed in these articles said that many teens choose not to work and prefer concentrating on
their academic coursework during the school year or working on their tans during the summer
months. The question on whether teens really want to work cannot be answered alone by official
unemployment statistics. The labor force participation behavior of teens is cyclically sensitive,
declining during periods of rising unemployment and jobless recoveries. If teens sense that jobs
are not available, they will stop actively looking for work and no longer be counted as
unemployed in the CPS survey, even though many of these teens would be willing to accept jobs
if they were offered to them. To identify whether a growing lack of interest in work was a factor
underlying the drop in the teen E/P ratio, the authors analyzed the CPS public use files for the
2005 monthly surveys to estimate the number of teens who were unemployed, underemployed,
or members of the “labor force reserve” sometimes referred to as the hidden unemployed.
• The unemployed are teens who were reported to be actively looking for work and
available for work but jobless at the time of the CPS survey.
• The hidden unemployed or the labor force reserve are those who reported that they
wanted a job at the time of the survey but were not actively looking for work, thus, they
were not categorized as unemployed.
• The underemployed are those teens who were working part-time but desired full-time
employment. The bulk of the underemployed teens are out-of-school youth who work on
average about 20-21 hours per week.
Estimates of the number of teens that fell into one of these labor market problem
categories during 2005 are presented in Table 14. Slightly over 1.2 million teens were
unemployed on an average month in 2005. The number of unemployed males outnumbered
unemployed females by 146,000 or nearly 30%. There were a total of approximately 929,000
teens that were in the labor force reserve. Male teens accounted for 54% of the teens in this
underutilized group. If all of the unemployed and hidden unemployed had been able to find work
in 2005, the E/P ratio of teens would have been approximately 49%, or 12.5 percentage points
above the actual rate during that year. In addition to the unemployed and hidden unemployed,
another 336,772 teens that were working part-time indicated that they would have preferred a
full-time job. The sum of the official unemployed, hidden unemployed, and underemployed
Jackson, “The Elusive Summer Job,” The Austin American Statesman, July 29,2002, p. F1. (iv) Stephanie Armour, “Record Teens Just Say No to Summer Jobs,” USA Today, June 24, 2002.

22
represents the number of underutilized teens, which was just under 2.5 million or 30% of the
adjusted teen labor force.18 The underutilization rate for male teens was about five points higher
than that of female teens, helping explain the rising gender gap in teen E/P ratios. The sheer size
of the pool of underutilized teens indicates that the decline in teen employment cannot be
explained simply by teens’ lack of desire to work. There has been a growing pool of teens
unable to obtain any work or only able to find part-time jobs even though they wish to work full-
time. These full-time jobs provide higher future returns in the form of higher wages and are
much more likely to provide training opportunities.
Table 14:
Number and Percent of 16-19 Year Olds Who Were Unemployed, Hidden Unemployed, or Employed Part-Time for Economic Reasons During 2005, U.S. (Annual Averages)
(A) (B) (C) (D)
Labor Market Category Males Females Total Civilian Labor Force 3,696,216 3,634,302 7,330,518 Unemployed 673,318 527,056 1,200,374 Labor Force Reserve 503,849 424,954 928,803 Working Part-Time for Economic Reasons 180,258 156,514 336,772 Adjusted Labor Force (Labor Force + Labor Force Reserve)
4,200,065 4,059,256 8,259,321
Number of Underutilized Teens 1,357,425 1,108,524 2,465,949 Underutilization Rate (Underutilized Teens/Adjusted Labor Force)
32.3 27.3 29.9
18 The adjusted teen labor force includes the labor force reserve as well as the official civilian labor force.

23
Chart 5: Number of Teens That Were Unemployed, in the Labor Force Reserve, and Underemployed On
An Average Month in 2005, (Annual Averages in 1,000s)
1,200
929
337
0
200
400
600
800
1,000
1,200
1,400
Unemployed Labor Force Reserve Underemployed
#
Summary and Conclusions This research report has provided a comprehensive assessment of changes in the
employment rates of teens across the nation over the past five years. A summary of key findings
and their implications for the design and operation of future JAG school-to-work programs is
presented below.
(i) Teens have faced a steep deterioration in their job prospects over the past five years.
Since 2000, the E/P ratio of the nation’s teenagers has declined by approximately 9 percentage
points, falling sharply to 36.8% in 2003 and remaining at this historically low level through 2005
(36.5%). The fact that the teen E/P ratio has not improved in the fourth year after the moderate
economic recession of 2001 even though the nation’s unemployment rate is relatively low
compared to its level in the past two economic recoveries is puzzling. There appear to be new
structural forces at work in U.S. labor markets that are making it more difficult for teens to
obtain jobs.

24
(ii) The teen E/P ratio fell far more substantially between 2000 and 2005 than that of any
other age group. While other age groups also experienced substantive employment declines,
especially those between 20 and 34 years of age, two age groups of adults were employed at
higher rates in 2005 than they were in 2000. They were older workers between the ages of 55
and 64 and those 65 and over. The employment rates of these two older groups rose by 3.0 and
2.0 percentage points, respectively, over the 2000-2005 period. The size of this age twist in
employment rates is historically unique.
(iii) The steep drop in the E/P ratio of teens between 2000 and 2005 was caused by a
combination of an increase in the teen unemployment rate and a decline in the civilian labor
force participation rate of teenagers. The decline in the civilian labor force participation rate of
teenagers from 2000 to 2005 was 8 percentage points, a far greater decrease than that earlier
projected by the U.S. Bureau of Labor Statistics.
(iv) The declines in the E/P ratios of the nation’s teens between 2000 and 2005 were
widespread across both gender groups and each of four race-ethnic groups. Male teens
experienced a larger decline in their E/P ratio than women (10.3 vs. 7.2 percentage points). In
2005, the E/P ratio of male teens had declined to 35%, a new post-World War II low. The
employment rates of teens in each of the four race-ethnic groups declined by 7 to 9 percentage
points between 2000 and 2005. During the latter year, the E/P ratios of teens varied markedly
across the four race-ethnic groups, ranging from a low of slightly under 22% among Blacks to a
high of 40% among Whites. Boosting the employment rates of Black and Hispanic teens as well
as those of low income Whites should be a major priority for the JAG network.
(v) Employment rates of both teens enrolled in school and those out-of-school declined
sharply between 2000 and 2005. During 2005, only 1 of every 4 teenaged high school students
(16-19) was working. The E/P ratios of these high school students also varied considerably
across race-ethnic groups and household income groups. Only 12% of all Black high school
students and 1 of 6 Hispanic high school students worked on average during the school year.
Among both Black and Hispanic high school students, employment rates in 2005 were lowest
among those residing in households with incomes under $20,000. The more limited work
exposure of high school students, especially race-ethnic minorities and youth from low income
households, will exacerbate their difficulties in transitioning to the labor market upon graduation
and reduce their short-term wage prospects when they do get hired. JAG career specialists should
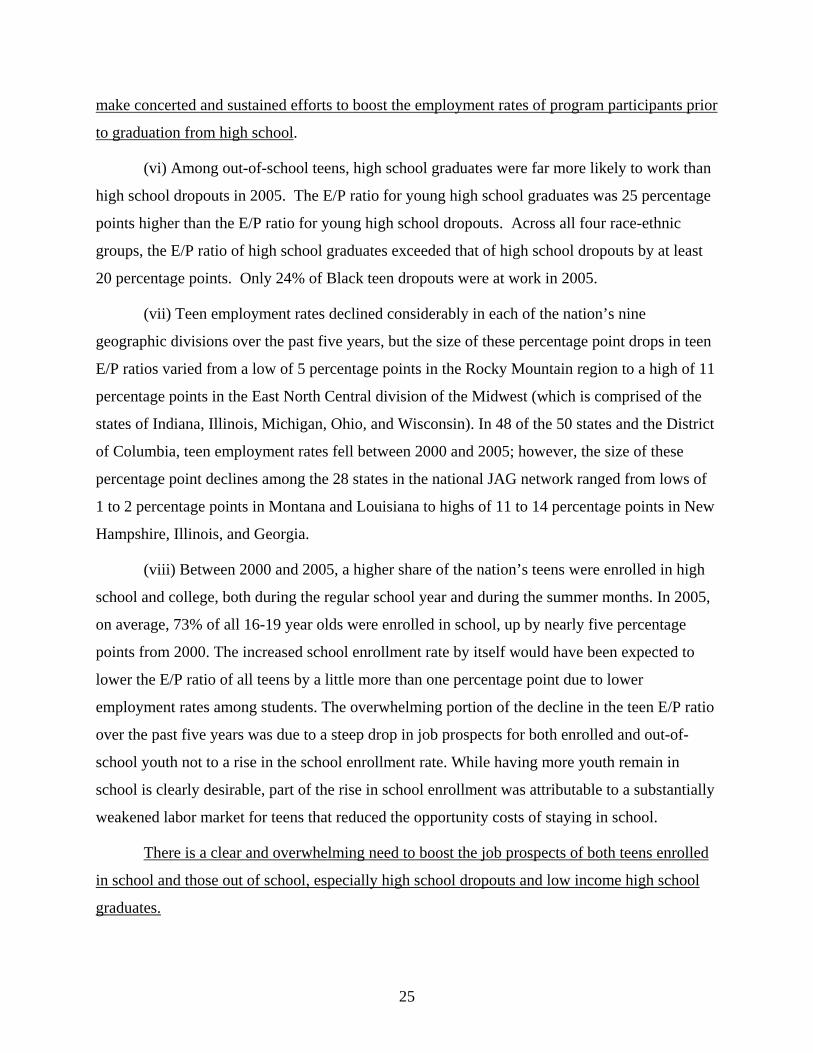
25
make concerted and sustained efforts to boost the employment rates of program participants prior
to graduation from high school.
(vi) Among out-of-school teens, high school graduates were far more likely to work than
high school dropouts in 2005. The E/P ratio for young high school graduates was 25 percentage
points higher than the E/P ratio for young high school dropouts. Across all four race-ethnic
groups, the E/P ratio of high school graduates exceeded that of high school dropouts by at least
20 percentage points. Only 24% of Black teen dropouts were at work in 2005.
(vii) Teen employment rates declined considerably in each of the nation’s nine
geographic divisions over the past five years, but the size of these percentage point drops in teen
E/P ratios varied from a low of 5 percentage points in the Rocky Mountain region to a high of 11
percentage points in the East North Central division of the Midwest (which is comprised of the
states of Indiana, Illinois, Michigan, Ohio, and Wisconsin). In 48 of the 50 states and the District
of Columbia, teen employment rates fell between 2000 and 2005; however, the size of these
percentage point declines among the 28 states in the national JAG network ranged from lows of
1 to 2 percentage points in Montana and Louisiana to highs of 11 to 14 percentage points in New
Hampshire, Illinois, and Georgia.
(viii) Between 2000 and 2005, a higher share of the nation’s teens were enrolled in high
school and college, both during the regular school year and during the summer months. In 2005,
on average, 73% of all 16-19 year olds were enrolled in school, up by nearly five percentage
points from 2000. The increased school enrollment rate by itself would have been expected to
lower the E/P ratio of all teens by a little more than one percentage point due to lower
employment rates among students. The overwhelming portion of the decline in the teen E/P ratio
over the past five years was due to a steep drop in job prospects for both enrolled and out-of-
school youth not to a rise in the school enrollment rate. While having more youth remain in
school is clearly desirable, part of the rise in school enrollment was attributable to a substantially
weakened labor market for teens that reduced the opportunity costs of staying in school.
There is a clear and overwhelming need to boost the job prospects of both teens enrolled
in school and those out of school, especially high school dropouts and low income high school
graduates.