Embed Size (px)
Citation preview
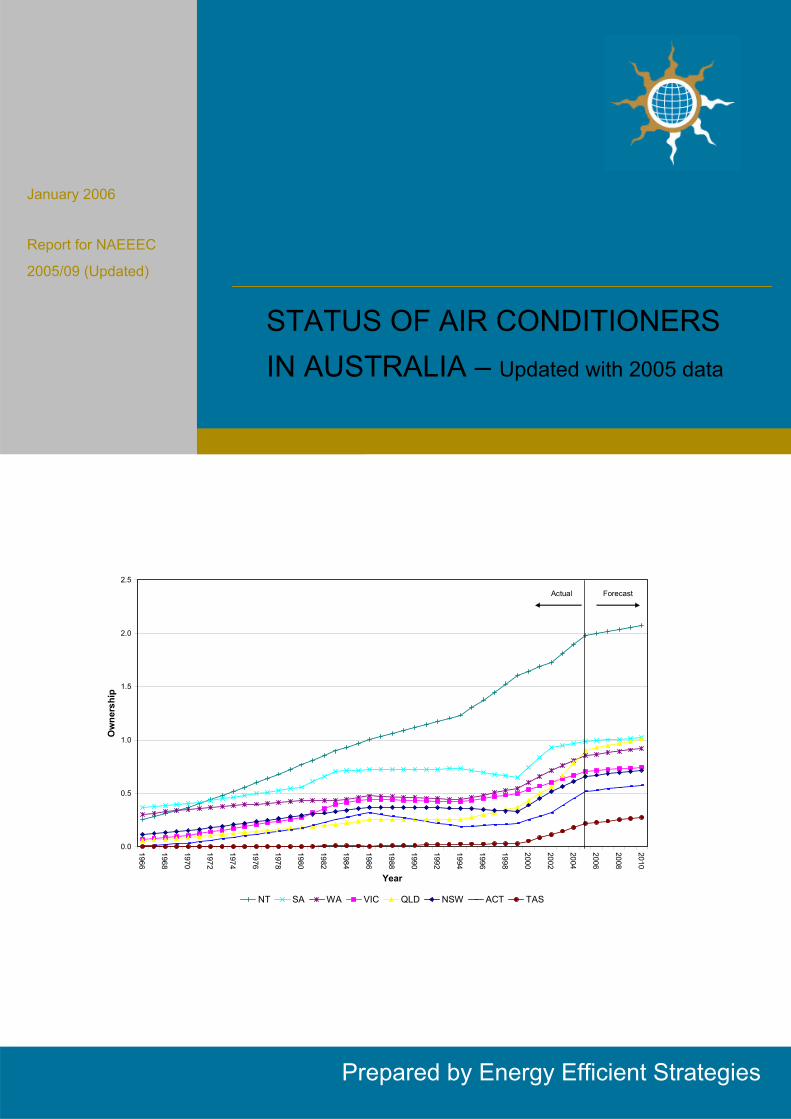
STATUS OF AIR CONDITIONERS IN AUSTRALIA – Updated with 2005 data
January 2006
Report for NAEEEC
2005/09 (Updated)
Prepared by Energy Efficient Strategies
0.0
0.5
1.0
1.5
2.0
2.5
1966
1968
1970
1972
1974
1976
1978
1980
1982
1984
1986
1988
1990
1992
1994
1996
1998
2000
2002
2004
2006
2008
2010
Year
Ow
ners
hip
NT SA WA VIC QLD NSW ACT TAS
ForecastActual
S T A T U S O F A I R C O N D I T I O N E R S I N A U S T R A L I A
i Energy Efficient Strategies P/L
FOREWORD
The following report has been prepared by Energy Efficient Strategies (EES) for the National Appliance and Equipment Energy Efficiency Committee.
The report has a specific aim:
‘to provide the best available data to industry and policy makers on current trends with respect to air conditioners in Australia’
To this end, the data contained in the following report has been compiled from the most up to date sources available at the time of publication. Some of the data is based estimates which have been prepared by the authors or third parties. Most of the data is in the public domain. However, some of the data is commercial and would need to be purchased from the source or supplier for a more detailed breakdown. Some of the data is owned by government and is not available due to privacy restrictions. In these cases, data has been processed in a way that no brand data or user information can be extracted from this report. New data is continually becoming available and this report may be updated from time to time.
Energy Efficient Strategies does not accept any responsibility for the use of this data or any errors that may be contained in the report.
Any views expressed in this report are those of Energy Efficient Strategies and not those of the Australian Greenhouse Office or NAEEEC.
This edition has been updated with ownership and penetration data from ABS 4602.0-2005 which was released November 2005.
Energy Efficient Strategies January 2006
S T A T U S O F A I R C O N D I T I O N E R S I N A U S T R A L I A
ii Energy Efficient Strategies P/L
TABLE OF CONTENTS
1. Background 6 2. Household and Population trends 7 3. Air Conditioner Ownership and Penetration 8 4. Age of Air Conditioners 12 5. Air Conditioners Installed in New Homes 13 6. Trends in Air Conditioner Sales 14 7. Estimated Hours of Operation 15 8. Trends for New Air Conditioners 20
8.1 Current and Future MEPS Levels 26 8.2 Variable Output Compressors and Efficiency 31
9. Estimated energy consumption of Air Conditioners in Australia 32
10. Peak Load Issues 33 11. References and Bibliography 34 12. Appendix One 38
12.1 Individual State Data - New South Wales 38 12.2 Individual State Data - Victoria 40 12.3 Individual State Data – Queensland 42 12.4 Individual State Data - South Australia 44 12.5 Individual State Data - Western Australia 46 12.6 Individual State Data - Tasmania 48 12.7 Individual State Data - Northern Territory 50 12.8 Individual State Data - Australian Capital Territory 52
S T A T U S O F A I R C O N D I T I O N E R S I N A U S T R A L I A
iii Energy Efficient Strategies P/L
LIST OF TABLES
Table 1 – Hours of Air Conditioner Heating and Cooling for Australian Capital Cities ................................................................................................................. 15
Table 2 – Annual Average Hours of use of Air Conditioners by State – 1986......... 16
Table 3 – Comparative Energy Usage Studies for Air Conditioning in New South Wales ................................................................................................................ 19
Table 4 – Air Conditioners – Cooling Only Models; Capacity and Efficiency Trends ............................................................................................................... 21
Table 5 – Air Conditioners – Reverse Cycle Models; Capacity and Efficiency Trends ............................................................................................................... 23
Table 6 – EER Breakdown of Approved Single Phase Air Conditioners in 2005 .... 24
Table 7 – EER Breakdown of Approved Three Phase Air Conditioners in 2005..... 25
Table 8 – Heating and Cooling Electricity used by Air Conditioners by State and Year................................................................................................................... 32
S T A T U S O F A I R C O N D I T I O N E R S I N A U S T R A L I A
iv Energy Efficient Strategies P/L
LIST OF FIGURES
Figure 1 – Household and Population Trends to 2010 .............................................. 7
Figure 2 – National Penetration of Air Conditioners by Year ..................................... 8
Figure 3 – National Ownership of Air Conditioners by Year ...................................... 9
Figure 4 – National Ownership of Air Conditioners by State.................................... 10
Figure 5 – National Share of Air Conditioner Type .................................................. 11
Figure 6 – Evaporative Air Conditioners Ownership Share by Year........................ 11
Figure 7 – Domestic Market Supplies of all Air Conditioner Types.......................... 14
Figure 8 – Relationship of hours of use and CDD/HDD for Sydney households..... 17
Figure 9 – Average NSW Air Conditioner Use by Time of Day and Season – 1994 .................................................................................................................. 18
Figure 10 – Average NSW Air Conditioner Use by Month – 1994........................... 18
Figure 11 – Air Conditioners - Cooling Only Models; Capacity and Efficiency Trends ............................................................................................................... 20
Figure 12 – Air Conditioners - Reverse Cycle Models; Capacity and Efficiency Trends ............................................................................................................... 22
Figure 13 – EER Breakdown of Approved Single Phase Air Conditioners in 2005 .................................................................................................................. 24
Figure 14 – EER Breakdown of Approved Three Phase Air Conditioners in 2005.. 25
Figure 15 – MEPS for 3-Phase Air Conditioners ..................................................... 27
Figure 16 – MEPS for Single Phase Room Air Conditioners–Reverse Cycle, Non Ducted Split Systems ................................................................................ 27
Figure 17 - MEPS for Single Phase Room Air Conditioners – Reverse Cycle, Ducted Systems ................................................................................................ 28
Figure 18 -MEPS for Single Phase Room Air Conditioners–Reverse Cycle, Non Ducted Unitary Systems.................................................................................... 28
Figure 19 - MEPS for Single Phase Room Air Conditioners–Cooling Only, Non Ducted Unitary Systems.................................................................................... 29
Figure 20 - MEPS for Single Phase Room Air Conditioners – Cooling Only, Ducted Systems ................................................................................................ 30
Figure 21 – MEPS for Single Phase Air Conditioners – Cooling Only, Non Ducted Split Systems ........................................................................................ 30
Figure 22 – Performance for a Typical Inverter ....................................................... 31
S T A T U S O F A I R C O N D I T I O N E R S I N A U S T R A L I A
v Energy Efficient Strategies P/L
ABBREVIATIONS
ABS Australian Bureau of Statistics
ABARE Australian Bureau of Agriculture and Resource Economics
CCD Cooling Degree Days
CEC Comparative Energy Consumption
CO Cooling Only
COP Coefficient of Performance
DHSV Department of Human Services Victoria
EER Energy Efficiency Ratio
EES Energy Efficient Strategies
HHD Heating Degree Days
MEPS Minimum Energy Performance Standards
NAEEEC National Appliance and Equipment Energy Efficiency Committee
RC Reverse Cycle
RIS Regulatory Impact Statement
S T A T U S O F A I R C O N D I T I O N E R S I N A U S T R A L I A
6
Energy Efficient Strategies P/L
1. BACKGROUND
There has been an increasing interest shown in air conditioners in recent times. In particular, it appears that the penetration (and ownership) of air conditioners has increased substantially in most states over the past few years and a number of states are experiencing peak load problems during hot weather, in part due to the rapid increase in air conditioner numbers in use.
The market for air conditioners in Australia is complex, as there are a large number of types available and the installed stock varies significantly at the state level (both levels of ownership and share by type). While there is reasonable data on the sales and installed stock of air conditioners, there is relatively poor information on how these are used by consumers and businesses.
This report attempts to quantify some of the issues surrounding air conditioners in Australia where there is data available in the public domain, with the specific aim:
‘to provide the best available data to industry and policy makers on current trends with respect to air conditioners in Australia’
Peak electricity load issues are now prominent in the minds of policy makers and it appears that many State electricity systems are experiencing large summer peak demands. This paper does not examine the size or potential cost of those peaks, but there are links to a number of report in the references which provide further information on this issue.
This report uses the accepted definitions for terms that deal with appliance numbers. These are set out below for clarity:
Penetration – the proportion of households in which a particular appliance type is present (irrespective of the number of units of that appliance in the household). This value is usually given as a percentage. Penetration can never exceed 100%.
Stock – the total number of a particular appliance type in use in all households. This value is given as an integer (usually thousands or millions). The stock refers to the number in regular use, or a proxy for the number in regular use. This is normally defined at state or national level.
Ownership – the ratio of stock to the total number of households. This value is usually given as a decimal number. Ownership can exceed 1.0.
Saturation – the average number of appliances per household for those households with the appliance. Saturation must be greater than or equal to 1.0.
The following simple relationships links these terms:
Ownership = penetration × saturation
Stock = ownership × households
S T A T U S O F A I R C O N D I T I O N E R S I N A U S T R A L I A
7
Energy Efficient Strategies P/L
2. HOUSEHOLD AND POPULATION TRENDS
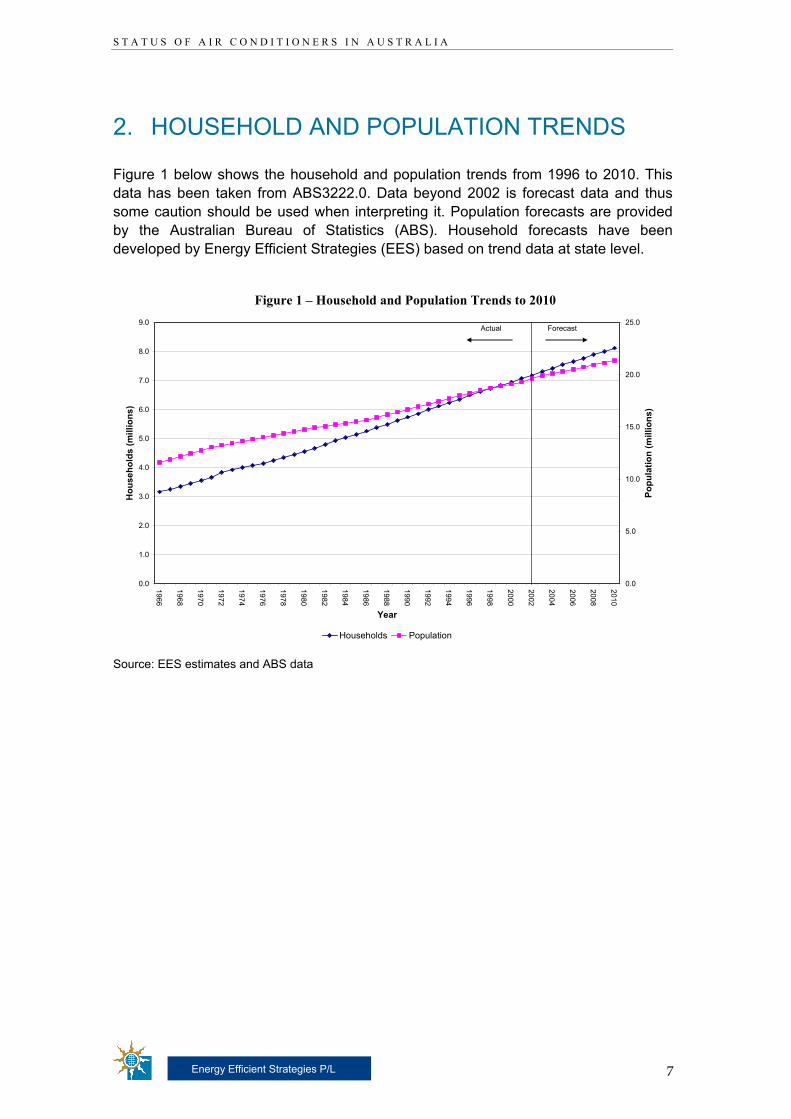
Figure 1 below shows the household and population trends from 1996 to 2010. This data has been taken from ABS3222.0. Data beyond 2002 is forecast data and thus some caution should be used when interpreting it. Population forecasts are provided by the Australian Bureau of Statistics (ABS). Household forecasts have been developed by Energy Efficient Strategies (EES) based on trend data at state level.
Figure 1 – Household and Population Trends to 2010
0.0
1.0
2.0
3.0
4.0
5.0
6.0
7.0
8.0
9.0
1966
1968
1970
1972
1974
1976
1978
1980
1982
1984
1986
1988
1990
1992
1994
1996
1998
2000
2002
2004
2006
2008
2010
Year
Hou
seho
lds
(mill
ions
)
0.0
5.0
10.0
15.0
20.0
25.0
Popu
latio
n (m
illio
ns)
Households Population
ForecastActual
Source: EES estimates and ABS data
S T A T U S O F A I R C O N D I T I O N E R S I N A U S T R A L I A
8
Energy Efficient Strategies P/L
3. AIR CONDITIONER OWNERSHIP AND PENETRATION
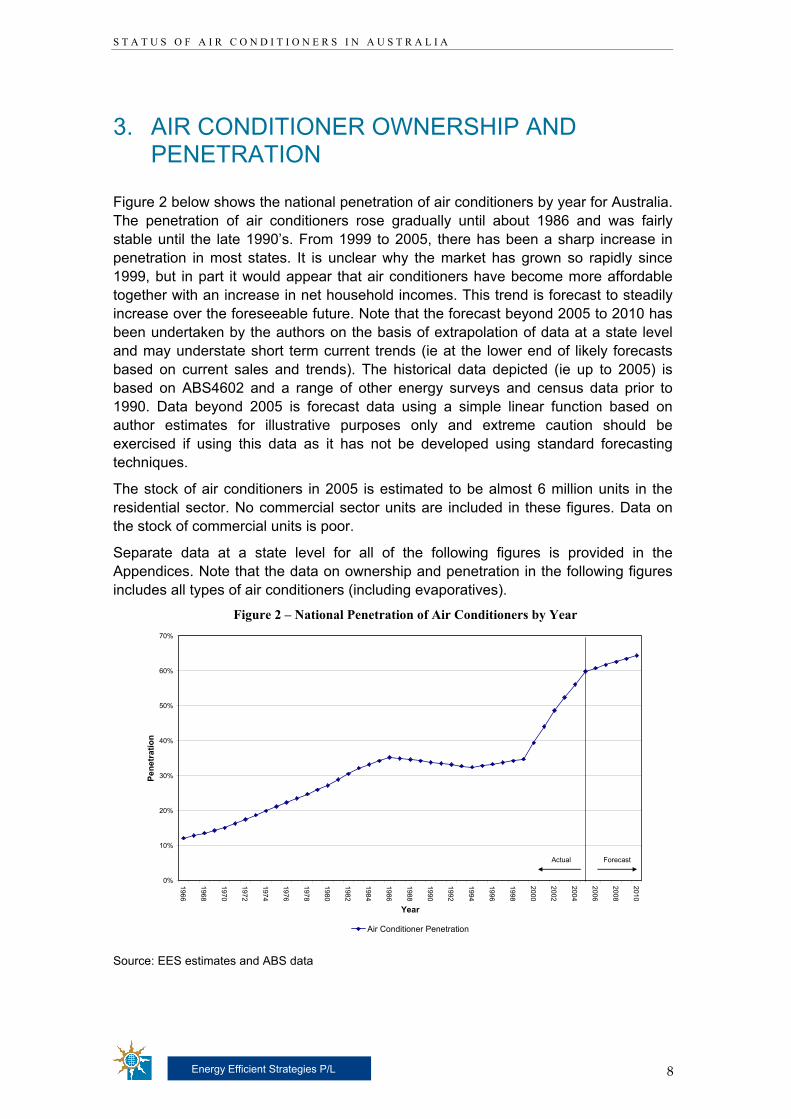
Figure 2 below shows the national penetration of air conditioners by year for Australia. The penetration of air conditioners rose gradually until about 1986 and was fairly stable until the late 1990’s. From 1999 to 2005, there has been a sharp increase in penetration in most states. It is unclear why the market has grown so rapidly since 1999, but in part it would appear that air conditioners have become more affordable together with an increase in net household incomes. This trend is forecast to steadily increase over the foreseeable future. Note that the forecast beyond 2005 to 2010 has been undertaken by the authors on the basis of extrapolation of data at a state level and may understate short term current trends (ie at the lower end of likely forecasts based on current sales and trends). The historical data depicted (ie up to 2005) is based on ABS4602 and a range of other energy surveys and census data prior to 1990. Data beyond 2005 is forecast data using a simple linear function based on author estimates for illustrative purposes only and extreme caution should be exercised if using this data as it has not be developed using standard forecasting techniques.
The stock of air conditioners in 2005 is estimated to be almost 6 million units in the residential sector. No commercial sector units are included in these figures. Data on the stock of commercial units is poor.
Separate data at a state level for all of the following figures is provided in the Appendices. Note that the data on ownership and penetration in the following figures includes all types of air conditioners (including evaporatives).
Figure 2 – National Penetration of Air Conditioners by Year
0%
10%
20%
30%
40%
50%
60%
70%
1966
1968
1970
1972
1974
1976
1978
1980
1982
1984
1986
1988
1990
1992
1994
1996
1998
2000
2002
2004
2006
2008
2010
Year
Pene
trat
ion
Air Conditioner Penetration
ForecastActual
Source: EES estimates and ABS data
S T A T U S O F A I R C O N D I T I O N E R S I N A U S T R A L I A
9
Energy Efficient Strategies P/L
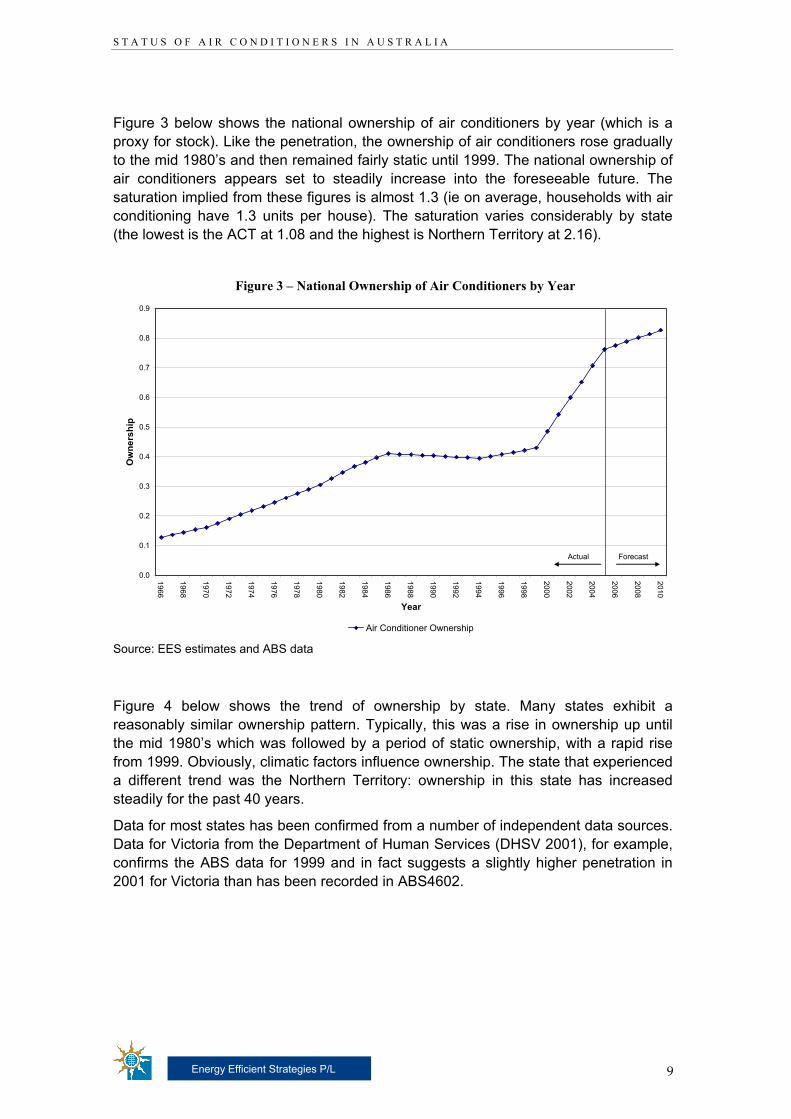
Figure 3 below shows the national ownership of air conditioners by year (which is a proxy for stock). Like the penetration, the ownership of air conditioners rose gradually to the mid 1980’s and then remained fairly static until 1999. The national ownership of air conditioners appears set to steadily increase into the foreseeable future. The saturation implied from these figures is almost 1.3 (ie on average, households with air conditioning have 1.3 units per house). The saturation varies considerably by state (the lowest is the ACT at 1.08 and the highest is Northern Territory at 2.16).
Figure 3 – National Ownership of Air Conditioners by Year
0.0
0.1
0.2
0.3
0.4
0.5
0.6
0.7
0.8
0.9
1966
1968
1970
1972
1974
1976
1978
1980
1982
1984
1986
1988
1990
1992
1994
1996
1998
2000
2002
2004
2006
2008
2010
Year
Ow
ners
hip
Air Conditioner Ownership
ForecastActual
Source: EES estimates and ABS data
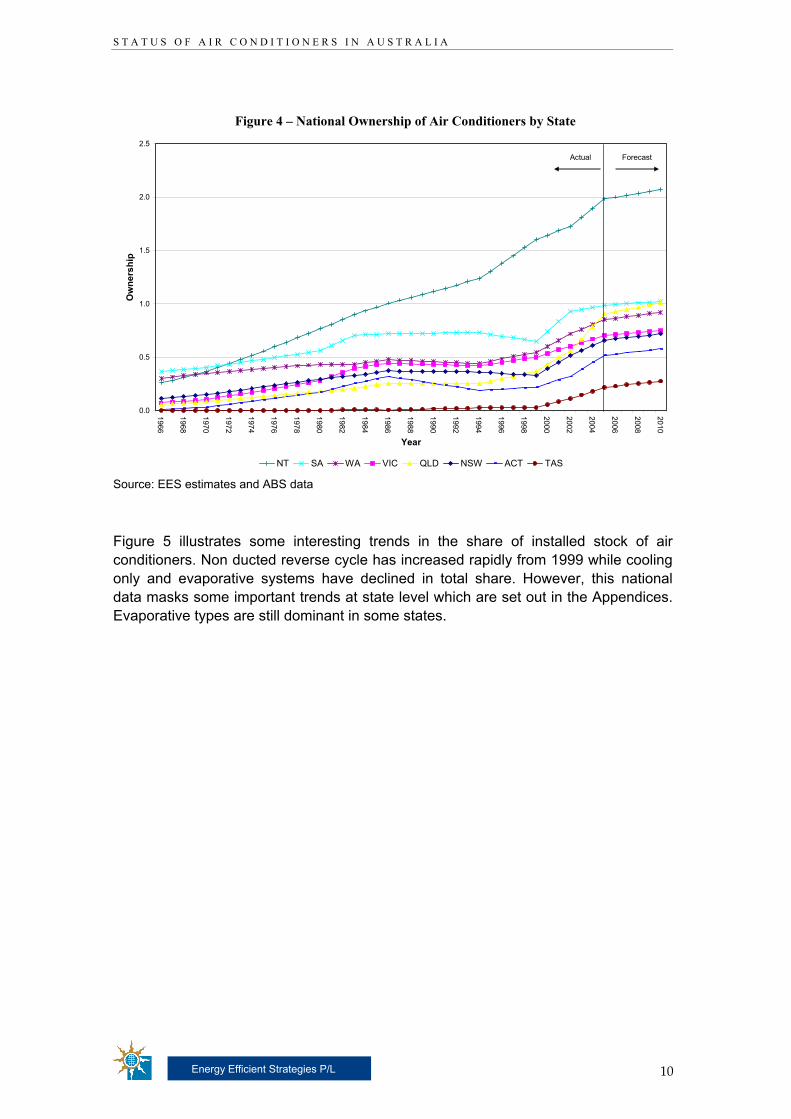
Figure 4 below shows the trend of ownership by state. Many states exhibit a reasonably similar ownership pattern. Typically, this was a rise in ownership up until the mid 1980’s which was followed by a period of static ownership, with a rapid rise from 1999. Obviously, climatic factors influence ownership. The state that experienced a different trend was the Northern Territory: ownership in this state has increased steadily for the past 40 years.
Data for most states has been confirmed from a number of independent data sources. Data for Victoria from the Department of Human Services (DHSV 2001), for example, confirms the ABS data for 1999 and in fact suggests a slightly higher penetration in 2001 for Victoria than has been recorded in ABS4602.
S T A T U S O F A I R C O N D I T I O N E R S I N A U S T R A L I A
10
Energy Efficient Strategies P/L
Figure 4 – National Ownership of Air Conditioners by State
0.0
0.5
1.0
1.5
2.0
2.5
1966
1968
1970
1972
1974
1976
1978
1980
1982
1984
1986
1988
1990
1992
1994
1996
1998
2000
2002
2004
2006
2008
2010
Year
Ow
ners
hip
NT SA WA VIC QLD NSW ACT TAS
ForecastActual
Source: EES estimates and ABS data
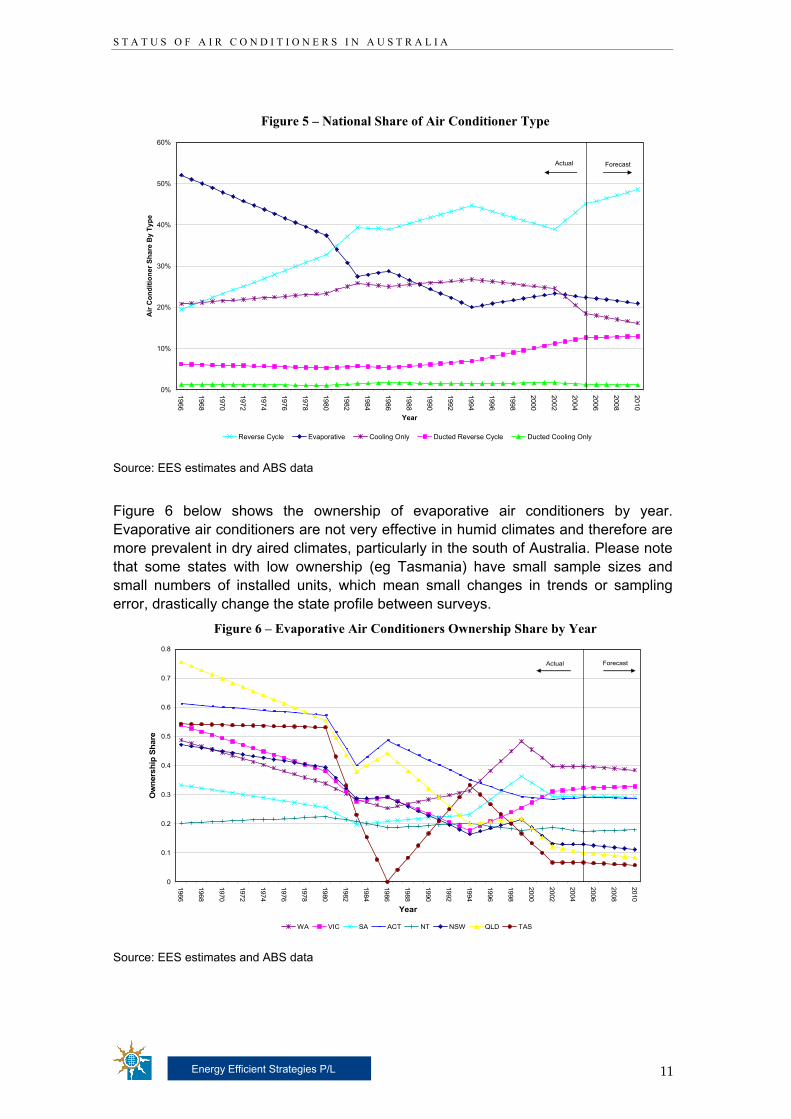
Figure 5 illustrates some interesting trends in the share of installed stock of air conditioners. Non ducted reverse cycle has increased rapidly from 1999 while cooling only and evaporative systems have declined in total share. However, this national data masks some important trends at state level which are set out in the Appendices. Evaporative types are still dominant in some states.
S T A T U S O F A I R C O N D I T I O N E R S I N A U S T R A L I A
11
Energy Efficient Strategies P/L
Figure 5 – National Share of Air Conditioner Type
0%
10%
20%
30%
40%
50%
60%
1966
1968
1970
1972
1974
1976
1978
1980
1982
1984
1986
1988
1990
1992
1994
1996
1998
2000
2002
2004
2006
2008
2010
Year
Air
Con
ditio
ner S
hare
By
Type
Reverse Cycle Evaporative Cooling Only Ducted Reverse Cycle Ducted Cooling Only
ForecastActual
Source: EES estimates and ABS data
Figure 6 below shows the ownership of evaporative air conditioners by year. Evaporative air conditioners are not very effective in humid climates and therefore are more prevalent in dry aired climates, particularly in the south of Australia. Please note that some states with low ownership (eg Tasmania) have small sample sizes and small numbers of installed units, which mean small changes in trends or sampling error, drastically change the state profile between surveys.
Figure 6 – Evaporative Air Conditioners Ownership Share by Year
0
0.1
0.2
0.3
0.4
0.5
0.6
0.7
0.8
1966
1968
1970
1972
1974
1976
1978
1980
1982
1984
1986
1988
1990
1992
1994
1996
1998
2000
2002
2004
2006
2008
2010
Year
Ow
ners
hip
Shar
e
WA VIC SA ACT NT NSW QLD TAS
Actual Forecast
Source: EES estimates and ABS data
S T A T U S O F A I R C O N D I T I O N E R S I N A U S T R A L I A
12
Energy Efficient Strategies P/L
4. AGE OF AIR CONDITIONERS
Data on average age of air conditioners and the age distribution is poor. One of the few sources available is from BIS Shrapnel (report titled: The Household Appliances Market in Australia, Climate Control), who report the age of models which have been replaced by new purchases. This has changed since 1999-2000 to 2001-2002, from 11 to almost 13 years. In 2003-2004 the age of models was found to be almost 14 years. Note that some of these units will be remain in the stock (re-sold or passed on to other households) so the average life of the units in the stock will be somewhat longer than this reported value (age of units replaced).
A study undertaken in February of 1995 by Test Research, found that installed air conditioner units surveyed had an average age of 8 years (average age of the units in the stock). Given the historical ownership trend in preceding years this implies a retirement age of 12 to 18 years (depending on the installation profile and retirement function used), which is broadly consistent with the BIS Shrapnel data.
S T A T U S O F A I R C O N D I T I O N E R S I N A U S T R A L I A
13
Energy Efficient Strategies P/L
5. AIR CONDITIONERS INSTALLED IN NEW HOMES
For the years 2001/2002, 42% of new detached dwellings in Australia had a climate control product installed (BIS Shrapnel 2003). These were made up of 20% ducted, 10% non-ducted and 12% evaporative for all new detached dwellings built in Australia in that period. The proportion of houses with ducted and non-ducted air conditioners installed when new increased from 1998/99.
Similarly, for the years 2001/2002, 47% of new attached dwellings in Australia had a climate control product installed (BIS Shrapnel 2003). These were made up of 20% ducted, 17% non-ducted and 10% evaporative for all new attached dwellings built in Australia. The proportion of new houses with ducted air conditioners remained steady when compared with 1998/99, while the proportion of houses with non-ducted air conditioners increased.
Interestingly, the data shows that the rate of installation of air conditioners in new dwellings is fairly comparable (or perhaps lower) than the national average ownership levels for air conditioners. The rate of installed for ducted systems in new homes is higher than the stock while the rate of installation of evaporative and non-ducted systems is lower than the installed stock. This suggests that many air conditioners are installed some time after the home is completed (especially non-ducted and evaporative systems).
Approximately 150,000 new dwellings are built each year in Australia and about two thirds of these are detached.
Some air conditioners are also installed as part of a building renovations. Air conditioners installed in new dwellings and renovations together account for about 200,000 units a year.
Care is required in the interpretation of these numbers. Total air conditioner sales in 2004 were estimated to be around 1 million units per year. While many of these will be installed in small commercial buildings, this together with the above data, shows that the overwhelming majority of air conditioner sales are either replacement units or are being installed in existing homes (without a major renovation). Many of these are likely to be in fairly new homes where an air conditioner was not fitted at the time of construction.
State level data on ownership for new houses by type is available from the BIS Shrapnel reports.
S T A T U S O F A I R C O N D I T I O N E R S I N A U S T R A L I A
14
Energy Efficient Strategies P/L
6. TRENDS IN AIR CONDITIONER SALES
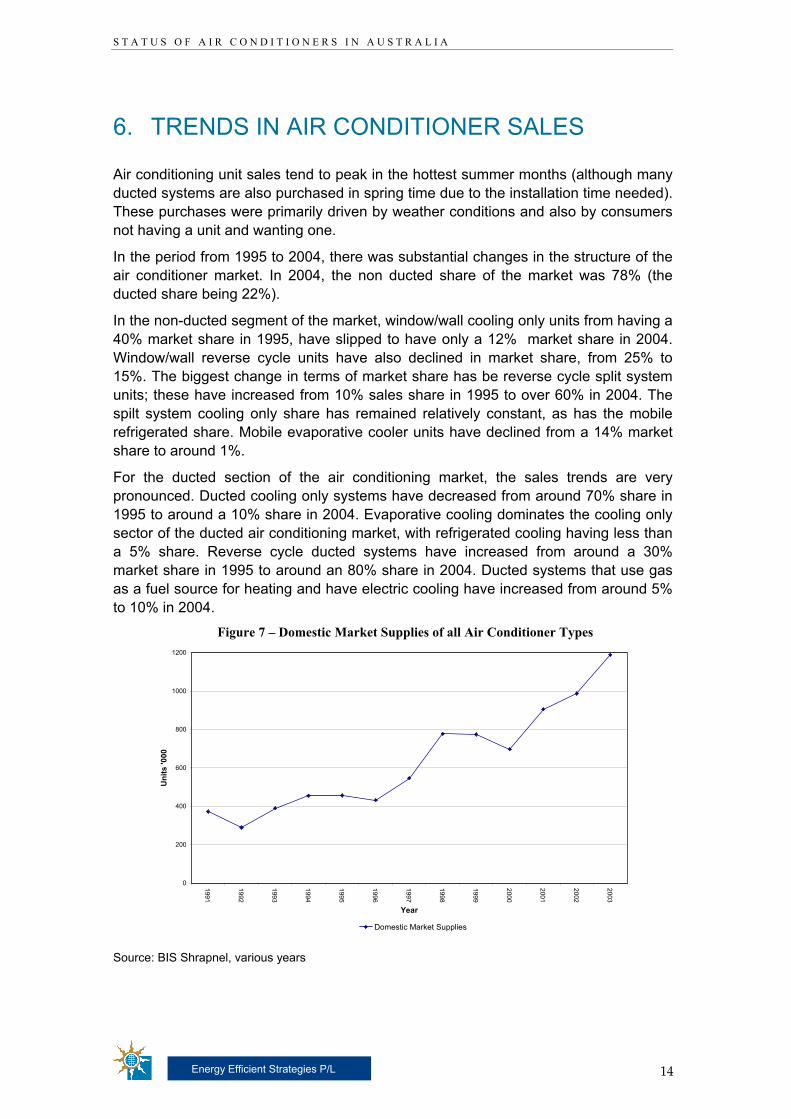
Air conditioning unit sales tend to peak in the hottest summer months (although many ducted systems are also purchased in spring time due to the installation time needed). These purchases were primarily driven by weather conditions and also by consumers not having a unit and wanting one.
In the period from 1995 to 2004, there was substantial changes in the structure of the air conditioner market. In 2004, the non ducted share of the market was 78% (the ducted share being 22%).
In the non-ducted segment of the market, window/wall cooling only units from having a 40% market share in 1995, have slipped to have only a 12% market share in 2004. Window/wall reverse cycle units have also declined in market share, from 25% to 15%. The biggest change in terms of market share has be reverse cycle split system units; these have increased from 10% sales share in 1995 to over 60% in 2004. The spilt system cooling only share has remained relatively constant, as has the mobile refrigerated share. Mobile evaporative cooler units have declined from a 14% market share to around 1%.
For the ducted section of the air conditioning market, the sales trends are very pronounced. Ducted cooling only systems have decreased from around 70% share in 1995 to around a 10% share in 2004. Evaporative cooling dominates the cooling only sector of the ducted air conditioning market, with refrigerated cooling having less than a 5% share. Reverse cycle ducted systems have increased from around a 30% market share in 1995 to around an 80% share in 2004. Ducted systems that use gas as a fuel source for heating and have electric cooling have increased from around 5% to 10% in 2004.
Figure 7 – Domestic Market Supplies of all Air Conditioner Types
0
200
400
600
800
1000
1200
1991
1992
1993
1994
1995
1996
1997
1998
1999
2000
2001
2002
2003
Year
Uni
ts '0
00
Domestic Market Supplies
Source: BIS Shrapnel, various years
S T A T U S O F A I R C O N D I T I O N E R S I N A U S T R A L I A
15
Energy Efficient Strategies P/L
7. ESTIMATED HOURS OF OPERATION
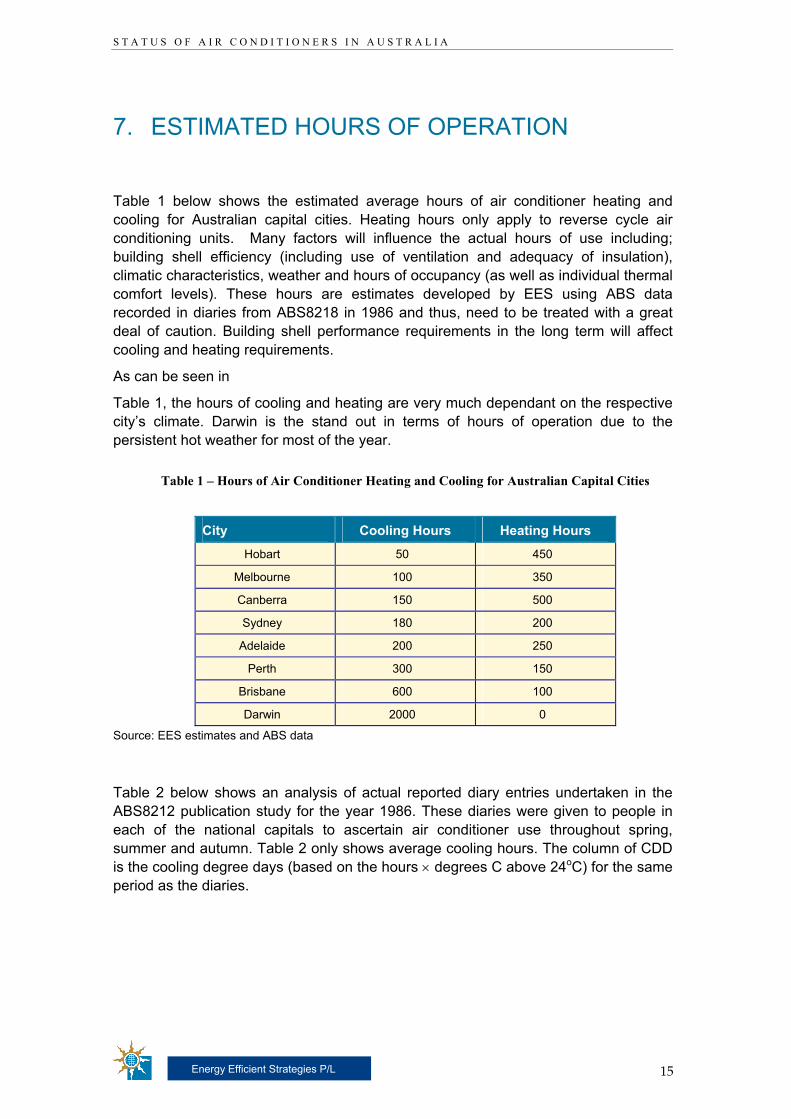
Table 1 below shows the estimated average hours of air conditioner heating and cooling for Australian capital cities. Heating hours only apply to reverse cycle air conditioning units. Many factors will influence the actual hours of use including; building shell efficiency (including use of ventilation and adequacy of insulation), climatic characteristics, weather and hours of occupancy (as well as individual thermal comfort levels). These hours are estimates developed by EES using ABS data recorded in diaries from ABS8218 in 1986 and thus, need to be treated with a great deal of caution. Building shell performance requirements in the long term will affect cooling and heating requirements.
As can be seen in
Table 1, the hours of cooling and heating are very much dependant on the respective city’s climate. Darwin is the stand out in terms of hours of operation due to the persistent hot weather for most of the year.
Table 1 – Hours of Air Conditioner Heating and Cooling for Australian Capital Cities
City Cooling Hours Heating Hours
Hobart 50 450
Melbourne 100 350
Canberra 150 500
Sydney 180 200
Adelaide 200 250
Perth 300 150
Brisbane 600 100
Darwin 2000 0
Source: EES estimates and ABS data
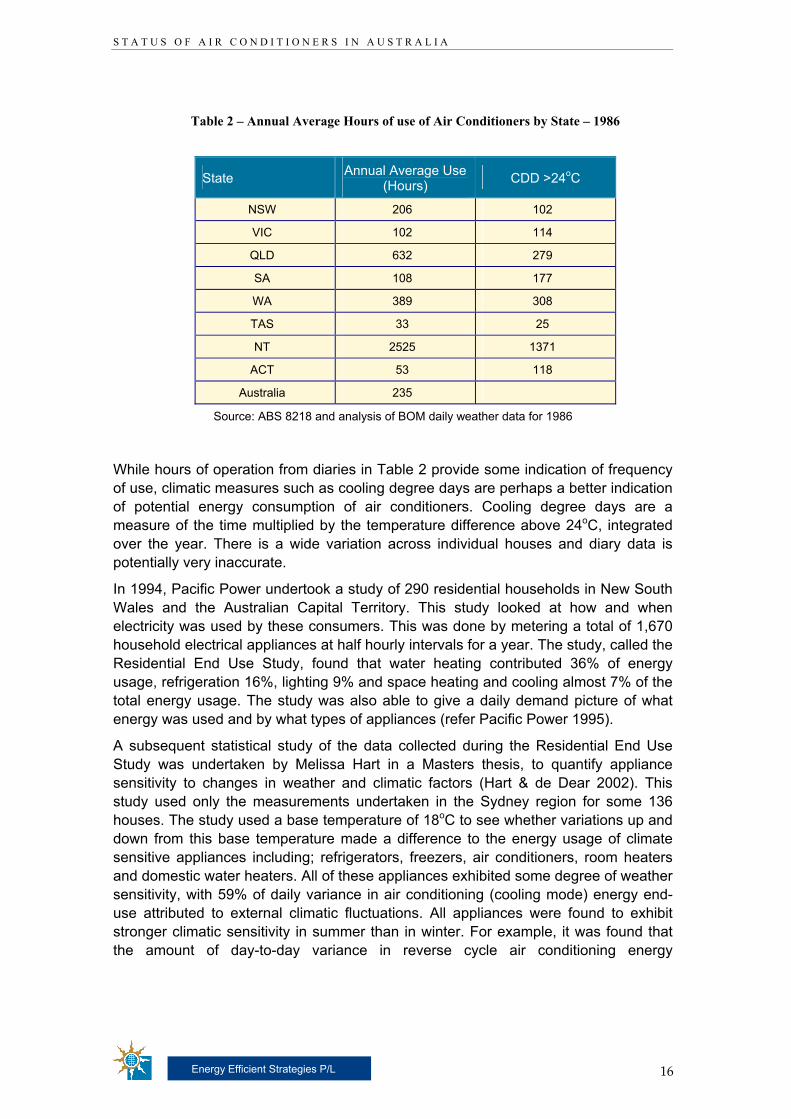
Table 2 below shows an analysis of actual reported diary entries undertaken in the ABS8212 publication study for the year 1986. These diaries were given to people in each of the national capitals to ascertain air conditioner use throughout spring, summer and autumn. Table 2 only shows average cooling hours. The column of CDD is the cooling degree days (based on the hours × degrees C above 24oC) for the same period as the diaries.
S T A T U S O F A I R C O N D I T I O N E R S I N A U S T R A L I A
16
Energy Efficient Strategies P/L
Table 2 – Annual Average Hours of use of Air Conditioners by State – 1986
State Annual Average Use (Hours) CDD >24oC
NSW 206 102
VIC 102 114
QLD 632 279
SA 108 177
WA 389 308
TAS 33 25
NT 2525 1371
ACT 53 118
Australia 235
Source: ABS 8218 and analysis of BOM daily weather data for 1986
While hours of operation from diaries in Table 2 provide some indication of frequency of use, climatic measures such as cooling degree days are perhaps a better indication of potential energy consumption of air conditioners. Cooling degree days are a measure of the time multiplied by the temperature difference above 24oC, integrated over the year. There is a wide variation across individual houses and diary data is potentially very inaccurate.
In 1994, Pacific Power undertook a study of 290 residential households in New South Wales and the Australian Capital Territory. This study looked at how and when electricity was used by these consumers. This was done by metering a total of 1,670 household electrical appliances at half hourly intervals for a year. The study, called the Residential End Use Study, found that water heating contributed 36% of energy usage, refrigeration 16%, lighting 9% and space heating and cooling almost 7% of the total energy usage. The study was also able to give a daily demand picture of what energy was used and by what types of appliances (refer Pacific Power 1995).
A subsequent statistical study of the data collected during the Residential End Use Study was undertaken by Melissa Hart in a Masters thesis, to quantify appliance sensitivity to changes in weather and climatic factors (Hart & de Dear 2002). This study used only the measurements undertaken in the Sydney region for some 136 houses. The study used a base temperature of 18oC to see whether variations up and down from this base temperature made a difference to the energy usage of climate sensitive appliances including; refrigerators, freezers, air conditioners, room heaters and domestic water heaters. All of these appliances exhibited some degree of weather sensitivity, with 59% of daily variance in air conditioning (cooling mode) energy end-use attributed to external climatic fluctuations. All appliances were found to exhibit stronger climatic sensitivity in summer than in winter. For example, it was found that the amount of day-to-day variance in reverse cycle air conditioning energy
S T A T U S O F A I R C O N D I T I O N E R S I N A U S T R A L I A
17
Energy Efficient Strategies P/L
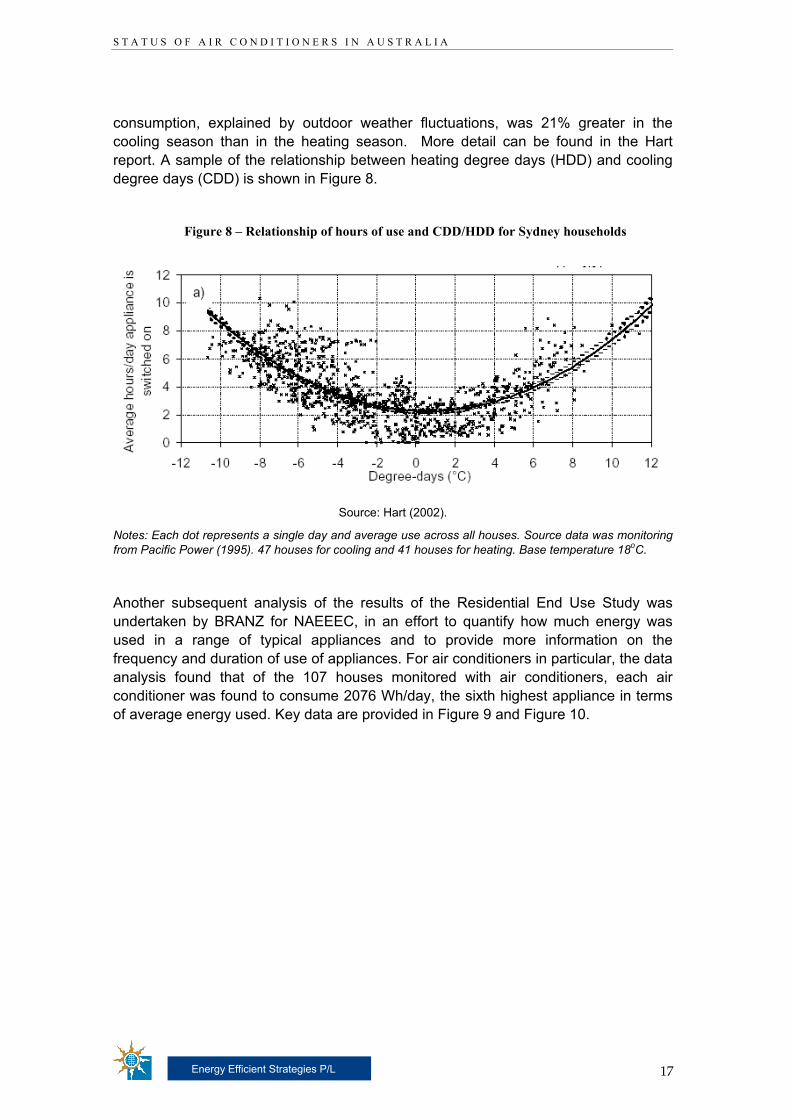
consumption, explained by outdoor weather fluctuations, was 21% greater in the cooling season than in the heating season. More detail can be found in the Hart report. A sample of the relationship between heating degree days (HDD) and cooling degree days (CDD) is shown in Figure 8.
Figure 8 – Relationship of hours of use and CDD/HDD for Sydney households
Source: Hart (2002).
Notes: Each dot represents a single day and average use across all houses. Source data was monitoring from Pacific Power (1995). 47 houses for cooling and 41 houses for heating. Base temperature 18oC.
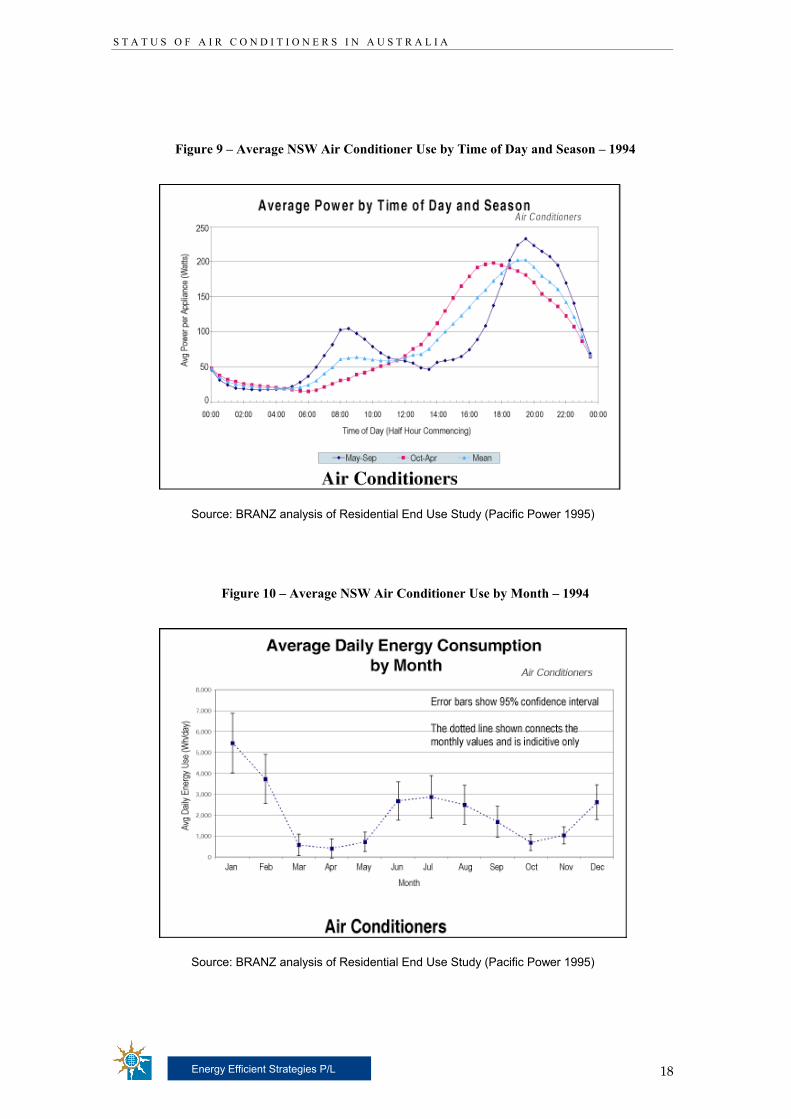
Another subsequent analysis of the results of the Residential End Use Study was undertaken by BRANZ for NAEEEC, in an effort to quantify how much energy was used in a range of typical appliances and to provide more information on the frequency and duration of use of appliances. For air conditioners in particular, the data analysis found that of the 107 houses monitored with air conditioners, each air conditioner was found to consume 2076 Wh/day, the sixth highest appliance in terms of average energy used. Key data are provided in Figure 9 and Figure 10.
S T A T U S O F A I R C O N D I T I O N E R S I N A U S T R A L I A
18
Energy Efficient Strategies P/L
Figure 9 – Average NSW Air Conditioner Use by Time of Day and Season – 1994
Source: BRANZ analysis of Residential End Use Study (Pacific Power 1995)
Figure 10 – Average NSW Air Conditioner Use by Month – 1994
Source: BRANZ analysis of Residential End Use Study (Pacific Power 1995)
S T A T U S O F A I R C O N D I T I O N E R S I N A U S T R A L I A
19
Energy Efficient Strategies P/L
The 1994 Residential End Use Study and the subsequent analysis studies, allowed a picture to be painted of the air conditioner hours of operation and factors that influence energy usage. These studies, although over ten years old, can still give an impression of what air conditioner hours of operation is likely to be today. It must be noted though, that due to the large increase in air conditioner ownership since the 1994 study, energy usage will have increased somewhat.
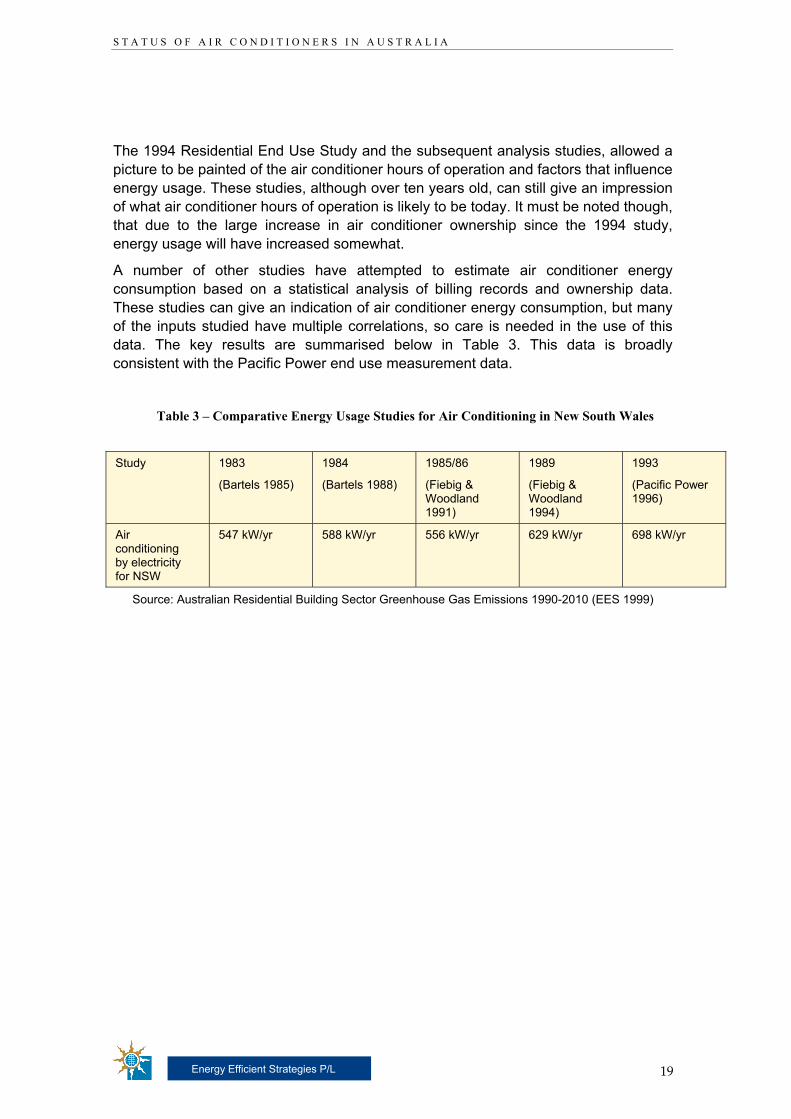
A number of other studies have attempted to estimate air conditioner energy consumption based on a statistical analysis of billing records and ownership data. These studies can give an indication of air conditioner energy consumption, but many of the inputs studied have multiple correlations, so care is needed in the use of this data. The key results are summarised below in Table 3. This data is broadly consistent with the Pacific Power end use measurement data.
Table 3 – Comparative Energy Usage Studies for Air Conditioning in New South Wales
Study 1983
(Bartels 1985)
1984
(Bartels 1988)
1985/86
(Fiebig & Woodland 1991)
1989
(Fiebig & Woodland 1994)
1993
(Pacific Power 1996)
Air conditioning by electricity for NSW
547 kW/yr 588 kW/yr 556 kW/yr 629 kW/yr 698 kW/yr
Source: Australian Residential Building Sector Greenhouse Gas Emissions 1990-2010 (EES 1999)
S T A T U S O F A I R C O N D I T I O N E R S I N A U S T R A L I A
20
Energy Efficient Strategies P/L
8. TRENDS FOR NEW AIR CONDITIONERS
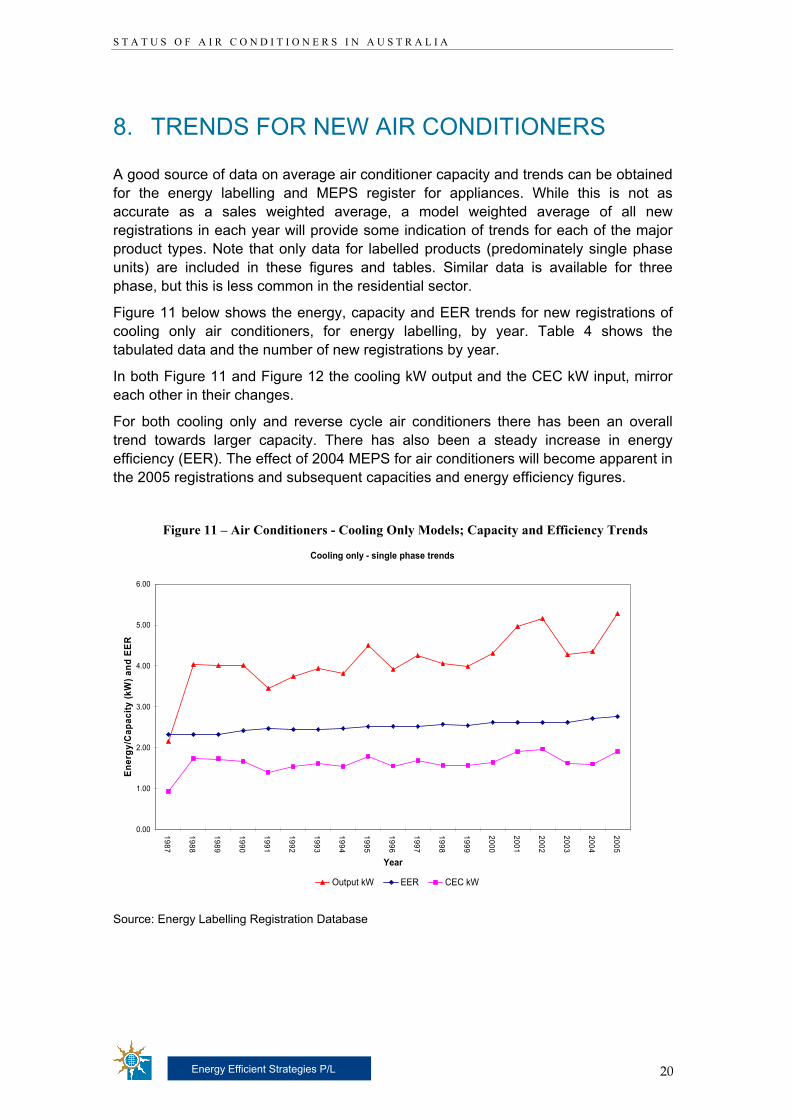
A good source of data on average air conditioner capacity and trends can be obtained for the energy labelling and MEPS register for appliances. While this is not as accurate as a sales weighted average, a model weighted average of all new registrations in each year will provide some indication of trends for each of the major product types. Note that only data for labelled products (predominately single phase units) are included in these figures and tables. Similar data is available for three phase, but this is less common in the residential sector.
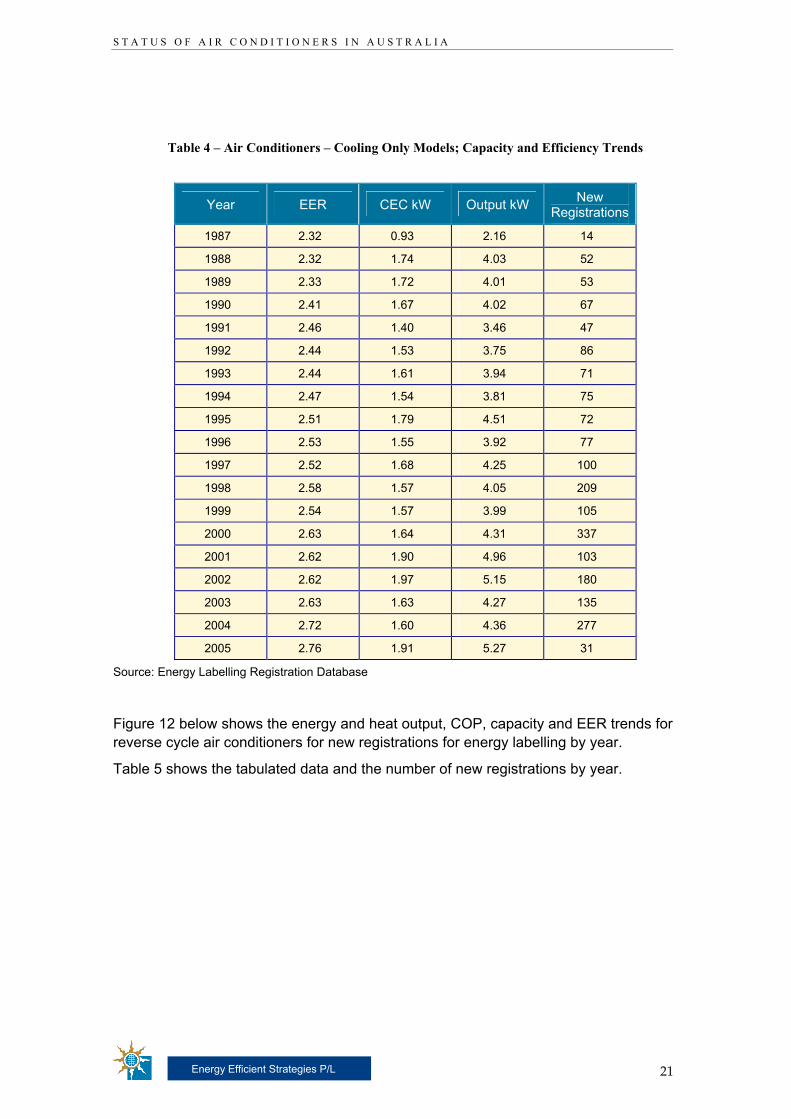
Figure 11 below shows the energy, capacity and EER trends for new registrations of cooling only air conditioners, for energy labelling, by year. Table 4 shows the tabulated data and the number of new registrations by year.
In both Figure 11 and Figure 12 the cooling kW output and the CEC kW input, mirror each other in their changes.
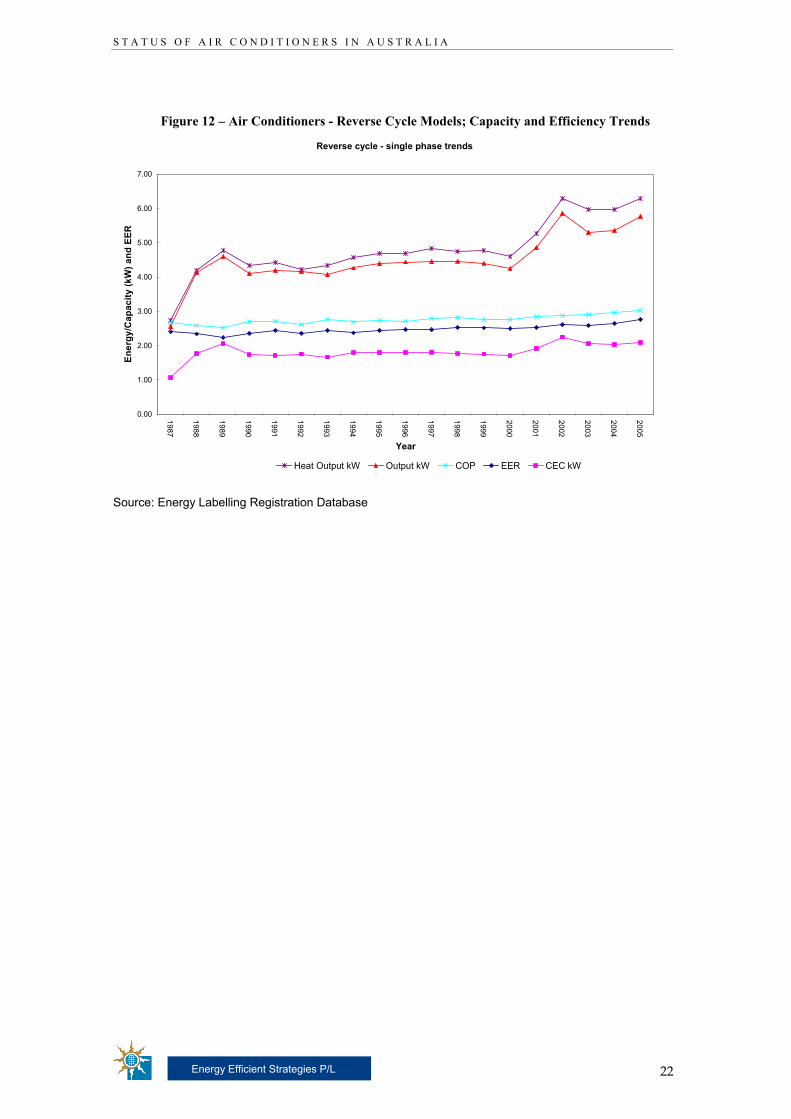
For both cooling only and reverse cycle air conditioners there has been an overall trend towards larger capacity. There has also been a steady increase in energy efficiency (EER). The effect of 2004 MEPS for air conditioners will become apparent in the 2005 registrations and subsequent capacities and energy efficiency figures.
Figure 11 – Air Conditioners - Cooling Only Models; Capacity and Efficiency Trends
Cooling only - single phase trends
0.00
1.00
2.00
3.00
4.00
5.00
6.00
1987
1988
1989
1990
1991
1992
1993
1994
1995
1996
1997
1998
1999
2000
2001
2002
2003
2004
2005
Year
Ener
gy/C
apac
ity (k
W) a
nd E
ER
Output kW EER CEC kW
Source: Energy Labelling Registration Database
S T A T U S O F A I R C O N D I T I O N E R S I N A U S T R A L I A
21
Energy Efficient Strategies P/L
Table 4 – Air Conditioners – Cooling Only Models; Capacity and Efficiency Trends
Year EER CEC kW Output kW New Registrations
1987 2.32 0.93 2.16 14
1988 2.32 1.74 4.03 52
1989 2.33 1.72 4.01 53
1990 2.41 1.67 4.02 67
1991 2.46 1.40 3.46 47
1992 2.44 1.53 3.75 86
1993 2.44 1.61 3.94 71
1994 2.47 1.54 3.81 75
1995 2.51 1.79 4.51 72
1996 2.53 1.55 3.92 77
1997 2.52 1.68 4.25 100
1998 2.58 1.57 4.05 209
1999 2.54 1.57 3.99 105
2000 2.63 1.64 4.31 337
2001 2.62 1.90 4.96 103
2002 2.62 1.97 5.15 180
2003 2.63 1.63 4.27 135
2004 2.72 1.60 4.36 277
2005 2.76 1.91 5.27 31
Source: Energy Labelling Registration Database
Figure 12 below shows the energy and heat output, COP, capacity and EER trends for reverse cycle air conditioners for new registrations for energy labelling by year.
Table 5 shows the tabulated data and the number of new registrations by year.
S T A T U S O F A I R C O N D I T I O N E R S I N A U S T R A L I A
22
Energy Efficient Strategies P/L
Figure 12 – Air Conditioners - Reverse Cycle Models; Capacity and Efficiency Trends
Reverse cycle - single phase trends
0.00
1.00
2.00
3.00
4.00
5.00
6.00
7.00
1987
1988
1989
1990
1991
1992
1993
1994
1995
1996
1997
1998
1999
2000
2001
2002
2003
2004
2005
Year
Ener
gy/C
apac
ity (k
W) a
nd E
ER
Heat Output kW Output kW COP EER CEC kW
Source: Energy Labelling Registration Database
S T A T U S O F A I R C O N D I T I O N E R S I N A U S T R A L I A
23
Energy Efficient Strategies P/L
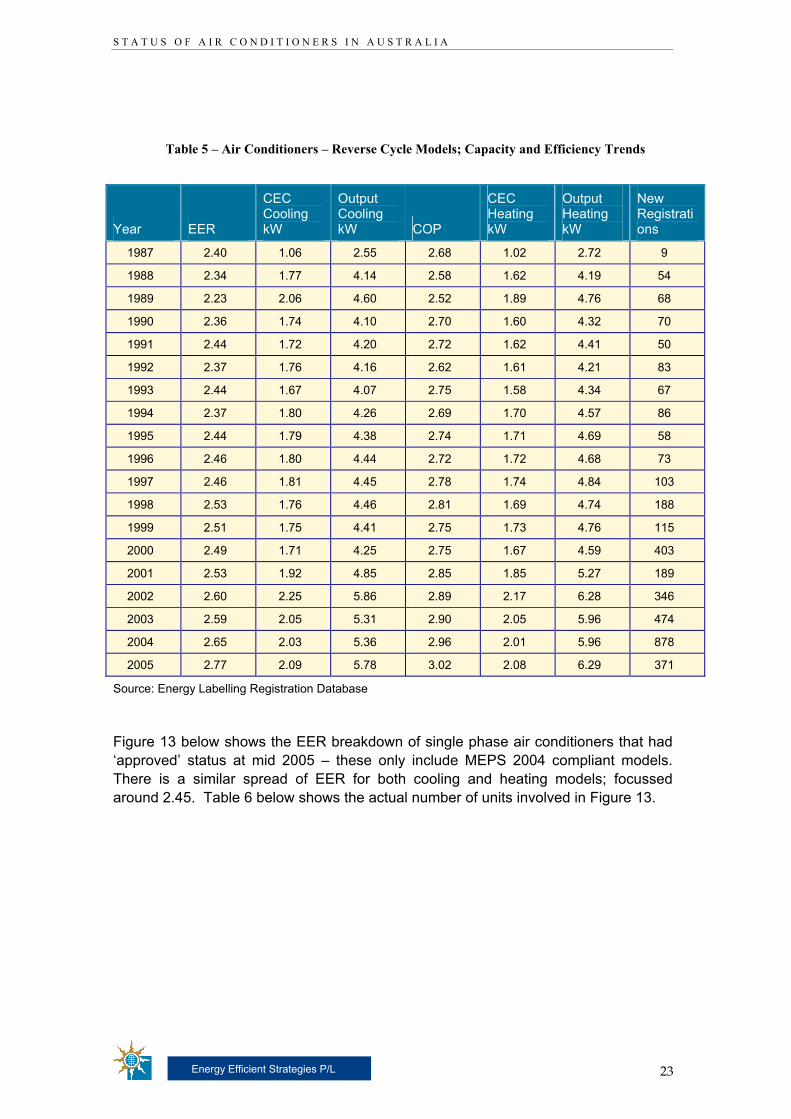
Table 5 – Air Conditioners – Reverse Cycle Models; Capacity and Efficiency Trends
Year EER
CEC Cooling kW
Output Cooling kW COP
CEC Heating kW
Output Heating kW
New Registrations
1987 2.40 1.06 2.55 2.68 1.02 2.72 9
1988 2.34 1.77 4.14 2.58 1.62 4.19 54
1989 2.23 2.06 4.60 2.52 1.89 4.76 68
1990 2.36 1.74 4.10 2.70 1.60 4.32 70
1991 2.44 1.72 4.20 2.72 1.62 4.41 50
1992 2.37 1.76 4.16 2.62 1.61 4.21 83
1993 2.44 1.67 4.07 2.75 1.58 4.34 67
1994 2.37 1.80 4.26 2.69 1.70 4.57 86
1995 2.44 1.79 4.38 2.74 1.71 4.69 58
1996 2.46 1.80 4.44 2.72 1.72 4.68 73
1997 2.46 1.81 4.45 2.78 1.74 4.84 103
1998 2.53 1.76 4.46 2.81 1.69 4.74 188
1999 2.51 1.75 4.41 2.75 1.73 4.76 115
2000 2.49 1.71 4.25 2.75 1.67 4.59 403
2001 2.53 1.92 4.85 2.85 1.85 5.27 189
2002 2.60 2.25 5.86 2.89 2.17 6.28 346
2003 2.59 2.05 5.31 2.90 2.05 5.96 474
2004 2.65 2.03 5.36 2.96 2.01 5.96 878
2005 2.77 2.09 5.78 3.02 2.08 6.29 371
Source: Energy Labelling Registration Database
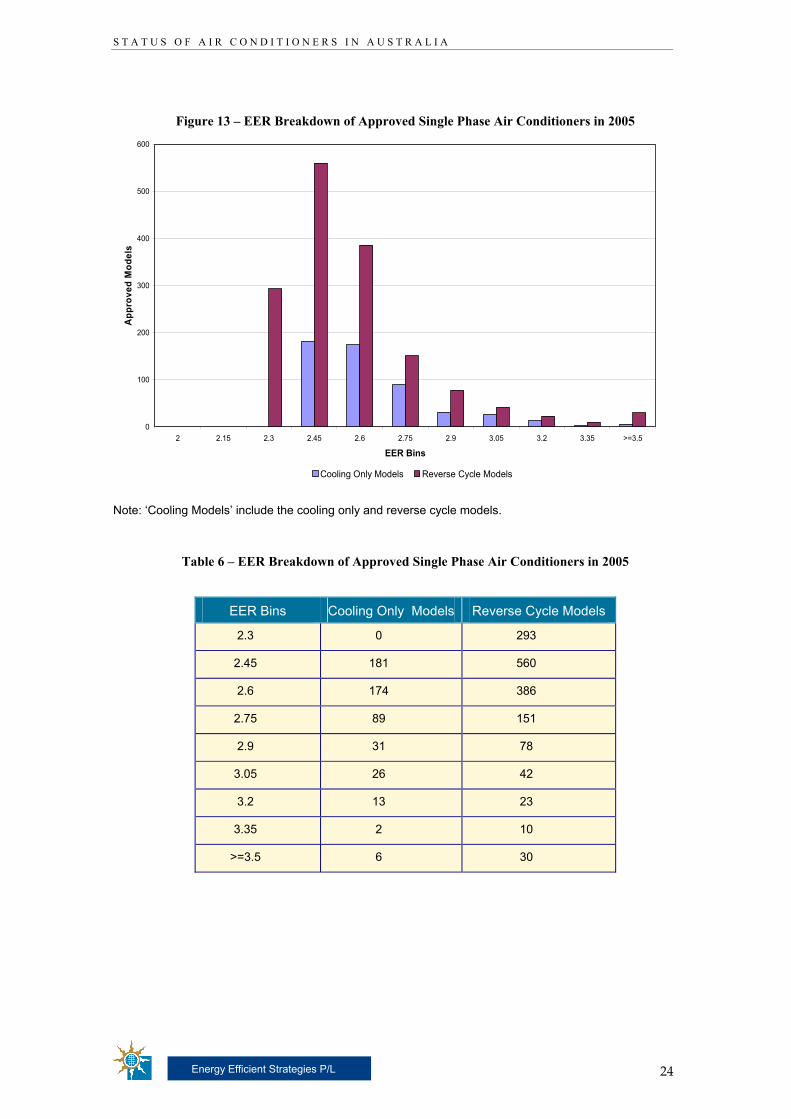
Figure 13 below shows the EER breakdown of single phase air conditioners that had ‘approved’ status at mid 2005 – these only include MEPS 2004 compliant models. There is a similar spread of EER for both cooling and heating models; focussed around 2.45. Table 6 below shows the actual number of units involved in Figure 13.
S T A T U S O F A I R C O N D I T I O N E R S I N A U S T R A L I A
24
Energy Efficient Strategies P/L
Figure 13 – EER Breakdown of Approved Single Phase Air Conditioners in 2005
0
100
200
300
400
500
600
2 2.15 2.3 2.45 2.6 2.75 2.9 3.05 3.2 3.35 >=3.5
EER Bins
App
rove
d M
odel
s
Cooling Only Models Reverse Cycle Models
Note: ‘Cooling Models’ include the cooling only and reverse cycle models.
Table 6 – EER Breakdown of Approved Single Phase Air Conditioners in 2005
EER Bins Cooling Only Models Reverse Cycle Models
2.3 0 293
2.45 181 560
2.6 174 386
2.75 89 151
2.9 31 78
3.05 26 42
3.2 13 23
3.35 2 10
>=3.5 6 30
S T A T U S O F A I R C O N D I T I O N E R S I N A U S T R A L I A
25
Energy Efficient Strategies P/L
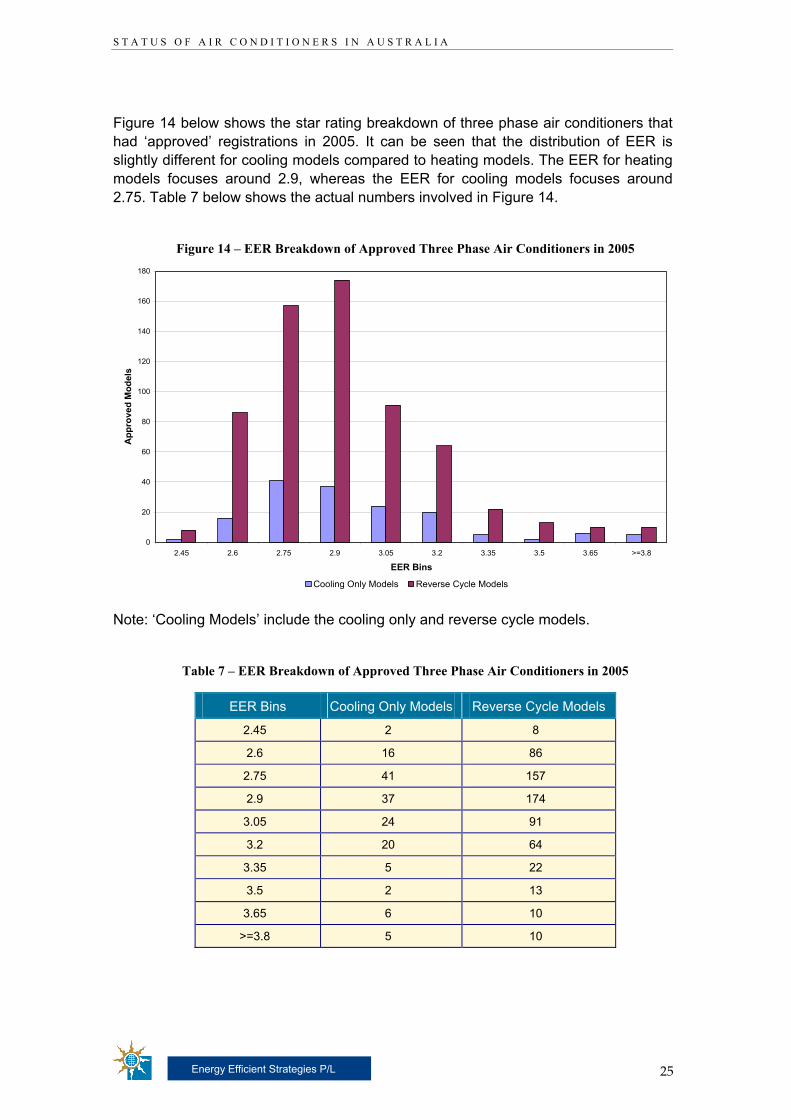
Figure 14 below shows the star rating breakdown of three phase air conditioners that had ‘approved’ registrations in 2005. It can be seen that the distribution of EER is slightly different for cooling models compared to heating models. The EER for heating models focuses around 2.9, whereas the EER for cooling models focuses around 2.75. Table 7 below shows the actual numbers involved in Figure 14.
Figure 14 – EER Breakdown of Approved Three Phase Air Conditioners in 2005
0
20
40
60
80
100
120
140
160
180
2.45 2.6 2.75 2.9 3.05 3.2 3.35 3.5 3.65 >=3.8
EER Bins
App
rove
d M
odel
s
Cooling Only Models Reverse Cycle Models
Note: ‘Cooling Models’ include the cooling only and reverse cycle models.
Table 7 – EER Breakdown of Approved Three Phase Air Conditioners in 2005
EER Bins Cooling Only Models Reverse Cycle Models
2.45 2 8
2.6 16 86
2.75 41 157
2.9 37 174
3.05 24 91
3.2 20 64
3.35 5 22
3.5 2 13
3.65 6 10
>=3.8 5 10
S T A T U S O F A I R C O N D I T I O N E R S I N A U S T R A L I A
26
Energy Efficient Strategies P/L
8.1 Current and Future MEPS Levels
The adoption of MEPS required both cooling only and reverse cycle three phase air conditioners (including ducted and non-ducted models) to be registered for MEPS in October 2001. New MEPS levels for three phase air conditioners will come into effect in October 2007, models will need to be redesigned to meet these levels or taken out of the marketplace. MEPS for single phase air conditioners was introduced in October 2004. New MEPS levels for all reverse cycle and cooling only non-ducted split and unitary systems less than 7.5kW, will come into effect in April 2006. All single phase air conditioners (including those models that needed to satisfy 2006 MEPS) will also need to satisfy new MEPS levels in October 2007 and then satisfy new MEPS levels in October 2008 (with the exception of ducted, cooling only and reverse cycle systems, and all systems greater than or equal to 10 kW).
The exact MEPS levels by air conditioner type are set out in AS/NZS3823.2 and also on www.energyrating.gov.au.
If the MEPS timetable to October 2008 was implemented, 2018 would see reductions in energy use and emissions of 5.9% of the current BAU scenario (ie current MEPS 2001 and 2004 MEPS levels for three phase and single phase air conditioners respectively). Annual energy savings in 2018 are projected to be 782 GWh per year with emissions down by about 0.61 Mt CO2 per year; for total savings of 7,970 GWh and 6.2 Mt CO2. The proposed MEPS timetable has a possible net benefit of $174 million at a discount rate of 6.3%, giving an overall benefit cost ratio of 1.9. Note that this is a net benefit and that benefits of the proposed timetable vary according to air conditioner type. More details can be found in the Regulatory Impact Statement (Syneca Consulting 2005b).
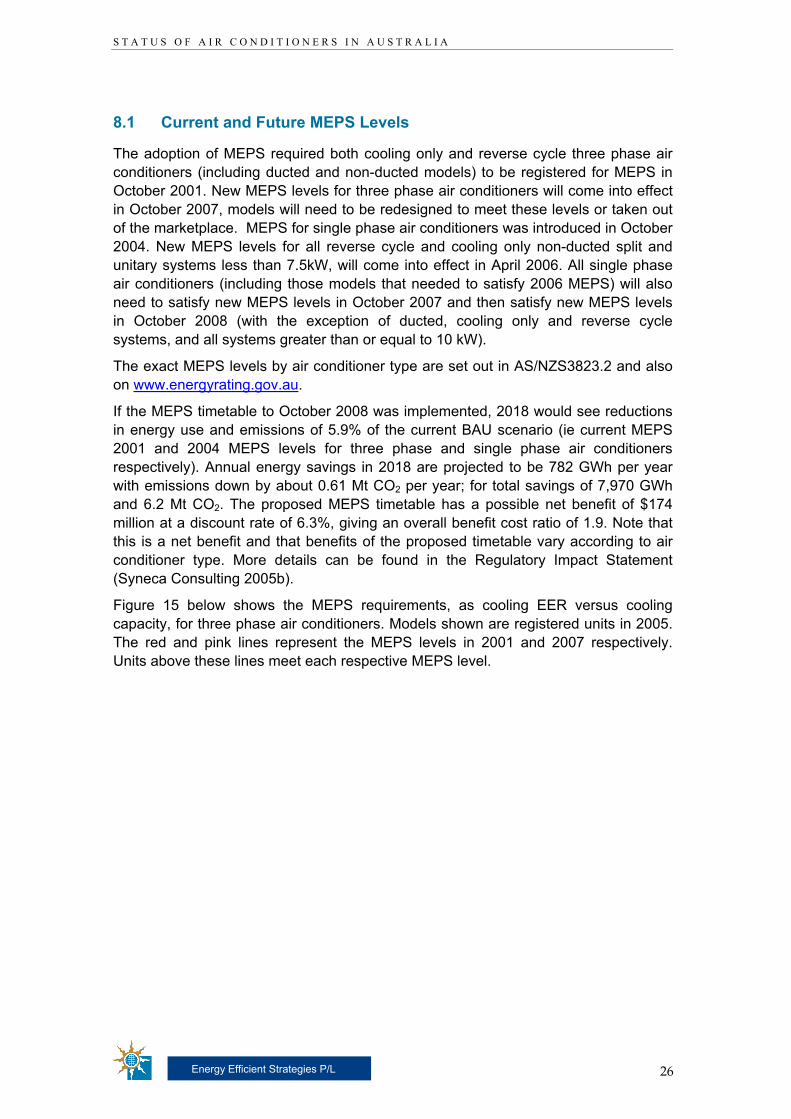
Figure 15 below shows the MEPS requirements, as cooling EER versus cooling capacity, for three phase air conditioners. Models shown are registered units in 2005. The red and pink lines represent the MEPS levels in 2001 and 2007 respectively. Units above these lines meet each respective MEPS level.
S T A T U S O F A I R C O N D I T I O N E R S I N A U S T R A L I A
27
Energy Efficient Strategies P/L
Figure 15 – MEPS for 3-Phase Air Conditioners
Current air conditioner models: Three Phase; Type; All, Registered for all records, Configuration; All types
2.0
2.5
3.0
3.5
4.0
4.5
0 10 20 30 40 50 60
Cooling Capacity kW
Coo
ling
EER
W/W
Models
MEPS 2001
MEPS 2007
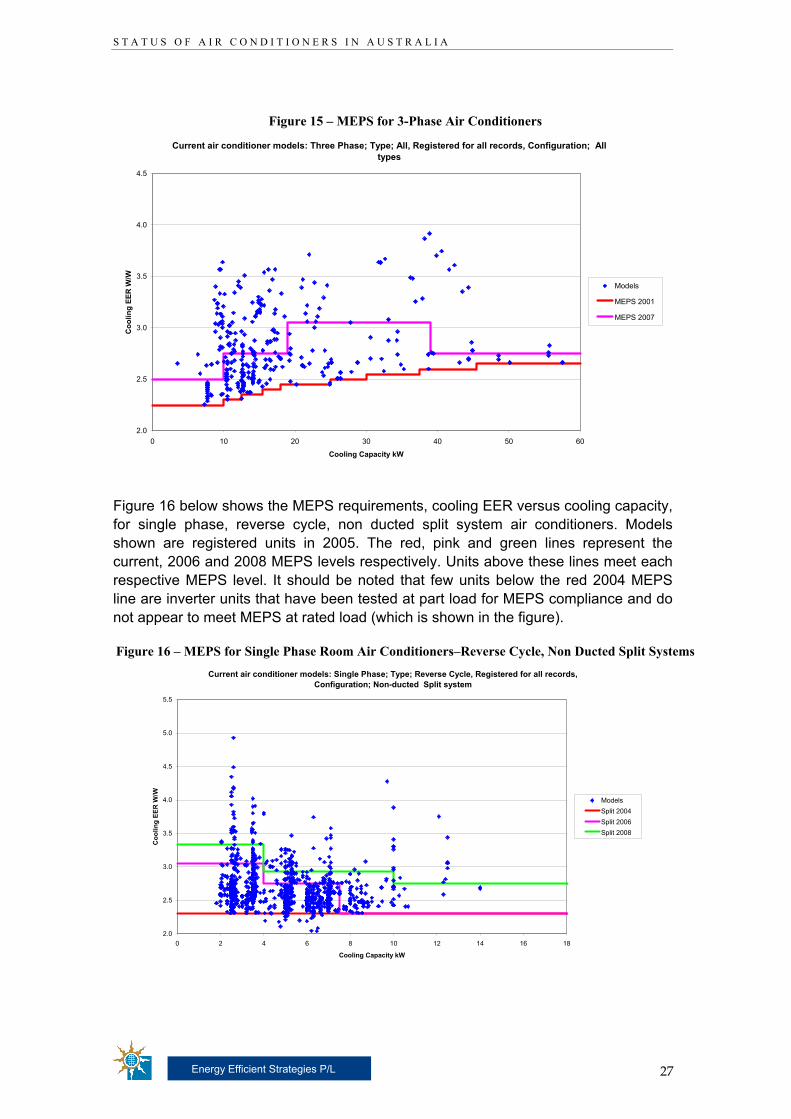
Figure 16 below shows the MEPS requirements, cooling EER versus cooling capacity, for single phase, reverse cycle, non ducted split system air conditioners. Models shown are registered units in 2005. The red, pink and green lines represent the current, 2006 and 2008 MEPS levels respectively. Units above these lines meet each respective MEPS level. It should be noted that few units below the red 2004 MEPS line are inverter units that have been tested at part load for MEPS compliance and do not appear to meet MEPS at rated load (which is shown in the figure).
Figure 16 – MEPS for Single Phase Room Air Conditioners–Reverse Cycle, Non Ducted Split Systems Current air conditioner models: Single Phase; Type; Reverse Cycle, Registered for all records,
Configuration; Non-ducted Split system
2.0
2.5
3.0
3.5
4.0
4.5
5.0
5.5
0 2 4 6 8 10 12 14 16 18
Cooling Capacity kW
Coo
ling
EER
W/W
ModelsSplit 2004Split 2006Split 2008
S T A T U S O F A I R C O N D I T I O N E R S I N A U S T R A L I A
28
Energy Efficient Strategies P/L
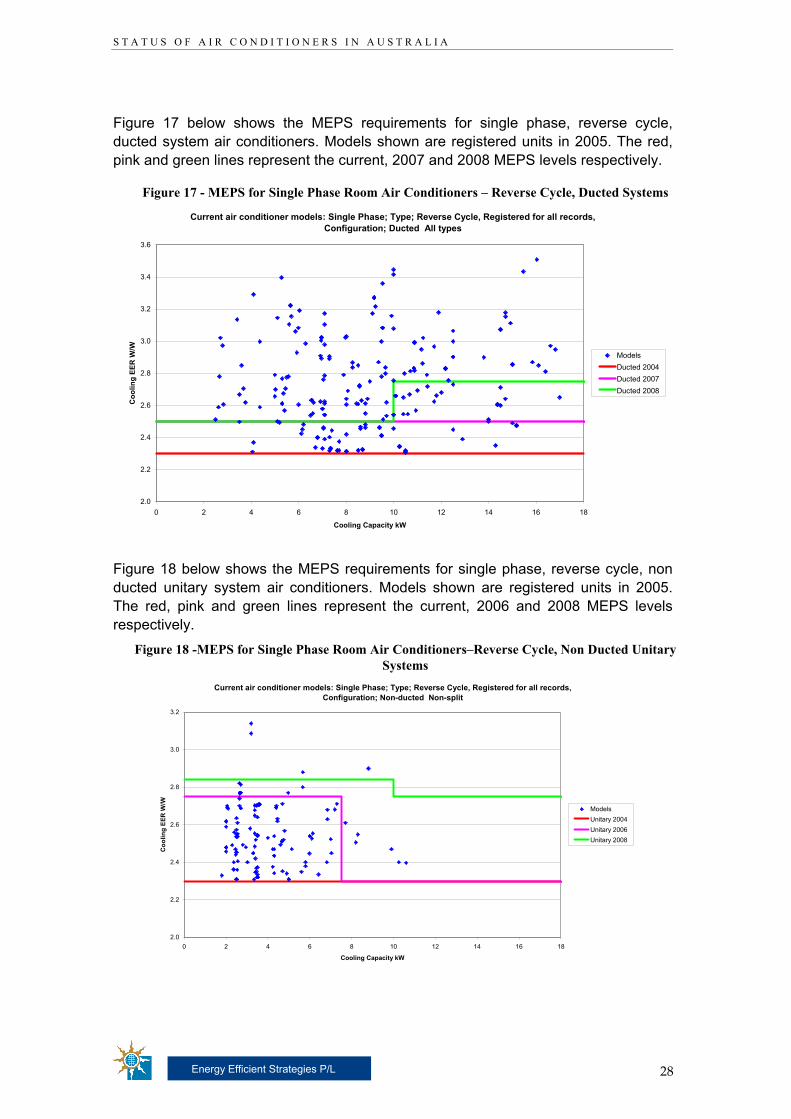
Figure 17 below shows the MEPS requirements for single phase, reverse cycle, ducted system air conditioners. Models shown are registered units in 2005. The red, pink and green lines represent the current, 2007 and 2008 MEPS levels respectively.
Figure 17 - MEPS for Single Phase Room Air Conditioners – Reverse Cycle, Ducted Systems
Current air conditioner models: Single Phase; Type; Reverse Cycle, Registered for all records, Configuration; Ducted All types
2.0
2.2
2.4
2.6
2.8
3.0
3.2
3.4
3.6
0 2 4 6 8 10 12 14 16 18
Cooling Capacity kW
Coo
ling
EER
W/W
ModelsDucted 2004Ducted 2007Ducted 2008
Figure 18 below shows the MEPS requirements for single phase, reverse cycle, non ducted unitary system air conditioners. Models shown are registered units in 2005. The red, pink and green lines represent the current, 2006 and 2008 MEPS levels respectively.
Figure 18 -MEPS for Single Phase Room Air Conditioners–Reverse Cycle, Non Ducted Unitary Systems
Current air conditioner models: Single Phase; Type; Reverse Cycle, Registered for all records, Configuration; Non-ducted Non-split
2.0
2.2
2.4
2.6
2.8
3.0
3.2
0 2 4 6 8 10 12 14 16 18
Cooling Capacity kW
Coo
ling
EER
W/W
ModelsUnitary 2004Unitary 2006Unitary 2008
S T A T U S O F A I R C O N D I T I O N E R S I N A U S T R A L I A
29
Energy Efficient Strategies P/L
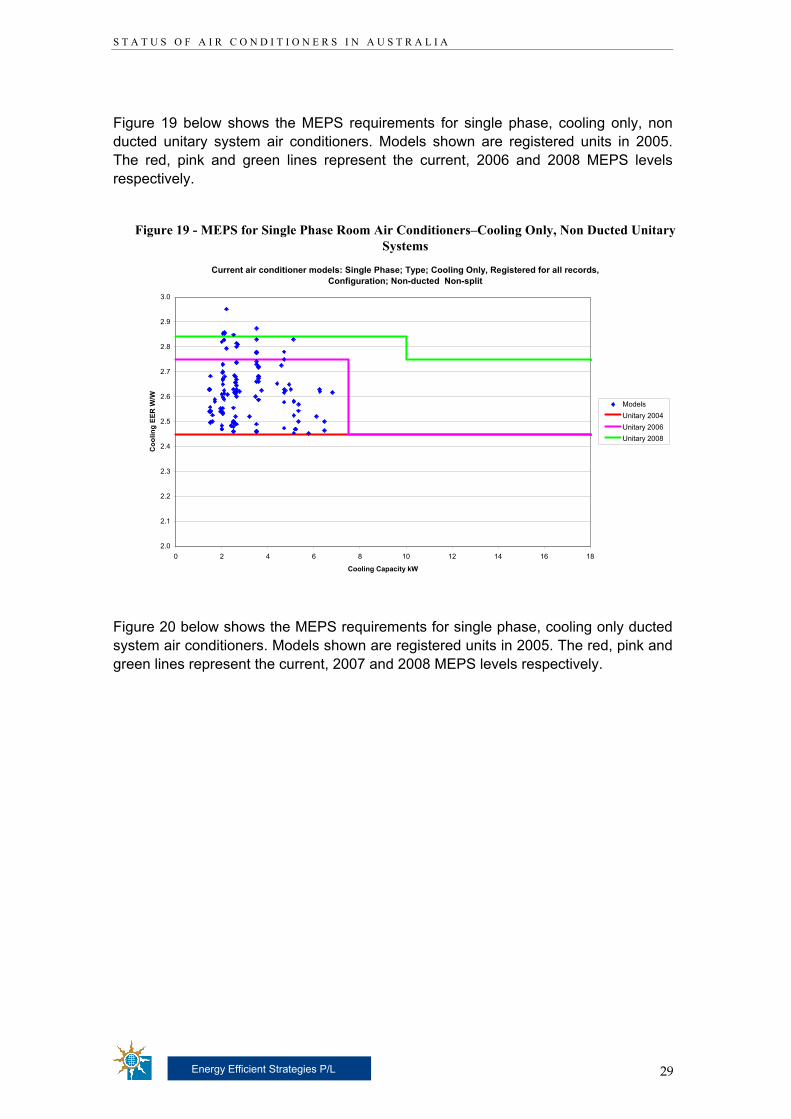
Figure 19 below shows the MEPS requirements for single phase, cooling only, non ducted unitary system air conditioners. Models shown are registered units in 2005. The red, pink and green lines represent the current, 2006 and 2008 MEPS levels respectively.
Figure 19 - MEPS for Single Phase Room Air Conditioners–Cooling Only, Non Ducted Unitary
Systems
Current air conditioner models: Single Phase; Type; Cooling Only, Registered for all records, Configuration; Non-ducted Non-split
2.0
2.1
2.2
2.3
2.4
2.5
2.6
2.7
2.8
2.9
3.0
0 2 4 6 8 10 12 14 16 18
Cooling Capacity kW
Coo
ling
EER
W/W
ModelsUnitary 2004Unitary 2006Unitary 2008
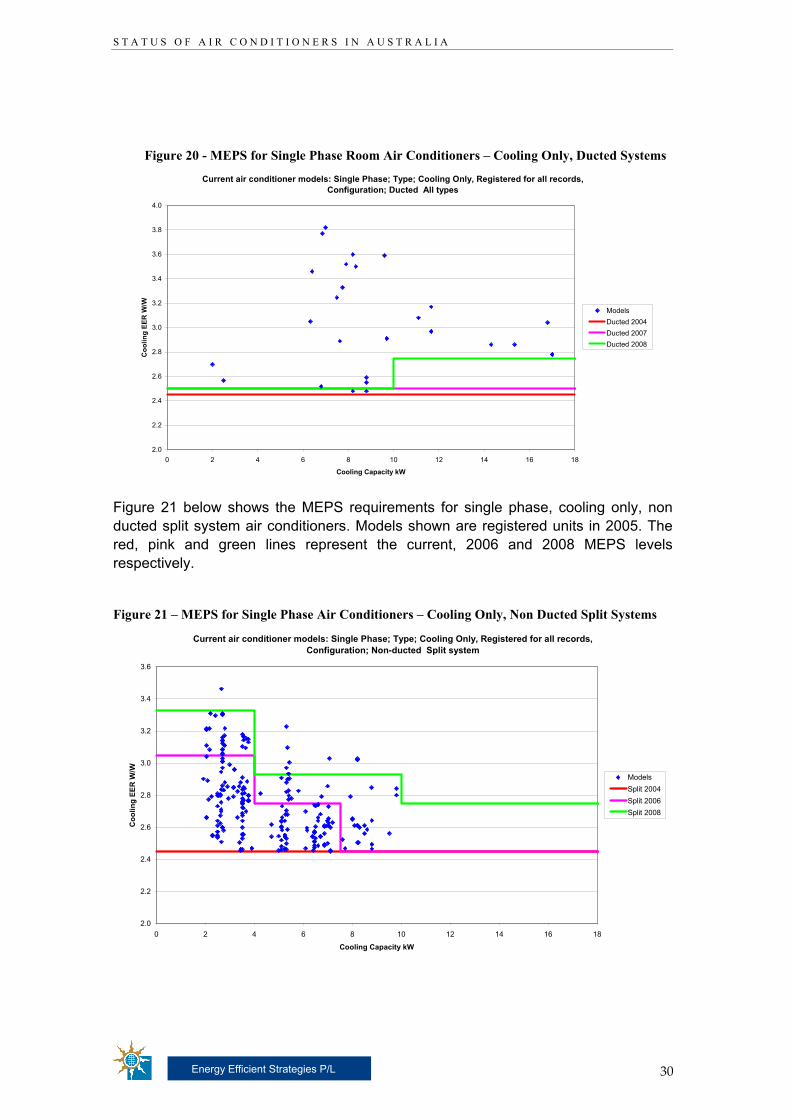
Figure 20 below shows the MEPS requirements for single phase, cooling only ducted system air conditioners. Models shown are registered units in 2005. The red, pink and green lines represent the current, 2007 and 2008 MEPS levels respectively.
S T A T U S O F A I R C O N D I T I O N E R S I N A U S T R A L I A
30
Energy Efficient Strategies P/L
Figure 20 - MEPS for Single Phase Room Air Conditioners – Cooling Only, Ducted Systems
Current air conditioner models: Single Phase; Type; Cooling Only, Registered for all records, Configuration; Ducted All types
2.0
2.2
2.4
2.6
2.8
3.0
3.2
3.4
3.6
3.8
4.0
0 2 4 6 8 10 12 14 16 18
Cooling Capacity kW
Coo
ling
EER
W/W
ModelsDucted 2004Ducted 2007Ducted 2008
Figure 21 below shows the MEPS requirements for single phase, cooling only, non ducted split system air conditioners. Models shown are registered units in 2005. The red, pink and green lines represent the current, 2006 and 2008 MEPS levels respectively.
Figure 21 – MEPS for Single Phase Air Conditioners – Cooling Only, Non Ducted Split Systems
Current air conditioner models: Single Phase; Type; Cooling Only, Registered for all records, Configuration; Non-ducted Split system
2.0
2.2
2.4
2.6
2.8
3.0
3.2
3.4
3.6
0 2 4 6 8 10 12 14 16 18
Cooling Capacity kW
Coo
ling
EER
W/W
ModelsSplit 2004Split 2006Split 2008
S T A T U S O F A I R C O N D I T I O N E R S I N A U S T R A L I A
31
Energy Efficient Strategies P/L
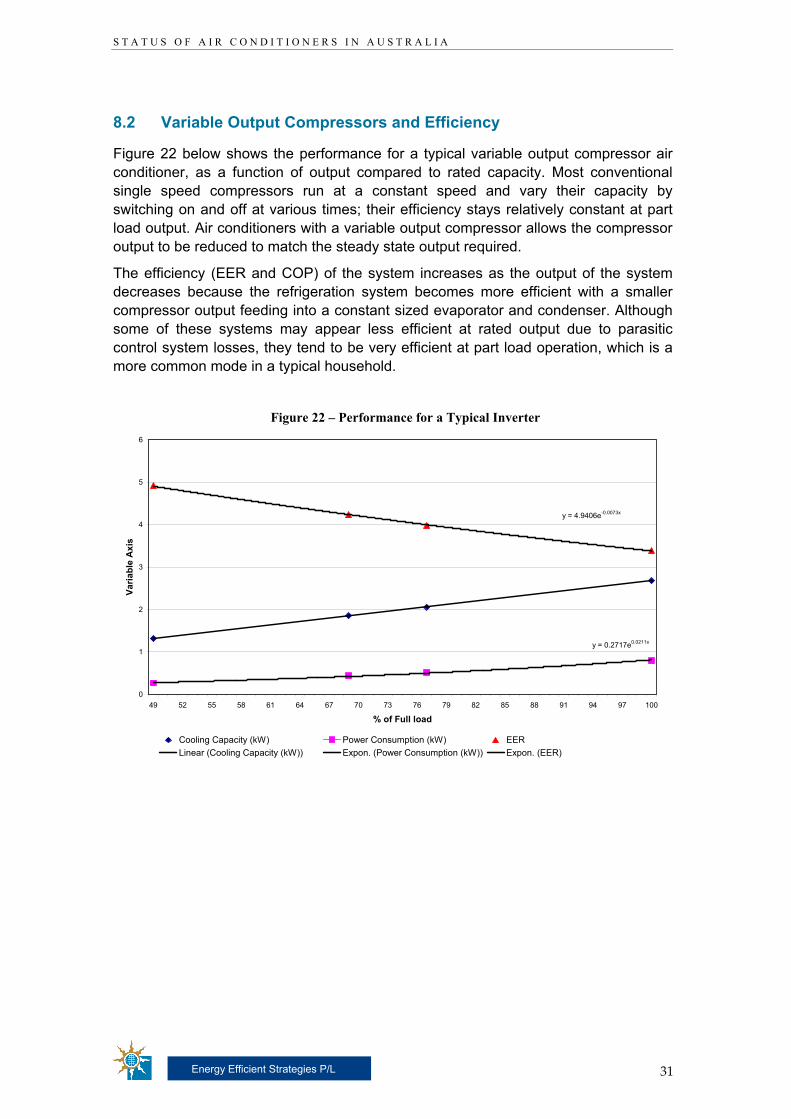
8.2 Variable Output Compressors and Efficiency
Figure 22 below shows the performance for a typical variable output compressor air conditioner, as a function of output compared to rated capacity. Most conventional single speed compressors run at a constant speed and vary their capacity by switching on and off at various times; their efficiency stays relatively constant at part load output. Air conditioners with a variable output compressor allows the compressor output to be reduced to match the steady state output required.
The efficiency (EER and COP) of the system increases as the output of the system decreases because the refrigeration system becomes more efficient with a smaller compressor output feeding into a constant sized evaporator and condenser. Although some of these systems may appear less efficient at rated output due to parasitic control system losses, they tend to be very efficient at part load operation, which is a more common mode in a typical household.
Figure 22 – Performance for a Typical Inverter
y = 0.2717e0.0211x
y = 4.9406e-0.0073x
0
1
2
3
4
5
6
49 52 55 58 61 64 67 70 73 76 79 82 85 88 91 94 97 100
% of Full load
Varia
ble
Axi
s
Cooling Capacity (kW) Power Consumption (kW) EERLinear (Cooling Capacity (kW)) Expon. (Power Consumption (kW)) Expon. (EER)
S T A T U S O F A I R C O N D I T I O N E R S I N A U S T R A L I A
32
Energy Efficient Strategies P/L
9. ESTIMATED ENERGY CONSUMPTION OF AIR CONDITIONERS IN AUSTRALIA
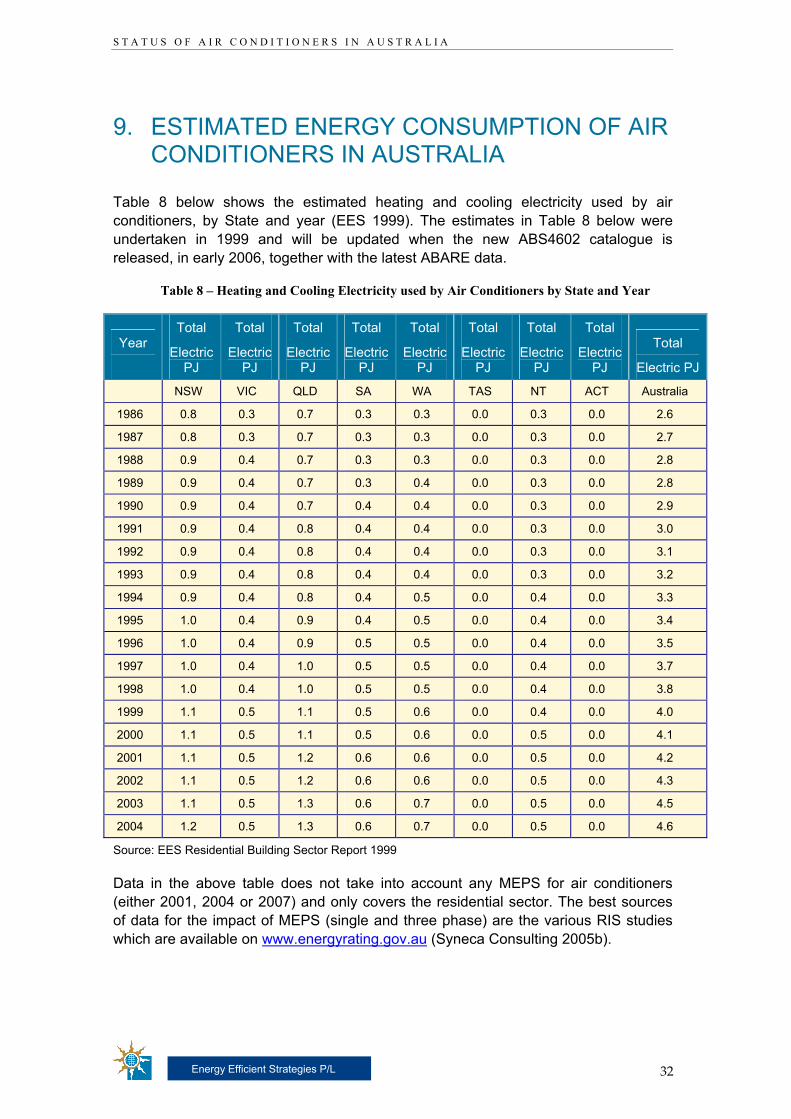
Table 8 below shows the estimated heating and cooling electricity used by air conditioners, by State and year (EES 1999). The estimates in Table 8 below were undertaken in 1999 and will be updated when the new ABS4602 catalogue is released, in early 2006, together with the latest ABARE data.
Table 8 – Heating and Cooling Electricity used by Air Conditioners by State and Year
Year
Total
Electric PJ
Total
Electric PJ
Total
Electric PJ
Total
Electric PJ
Total
Electric PJ
Total
Electric PJ
Total
Electric PJ
Total
Electric PJ
Total
Electric PJ
NSW VIC QLD SA WA TAS NT ACT Australia
1986 0.8 0.3 0.7 0.3 0.3 0.0 0.3 0.0 2.6
1987 0.8 0.3 0.7 0.3 0.3 0.0 0.3 0.0 2.7
1988 0.9 0.4 0.7 0.3 0.3 0.0 0.3 0.0 2.8
1989 0.9 0.4 0.7 0.3 0.4 0.0 0.3 0.0 2.8
1990 0.9 0.4 0.7 0.4 0.4 0.0 0.3 0.0 2.9
1991 0.9 0.4 0.8 0.4 0.4 0.0 0.3 0.0 3.0
1992 0.9 0.4 0.8 0.4 0.4 0.0 0.3 0.0 3.1
1993 0.9 0.4 0.8 0.4 0.4 0.0 0.3 0.0 3.2
1994 0.9 0.4 0.8 0.4 0.5 0.0 0.4 0.0 3.3
1995 1.0 0.4 0.9 0.4 0.5 0.0 0.4 0.0 3.4
1996 1.0 0.4 0.9 0.5 0.5 0.0 0.4 0.0 3.5
1997 1.0 0.4 1.0 0.5 0.5 0.0 0.4 0.0 3.7
1998 1.0 0.4 1.0 0.5 0.5 0.0 0.4 0.0 3.8
1999 1.1 0.5 1.1 0.5 0.6 0.0 0.4 0.0 4.0
2000 1.1 0.5 1.1 0.5 0.6 0.0 0.5 0.0 4.1
2001 1.1 0.5 1.2 0.6 0.6 0.0 0.5 0.0 4.2
2002 1.1 0.5 1.2 0.6 0.6 0.0 0.5 0.0 4.3
2003 1.1 0.5 1.3 0.6 0.7 0.0 0.5 0.0 4.5
2004 1.2 0.5 1.3 0.6 0.7 0.0 0.5 0.0 4.6
Source: EES Residential Building Sector Report 1999
Data in the above table does not take into account any MEPS for air conditioners (either 2001, 2004 or 2007) and only covers the residential sector. The best sources of data for the impact of MEPS (single and three phase) are the various RIS studies which are available on www.energyrating.gov.au (Syneca Consulting 2005b).
S T A T U S O F A I R C O N D I T I O N E R S I N A U S T R A L I A
33
Energy Efficient Strategies P/L
10. PEAK LOAD ISSUES
The sharp increase in air conditioner ownership since 1999 has started to create peak load supply problems for some electricity utilities in some states. This is of particular concern because the peak loads generated by air conditioners can be very large and of short duration, which tends to result in poor utilisation of fixed assets. In addition, the generation and distribution system tends to be at its lowest capacity during very hot weather when air conditioner demands are likely to be at a maximum.
The issues of peak load and weather are complex and a wide range of factors will affect the magnitude of the peak on any particular day. Some detailed analysis has been undertaken in Victoria. The results are included in EES (2004).
S T A T U S O F A I R C O N D I T I O N E R S I N A U S T R A L I A
34
Energy Efficient Strategies P/L
11. REFERENCES AND BIBLIOGRAPHY
Australian Bureau of Statistics reports: see www.abs.gov.au
ABS 3222.0, Projection of the Populations of Australia, States and Territories.
ABS3260; Household and Family Projections, Australia, 1996 to 2021. March 1999,
ABS4602.0; Environmental Issues – Peoples Views and Practices. March 2005, Australian Bureau of Statistics. Also 2002, 1999 and 1994 reports.
ABS 8212.0, 1981, National Energy Survey - Household Appliances, Facilities and Insulation, Australia 1980, published July 1981.
ABS 8212.0, 1984, National Energy Survey - Household Appliances, Facilities and Insulation, Australia 1983, published June 1984.
ABS 8212.0, 1987, National Energy Survey - Household Appliances, Facilities and Insulation, Australia 1985-86, published June 1987.
ABS 8213.0, 1984, National Energy Survey: Annual Consumption of Reticulated Energy by Households, Australia 1983.
ABS 8213.0, 1987, National Energy Survey Annual Consumption of Reticulated Energy by Households, Australia 1985-86, Canberra.
ABS 8218.0, 1988, National Energy: Survey Weekly Reticulated Energy and Appliance Usage Patterns by Season Households, Australia 1985-86, October 1988.
APEC 2001, Study on Algorithm Development for Energy Performance Testing - Study 3: Study of algorithms for air conditioners, prepared for APEC Secretariat, December 2001, Project EWG 03/200T. Available from www.energyefficient.com.au
APEC 2004; Conference: Air conditioning & energy performance - the next 5 years, Sydney, June 2004. Papers available from http://www.energyrating.gov.au/2004-06apecmeeting.html
BIS Shrapnel (2000), The Household Appliances Market in Australia, 2000-2002, Volume 3: Climate Control. October 2000, BIS Shrapnel Pty Ltd
BIS Shrapnel (2002), The Household Appliances Market in Australia, 2002-2004, Volume 3: Climate Control. October 2002, BIS Shrapnel Pty Ltd
BIS Shrapnel (2003), Household Appliances Installed in New Dwellings and Renovations, 2003. April 2003, BIS Shrapnel Pty Ltd
S T A T U S O F A I R C O N D I T I O N E R S I N A U S T R A L I A
35
Energy Efficient Strategies P/L
BIS Shrapnel (2004), The Household Appliances Market in Australia, 2004-2006, Volume 3: Climate Control. October 2004, BIS Shrapnel Pty Ltd
BRANZ (2000), Energy Used in Australian Appliances; Analysis of 1993/94 RES Appliance Energy Use Data, by BRANZ for the Australian Greenhouse Office, May 2000.
DHSV (2001), Victorian Utility Consumption Survey 2001, Department of Human Services, Victoria. Available from www.dhs.vic.gov.au
Energy Consult (2001), Air Conditioning Challenge; Program Options, by Energy Consult for the Australian Greenhouse Office, February 2001. Available from www.energyrating.gov.au in the electronic library.
Energy Consult (2005), Comparison of International MEPS; Room Air Conditioners, by Energy Consult for the Australian Greenhouse Office, January 2005, NAEEEC Report 2005/03. Available from www.energyrating.gov.au in the electronic library.
EES (1999), Study of Greenhouse Gas Emissions from the Australian Residential Building Sector to 2010, by Energy Efficient Strategies for the Australian Greenhouse Office. Available from www.energyrating.gov.au in the electronic library.
EES (2004), Electrical Peak Load Analysis, Victoria, 1999-2003, by Energy Efficient Strategies for VENCORP and the Australian Greenhouse Office, December 2004. Available from www.energyrating.gov.au in the electric library.
GWA (2000), Minimum Energy Performance Standards and Alternative Strategies for Air Conditioners and Heat Pumps; Regulatory Impact Statement, by George Wilkenfeld and Associates for the Australian Greenhouse Office, September 2000. Available from www.energyrating.gov.au in the electronic library.
GWA (2001), The Scope for Application of Minimum Energy Performance Standards to Additional Household Appliances, by George Wilkenfeld and Associates for the National Appliance and Equipment Energy Efficient Committee, December 2001. Available from www.energyrating.gov.au in the electronic library.
GWA (2004), A National Demand Management Strategy for Small Air Conditioners, by George Wilkenfeld and Associates for the National Appliance and Equipment Energy Efficiency Committee (NAEEEC) and the Australian Greenhouse Office, November 2004, NAEEEC Report 2004/22. Available from www.energyrating.gov.au in the electric library.
Hart M. & de Dear R. (2002), Appliance Electricity End-Use: Weather and Climate Sensitivity, by Macquarie Research Ltd for the Australian Greenhouse Office. Available from www.energyrating.gov.au in the electronic library.
S T A T U S O F A I R C O N D I T I O N E R S I N A U S T R A L I A
36
Energy Efficient Strategies P/L
MCE (2001), Minimum Energy Performance Standards; Evaporative Air Conditioners, by the Ministerial Council on Energy. NAEEEC Report 2002/11, March 2001. Available from www.energyrating.gov.au in the electronic library.
MCE (2002), Minimum Energy Performance Standards; Air Conditioners, by the Ministerial Council on Energy. NAEEEC Report 2002/11, August 2002. Available from www.energyrating.gov.au in the electronic library.
MCE (2004), Standby Product Profile; Air Conditioners, by the Ministerial Council on Energy. NAEEEC Report 2004/06, June 2004. Available from www.energyrating.gov.au in the electronic library.
MCE (2004), Minimum Energy Performance Standards; Heat Pumps, by the Ministerial Council on Energy. NAEEEC Report 2004/17, October 2004. Available from www.energyrating.gov.au in the electronic library.
MEA (2001), Analysis of Potential for Minimum Energy Performance Standards for Evaporative Air Conditioners, by Mark Ellis and Associates for the Australian Greenhouse Office, March 2001. Available from www.energyrating.gov.au in the electronic library.
NAEEEC (2002), Fact Sheet 3; MEPS and Labelling for Air Conditioners, NAEEEC Report Fact Sheet 3, March, 2002. Available from www.energyrating.gov.au in the electronic library.
Pacific Power (1994), The Residential End Use Study; Executive Summary, by Pacific Power, August 1994. Available from www.energyrating.gov.au in the electronic library.
Syneca Consulting (2003), Minimum Energy Performance Standards for Air Conditioners; Regulatory Impact Statement, by Syneca Consulting for the Australian Greenhouse Office, August 2005, NAEEEC report 2003/08. Available from www.energyrating.gov.au in the electronic library.
Syneca Consulting (2005a), Proposal to Increase MEPS for Room Air Conditioners; Regulatory Impact Statement, by Syneca Consulting for the Australian Greenhouse Office, February 2005, NAEEEC report 2005/04. Available from www.energyrating.gov.au in the electronic library.
Syneca Consulting (2005b), Proposal to increase MEPS for Room Air Conditioners and harmonise MEPS for single and three-phase units; Regulatory Impact Statement, by Syneca Consulting for the Australian Greenhouse Office, July 2005, NAEEEC Report 2005/16. Available from www.energyrating.gov.au in the electronic library.
Test Research (1995), Appliance Use Survey Report, by Test Research for the National Appliance Energy Efficiency Coordinating Committee, February 1995.
S T A T U S O F A I R C O N D I T I O N E R S I N A U S T R A L I A
37
Energy Efficient Strategies P/L
Unisearch (1998), Proposed Energy Efficiency Program for Packaged Air Conditioners, by Unisearch Limited for the Department of Primary Industries and Energy, June 1998. Available from www.energyrating.gov.au in the electronic library.
This report also includes analysed data from the NAEEEC Online Registration system for air conditioners which is not publicly available.
S T A T U S O F A I R C O N D I T I O N E R S I N A U S T R A L I A
38
Energy Efficient Strategies P/L
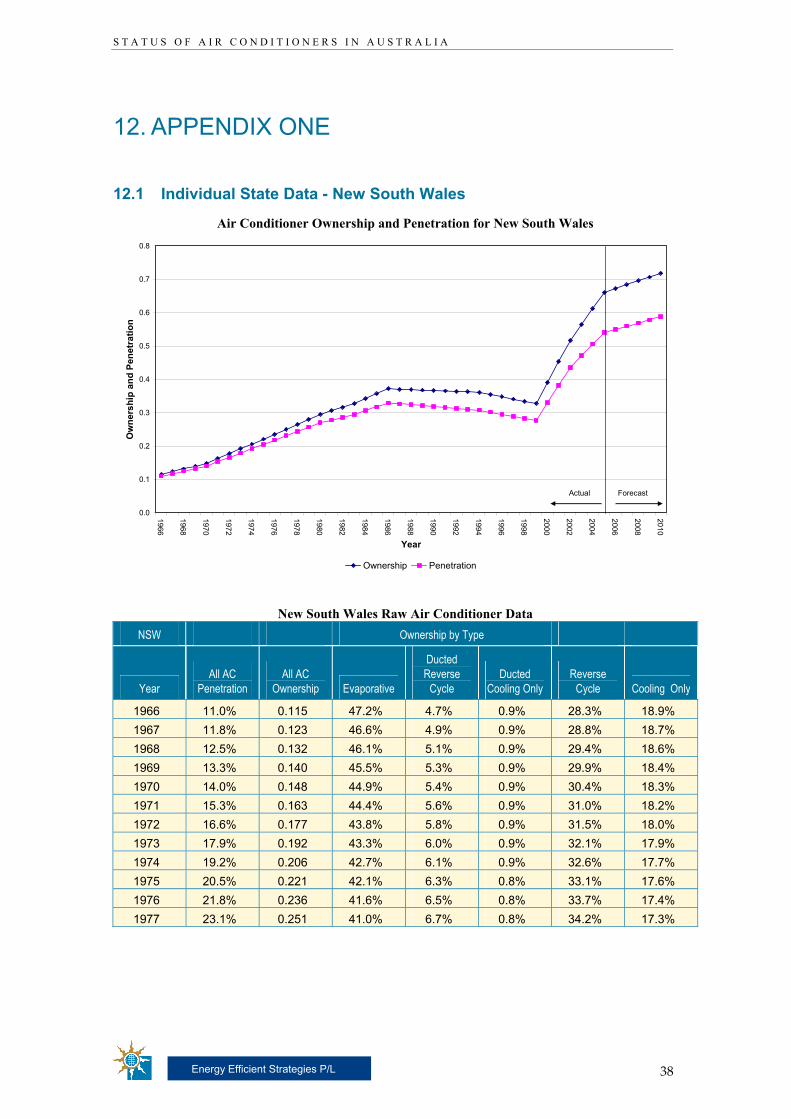
12. APPENDIX ONE
12.1 Individual State Data - New South Wales
Air Conditioner Ownership and Penetration for New South Wales
0.0
0.1
0.2
0.3
0.4
0.5
0.6
0.7
0.8
1966
1968
1970
1972
1974
1976
1978
1980
1982
1984
1986
1988
1990
1992
1994
1996
1998
2000
2002
2004
2006
2008
2010
Year
Ow
ners
hip
and
Pene
trat
ion
Ownership Penetration
ForecastActual
New South Wales Raw Air Conditioner Data
NSW Ownership by Type
Year All AC
Penetration All AC
Ownership Evaporative
Ducted Reverse
Cycle Ducted
Cooling Only Reverse
Cycle Cooling Only
1966 11.0% 0.115 47.2% 4.7% 0.9% 28.3% 18.9%1967 11.8% 0.123 46.6% 4.9% 0.9% 28.8% 18.7%1968 12.5% 0.132 46.1% 5.1% 0.9% 29.4% 18.6%1969 13.3% 0.140 45.5% 5.3% 0.9% 29.9% 18.4%1970 14.0% 0.148 44.9% 5.4% 0.9% 30.4% 18.3%1971 15.3% 0.163 44.4% 5.6% 0.9% 31.0% 18.2%1972 16.6% 0.177 43.8% 5.8% 0.9% 31.5% 18.0%1973 17.9% 0.192 43.3% 6.0% 0.9% 32.1% 17.9%1974 19.2% 0.206 42.7% 6.1% 0.9% 32.6% 17.7%1975 20.5% 0.221 42.1% 6.3% 0.8% 33.1% 17.6%1976 21.8% 0.236 41.6% 6.5% 0.8% 33.7% 17.4%1977 23.1% 0.251 41.0% 6.7% 0.8% 34.2% 17.3%
S T A T U S O F A I R C O N D I T I O N E R S I N A U S T R A L I A
39
Energy Efficient Strategies P/L
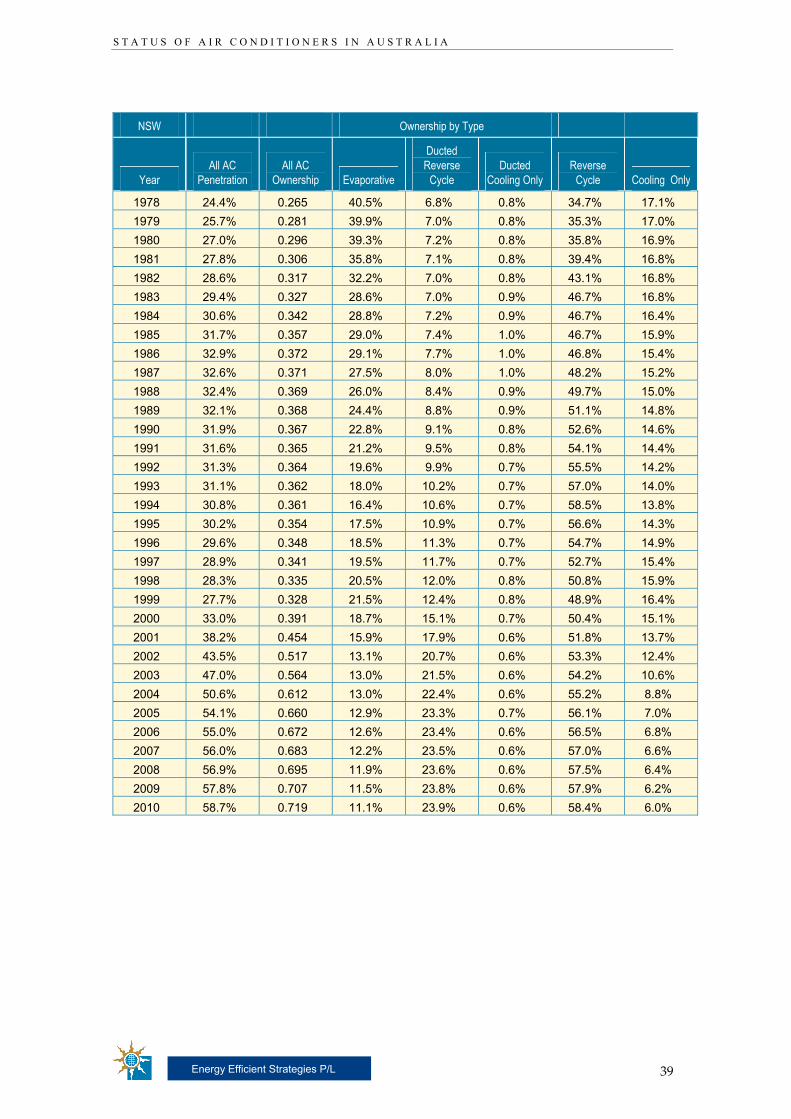
NSW Ownership by Type
Year All AC
Penetration All AC
Ownership Evaporative
Ducted Reverse
Cycle Ducted
Cooling Only Reverse
Cycle Cooling Only
1978 24.4% 0.265 40.5% 6.8% 0.8% 34.7% 17.1%1979 25.7% 0.281 39.9% 7.0% 0.8% 35.3% 17.0%1980 27.0% 0.296 39.3% 7.2% 0.8% 35.8% 16.9%1981 27.8% 0.306 35.8% 7.1% 0.8% 39.4% 16.8%1982 28.6% 0.317 32.2% 7.0% 0.8% 43.1% 16.8%1983 29.4% 0.327 28.6% 7.0% 0.9% 46.7% 16.8%1984 30.6% 0.342 28.8% 7.2% 0.9% 46.7% 16.4%1985 31.7% 0.357 29.0% 7.4% 1.0% 46.7% 15.9%1986 32.9% 0.372 29.1% 7.7% 1.0% 46.8% 15.4%1987 32.6% 0.371 27.5% 8.0% 1.0% 48.2% 15.2%1988 32.4% 0.369 26.0% 8.4% 0.9% 49.7% 15.0%1989 32.1% 0.368 24.4% 8.8% 0.9% 51.1% 14.8%1990 31.9% 0.367 22.8% 9.1% 0.8% 52.6% 14.6%1991 31.6% 0.365 21.2% 9.5% 0.8% 54.1% 14.4%1992 31.3% 0.364 19.6% 9.9% 0.7% 55.5% 14.2%1993 31.1% 0.362 18.0% 10.2% 0.7% 57.0% 14.0%1994 30.8% 0.361 16.4% 10.6% 0.7% 58.5% 13.8%1995 30.2% 0.354 17.5% 10.9% 0.7% 56.6% 14.3%1996 29.6% 0.348 18.5% 11.3% 0.7% 54.7% 14.9%1997 28.9% 0.341 19.5% 11.7% 0.7% 52.7% 15.4%1998 28.3% 0.335 20.5% 12.0% 0.8% 50.8% 15.9%1999 27.7% 0.328 21.5% 12.4% 0.8% 48.9% 16.4%2000 33.0% 0.391 18.7% 15.1% 0.7% 50.4% 15.1%2001 38.2% 0.454 15.9% 17.9% 0.6% 51.8% 13.7%2002 43.5% 0.517 13.1% 20.7% 0.6% 53.3% 12.4%2003 47.0% 0.564 13.0% 21.5% 0.6% 54.2% 10.6%2004 50.6% 0.612 13.0% 22.4% 0.6% 55.2% 8.8%2005 54.1% 0.660 12.9% 23.3% 0.7% 56.1% 7.0%2006 55.0% 0.672 12.6% 23.4% 0.6% 56.5% 6.8%2007 56.0% 0.683 12.2% 23.5% 0.6% 57.0% 6.6%2008 56.9% 0.695 11.9% 23.6% 0.6% 57.5% 6.4%2009 57.8% 0.707 11.5% 23.8% 0.6% 57.9% 6.2%2010 58.7% 0.719 11.1% 23.9% 0.6% 58.4% 6.0%
S T A T U S O F A I R C O N D I T I O N E R S I N A U S T R A L I A
40
Energy Efficient Strategies P/L
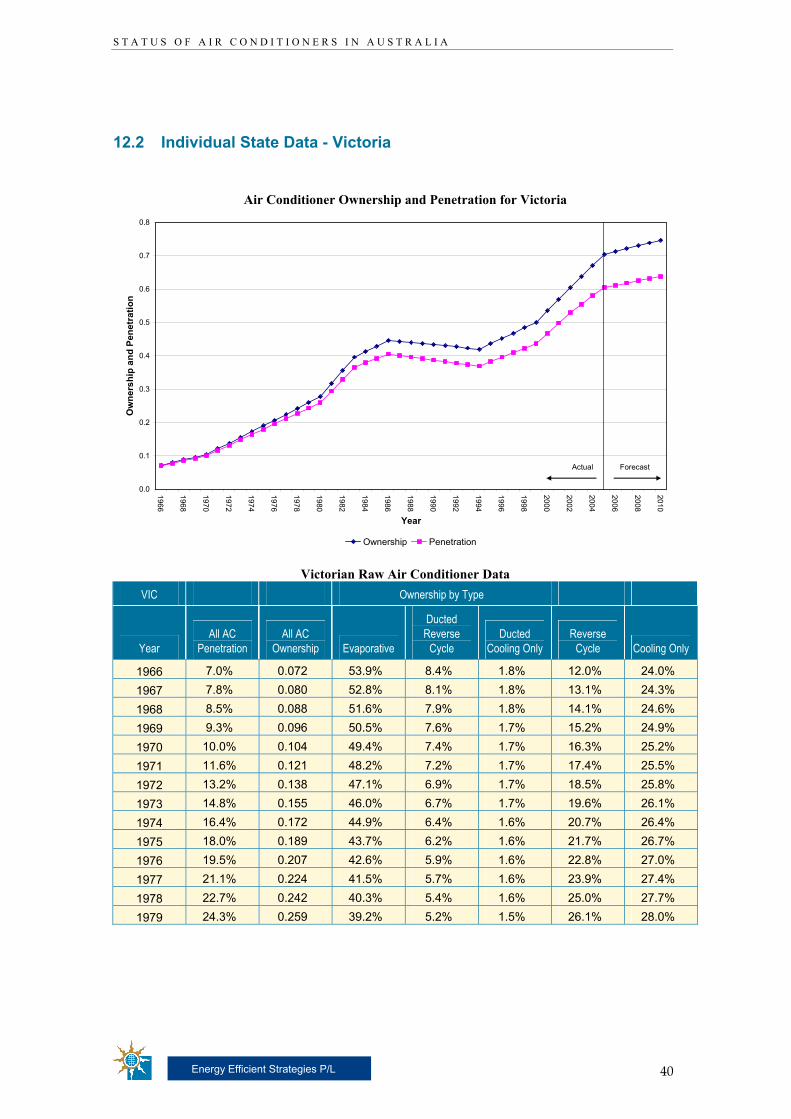
12.2 Individual State Data - Victoria
Air Conditioner Ownership and Penetration for Victoria
0.0
0.1
0.2
0.3
0.4
0.5
0.6
0.7
0.8
1966
1968
1970
1972
1974
1976
1978
1980
1982
1984
1986
1988
1990
1992
1994
1996
1998
2000
2002
2004
2006
2008
2010
Year
Ow
ners
hip
and
Pene
trat
ion
Ownership Penetration
ForecastActual
Victorian Raw Air Conditioner Data VIC Ownership by Type
Year All AC
Penetration All AC
Ownership Evaporative
Ducted Reverse
Cycle Ducted
Cooling Only Reverse
Cycle Cooling Only
1966 7.0% 0.072 53.9% 8.4% 1.8% 12.0% 24.0%1967 7.8% 0.080 52.8% 8.1% 1.8% 13.1% 24.3%1968 8.5% 0.088 51.6% 7.9% 1.8% 14.1% 24.6%1969 9.3% 0.096 50.5% 7.6% 1.7% 15.2% 24.9%1970 10.0% 0.104 49.4% 7.4% 1.7% 16.3% 25.2%1971 11.6% 0.121 48.2% 7.2% 1.7% 17.4% 25.5%1972 13.2% 0.138 47.1% 6.9% 1.7% 18.5% 25.8%1973 14.8% 0.155 46.0% 6.7% 1.7% 19.6% 26.1%1974 16.4% 0.172 44.9% 6.4% 1.6% 20.7% 26.4%1975 18.0% 0.189 43.7% 6.2% 1.6% 21.7% 26.7%1976 19.5% 0.207 42.6% 5.9% 1.6% 22.8% 27.0%1977 21.1% 0.224 41.5% 5.7% 1.6% 23.9% 27.4%1978 22.7% 0.242 40.3% 5.4% 1.6% 25.0% 27.7%1979 24.3% 0.259 39.2% 5.2% 1.5% 26.1% 28.0%

S T A T U S O F A I R C O N D I T I O N E R S I N A U S T R A L I A
41
Energy Efficient Strategies P/L
VIC Ownership by Type
Year All AC
Penetration All AC
Ownership Evaporative
Ducted Reverse
Cycle Ducted
Cooling Only Reverse
Cycle Cooling Only
1980 25.9% 0.277 38.1% 4.9% 1.5% 27.2% 28.3%1981 29.4% 0.316 34.6% 5.0% 1.6% 29.0% 29.8%1982 33.0% 0.356 31.2% 5.0% 1.6% 30.8% 31.4%1983 36.5% 0.396 27.7% 5.0% 1.7% 32.7% 33.0%1984 37.8% 0.412 28.2% 4.5% 1.6% 32.8% 32.9%1985 39.2% 0.429 28.7% 4.1% 1.5% 32.9% 32.8%1986 40.5% 0.446 29.2% 3.7% 1.4% 33.0% 32.7%1987 40.1% 0.442 27.8% 3.7% 1.4% 33.8% 33.2%1988 39.6% 0.439 26.3% 3.7% 1.5% 34.7% 33.7%1989 39.2% 0.436 24.9% 3.8% 1.6% 35.6% 34.2%1990 38.7% 0.433 23.4% 3.8% 1.7% 36.4% 34.7%1991 38.3% 0.430 22.0% 3.8% 1.8% 37.3% 35.2%1992 37.8% 0.427 20.6% 3.8% 1.8% 38.1% 35.6%1993 37.4% 0.423 19.1% 3.8% 1.9% 39.0% 36.1%1994 36.9% 0.420 17.7% 3.8% 2.0% 39.9% 36.6%1995 38.2% 0.436 19.2% 4.2% 2.2% 37.1% 37.3%1996 39.6% 0.452 20.8% 4.6% 2.4% 34.3% 37.9%1997 40.9% 0.468 22.3% 4.9% 2.6% 31.6% 38.6%1998 42.3% 0.484 23.9% 5.3% 2.8% 28.8% 39.2%1999 43.6% 0.500 25.5% 5.7% 3.0% 26.1% 39.8%2000 46.7% 0.535 27.3% 4.8% 2.9% 26.9% 38.1%2001 49.8% 0.569 29.2% 4.0% 2.8% 27.7% 36.3%2002 52.9% 0.604 31.1% 3.2% 2.7% 28.5% 34.5%2003 55.4% 0.637 31.5% 3.3% 2.5% 30.3% 32.4%2004 58.0% 0.670 31.9% 3.5% 2.3% 32.0% 30.3%2005 60.5% 0.704 32.3% 3.6% 2.1% 33.8% 28.2%2006 61.1% 0.713 32.4% 3.6% 2.1% 34.4% 27.5%2007 61.8% 0.721 32.5% 3.6% 2.1% 35.0% 26.8%2008 62.4% 0.730 32.6% 3.6% 2.0% 35.6% 26.2%2009 63.1% 0.738 32.7% 3.5% 2.0% 36.2% 25.5%2010 63.7% 0.747 32.8% 3.5% 2.0% 36.9% 24.8%

S T A T U S O F A I R C O N D I T I O N E R S I N A U S T R A L I A
42
Energy Efficient Strategies P/L
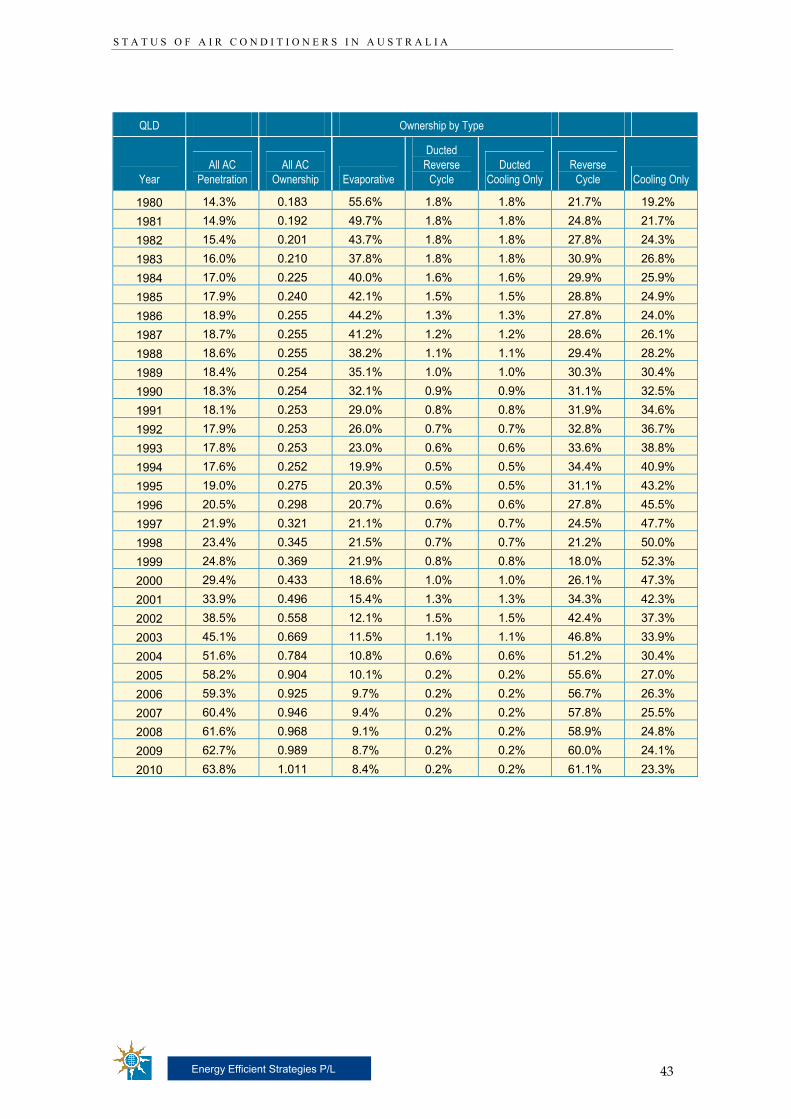
12.3 Individual State Data – Queensland
Air Conditioner Ownership and Penetration for Queensland
0.0
0.2
0.4
0.6
0.8
1.0
1.2
1966
1968
1970
1972
1974
1976
1978
1980
1982
1984
1986
1988
1990
1992
1994
1996
1998
2000
2002
2004
2006
2008
2010
Year
Ow
ners
hip
and
Pene
trat
ion
Ownership Penetration
ForecastActual
Queensland Raw Air Conditioner Data QLD Ownership by Type
Year All AC
Penetration All AC
Ownership Evaporative
Ducted Reverse
Cycle Ducted
Cooling Only Reverse
Cycle Cooling Only
1966 5.0% 0.057 75.6% 2.4% 2.4% 9.8% 12.2%1967 5.5% 0.063 74.2% 2.4% 2.4% 10.6% 12.7%1968 6.0% 0.070 72.7% 2.3% 2.3% 11.5% 13.2%1969 6.5% 0.076 71.3% 2.3% 2.3% 12.3% 13.7%1970 7.0% 0.083 69.9% 2.2% 2.2% 13.2% 14.2%1971 7.7% 0.092 68.5% 2.2% 2.2% 14.0% 14.7%1972 8.5% 0.102 67.0% 2.2% 2.2% 14.9% 15.2%1973 9.2% 0.111 65.6% 2.1% 2.1% 15.7% 15.7%1974 9.9% 0.121 64.2% 2.1% 2.1% 16.6% 16.2%1975 10.7% 0.131 62.7% 2.0% 2.0% 17.4% 16.7%1976 11.4% 0.141 61.3% 2.0% 2.0% 18.3% 17.2%1977 12.1% 0.151 59.9% 1.9% 1.9% 19.1% 17.7%1978 12.8% 0.162 58.4% 1.9% 1.9% 20.0% 18.2%1979 13.6% 0.172 57.0% 1.8% 1.8% 20.8% 18.7%
S T A T U S O F A I R C O N D I T I O N E R S I N A U S T R A L I A
43
Energy Efficient Strategies P/L
QLD Ownership by Type
Year All AC
Penetration All AC
Ownership Evaporative
Ducted Reverse
Cycle Ducted
Cooling Only Reverse
Cycle Cooling Only
1980 14.3% 0.183 55.6% 1.8% 1.8% 21.7% 19.2%1981 14.9% 0.192 49.7% 1.8% 1.8% 24.8% 21.7%1982 15.4% 0.201 43.7% 1.8% 1.8% 27.8% 24.3%1983 16.0% 0.210 37.8% 1.8% 1.8% 30.9% 26.8%1984 17.0% 0.225 40.0% 1.6% 1.6% 29.9% 25.9%1985 17.9% 0.240 42.1% 1.5% 1.5% 28.8% 24.9%1986 18.9% 0.255 44.2% 1.3% 1.3% 27.8% 24.0%1987 18.7% 0.255 41.2% 1.2% 1.2% 28.6% 26.1%1988 18.6% 0.255 38.2% 1.1% 1.1% 29.4% 28.2%1989 18.4% 0.254 35.1% 1.0% 1.0% 30.3% 30.4%1990 18.3% 0.254 32.1% 0.9% 0.9% 31.1% 32.5%1991 18.1% 0.253 29.0% 0.8% 0.8% 31.9% 34.6%1992 17.9% 0.253 26.0% 0.7% 0.7% 32.8% 36.7%1993 17.8% 0.253 23.0% 0.6% 0.6% 33.6% 38.8%1994 17.6% 0.252 19.9% 0.5% 0.5% 34.4% 40.9%1995 19.0% 0.275 20.3% 0.5% 0.5% 31.1% 43.2%1996 20.5% 0.298 20.7% 0.6% 0.6% 27.8% 45.5%1997 21.9% 0.321 21.1% 0.7% 0.7% 24.5% 47.7%1998 23.4% 0.345 21.5% 0.7% 0.7% 21.2% 50.0%1999 24.8% 0.369 21.9% 0.8% 0.8% 18.0% 52.3%2000 29.4% 0.433 18.6% 1.0% 1.0% 26.1% 47.3%2001 33.9% 0.496 15.4% 1.3% 1.3% 34.3% 42.3%2002 38.5% 0.558 12.1% 1.5% 1.5% 42.4% 37.3%2003 45.1% 0.669 11.5% 1.1% 1.1% 46.8% 33.9%2004 51.6% 0.784 10.8% 0.6% 0.6% 51.2% 30.4%2005 58.2% 0.904 10.1% 0.2% 0.2% 55.6% 27.0%2006 59.3% 0.925 9.7% 0.2% 0.2% 56.7% 26.3%2007 60.4% 0.946 9.4% 0.2% 0.2% 57.8% 25.5%2008 61.6% 0.968 9.1% 0.2% 0.2% 58.9% 24.8%2009 62.7% 0.989 8.7% 0.2% 0.2% 60.0% 24.1%2010 63.8% 1.011 8.4% 0.2% 0.2% 61.1% 23.3%
S T A T U S O F A I R C O N D I T I O N E R S I N A U S T R A L I A
44
Energy Efficient Strategies P/L
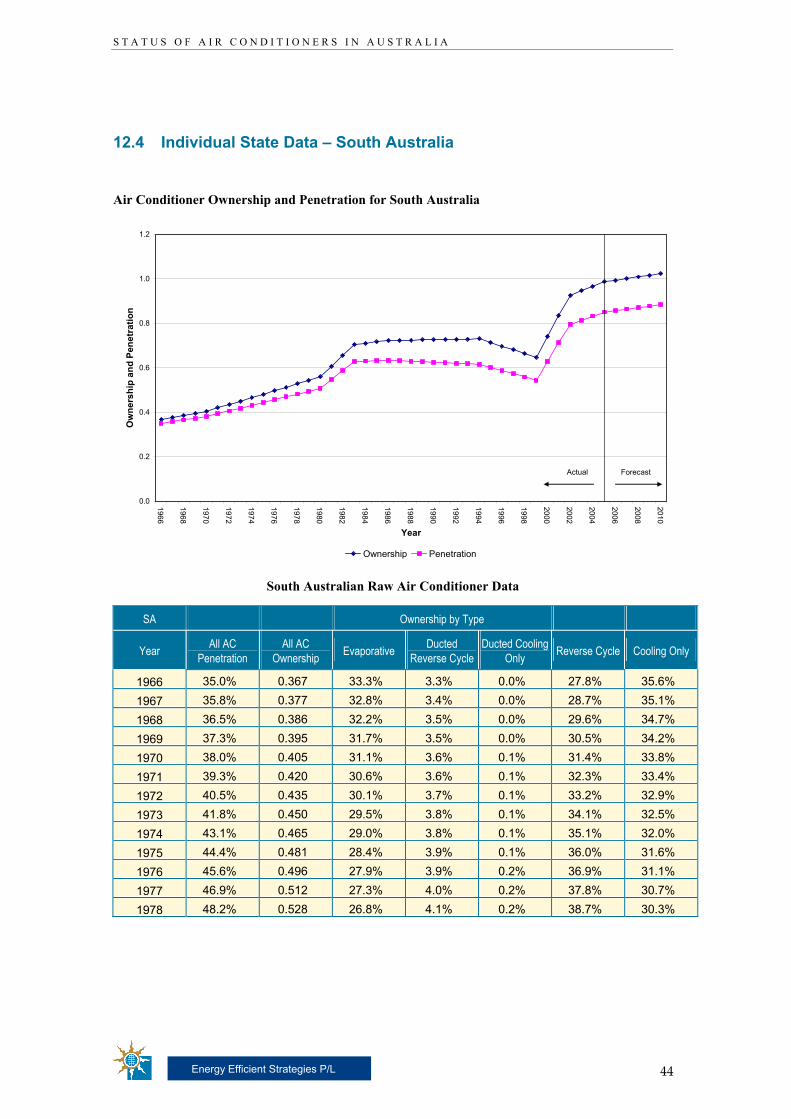
12.4 Individual State Data – South Australia
Air Conditioner Ownership and Penetration for South Australia
0.0
0.2
0.4
0.6
0.8
1.0
1.2
1966
1968
1970
1972
1974
1976
1978
1980
1982
1984
1986
1988
1990
1992
1994
1996
1998
2000
2002
2004
2006
2008
2010
Year
Ow
ners
hip
and
Pene
trat
ion
Ownership Penetration
ForecastActual
South Australian Raw Air Conditioner Data
SA Ownership by Type
Year All AC Penetration
All AC Ownership Evaporative Ducted
Reverse Cycle Ducted Cooling
Only Reverse Cycle Cooling Only
1966 35.0% 0.367 33.3% 3.3% 0.0% 27.8% 35.6%1967 35.8% 0.377 32.8% 3.4% 0.0% 28.7% 35.1%1968 36.5% 0.386 32.2% 3.5% 0.0% 29.6% 34.7%1969 37.3% 0.395 31.7% 3.5% 0.0% 30.5% 34.2%1970 38.0% 0.405 31.1% 3.6% 0.1% 31.4% 33.8%1971 39.3% 0.420 30.6% 3.6% 0.1% 32.3% 33.4%1972 40.5% 0.435 30.1% 3.7% 0.1% 33.2% 32.9%1973 41.8% 0.450 29.5% 3.8% 0.1% 34.1% 32.5%1974 43.1% 0.465 29.0% 3.8% 0.1% 35.1% 32.0%1975 44.4% 0.481 28.4% 3.9% 0.1% 36.0% 31.6%1976 45.6% 0.496 27.9% 3.9% 0.2% 36.9% 31.1%1977 46.9% 0.512 27.3% 4.0% 0.2% 37.8% 30.7%1978 48.2% 0.528 26.8% 4.1% 0.2% 38.7% 30.3%
S T A T U S O F A I R C O N D I T I O N E R S I N A U S T R A L I A
45
Energy Efficient Strategies P/L
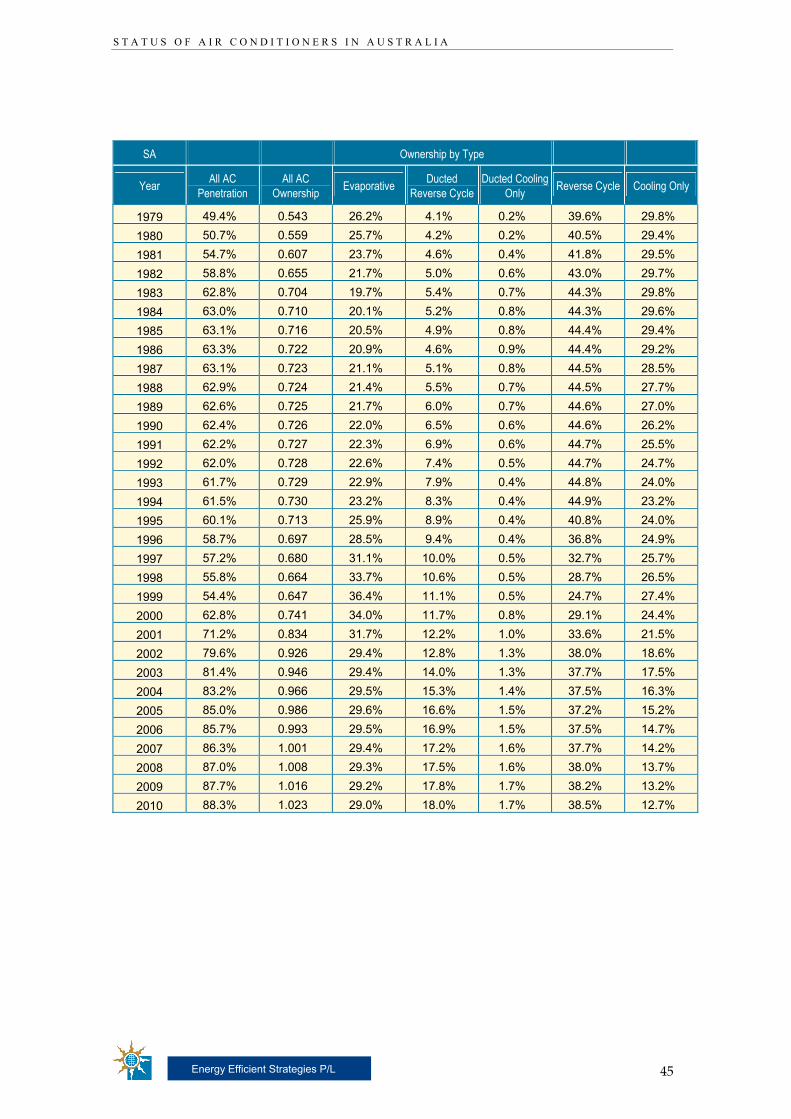
SA Ownership by Type
Year All AC Penetration
All AC Ownership Evaporative Ducted
Reverse Cycle Ducted Cooling
Only Reverse Cycle Cooling Only
1979 49.4% 0.543 26.2% 4.1% 0.2% 39.6% 29.8%1980 50.7% 0.559 25.7% 4.2% 0.2% 40.5% 29.4%1981 54.7% 0.607 23.7% 4.6% 0.4% 41.8% 29.5%1982 58.8% 0.655 21.7% 5.0% 0.6% 43.0% 29.7%1983 62.8% 0.704 19.7% 5.4% 0.7% 44.3% 29.8%1984 63.0% 0.710 20.1% 5.2% 0.8% 44.3% 29.6%1985 63.1% 0.716 20.5% 4.9% 0.8% 44.4% 29.4%1986 63.3% 0.722 20.9% 4.6% 0.9% 44.4% 29.2%1987 63.1% 0.723 21.1% 5.1% 0.8% 44.5% 28.5%1988 62.9% 0.724 21.4% 5.5% 0.7% 44.5% 27.7%1989 62.6% 0.725 21.7% 6.0% 0.7% 44.6% 27.0%1990 62.4% 0.726 22.0% 6.5% 0.6% 44.6% 26.2%1991 62.2% 0.727 22.3% 6.9% 0.6% 44.7% 25.5%1992 62.0% 0.728 22.6% 7.4% 0.5% 44.7% 24.7%1993 61.7% 0.729 22.9% 7.9% 0.4% 44.8% 24.0%1994 61.5% 0.730 23.2% 8.3% 0.4% 44.9% 23.2%1995 60.1% 0.713 25.9% 8.9% 0.4% 40.8% 24.0%1996 58.7% 0.697 28.5% 9.4% 0.4% 36.8% 24.9%1997 57.2% 0.680 31.1% 10.0% 0.5% 32.7% 25.7%1998 55.8% 0.664 33.7% 10.6% 0.5% 28.7% 26.5%1999 54.4% 0.647 36.4% 11.1% 0.5% 24.7% 27.4%2000 62.8% 0.741 34.0% 11.7% 0.8% 29.1% 24.4%2001 71.2% 0.834 31.7% 12.2% 1.0% 33.6% 21.5%2002 79.6% 0.926 29.4% 12.8% 1.3% 38.0% 18.6%2003 81.4% 0.946 29.4% 14.0% 1.3% 37.7% 17.5%2004 83.2% 0.966 29.5% 15.3% 1.4% 37.5% 16.3%2005 85.0% 0.986 29.6% 16.6% 1.5% 37.2% 15.2%2006 85.7% 0.993 29.5% 16.9% 1.5% 37.5% 14.7%2007 86.3% 1.001 29.4% 17.2% 1.6% 37.7% 14.2%2008 87.0% 1.008 29.3% 17.5% 1.6% 38.0% 13.7%2009 87.7% 1.016 29.2% 17.8% 1.7% 38.2% 13.2%2010 88.3% 1.023 29.0% 18.0% 1.7% 38.5% 12.7%

S T A T U S O F A I R C O N D I T I O N E R S I N A U S T R A L I A
46
Energy Efficient Strategies P/L
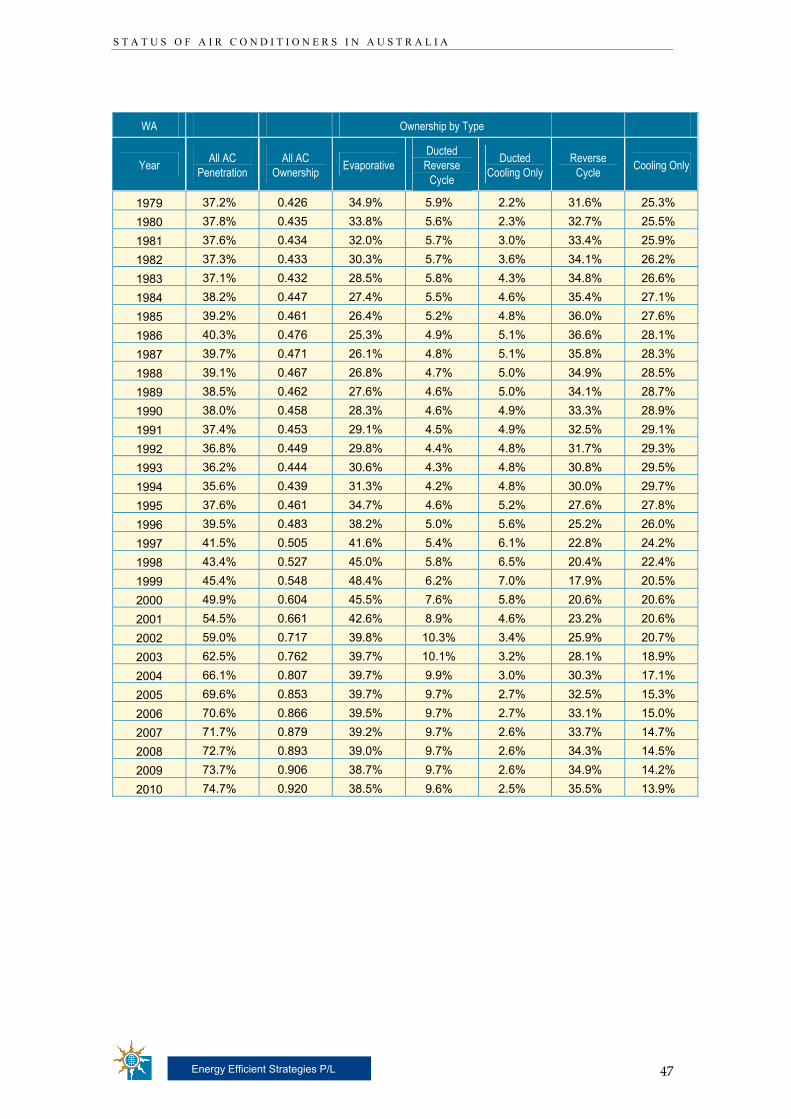
12.5 Individual State Data – Western Australia
Air Conditioner Ownership and Penetration for Western Australia
0.0
0.1
0.2
0.3
0.4
0.5
0.6
0.7
0.8
0.9
1.0
1966
1968
1970
1972
1974
1976
1978
1980
1982
1984
1986
1988
1990
1992
1994
1996
1998
2000
2002
2004
2006
2008
2010
Year
Ow
ners
hip
and
Pene
trat
ion
Ownership Penetration
ForecastActual
Western Australian Raw Air Conditioner Data
WA Ownership by Type
Year All AC Penetration
All AC Ownership Evaporative
Ducted Reverse
Cycle
Ducted Cooling Only
Reverse Cycle Cooling Only
1966 28.0% 0.302 48.8% 9.8% 1.2% 17.1% 23.2%1967 29.0% 0.315 47.7% 9.5% 1.3% 18.2% 23.3%1968 30.0% 0.327 46.6% 9.2% 1.4% 19.3% 23.5%1969 31.0% 0.339 45.6% 8.9% 1.5% 20.4% 23.7%1970 32.0% 0.352 44.5% 8.6% 1.5% 21.5% 23.8%1971 32.6% 0.360 43.4% 8.3% 1.6% 22.7% 24.0%1972 33.2% 0.368 42.4% 8.0% 1.7% 23.8% 24.2%1973 33.7% 0.376 41.3% 7.7% 1.8% 24.9% 24.3%1974 34.3% 0.384 40.2% 7.4% 1.8% 26.0% 24.5%1975 34.9% 0.393 39.2% 7.1% 1.9% 27.1% 24.7%1976 35.5% 0.401 38.1% 6.8% 2.0% 28.3% 24.8%1977 36.1% 0.409 37.0% 6.5% 2.1% 29.4% 25.0%1978 36.6% 0.418 35.9% 6.2% 2.2% 30.5% 25.2%
S T A T U S O F A I R C O N D I T I O N E R S I N A U S T R A L I A
47
Energy Efficient Strategies P/L
WA Ownership by Type
Year All AC Penetration
All AC Ownership Evaporative
Ducted Reverse
Cycle
Ducted Cooling Only
Reverse Cycle Cooling Only
1979 37.2% 0.426 34.9% 5.9% 2.2% 31.6% 25.3%1980 37.8% 0.435 33.8% 5.6% 2.3% 32.7% 25.5%1981 37.6% 0.434 32.0% 5.7% 3.0% 33.4% 25.9%1982 37.3% 0.433 30.3% 5.7% 3.6% 34.1% 26.2%1983 37.1% 0.432 28.5% 5.8% 4.3% 34.8% 26.6%1984 38.2% 0.447 27.4% 5.5% 4.6% 35.4% 27.1%1985 39.2% 0.461 26.4% 5.2% 4.8% 36.0% 27.6%1986 40.3% 0.476 25.3% 4.9% 5.1% 36.6% 28.1%1987 39.7% 0.471 26.1% 4.8% 5.1% 35.8% 28.3%1988 39.1% 0.467 26.8% 4.7% 5.0% 34.9% 28.5%1989 38.5% 0.462 27.6% 4.6% 5.0% 34.1% 28.7%1990 38.0% 0.458 28.3% 4.6% 4.9% 33.3% 28.9%1991 37.4% 0.453 29.1% 4.5% 4.9% 32.5% 29.1%1992 36.8% 0.449 29.8% 4.4% 4.8% 31.7% 29.3%1993 36.2% 0.444 30.6% 4.3% 4.8% 30.8% 29.5%1994 35.6% 0.439 31.3% 4.2% 4.8% 30.0% 29.7%1995 37.6% 0.461 34.7% 4.6% 5.2% 27.6% 27.8%1996 39.5% 0.483 38.2% 5.0% 5.6% 25.2% 26.0%1997 41.5% 0.505 41.6% 5.4% 6.1% 22.8% 24.2%1998 43.4% 0.527 45.0% 5.8% 6.5% 20.4% 22.4%1999 45.4% 0.548 48.4% 6.2% 7.0% 17.9% 20.5%2000 49.9% 0.604 45.5% 7.6% 5.8% 20.6% 20.6%2001 54.5% 0.661 42.6% 8.9% 4.6% 23.2% 20.6%2002 59.0% 0.717 39.8% 10.3% 3.4% 25.9% 20.7%2003 62.5% 0.762 39.7% 10.1% 3.2% 28.1% 18.9%2004 66.1% 0.807 39.7% 9.9% 3.0% 30.3% 17.1%2005 69.6% 0.853 39.7% 9.7% 2.7% 32.5% 15.3%2006 70.6% 0.866 39.5% 9.7% 2.7% 33.1% 15.0%2007 71.7% 0.879 39.2% 9.7% 2.6% 33.7% 14.7%2008 72.7% 0.893 39.0% 9.7% 2.6% 34.3% 14.5%2009 73.7% 0.906 38.7% 9.7% 2.6% 34.9% 14.2%2010 74.7% 0.920 38.5% 9.6% 2.5% 35.5% 13.9%
S T A T U S O F A I R C O N D I T I O N E R S I N A U S T R A L I A
48
Energy Efficient Strategies P/L
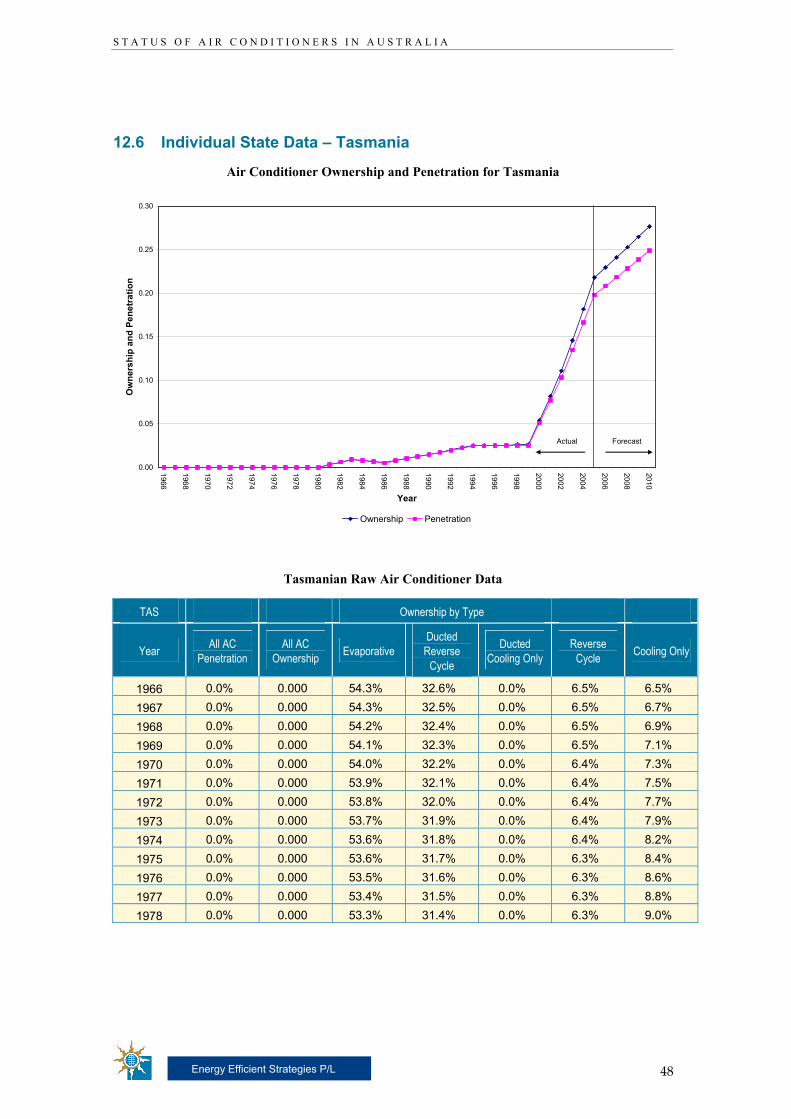
12.6 Individual State Data – Tasmania
Air Conditioner Ownership and Penetration for Tasmania
0.00
0.05
0.10
0.15
0.20
0.25
0.30
1966
1968
1970
1972
1974
1976
1978
1980
1982
1984
1986
1988
1990
1992
1994
1996
1998
2000
2002
2004
2006
2008
2010
Year
Ow
ners
hip
and
Pene
trat
ion
Ownership Penetration
ForecastActual
Tasmanian Raw Air Conditioner Data
TAS Ownership by Type
Year All AC Penetration
All AC Ownership Evaporative
Ducted Reverse
Cycle
Ducted Cooling Only
Reverse Cycle Cooling Only
1966 0.0% 0.000 54.3% 32.6% 0.0% 6.5% 6.5%1967 0.0% 0.000 54.3% 32.5% 0.0% 6.5% 6.7%1968 0.0% 0.000 54.2% 32.4% 0.0% 6.5% 6.9%1969 0.0% 0.000 54.1% 32.3% 0.0% 6.5% 7.1%1970 0.0% 0.000 54.0% 32.2% 0.0% 6.4% 7.3%1971 0.0% 0.000 53.9% 32.1% 0.0% 6.4% 7.5%1972 0.0% 0.000 53.8% 32.0% 0.0% 6.4% 7.7%1973 0.0% 0.000 53.7% 31.9% 0.0% 6.4% 7.9%1974 0.0% 0.000 53.6% 31.8% 0.0% 6.4% 8.2%1975 0.0% 0.000 53.6% 31.7% 0.0% 6.3% 8.4%1976 0.0% 0.000 53.5% 31.6% 0.0% 6.3% 8.6%1977 0.0% 0.000 53.4% 31.5% 0.0% 6.3% 8.8%1978 0.0% 0.000 53.3% 31.4% 0.0% 6.3% 9.0%

S T A T U S O F A I R C O N D I T I O N E R S I N A U S T R A L I A
49
Energy Efficient Strategies P/L
TAS Ownership by Type
Year All AC Penetration
All AC Ownership Evaporative
Ducted Reverse
Cycle
Ducted Cooling Only
Reverse Cycle Cooling Only
1979 0.0% 0.000 53.2% 31.3% 0.0% 6.3% 9.2%1980 0.0% 0.000 53.1% 31.3% 0.0% 6.3% 9.4%1981 0.3% 0.003 43.1% 28.5% 0.0% 7.2% 21.2%1982 0.6% 0.006 33.1% 25.8% 0.0% 8.1% 33.0%1983 0.9% 0.009 23.1% 23.1% 0.0% 9.0% 44.9%1984 0.8% 0.008 15.4% 15.4% 0.0% 6.0% 63.2%1985 0.6% 0.006 7.7% 7.7% 0.0% 3.0% 81.6%1986 0.5% 0.005 0.0% 0.0% 0.0% 0.0% 100.0%1987 0.7% 0.008 4.2% 2.2% 0.6% 4.8% 88.1%1988 1.0% 0.010 8.3% 4.5% 1.3% 9.6% 76.3%1989 1.2% 0.013 12.5% 6.7% 1.9% 14.4% 64.4%1990 1.5% 0.015 16.7% 9.0% 2.6% 19.2% 52.6%1991 1.7% 0.018 20.8% 11.2% 3.2% 24.0% 40.7%1992 2.0% 0.020 25.0% 13.5% 3.8% 28.8% 28.8%1993 2.2% 0.023 29.2% 15.7% 4.5% 33.7% 17.0%1994 2.5% 0.025 33.3% 17.9% 5.1% 38.5% 5.1%1995 2.5% 0.025 30.0% 17.3% 4.9% 40.2% 7.5%1996 2.5% 0.025 26.7% 16.7% 4.8% 41.9% 10.0%1997 2.5% 0.026 23.3% 16.1% 4.6% 43.6% 12.4%1998 2.5% 0.026 20.0% 15.4% 4.4% 45.4% 14.8%1999 2.5% 0.026 16.7% 14.8% 4.2% 47.1% 17.2%2000 5.1% 0.054 13.3% 13.6% 2.8% 58.8% 11.5%2001 7.7% 0.082 10.0% 12.4% 1.4% 70.5% 5.7%2002 10.3% 0.111 6.6% 11.2% 0.0% 82.1% 0.0%2003 13.5% 0.146 6.6% 13.5% 0.0% 79.1% 0.7%2004 16.6% 0.182 6.7% 15.8% 0.0% 76.1% 1.4%2005 19.8% 0.218 6.7% 18.1% 0.0% 73.1% 2.1%2006 20.8% 0.230 6.5% 18.3% 0.0% 73.2% 2.1%2007 21.8% 0.241 6.3% 18.4% 0.0% 73.3% 2.0%2008 22.8% 0.253 6.1% 18.5% 0.0% 73.5% 1.9%2009 23.9% 0.265 6.0% 18.6% 0.0% 73.6% 1.8%2010 24.9% 0.276 5.8% 18.8% 0.0% 73.7% 1.8%
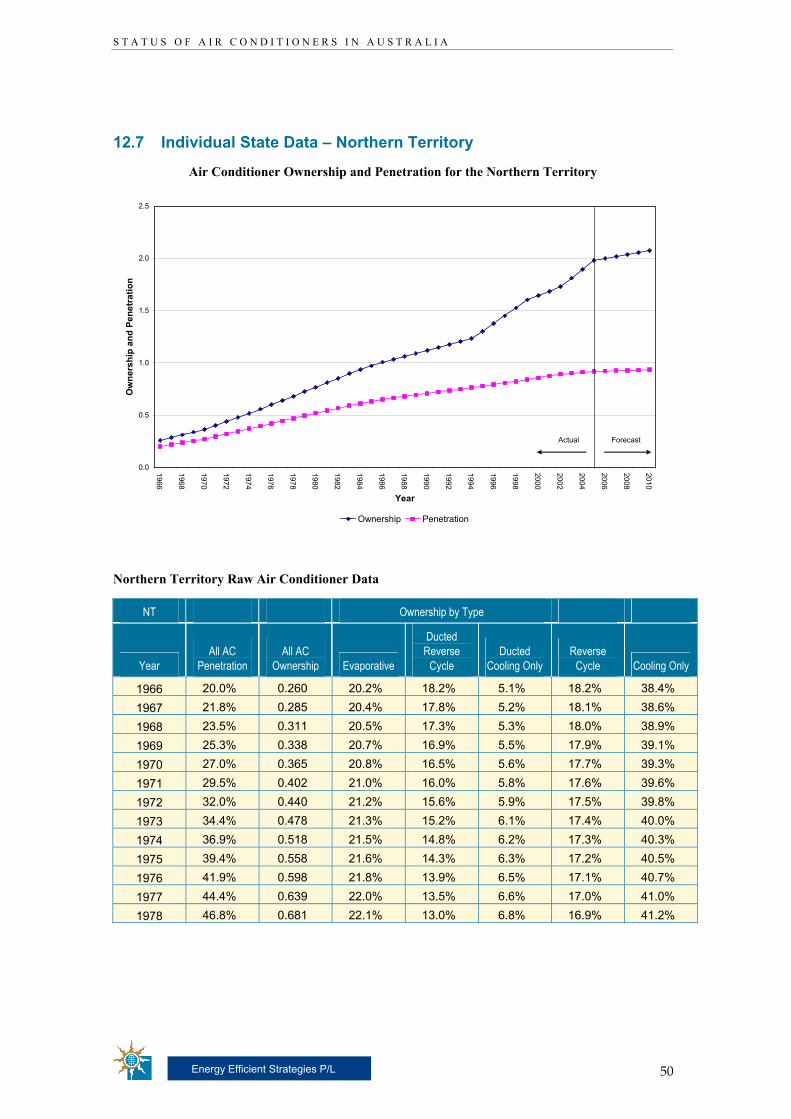
S T A T U S O F A I R C O N D I T I O N E R S I N A U S T R A L I A
50
Energy Efficient Strategies P/L
12.7 Individual State Data – Northern Territory
Air Conditioner Ownership and Penetration for the Northern Territory
0.0
0.5
1.0
1.5
2.0
2.5
1966
1968
1970
1972
1974
1976
1978
1980
1982
1984
1986
1988
1990
1992
1994
1996
1998
2000
2002
2004
2006
2008
2010
Year
Ow
ners
hip
and
Pene
trat
ion
Ownership Penetration
ForecastActual
Northern Territory Raw Air Conditioner Data
NT Ownership by Type
Year All AC
Penetration All AC
Ownership Evaporative
Ducted Reverse
Cycle Ducted
Cooling Only Reverse
Cycle Cooling Only
1966 20.0% 0.260 20.2% 18.2% 5.1% 18.2% 38.4%1967 21.8% 0.285 20.4% 17.8% 5.2% 18.1% 38.6%1968 23.5% 0.311 20.5% 17.3% 5.3% 18.0% 38.9%1969 25.3% 0.338 20.7% 16.9% 5.5% 17.9% 39.1%1970 27.0% 0.365 20.8% 16.5% 5.6% 17.7% 39.3%1971 29.5% 0.402 21.0% 16.0% 5.8% 17.6% 39.6%1972 32.0% 0.440 21.2% 15.6% 5.9% 17.5% 39.8%1973 34.4% 0.478 21.3% 15.2% 6.1% 17.4% 40.0%1974 36.9% 0.518 21.5% 14.8% 6.2% 17.3% 40.3%1975 39.4% 0.558 21.6% 14.3% 6.3% 17.2% 40.5%1976 41.9% 0.598 21.8% 13.9% 6.5% 17.1% 40.7%1977 44.4% 0.639 22.0% 13.5% 6.6% 17.0% 41.0%1978 46.8% 0.681 22.1% 13.0% 6.8% 16.9% 41.2%
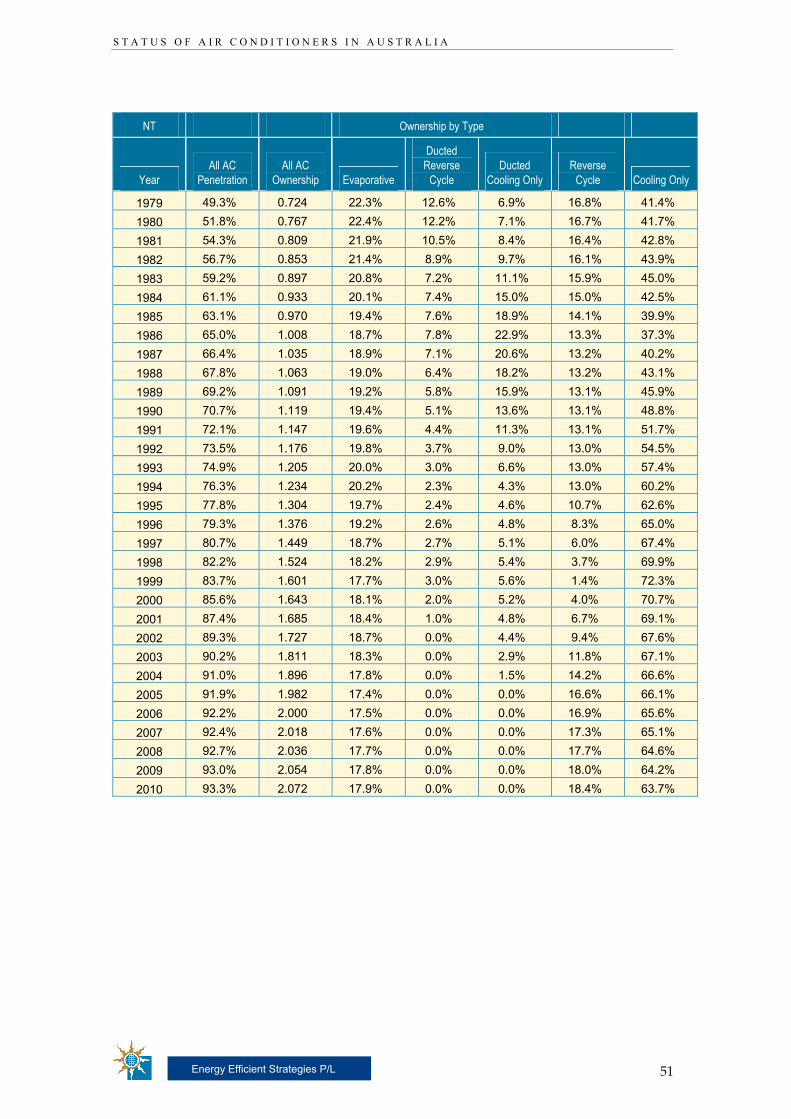
S T A T U S O F A I R C O N D I T I O N E R S I N A U S T R A L I A
51
Energy Efficient Strategies P/L
NT Ownership by Type
Year All AC
Penetration All AC
Ownership Evaporative
Ducted Reverse
Cycle Ducted
Cooling Only Reverse
Cycle Cooling Only
1979 49.3% 0.724 22.3% 12.6% 6.9% 16.8% 41.4%1980 51.8% 0.767 22.4% 12.2% 7.1% 16.7% 41.7%1981 54.3% 0.809 21.9% 10.5% 8.4% 16.4% 42.8%1982 56.7% 0.853 21.4% 8.9% 9.7% 16.1% 43.9%1983 59.2% 0.897 20.8% 7.2% 11.1% 15.9% 45.0%1984 61.1% 0.933 20.1% 7.4% 15.0% 15.0% 42.5%1985 63.1% 0.970 19.4% 7.6% 18.9% 14.1% 39.9%1986 65.0% 1.008 18.7% 7.8% 22.9% 13.3% 37.3%1987 66.4% 1.035 18.9% 7.1% 20.6% 13.2% 40.2%1988 67.8% 1.063 19.0% 6.4% 18.2% 13.2% 43.1%1989 69.2% 1.091 19.2% 5.8% 15.9% 13.1% 45.9%1990 70.7% 1.119 19.4% 5.1% 13.6% 13.1% 48.8%1991 72.1% 1.147 19.6% 4.4% 11.3% 13.1% 51.7%1992 73.5% 1.176 19.8% 3.7% 9.0% 13.0% 54.5%1993 74.9% 1.205 20.0% 3.0% 6.6% 13.0% 57.4%1994 76.3% 1.234 20.2% 2.3% 4.3% 13.0% 60.2%1995 77.8% 1.304 19.7% 2.4% 4.6% 10.7% 62.6%1996 79.3% 1.376 19.2% 2.6% 4.8% 8.3% 65.0%1997 80.7% 1.449 18.7% 2.7% 5.1% 6.0% 67.4%1998 82.2% 1.524 18.2% 2.9% 5.4% 3.7% 69.9%1999 83.7% 1.601 17.7% 3.0% 5.6% 1.4% 72.3%2000 85.6% 1.643 18.1% 2.0% 5.2% 4.0% 70.7%2001 87.4% 1.685 18.4% 1.0% 4.8% 6.7% 69.1%2002 89.3% 1.727 18.7% 0.0% 4.4% 9.4% 67.6%2003 90.2% 1.811 18.3% 0.0% 2.9% 11.8% 67.1%2004 91.0% 1.896 17.8% 0.0% 1.5% 14.2% 66.6%2005 91.9% 1.982 17.4% 0.0% 0.0% 16.6% 66.1%2006 92.2% 2.000 17.5% 0.0% 0.0% 16.9% 65.6%2007 92.4% 2.018 17.6% 0.0% 0.0% 17.3% 65.1%2008 92.7% 2.036 17.7% 0.0% 0.0% 17.7% 64.6%2009 93.0% 2.054 17.8% 0.0% 0.0% 18.0% 64.2%2010 93.3% 2.072 17.9% 0.0% 0.0% 18.4% 63.7%
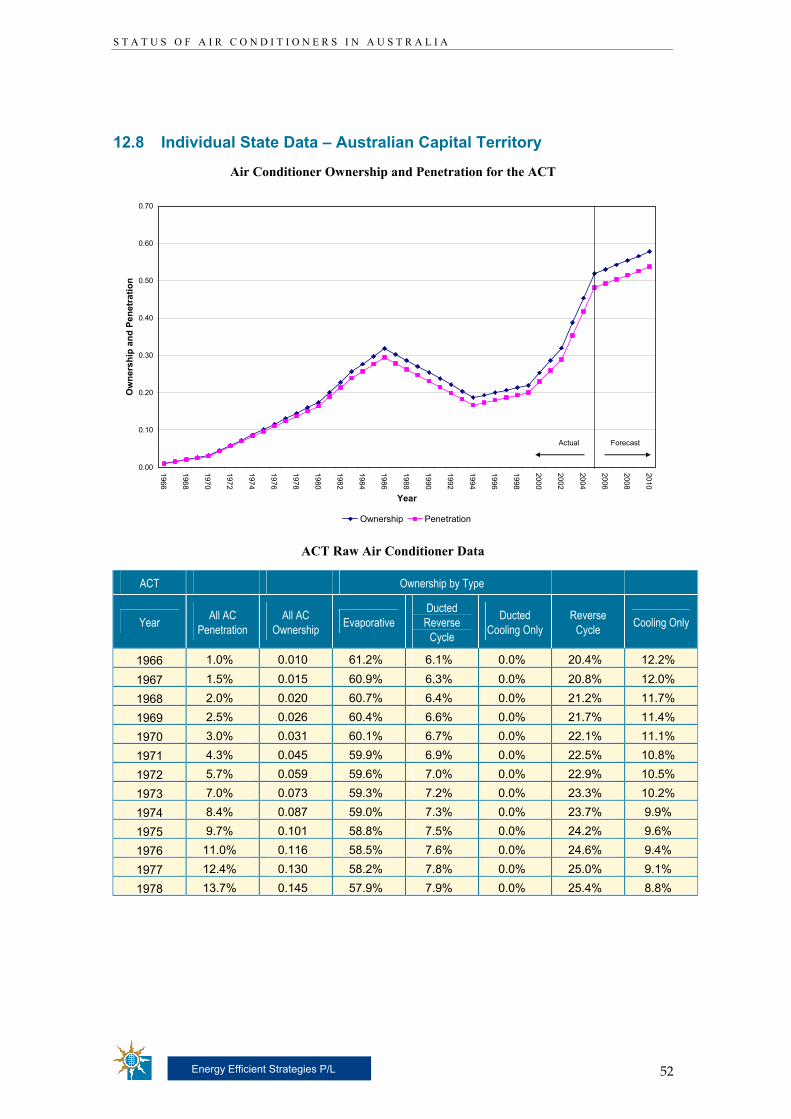
S T A T U S O F A I R C O N D I T I O N E R S I N A U S T R A L I A
52
Energy Efficient Strategies P/L
12.8 Individual State Data – Australian Capital Territory
Air Conditioner Ownership and Penetration for the ACT
0.00
0.10
0.20
0.30
0.40
0.50
0.60
0.70
1966
1968
1970
1972
1974
1976
1978
1980
1982
1984
1986
1988
1990
1992
1994
1996
1998
2000
2002
2004
2006
2008
2010
Year
Ow
ners
hip
and
Pene
trat
ion
Ownership Penetration
ForecastActual
ACT Raw Air Conditioner Data
ACT Ownership by Type
Year All AC Penetration
All AC Ownership Evaporative
Ducted Reverse
Cycle
Ducted Cooling Only
Reverse Cycle Cooling Only
1966 1.0% 0.010 61.2% 6.1% 0.0% 20.4% 12.2%
1967 1.5% 0.015 60.9% 6.3% 0.0% 20.8% 12.0%1968 2.0% 0.020 60.7% 6.4% 0.0% 21.2% 11.7%1969 2.5% 0.026 60.4% 6.6% 0.0% 21.7% 11.4%1970 3.0% 0.031 60.1% 6.7% 0.0% 22.1% 11.1%1971 4.3% 0.045 59.9% 6.9% 0.0% 22.5% 10.8%1972 5.7% 0.059 59.6% 7.0% 0.0% 22.9% 10.5%1973 7.0% 0.073 59.3% 7.2% 0.0% 23.3% 10.2%1974 8.4% 0.087 59.0% 7.3% 0.0% 23.7% 9.9%1975 9.7% 0.101 58.8% 7.5% 0.0% 24.2% 9.6%1976 11.0% 0.116 58.5% 7.6% 0.0% 24.6% 9.4%1977 12.4% 0.130 58.2% 7.8% 0.0% 25.0% 9.1%1978 13.7% 0.145 57.9% 7.9% 0.0% 25.4% 8.8%
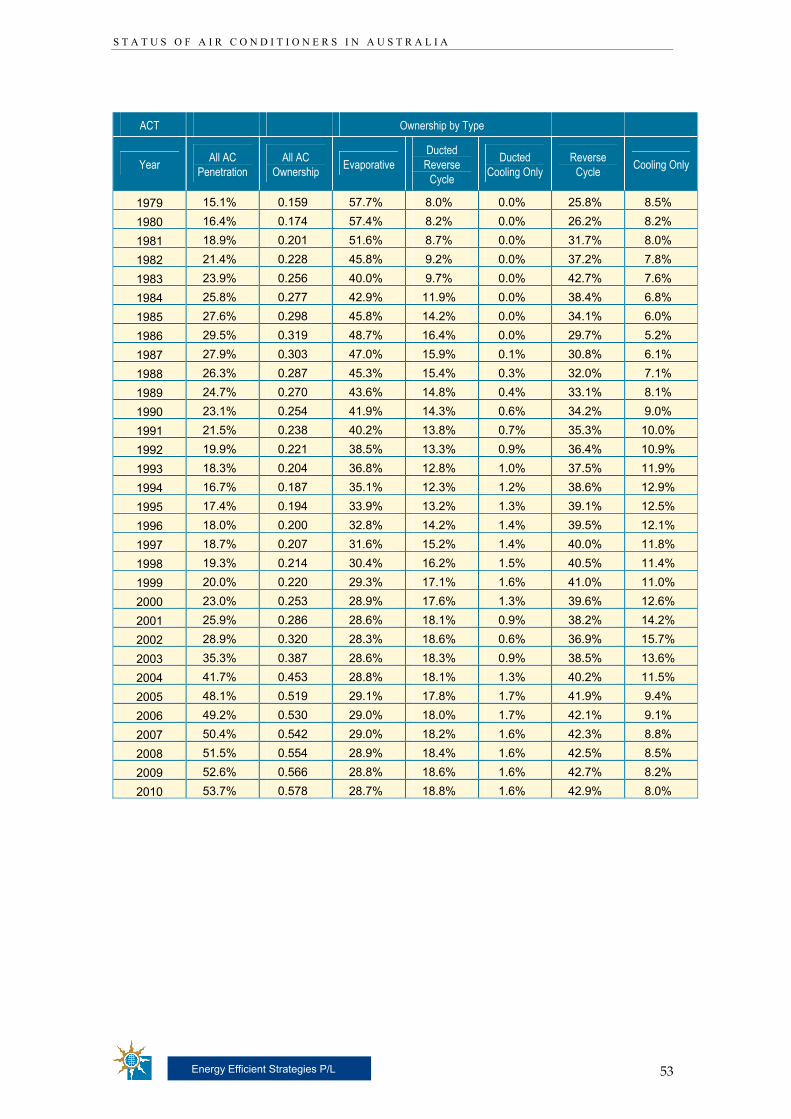
S T A T U S O F A I R C O N D I T I O N E R S I N A U S T R A L I A
53
Energy Efficient Strategies P/L
ACT Ownership by Type
Year All AC Penetration
All AC Ownership Evaporative
Ducted Reverse
Cycle
Ducted Cooling Only
Reverse Cycle Cooling Only
1979 15.1% 0.159 57.7% 8.0% 0.0% 25.8% 8.5%1980 16.4% 0.174 57.4% 8.2% 0.0% 26.2% 8.2%1981 18.9% 0.201 51.6% 8.7% 0.0% 31.7% 8.0%1982 21.4% 0.228 45.8% 9.2% 0.0% 37.2% 7.8%1983 23.9% 0.256 40.0% 9.7% 0.0% 42.7% 7.6%1984 25.8% 0.277 42.9% 11.9% 0.0% 38.4% 6.8%1985 27.6% 0.298 45.8% 14.2% 0.0% 34.1% 6.0%1986 29.5% 0.319 48.7% 16.4% 0.0% 29.7% 5.2%1987 27.9% 0.303 47.0% 15.9% 0.1% 30.8% 6.1%1988 26.3% 0.287 45.3% 15.4% 0.3% 32.0% 7.1%1989 24.7% 0.270 43.6% 14.8% 0.4% 33.1% 8.1%1990 23.1% 0.254 41.9% 14.3% 0.6% 34.2% 9.0%1991 21.5% 0.238 40.2% 13.8% 0.7% 35.3% 10.0%1992 19.9% 0.221 38.5% 13.3% 0.9% 36.4% 10.9%1993 18.3% 0.204 36.8% 12.8% 1.0% 37.5% 11.9%1994 16.7% 0.187 35.1% 12.3% 1.2% 38.6% 12.9%1995 17.4% 0.194 33.9% 13.2% 1.3% 39.1% 12.5%1996 18.0% 0.200 32.8% 14.2% 1.4% 39.5% 12.1%1997 18.7% 0.207 31.6% 15.2% 1.4% 40.0% 11.8%1998 19.3% 0.214 30.4% 16.2% 1.5% 40.5% 11.4%1999 20.0% 0.220 29.3% 17.1% 1.6% 41.0% 11.0%2000 23.0% 0.253 28.9% 17.6% 1.3% 39.6% 12.6%2001 25.9% 0.286 28.6% 18.1% 0.9% 38.2% 14.2%2002 28.9% 0.320 28.3% 18.6% 0.6% 36.9% 15.7%2003 35.3% 0.387 28.6% 18.3% 0.9% 38.5% 13.6%2004 41.7% 0.453 28.8% 18.1% 1.3% 40.2% 11.5%2005 48.1% 0.519 29.1% 17.8% 1.7% 41.9% 9.4%2006 49.2% 0.530 29.0% 18.0% 1.7% 42.1% 9.1%2007 50.4% 0.542 29.0% 18.2% 1.6% 42.3% 8.8%2008 51.5% 0.554 28.9% 18.4% 1.6% 42.5% 8.5%2009 52.6% 0.566 28.8% 18.6% 1.6% 42.7% 8.2%2010 53.7% 0.578 28.7% 18.8% 1.6% 42.9% 8.0%