Embed Size (px)
Citation preview
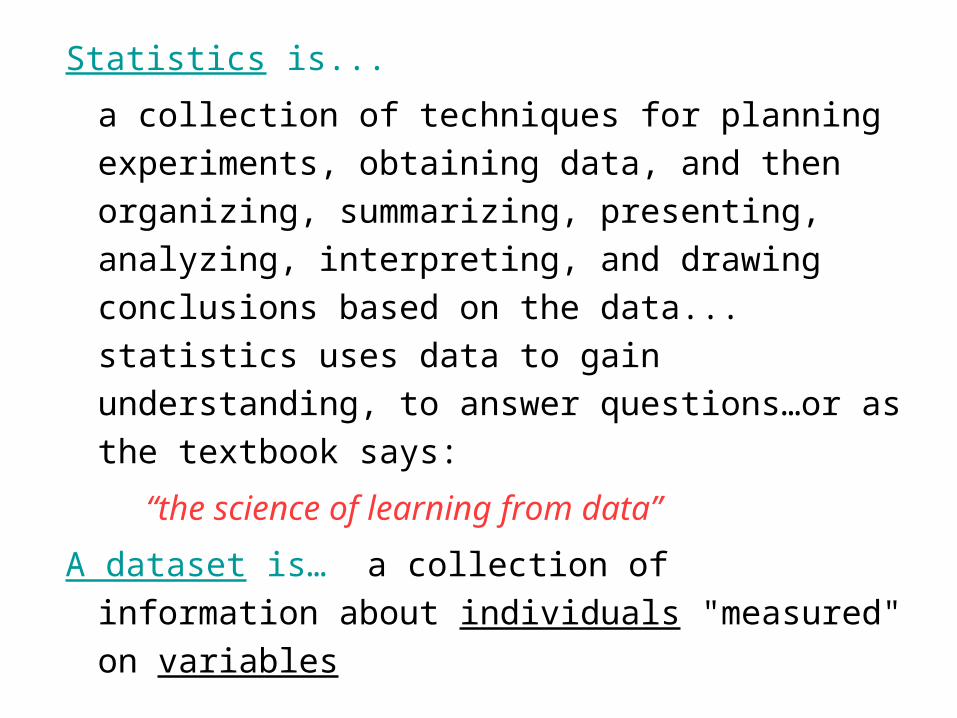
Statistics is...
a collection of techniques for planning
experiments, obtaining data, and then
organizing, summarizing, presenting,
analyzing, interpreting, and drawing
conclusions based on the data... statistics uses
data to gain understanding, to answer
questions…or as the textbook says:
“the science of learning from data”
A dataset is… a collection of information about
individuals "measured" on variables
A variable is… any characteristic of an individual or observation.a variable takes on different values for different observations… the distribution of a variabletells us what values it takes on and with what frequency or relative frequency. We are interested in analyzing the distributions of variables both graphically and numerically …
Variables come in two basic varieties…categorical - puts an individual into categories or
into its levelsquantitative - takes on numerical values, like
measurements or counts or rates
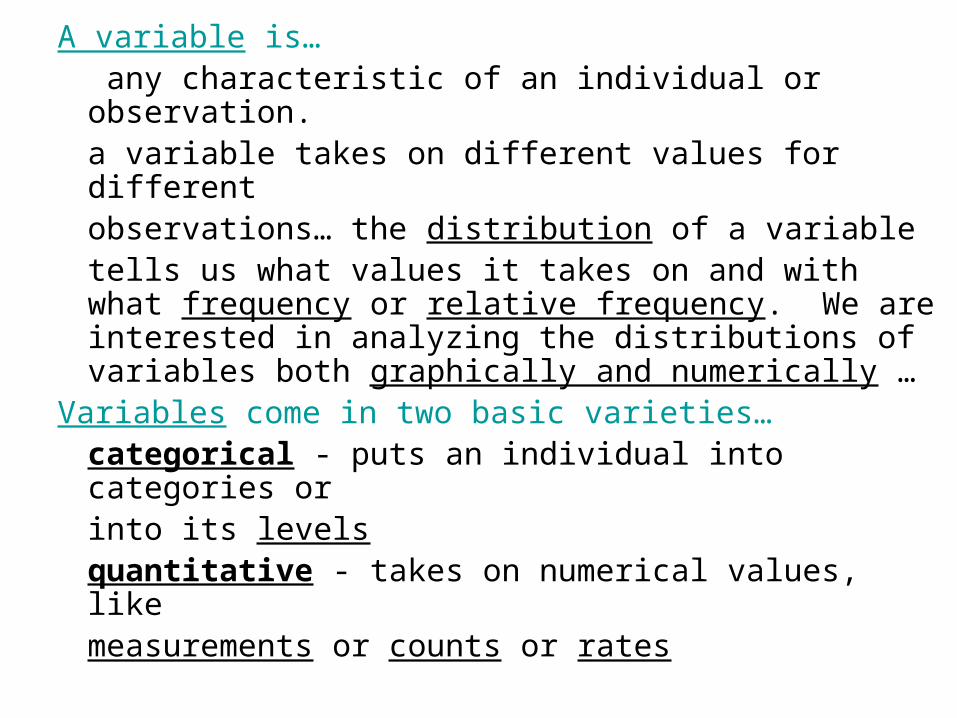
Two types of variables
•Variables can be either quantitative…
– Something that can be counted or measured for each individual and
then added, subtracted, averaged, etc. across individuals in the
population.
– Example: How tall you are, your age, your blood cholesterol level, the
number of credit cards you own, your heart rate
• … or categorical.
– Something that falls into one of several categories. What can be counted
is the count or proportion of individuals in each category.
– Example: Your blood type (A, B, AB, O), your hair color, your ethnicity,
whether you paid income tax last tax year or not
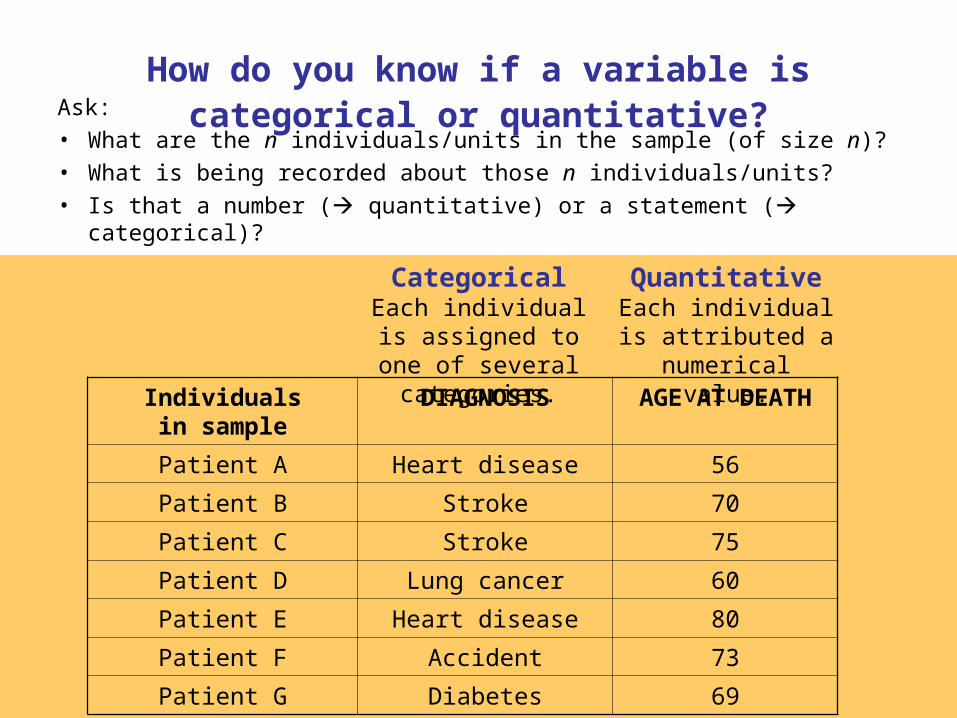
How do you know if a variable is categorical or quantitative?Ask:
• What are the n individuals/units in the sample (of size n)?• What is being recorded about those n individuals/units?• Is that a number ( quantitative) or a statement ( categorical)?
Individualsin sample
DIAGNOSIS AGE AT DEATH
Patient A Heart disease 56
Patient B Stroke 70
Patient C Stroke 75
Patient D Lung cancer 60
Patient E Heart disease 80
Patient F Accident 73
Patient G Diabetes 69
QuantitativeEach individual is
attributed a numerical value.
CategoricalEach individual is assigned to one of several categories.

Here's an example from a set of data we will look at later with JMP … note that it is a spreadsheet …
How many variables are there?
Which are categorical?
Which are quantitative?
How a set of data is
obtained is really important and we'll be looking into this in Chapter 3 …
QuickTime™ and a decompressor
are needed to see this picture.
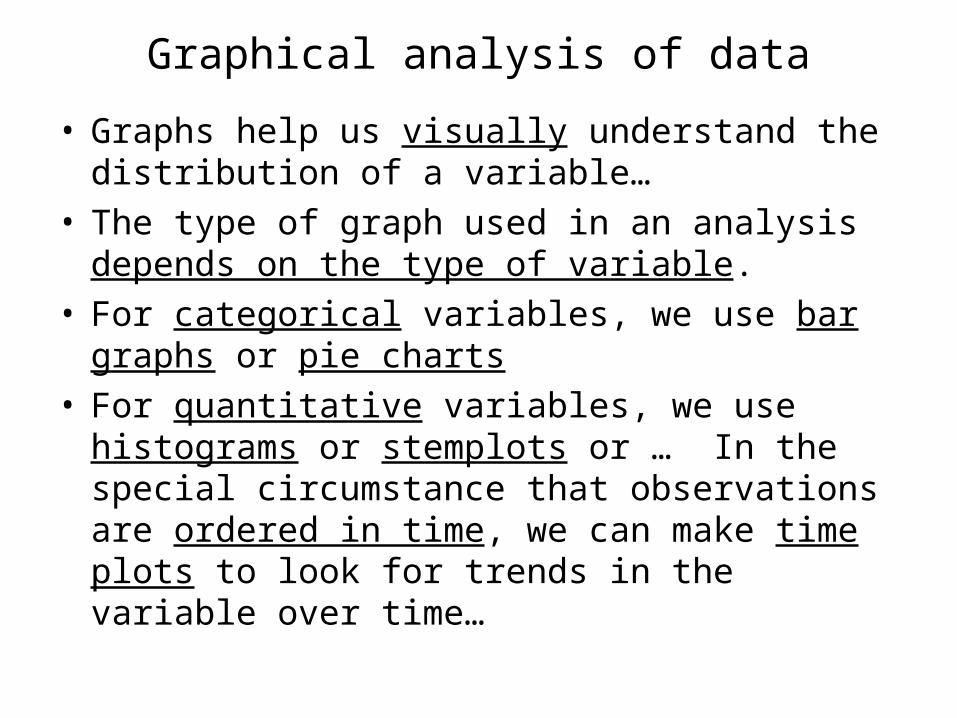
Graphical analysis of data
• Graphs help us visually understand the distribution of a variable…
• The type of graph used in an analysis depends on the type of variable.
• For categorical variables, we use bar graphs or pie charts
• For quantitative variables, we use histograms or stemplots or … In the special circumstance that observations are ordered in time, we can make time plots to look for trends in the variable over time…
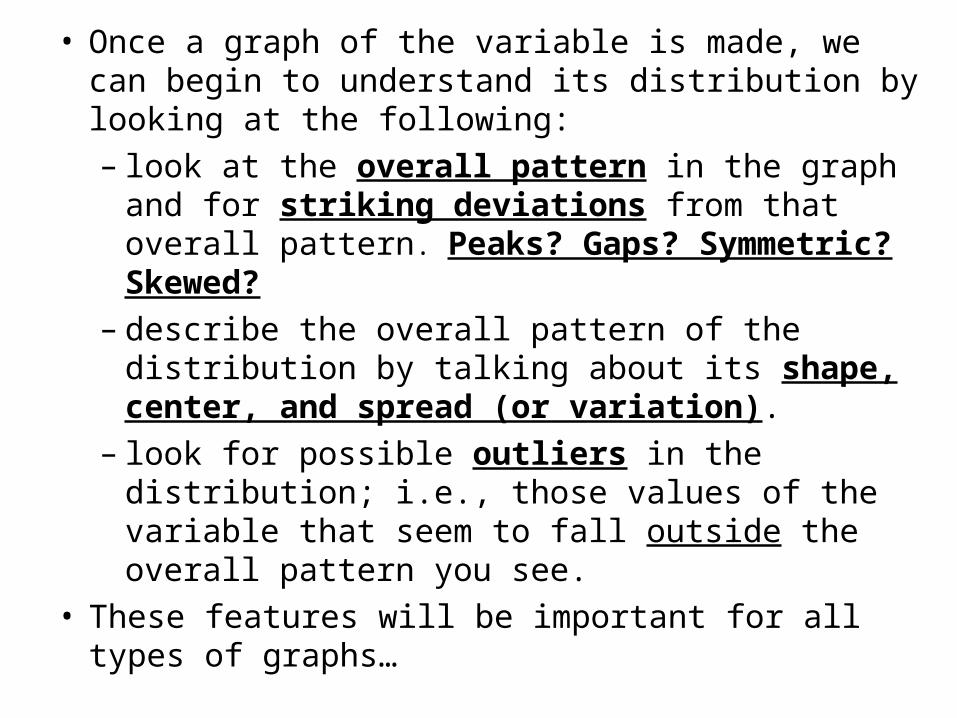
• Once a graph of the variable is made, we can begin to understand its distribution by looking at the following:– look at the overall pattern in the graph and for
striking deviations from that overall pattern.
Peaks? Gaps? Symmetric? Skewed?– describe the overall pattern of the distribution
by talking about its shape, center, and spread (or variation).
– look for possible outliers in the distribution; i.e., those values of the variable that seem to fall outside the overall pattern you see.
• These features will be important for all types of graphs…
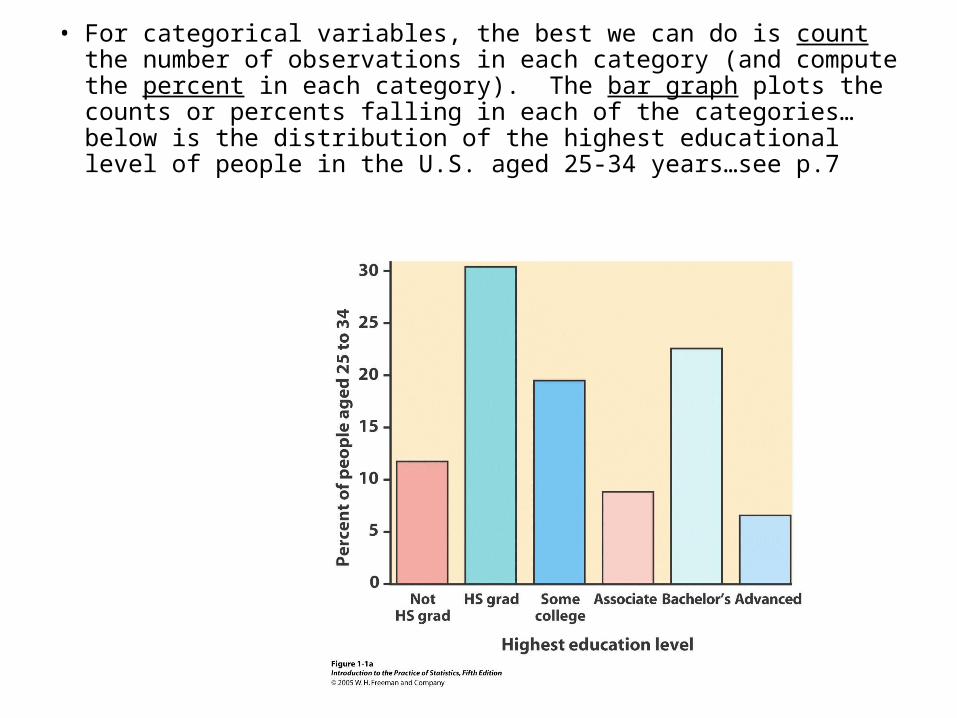
• For categorical variables, the best we can do is count the number of observations in each category (and compute the percent in each category). The bar graph plots the counts or percents falling in each of the categories… below is the distribution of the highest educational level of people in the U.S. aged 25-34 years…see p.7

Example: Top 10 causes of death in the United States 2001
Rank Causes of death Counts% of top10
% of total deaths
1 Heart disease 700,142 37% 29%
2 Cancer 553,768 29% 23%
3 Cerebrovascular 163,538 9% 7%
4 Chronic respiratory 123,013 6% 5%
5 Accidents 101,537 5% 4%
6 Diabetes mellitus 71,372 4% 3%
7 Flu and pneumonia 62,034 3% 3%
8 Alzheimer’s disease 53,852 3% 2%
9 Kidney disorders 39,480 2% 2%
10 Septicemia 32,238 2% 1%
All other causes 629,967 26%
For each individual who died in the United States in 2001, we record what was
the cause of death. The table above is a summary of that information. Why are
the percentages in the two columns different??

Child poverty before and after government
intervention—UNICEF, 1996
What does this chart tell you?
•The United States has the highest rate of child
poverty among developed nations (22% of
under 18).
•Its government does the least—through taxes
and subsidies—to remedy the problem (size of
white bars and percent difference between
white/blue bars).•One problem with this graph is the different
years’ data...
The poverty line is defined as 50% of national median income.

Ways to graph quantitative data
• Line graphs: time plots
–Use when there is a meaningful sequence, like time. The line connecting the points helps emphasize any change over time.
• Histograms and stemplots–These are summary graphs for a single variable. They are very useful to understand the pattern of variability in the data.
• Other graphs to reflect numerical summaries.
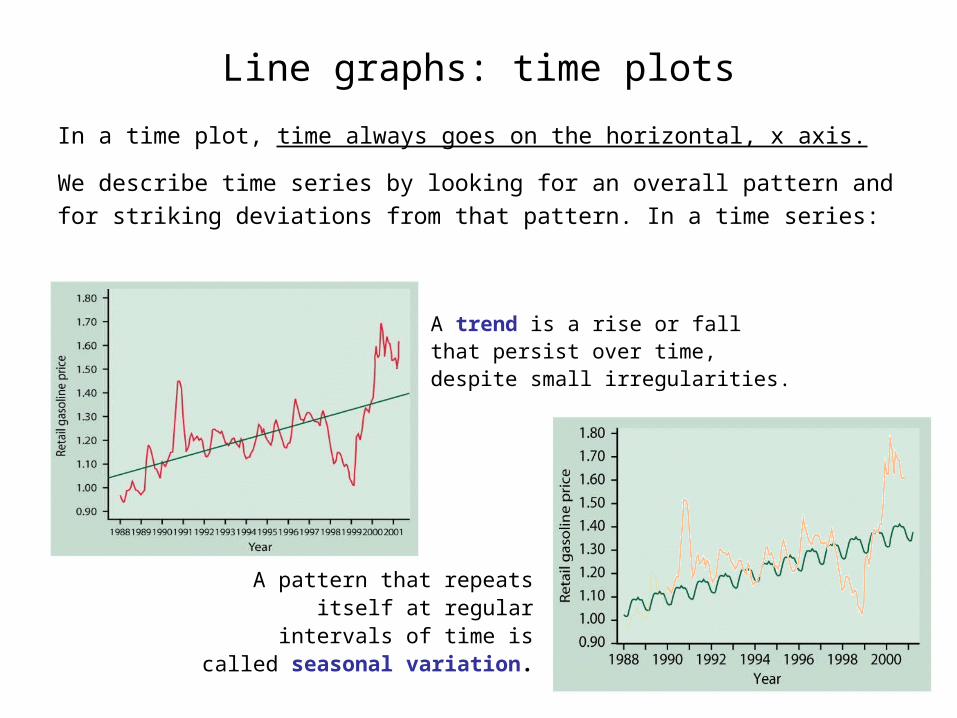
Line graphs: time plots
A trend is a rise or fall that persist over time, despite small irregularities.
In a time plot, time always goes on the horizontal, x axis.
We describe time series by looking for an overall pattern and for
striking deviations from that pattern. In a time series:
A pattern that repeats itself at regular intervals of time is
called seasonal variation.

• For quantitative variables, we'll consider both stemplots and histograms - stemplots are much easier to draw and interpret… see the box on page 10 and consider the female literacy rates in Islamic countries in Ex.1.7 The tens digit become the stem, and the units digit becomes the leaf (see Fig. 1.5)
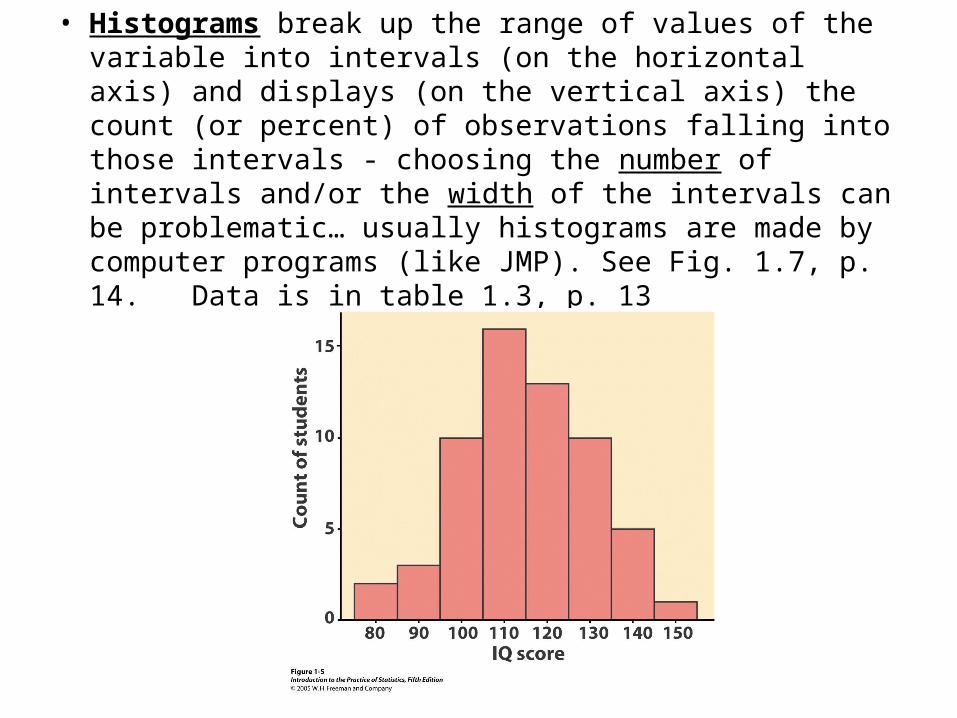
• Histograms break up the range of values of the variable into intervals (on the horizontal axis) and displays (on the vertical axis) the count (or percent) of observations falling into those intervals - choosing the number of intervals and/or the width of the intervals can be problematic… usually histograms are made by computer programs (like JMP). See Fig. 1.7, p. 14. Data is in table 1.3, p. 13
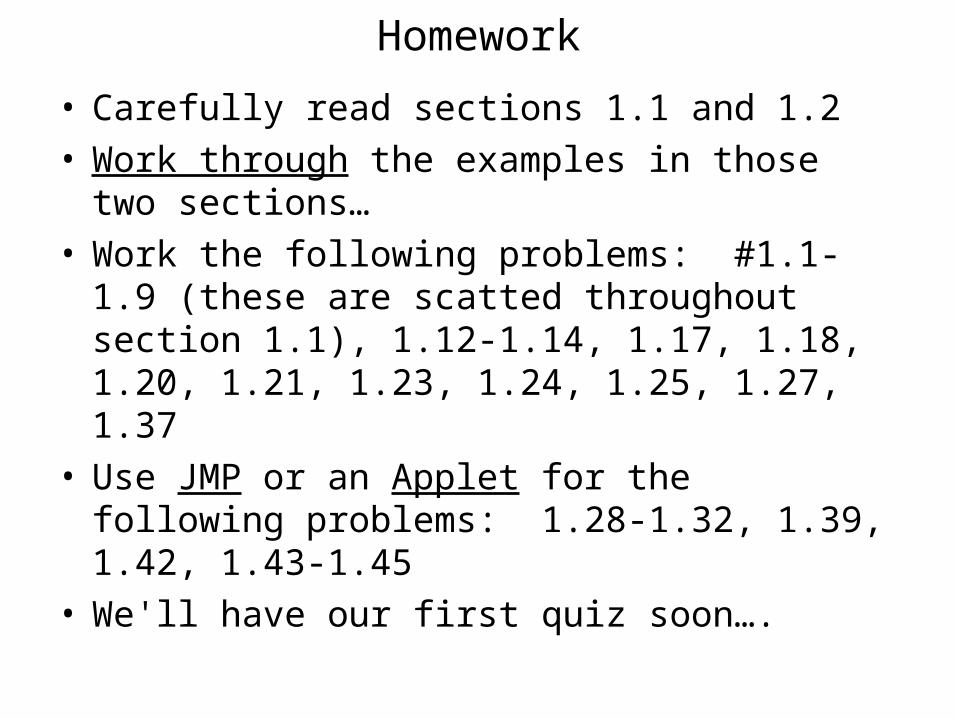
Homework
• Carefully read sections 1.1 and 1.2 • Work through the examples in those two
sections…• Work the following problems: #1.1-1.9 (these
are scatted throughout section 1.1), 1.12-1.14, 1.17, 1.18, 1.20, 1.21, 1.23, 1.24, 1.25, 1.27, 1.37
• Use JMP or an Applet for the following problems: 1.28-1.32, 1.39, 1.42, 1.43-1.45
• We'll have our first quiz soon….