Embed Size (px)
Citation preview
Statistics and Air Pollution
Prof. Montserrat Fuentes Statistics Department NCSU
Member of the EPA Science Advisory board, and the National Academies panel studying
link of ozone and mortality.

What is Statistics?
According to the ASA: “Statistics is the science of collection, analysis, and presentation of data. Statisticians use data to solve problems in a wide variety of fields.”
The Miriam-Webster Dictionary uses a subtlety different
definition: a branch of mathematics dealing with the collection, analysis, interpretation, and presentation of masses of numerical data.
All these definitions reflect our strong disciplinary roots in
handling data in real world applications

The Rise of Statistics as a Discipline
• In Europe, the history of statistics goes back to the1600s
• But things were a bit slower in the US …
• What is a discipline? Per the Council of Graduate Schools:
Established a theory and body of literature Significant number of professionals working in the field Several regularly published professional journals
• US Statistics had met these criteria by the end of World
War II

Key influences
• Key influence –The Great Depression Statistics was one subject that expanded (Joseph Doob) • Key influence –World War II Control charts Acceptance sampling Theory of games Decision theory Immigration of European statisticians Post-war industry and development More opportunities for women and minorities • Key influence –Agriculture
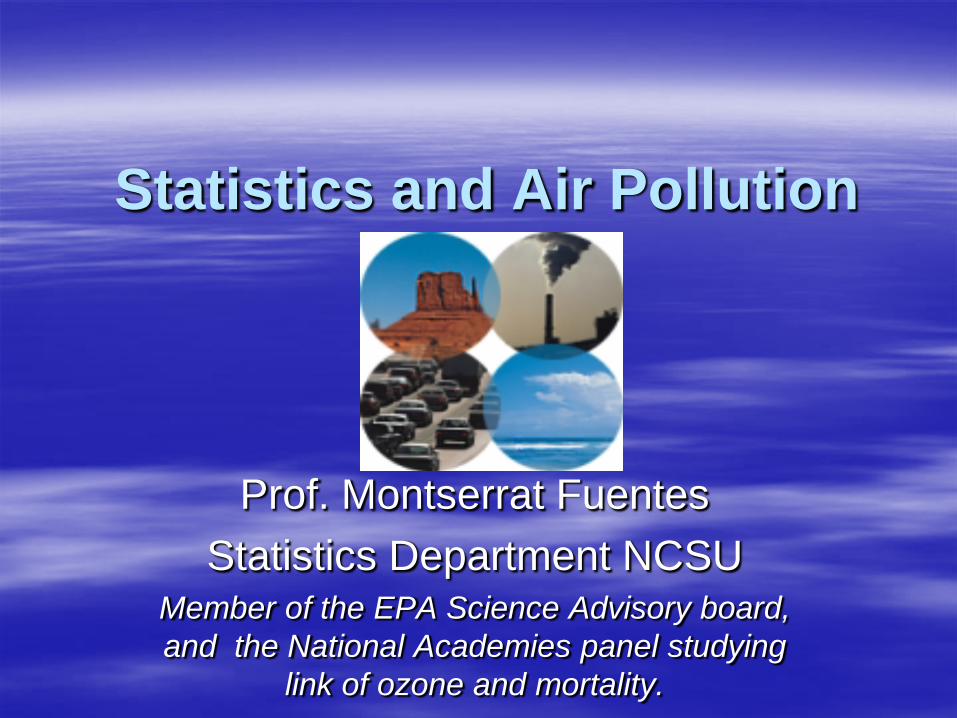
• 1839 –ASA founded • 1888 –beginning of JASA • 1918 –Dept of Biometry & Vital Statistics, JHU, Raymond Pearl • 1930 –beginning of Annals of Math Stat • 1933 –Iowa State’s Statistical Lab, George Snedecor; dept in
1947 • 1935 –Dept of Statistics at George Washington Univ, Frank
Weida • 1935 –IMS organized • 1938 –UC Berkeley’s Statistical Lab, Jerzy Neyman, dept in 1955 • 1941 –NC State’s Department of Statistics, Gertrude Cox • 1945 –beginning of Biometrics • 1946 –UNC Dept of Math Stat, Gertrude Cox & Harold Hotelling • 1947 –Biometric Society founded, Gertrude Cox • 1947 –beginning of American Statistician • 1949 –UNC Dept of Biost, Gertrude Cox & Bernard Greenburg

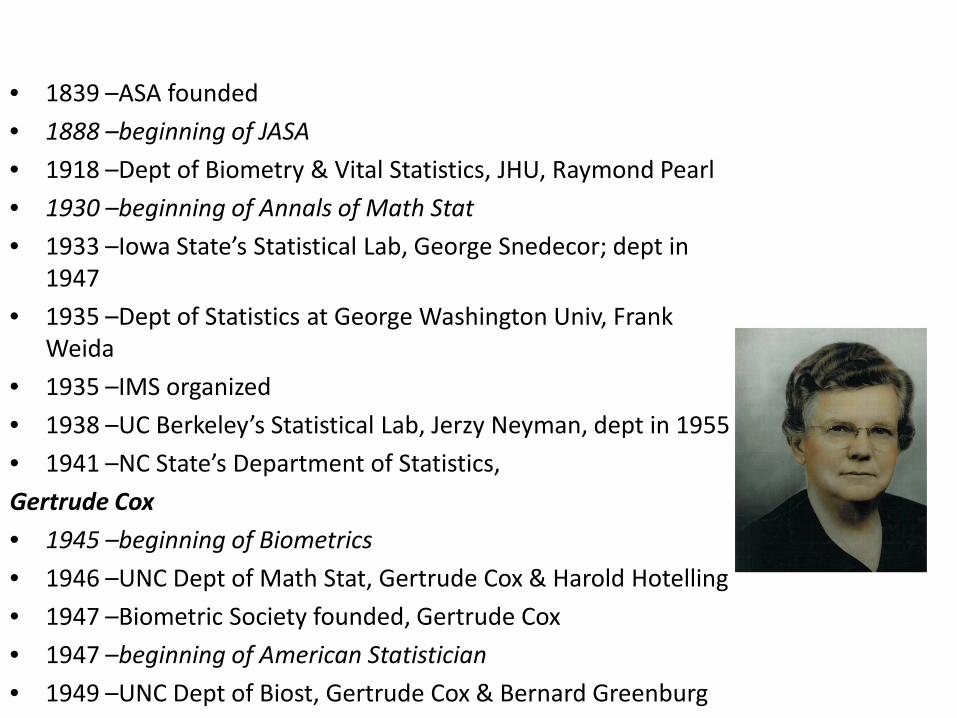
Dramatic increases in computing power, decreasing costs. Typical applied scientist now has massive computational power available at his/her desk
Early portable computers 100 times as heavy, 500 times as large, 10 times as much, 100 times slower than an iphone
In a Statistical Science interview with Brad Efron, Rob Tibshirani (Stanford)
says:
“One of the challenges I've found is that we're a funny field in a sense that lots of other people who aren't statisticians do statistics. We don't do chemistry or biology; we don't go into a lab and start filling up test tubes. Statistics is something you can do if you have a personal computer. So, it's a challenge in the sense that a lot of people think they can do it well, but aren't. We not only have to do good statistics, but also spread the word to other sciences about the right way to do things”
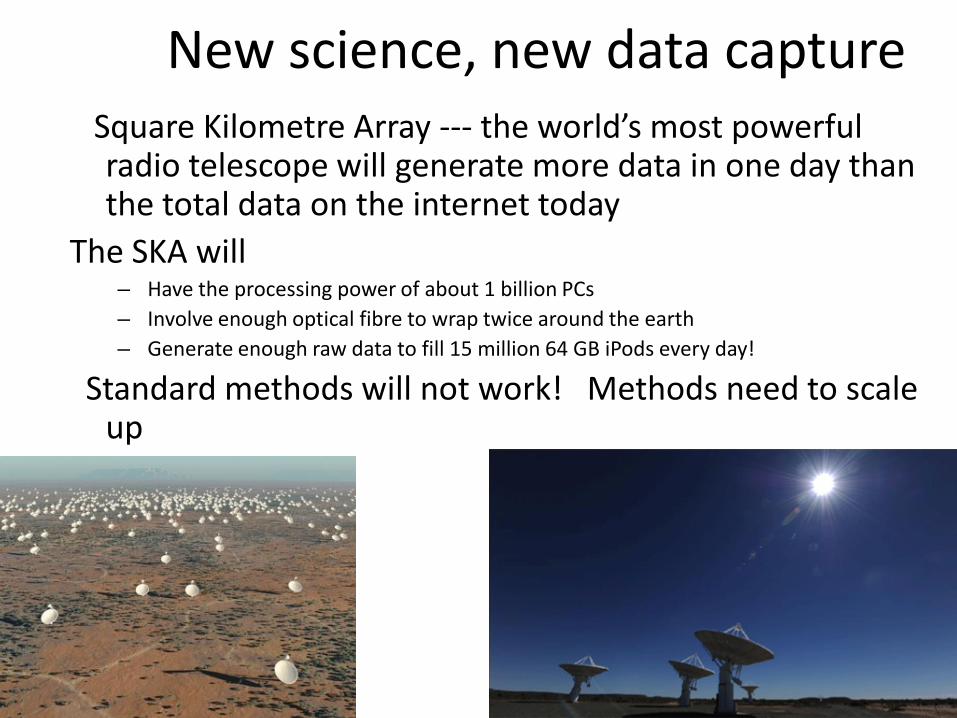
New science, new data capture Square Kilometre Array --- the world’s most powerful
radio telescope will generate more data in one day than the total data on the internet today
The SKA will – Have the processing power of about 1 billion PCs – Involve enough optical fibre to wrap twice around the earth – Generate enough raw data to fill 15 million 64 GB iPods every day!
Standard methods will not work! Methods need to scale up
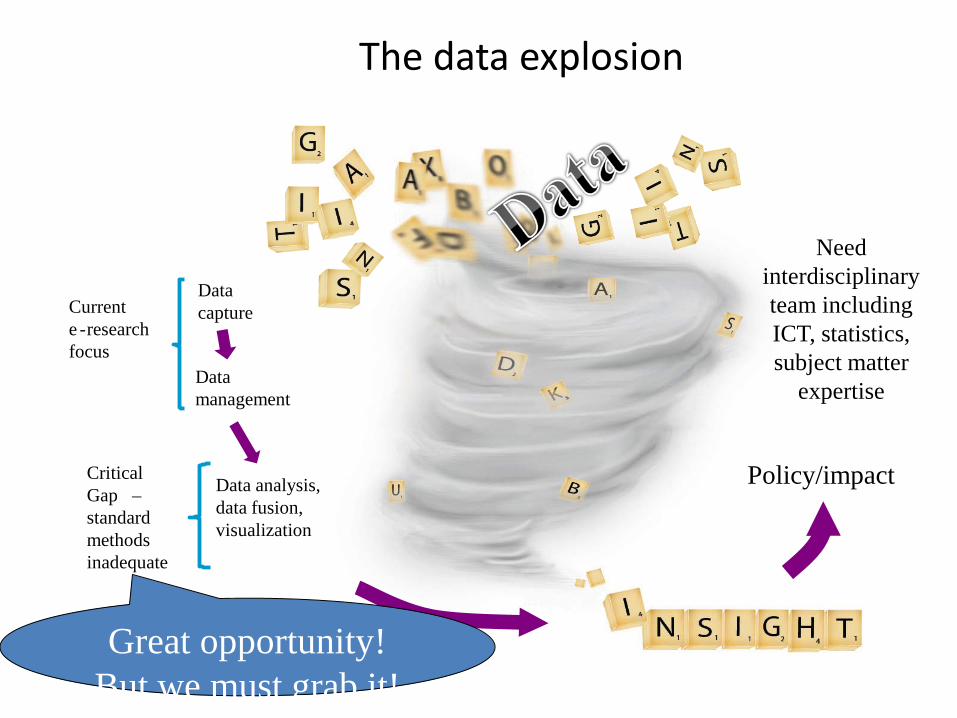
The data explosion
Policy/impact
Need interdisciplinary team including ICT, statistics, subject matter
expertise
Current e - research focus
Critical Gap – standard methods inadequate
Data capture
Data management
Data analysis, data fusion, visualization
Great opportunity! But we must grab it!

Some grand challenge problems: • Climate How will rainfall change in 50 years? • Weather How predictable is the weather tomorrow? • Chemistry How do human activities effect air quality? • Strategic applications How will a toxic agent disperse? • Environmental Health Does the air we breath kill? Combine using Statistical methods complex numerical
models with a variety of observations

Nelson’s Column during the Great Smog of 1952, and today
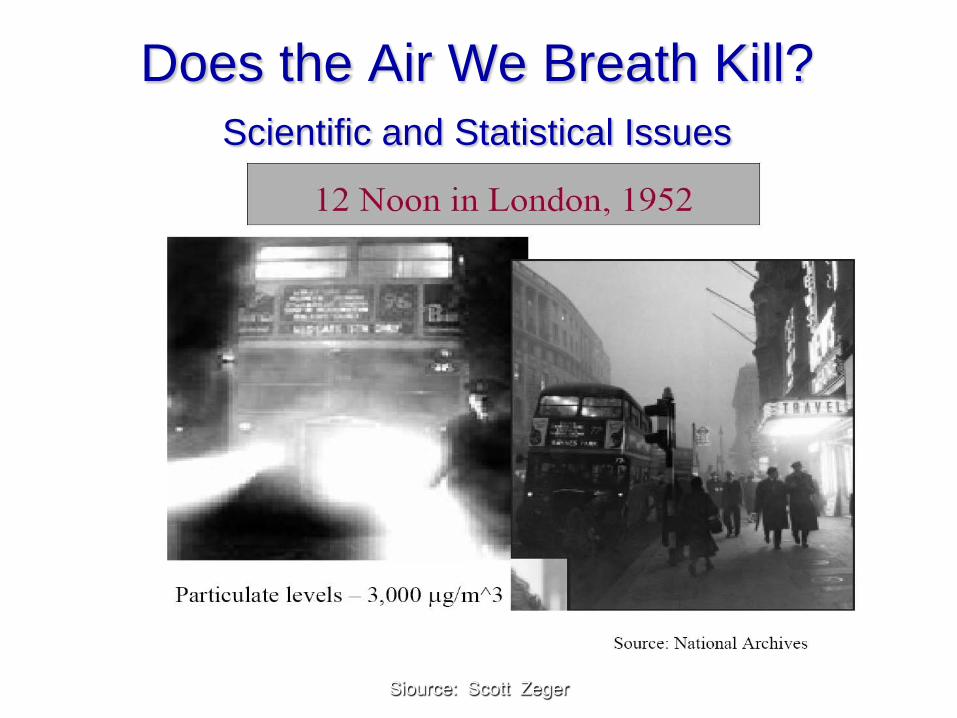
Does the Air We Breath Kill? Scientific and Statistical Issues
Siource: Scott Zeger

Source: Scott Zeger

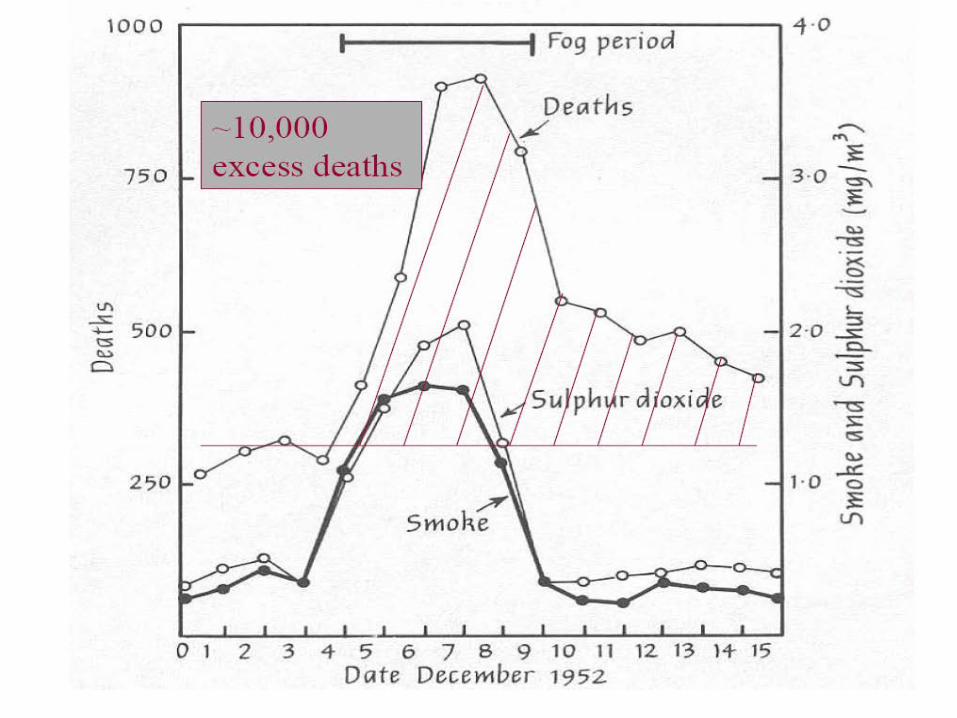
Health impacts of the London smog of 1952
In the winter of 1952 one of the worst air
pollution episodes on record took place in London. While it had long been known that air pollution can affect health, this event along with other extreme episodes catalyzed modern-day research of pollution and health as well as air pollution control regulations.
Air pollution affects people
• EPA estimates 10,000 pollution deaths per year.
• Smoking: 400,000 smoking deaths per year.

Laws for clean air
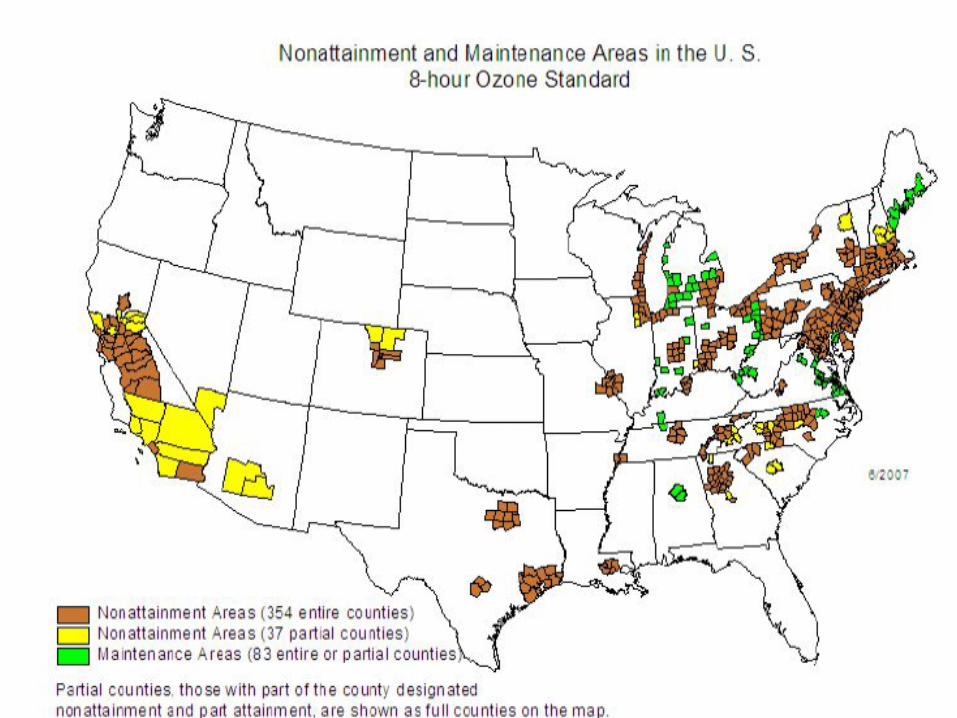
These laws are called the 'Clean Air Acts'. WHAT ARE THOSE BAD AIR POLLUTANTS? Ozone and particulate matter.

Ozone can be good or bad. It all depends on where it is. Ozone is good when it is high up in our atmosphere. It protects us from sunburn. Ozone is bad when it is near the ground where we can breathe it in.

We can't see ozone in the air. Bad ozone is sometimes called smog. It is formed when chemicals coming out of cars and
factories are cooked by the hot sun. Ozone is more of a problem in the summer.
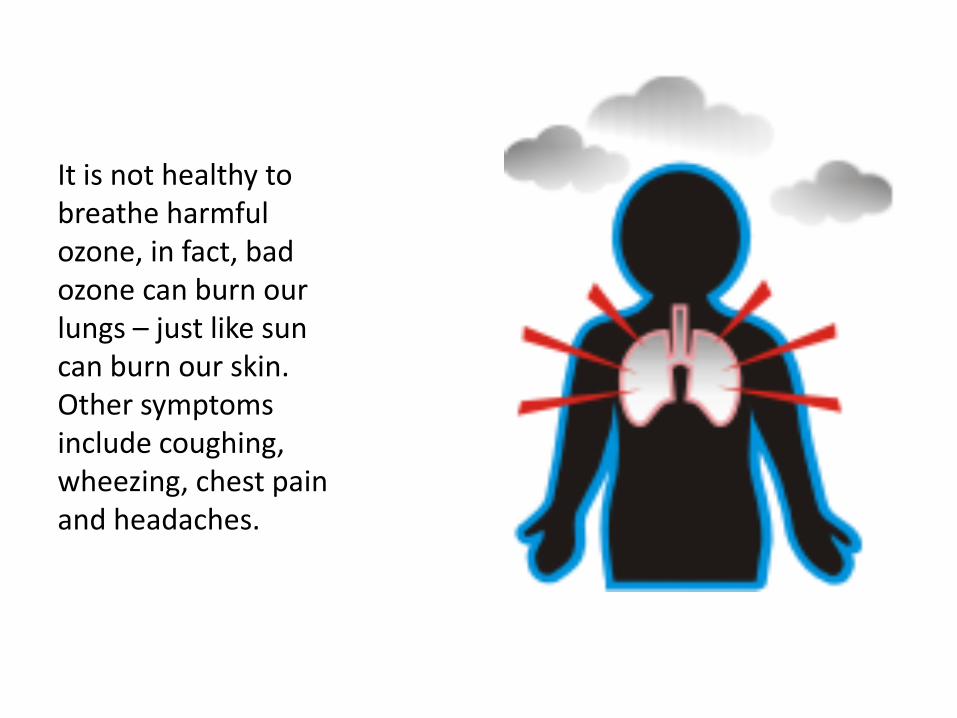
It is not healthy to breathe harmful ozone, in fact, bad ozone can burn our lungs – just like sun can burn our skin. Other symptoms include coughing, wheezing, chest pain and headaches.
Laws for air pollution.
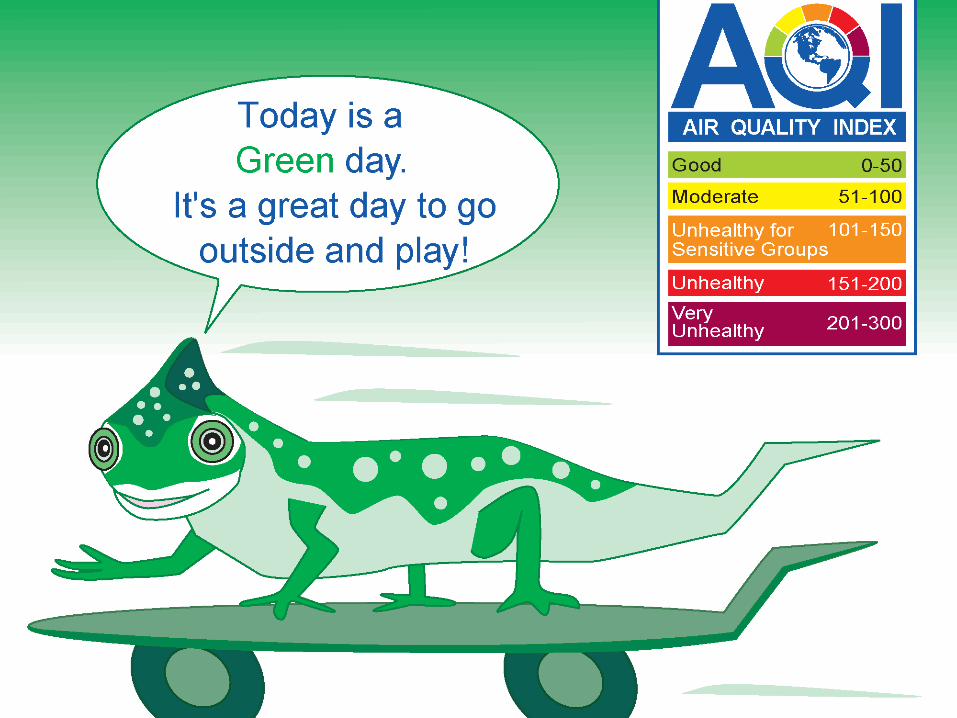
We have laws to keep our air clean. The Environmental Protection Agency tries to
make sure the ozone does not go “too high”.

Have you ever noticed a sunbeam with lots of little specks of dust floating in it?
That is particulate matter. Some particles are so small that we can't even see them - these are the ones that can penetrate deep into our lungs.

Particulate matter is mostly dust and soot so small that it floats in the air. These particles come from anything being burned.
Trucks and tractors, power plants, and wood-burning stoves make a lot of these small particles.

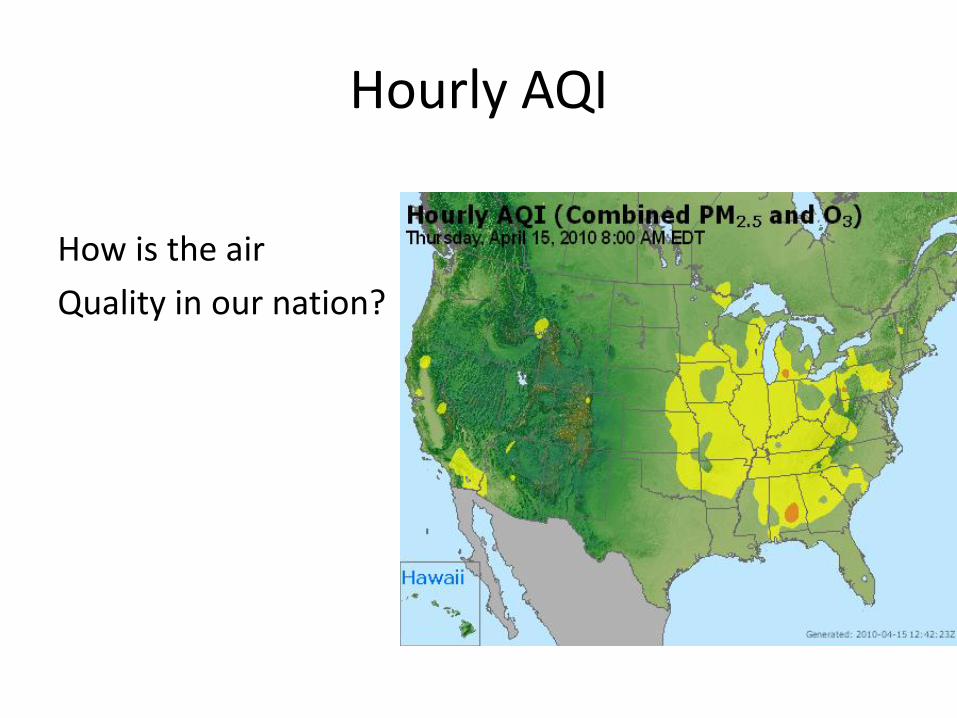
Hourly AQI
How is the air Quality in our nation?
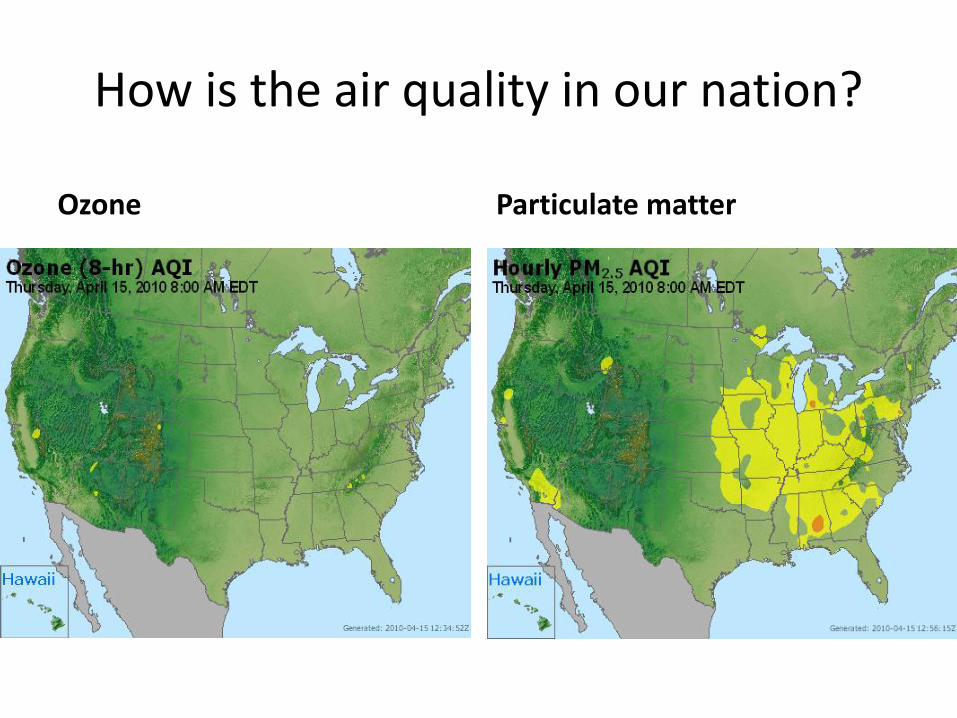
How is the air quality in our nation?
Ozone Particulate matter

Mecklenburg County , NC


Statistical challenges in quantifying “risk”
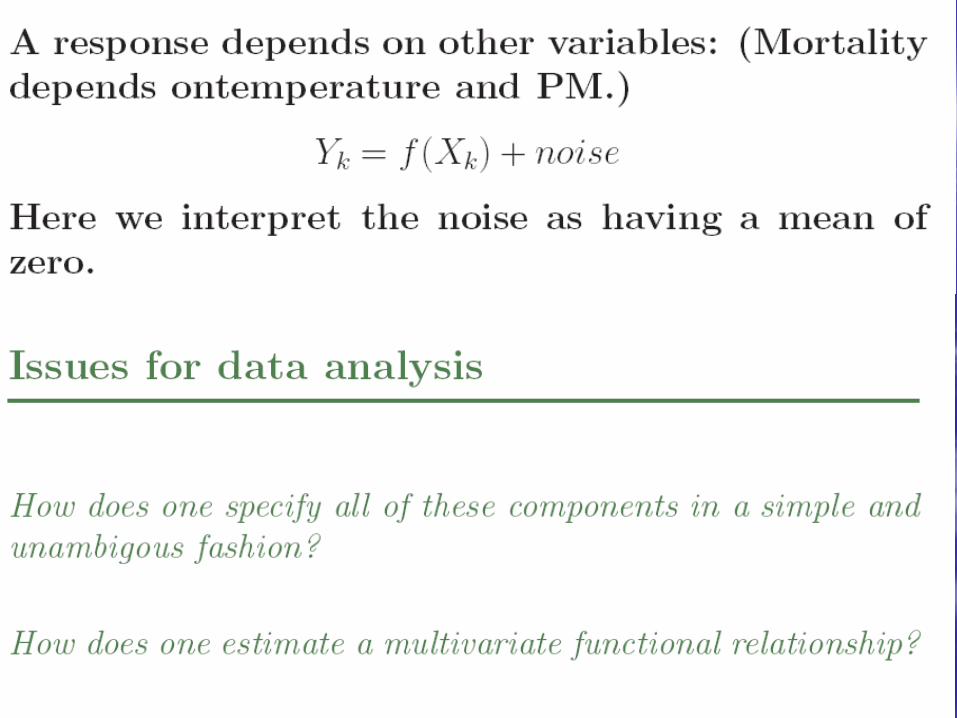

Statistical tools for the analysis of Mortality related to air pollution and temperature.
Effect of high levels of particulates (PM10) on short term, nonaccidental mortality rates.
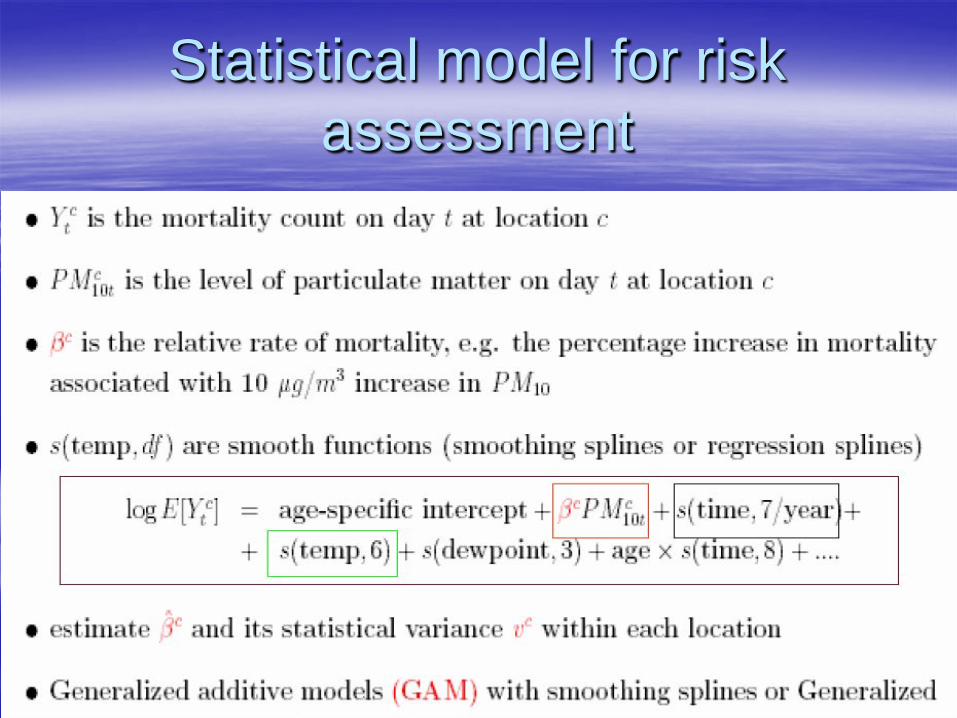
Statistical model for risk assessment


Risk of mortality due to PM10

How to estimate the economic benefits associated to new
standards After estimating the reduction in individuals’ risk of
premature death stemming from the proposed change, the number of premature deaths avoided due to the postulated reduction in ozone concentrations for the population at risk is obtained.
A central estimate of the economic value of these avoided deaths is then calculated using a central Value of Statistical Life (VSL) drawn from the available literature.

“Value of statistical life”: to determine the
benefits of air quality regulation 1. Assume that each person in a group of 10,000 is
willing to pay $500 for a policy that reduces the risk of dying in the next year from 5 per 10,000 to 4 per 10,000.
2. There will be one less death in this group if the policy is undertaken. But we can not know which of the 9,996 survivors would have died in without the policy.
3. The group had an aggregate willingness to pay of $5 million ($500 x 10,000) and one death was avoided.
4.The value of this statistical life is $5 million

The administrator, Stephen L. Johnson, said that by law he was
forbidden to consider costs in setting the standard, but urged Congress to change the law so future administrators could do just that. (New York times)
In defining the cost of implementing new standards, the economic benefits (using VSL) should be also taken into consideration.

Related issue: The impact of climate change on ozone and human health
Changes in ambient ozone levels are one of
the many ways in which climate change could affect human health. Our ongoing work investigates how climate change could alter ozone concentrations in the U.S. and the subsequent impacts on human health.

Reich, Fuentes and Dunson (2009)

Impact of climate change on air pollution regulation.
Due to the strong dependence on weather
conditions. Ozone levels may be sensitive to climate change.
Using future numerical climate models, we could forecast potential future increases or decreases in ozone levels.
Statistical models for forecasting air pollution.

Projected Summer Ozone Levels (2050’s vs. 1990’s)

Probabilities that the 3 year (2003-2005 left graph; and 2041-2043 right) average of the fourth highest daily max. 8-hour
average ozone exceeds 75 ppb.
Reich, Fuentes and Dunson (2009). Bayesian spatial quantile
regression.

We can achieve the dream ....
(Presentation by Hal Varian - Chief Economist, Google, to the 2008 Almaden Institute, Innovating with Information. "... with data in huge supply and statisticians in short supply, being a statistician has to be 'the really sexy job for the 2010s'.) Statistics- potential for a new age

This is our year! 2013 International Year of STATISTICS

Thank you!