Embed Size (px)
Citation preview
Statistical considerations when planning your
research project
Carolyn TaylorApplied Statistics and Data Science Group (ASDa)
Department of Statistics, UBC
November 8, 2016
Resources for statistical assistance
Department of Statistics at UBC:
www.stat.ubc.ca/how-can-you-get-help-your-data
SOS Program - An hour of free consulting to UBC graduatestudents. Funded by the Provost and VP Research Office.
STAT 551 - Stat grad students taking this course offer freestatistical advice. Fall semester every academic year.
Short Term Consulting Service - Advice from Stat grad students.Fee-for-service on small projects (less than 15 hours).
Hourly Projects - ASDa professional staff. Fee-for-service consulting.
Outline
Types of research studies
Planning your research study
Sample size calculations
Experimental design
Multiple comparisons
Types of analysis
Types of research studies
Sample Surveys
◮ Information about a population
Observational Studies
◮ Interested in comparing two or more groups◮ Assignment of groups is not controlled
Controlled Experiments
◮ Interested in comparing two or more groups◮ Group membership is assigned randomly
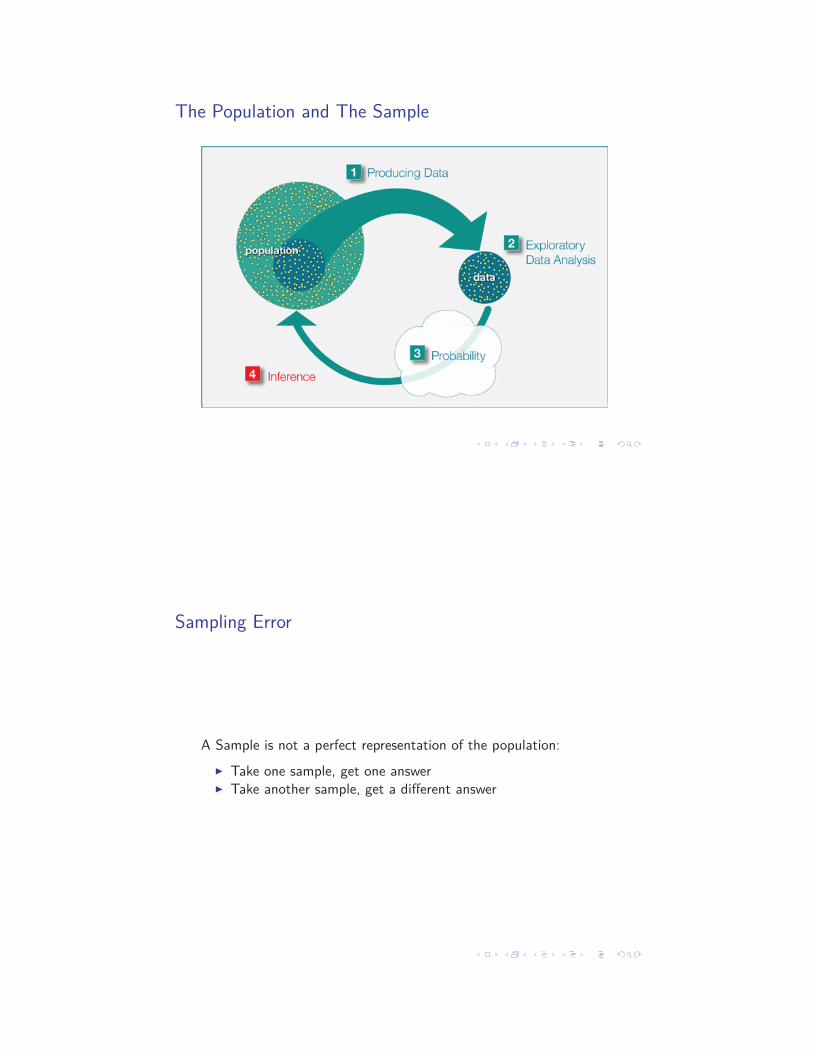
The Population and The Sample
Sampling Error
A Sample is not a perfect representation of the population:
◮ Take one sample, get one answer◮ Take another sample, get a different answer
Rasmussen US Election Poll
1500 people surveyed online and by phone two weeks ago
Estimated percentages from the sample: 45% Clinton, 42% Trump
Margin of Error: 42% - 48% Clinton, 39% - 45% Trump
Sample Surveys
Focus on certain characteristics of interest
Target Population of size N (usually finite)
Random sample of size n from the population
◮ yields data x1, . . . xn
Use data from the random sample to make inference about thecharacteristics of interest
◮ compute sample (point) estimates◮ compute error associated with those estimate◮ compute interval estimates with desired probability coverage
sampling fraction could be important n/N
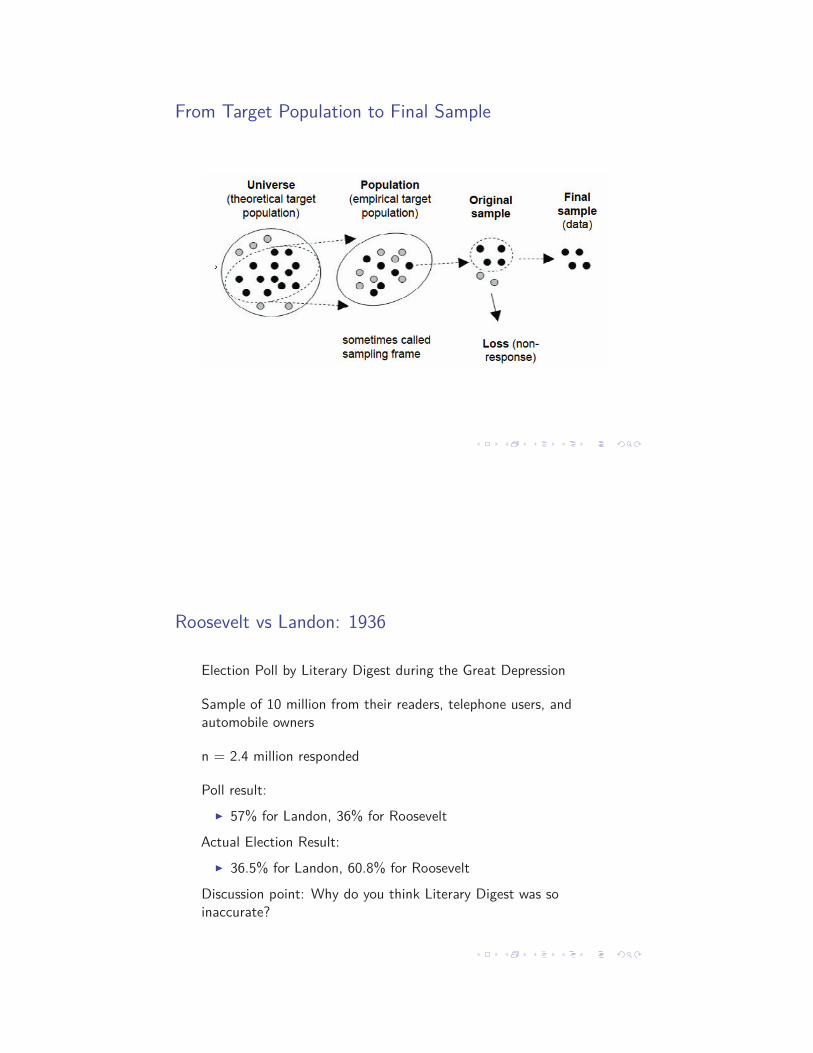
From Target Population to Final Sample
Roosevelt vs Landon: 1936
Election Poll by Literary Digest during the Great Depression
Sample of 10 million from their readers, telephone users, andautomobile owners
n = 2.4 million responded
Poll result:
◮ 57% for Landon, 36% for Roosevelt
Actual Election Result:
◮ 36.5% for Landon, 60.8% for Roosevelt
Discussion point: Why do you think Literary Digest was soinaccurate?
Issues with Sample Surveys
Establishing the sampling frame
Over-coverage or Under-coverage:
◮ Is the entire population in the sampling frame?◮ Are subjects outside the population in the sampling frame?
Selection bias
◮ is the sample representative of the population?
Non-response bias
◮ Do non-responders differ from responders?
Wording and order of the questions
Brexit
Supporters of the trailing opinion are less likely to respond tosurveys, biasing the result in favor of the more popular opinion
As the climate changes, the swings may be over exaggerated
http://uk.businessinsider.com/
pollsters-know-why-they-were-wrong-about-brexit-2016-7
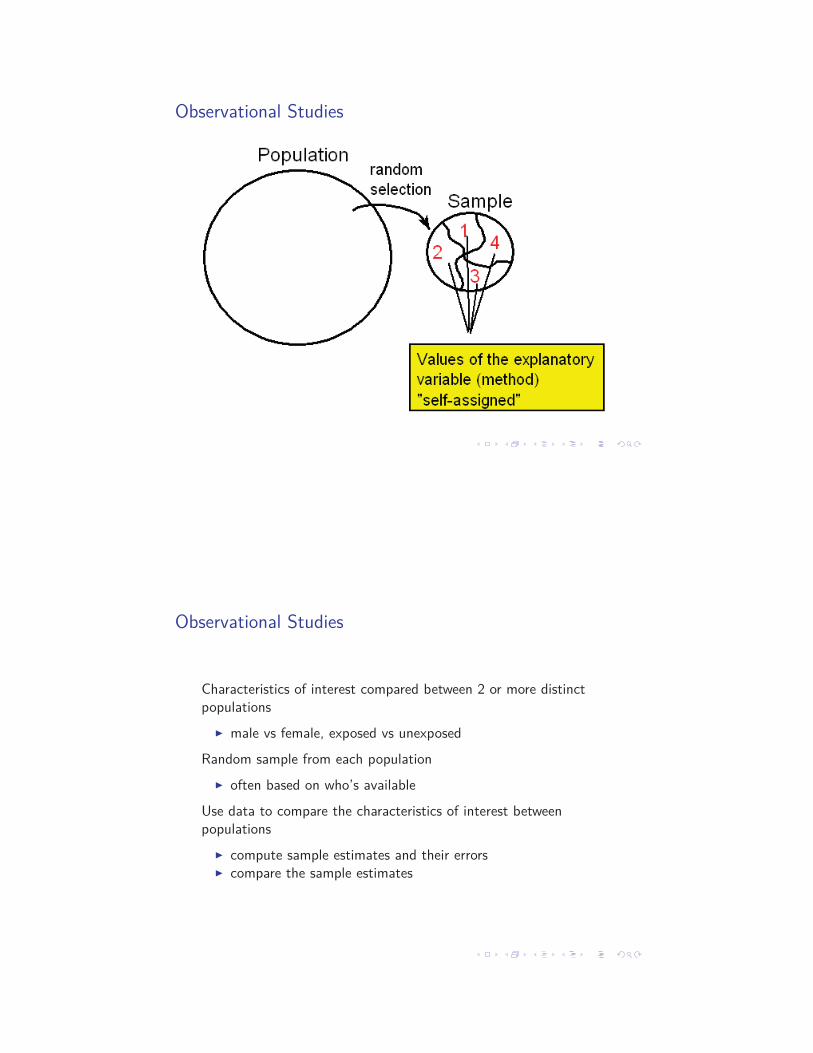
Observational Studies
Observational Studies
Characteristics of interest compared between 2 or more distinctpopulations
◮ male vs female, exposed vs unexposed
Random sample from each population
◮ often based on who’s available
Use data to compare the characteristics of interest betweenpopulations
◮ compute sample estimates and their errors◮ compare the sample estimates
Observational Studies
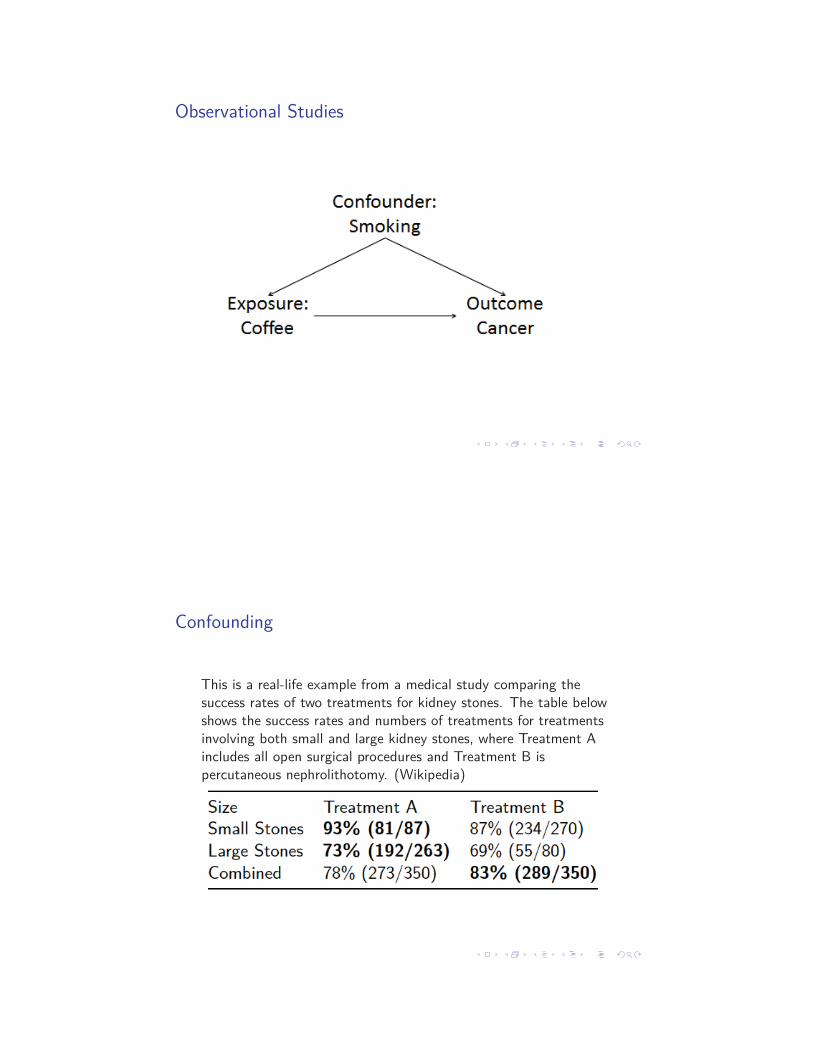
Confounding
This is a real-life example from a medical study comparing thesuccess rates of two treatments for kidney stones. The table belowshows the success rates and numbers of treatments for treatmentsinvolving both small and large kidney stones, where Treatment Aincludes all open surgical procedures and Treatment B ispercutaneous nephrolithotomy. (Wikipedia)
Issues with Observational Studies
Confounding is a major issue
◮ Differences could be due to another factor that differs acrossthe groups
◮ Analyses must adjust for such confounders◮ Extreme cases can lead to Simpsons paradox
Analyses can suggest, but not establish causality
◮ Bradford Hill’s criteria for causality
Controlled Experiments
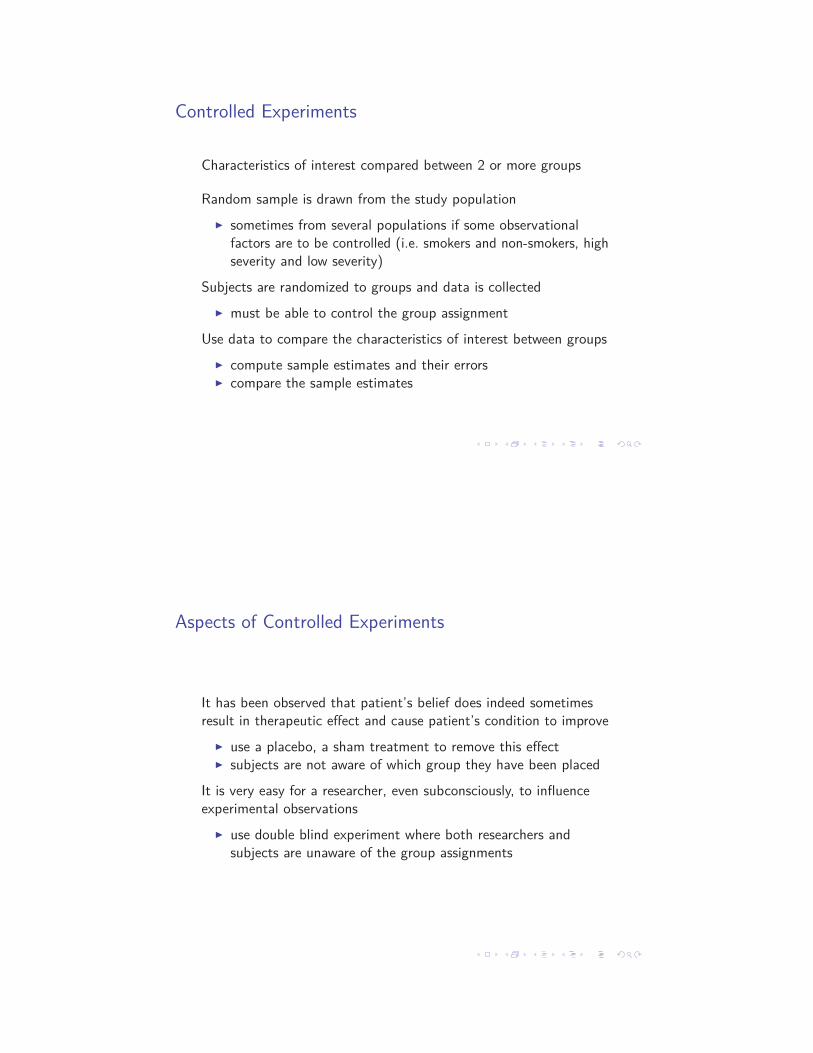
Controlled Experiments
Characteristics of interest compared between 2 or more groups
Random sample is drawn from the study population
◮ sometimes from several populations if some observationalfactors are to be controlled (i.e. smokers and non-smokers, highseverity and low severity)
Subjects are randomized to groups and data is collected
◮ must be able to control the group assignment
Use data to compare the characteristics of interest between groups
◮ compute sample estimates and their errors◮ compare the sample estimates
Aspects of Controlled Experiments
It has been observed that patient’s belief does indeed sometimesresult in therapeutic effect and cause patient’s condition to improve
◮ use a placebo, a sham treatment to remove this effect◮ subjects are not aware of which group they have been placed
It is very easy for a researcher, even subconsciously, to influenceexperimental observations
◮ use double blind experiment where both researchers andsubjects are unaware of the group assignments
The discipline of Statistics
Wikipedia: Statistics is the study of the collection, organization, andinterpretation of data
American Heritage Science Dictionary: The branch of mathematicsthat deals with the collection, organization, analysis, andinterpretation of numerical data
Merriam-Webster Dictionary: A branch of mathematics dealing withthe collection, analysis, interpretation, and presentation of masses ofnumerical data
Dictionary.com: the science that deals with the collection,classification, analysis, and interpretation of numerical facts or data,. . .
Planning your Study
Before you collect any data
Define the questions of interest
Determine the appropriate populations that will allow the questionsto be answered
Create a plan to sample the populations and a randomizationscheme if required
Determine what information (data) is needed from the sample toanswer the questions
Create an appropriate analysis plan
Determine the sample size needed
Defining the Question
What do you want to know?
Make sure questions are clear and focused
All questions should be based on the same populations or perhaps asubset
Each question should define a single hypothesis to test or quantityto measure
The Population
Who or what are you going to study?
Can you establish a proper sampling frame? Does it cover thepopulation of interest?
If the sampling frame is a subset of the population of interest and itvaries systematically from the population, the results cannot begeneralized
Observational studies usually compare more than 1 self selectingpopulation
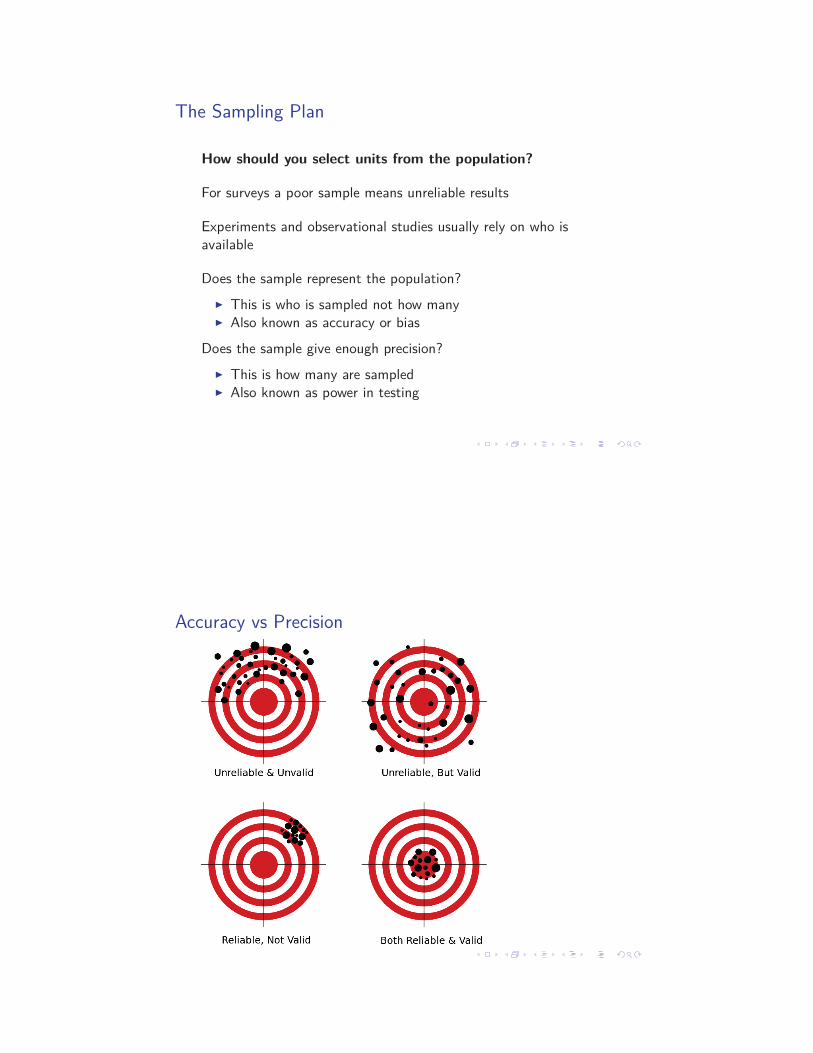
The Sampling Plan
How should you select units from the population?
For surveys a poor sample means unreliable results
Experiments and observational studies usually rely on who isavailable
Does the sample represent the population?
◮ This is who is sampled not how many◮ Also known as accuracy or bias
Does the sample give enough precision?
◮ This is how many are sampled◮ Also known as power in testing
Accuracy vs Precision
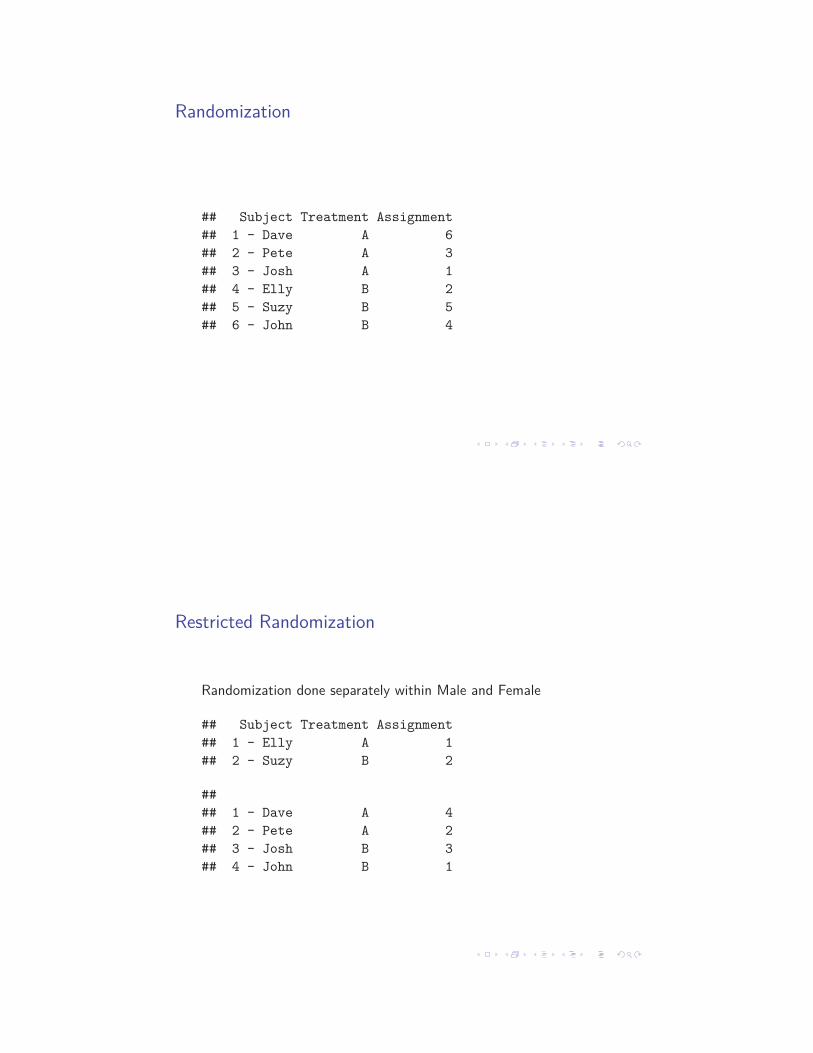
Randomization
## Subject Treatment Assignment
## 1 - Dave A 6
## 2 - Pete A 3
## 3 - Josh A 1
## 4 - Elly B 2
## 5 - Suzy B 5
## 6 - John B 4
Restricted Randomization
Randomization done separately within Male and Female
## Subject Treatment Assignment
## 1 - Elly A 1
## 2 - Suzy B 2
##
## 1 - Dave A 4
## 2 - Pete A 2
## 3 - Josh B 3
## 4 - John B 1
Randomization
For unit selection and allocation to groups
Relevant for surveys, observational studies and controlledexperiments
Eliminates bias from the study by allowing:
◮ sampled units to represent the population, won’t favor aparticular type of group
◮ unobserved confounders to be distributed randomly betweengroups
Differences can still occur by chance
Randomization can be done within the levels of observationalfactors, i.e. size of kidney stone, severity of disease
The Data
What information is needed to answer your questions?
Is the data collection procedure reliable?
Is the data entry accurate?
Are the data complete?
Can you confirm or correct suspected problems in the data?
Can you fill in missing data after the fact?
The data issues should be resolved before analysis begins

The Analysis Plan
How you answer your questions
Should include graphics to examine the data
Analysis is mainly determined by the type of dependent/responsevariable
◮ continuous, count, binary, categorical
Hypothesis testing or parameter estimation
Are the data truly independent?
◮ repeated measures or cluster effects
Do you need to adjust for any confounders?
Do you have a multiple comparison problem?
The Effects of Sample Size
None on accuracy, only precision
http://onlinestatbook.com/stat_sim/sampling_dist/
index.html
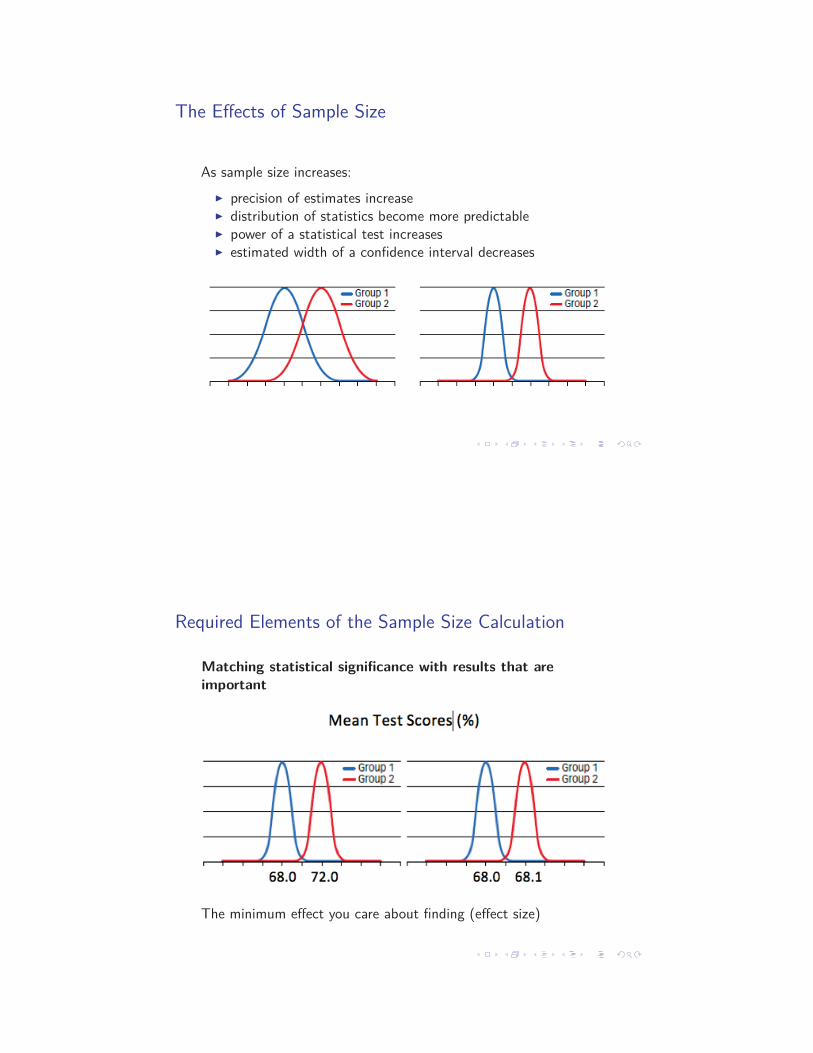
The Effects of Sample Size
As sample size increases:
◮ precision of estimates increase◮ distribution of statistics become more predictable◮ power of a statistical test increases◮ estimated width of a confidence interval decreases
Required Elements of the Sample Size Calculation
Matching statistical significance with results that are
important
The minimum effect you care about finding (effect size)
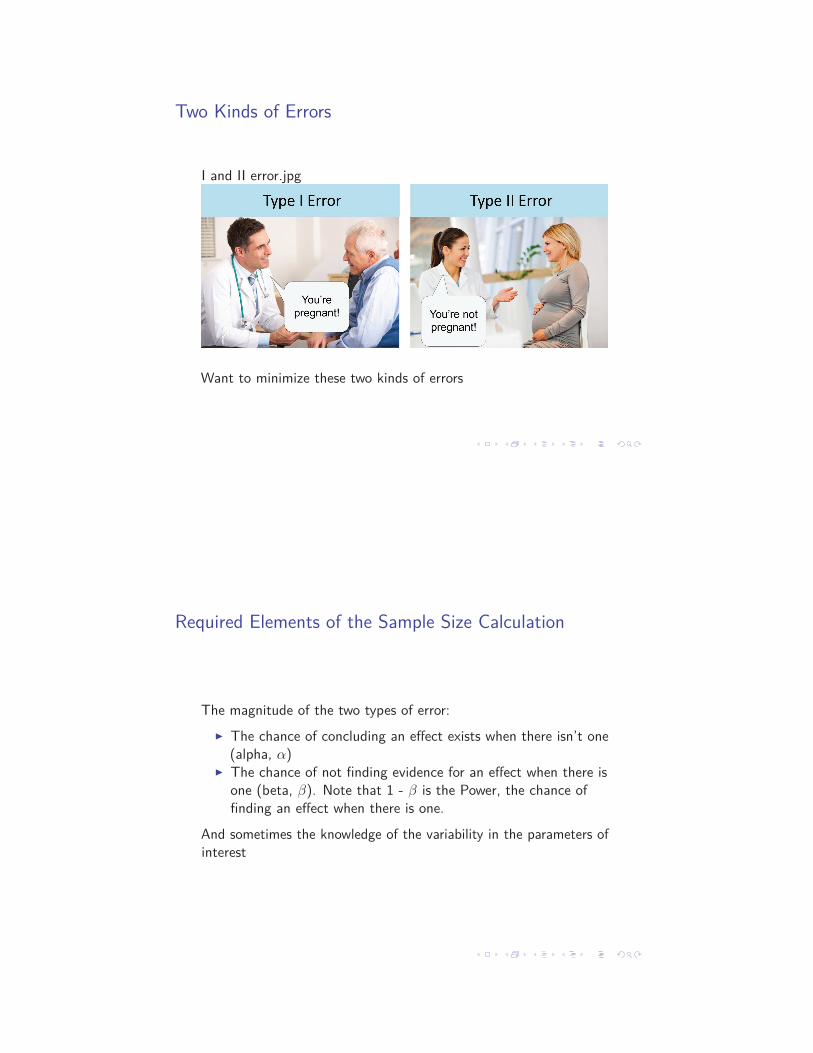
Two Kinds of Errors
I and II error.jpg
Want to minimize these two kinds of errors
Required Elements of the Sample Size Calculation
The magnitude of the two types of error:
◮ The chance of concluding an effect exists when there isn’t one(alpha, α)
◮ The chance of not finding evidence for an effect when there isone (beta, β). Note that 1 - β is the Power, the chance offinding an effect when there is one.
And sometimes the knowledge of the variability in the parameters ofinterest
On-line Demonstration
Select the sample size that yields the desired power or confidenceinterval width
Wikipedia -> Statistical Power
◮ 7. Software for Power and Sample Size Calculations
Russ Lenth on-line java appletsPower and Error Limits
R has built in functions for anova, proportions and t-test pluspackages like pwr, longpower and many others.
Statisticians can help
Focus and clarify the objectives
Design an appropriate sampling plan
Provide a randomization scheme
Design an appropriate analysis plan
Calculate the sample size or power
Talk to a statistician before you collect your data !!!
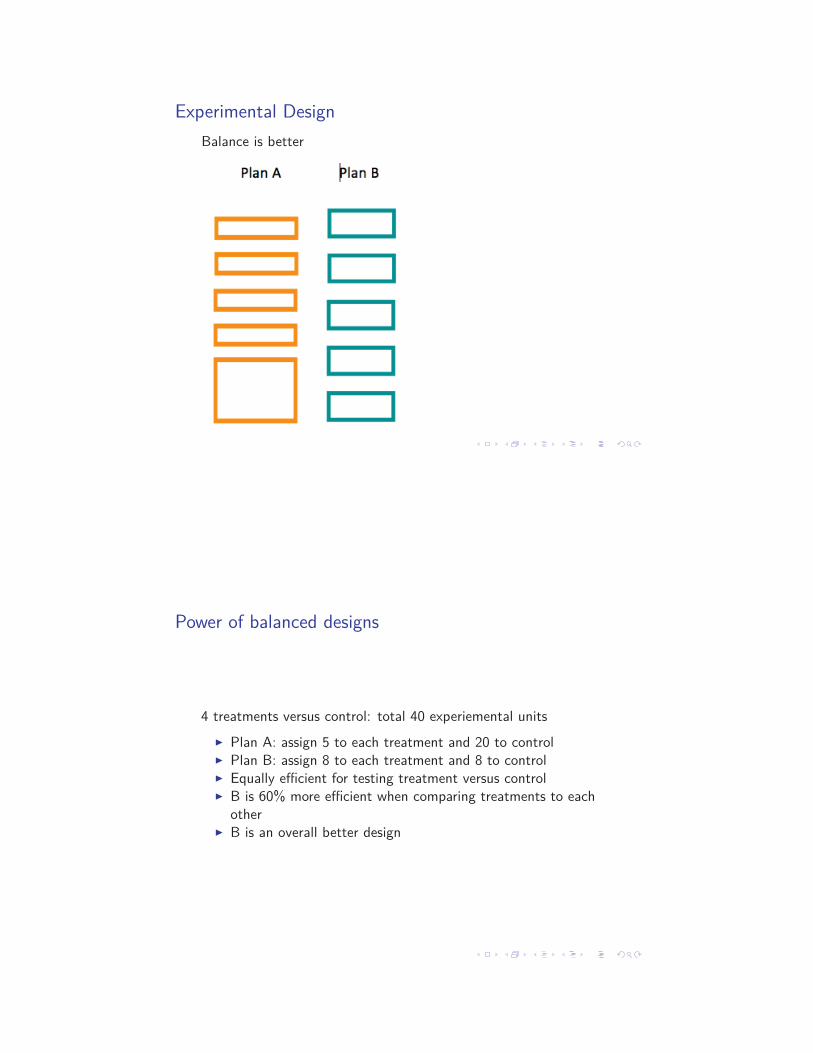
Experimental Design
Balance is better
Power of balanced designs
4 treatments versus control: total 40 experiemental units
◮ Plan A: assign 5 to each treatment and 20 to control◮ Plan B: assign 8 to each treatment and 8 to control◮ Equally efficient for testing treatment versus control◮ B is 60% more efficient when comparing treatments to each
other◮ B is an overall better design
Covariates
Often collected in addition to the measured outcome of interest
Observational and hard to design into the experiment
May be a confounding or interacting variable
Effect of Exercise (Ex) on Blood Pressure (BP)
Including highly correlated predictors in the analysis can elevate therisks of false-positives and false-negatives
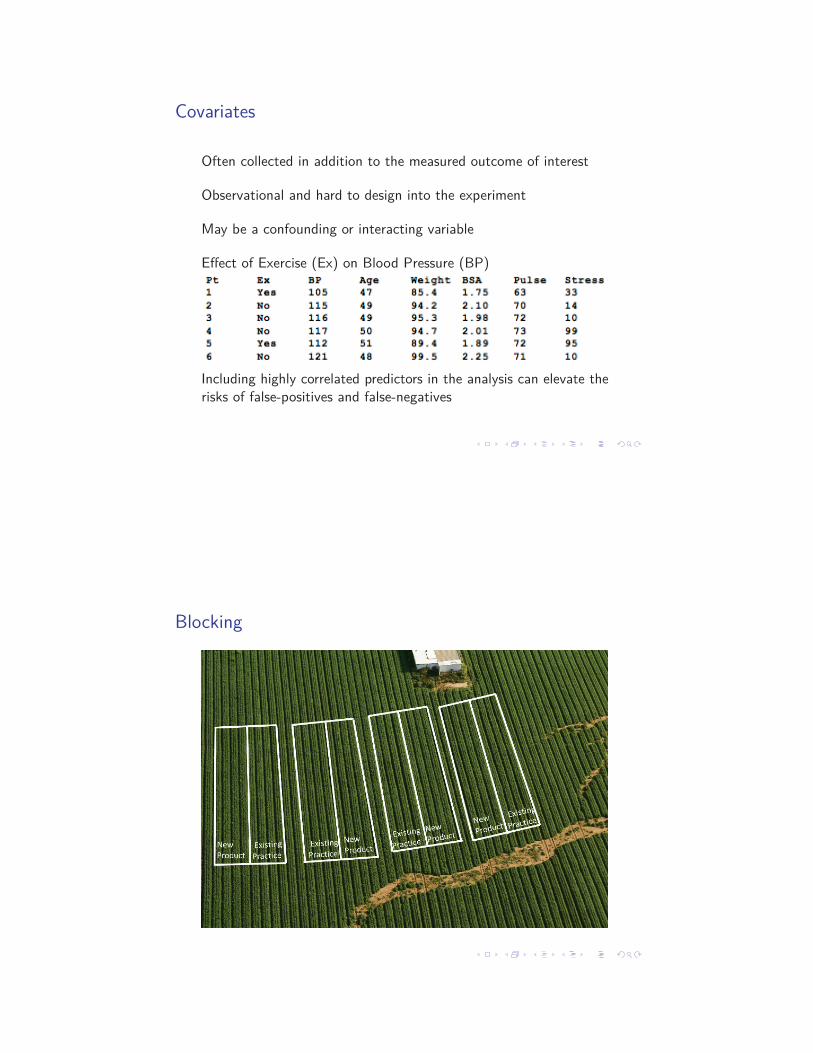
Blocking
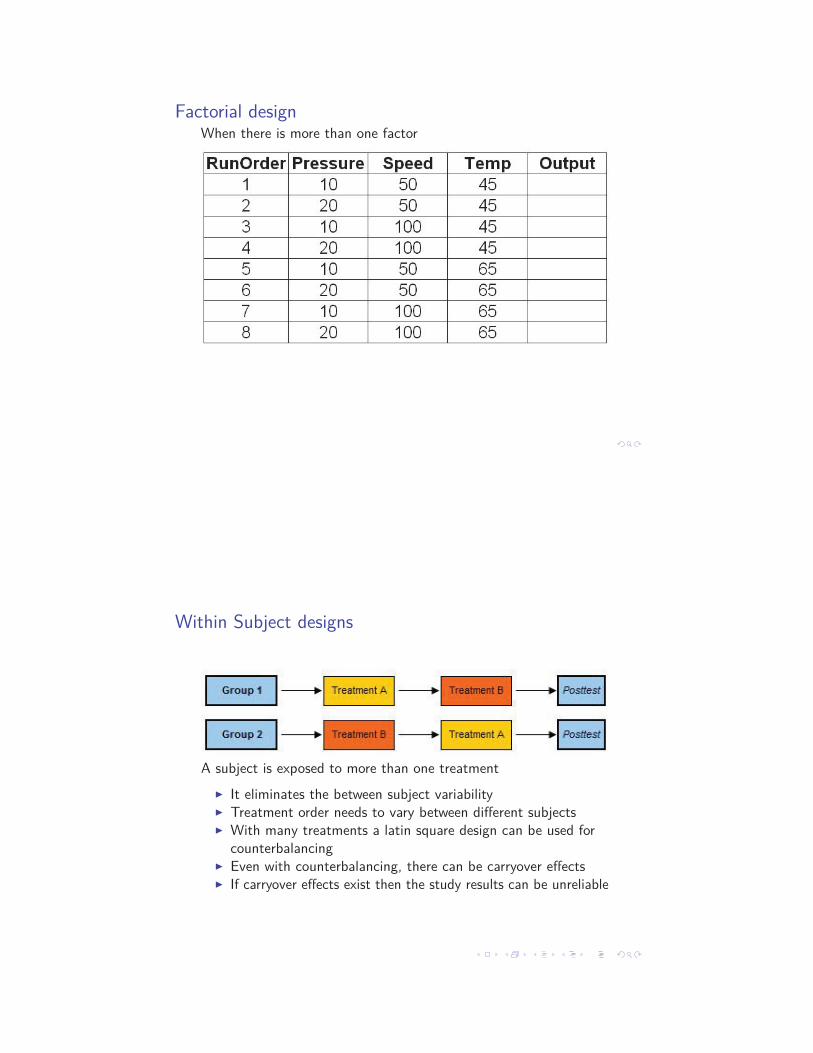
Factorial designWhen there is more than one factor
Within Subject designs
A subject is exposed to more than one treatment
◮ It eliminates the between subject variability◮ Treatment order needs to vary between different subjects◮ With many treatments a latin square design can be used for
counterbalancing◮ Even with counterbalancing, there can be carryover effects◮ If carryover effects exist then the study results can be unreliable
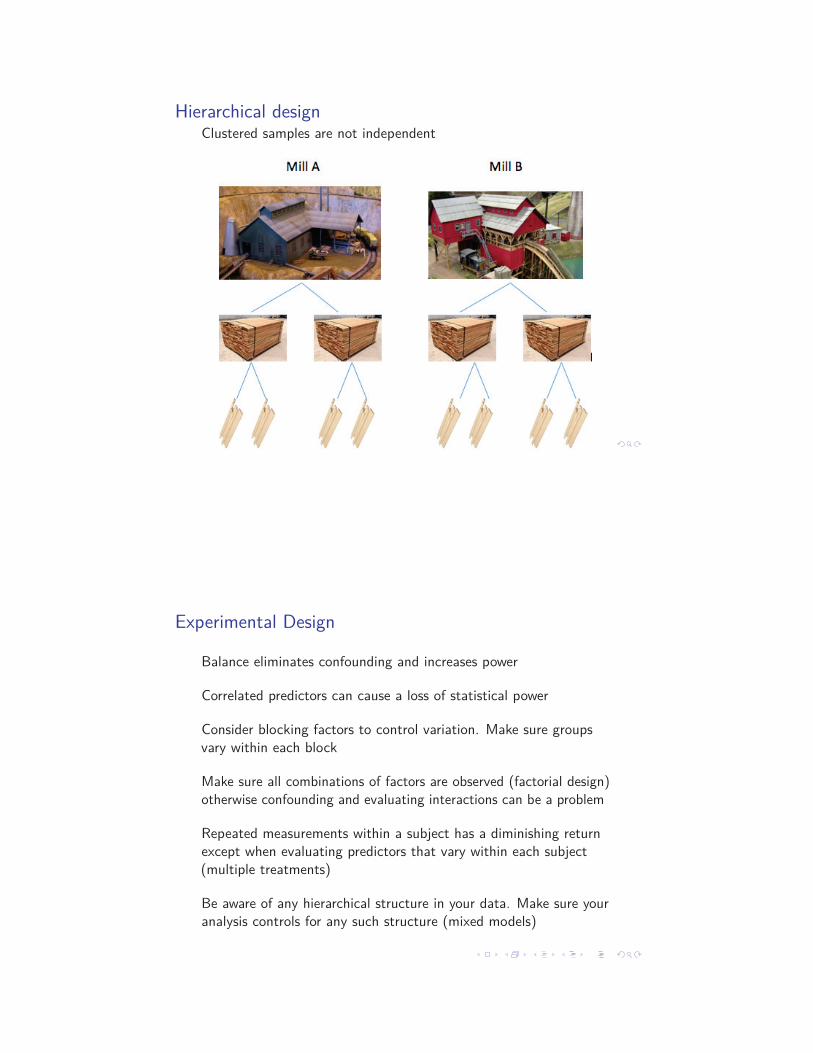
Hierarchical designClustered samples are not independent
Experimental Design
Balance eliminates confounding and increases power
Correlated predictors can cause a loss of statistical power
Consider blocking factors to control variation. Make sure groupsvary within each block
Make sure all combinations of factors are observed (factorial design)otherwise confounding and evaluating interactions can be a problem
Repeated measurements within a subject has a diminishing returnexcept when evaluating predictors that vary within each subject(multiple treatments)
Be aware of any hierarchical structure in your data. Make sure youranalysis controls for any such structure (mixed models)
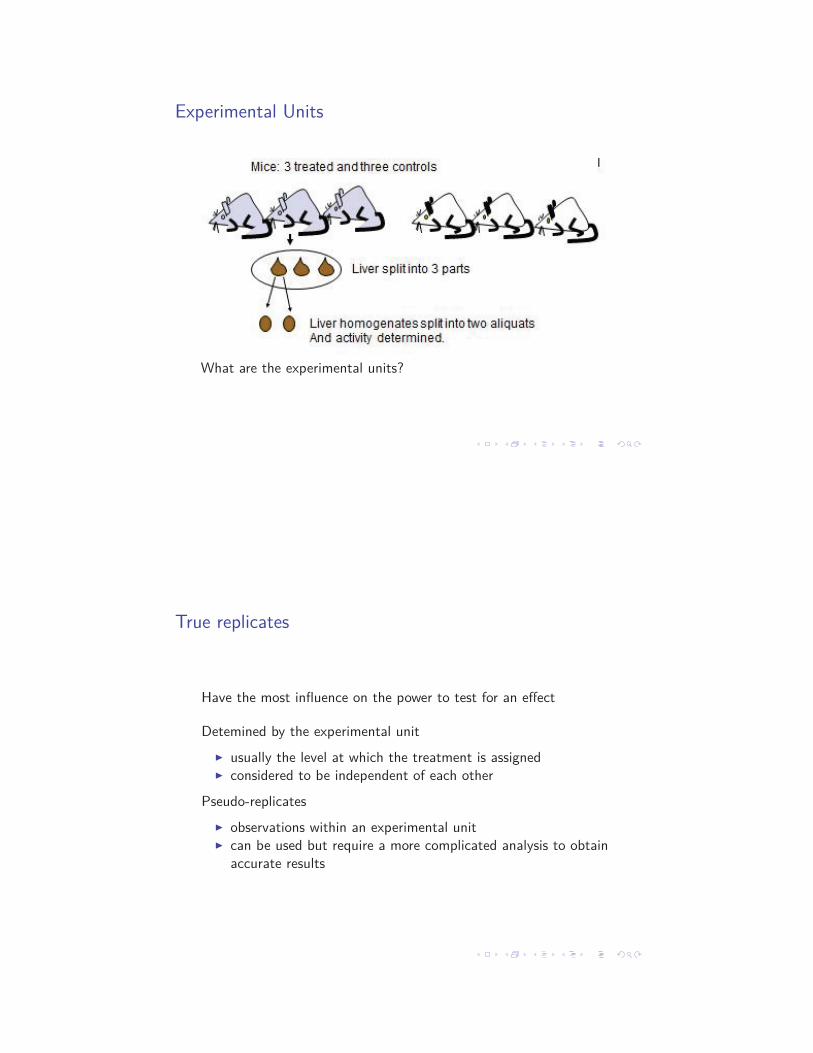
Experimental Units
What are the experimental units?
True replicates
Have the most influence on the power to test for an effect
Detemined by the experimental unit
◮ usually the level at which the treatment is assigned◮ considered to be independent of each other
Pseudo-replicates
◮ observations within an experimental unit◮ can be used but require a more complicated analysis to obtain
accurate results
Multiple Comparisons
Often researchers are not interested in just one treatment versuscontrol comparison per experiment
Comparisons proliferate with interest in:
◮ more than 1 treatment, there are t(t-1)/2 possible comparisons◮ effects within subgroups◮ more than one distinct outcome
Multiple Comparisons
Example of the effect on the chance of a false positive:
◮ with three levels (2 treatment, 1 control), 3 possiblecomparisons
◮ within two subgroups (adult and children), up to 6 comparisons◮ repeat for two outcome measures of interest, up to 12
comparisons◮ each comparison is tested separately at α = 0.05◮ probability of at least one false positive in the 12 tests is 0.46
Family-Wise Error Rate (FWER) is the chance of at least one falsepositive in the multiple comparisons or tests
Controlling the FWER
When you want to guard against any false positives
Commonly used Bonferroni correction for k tests (α/k) is veryconservative
Example:
◮ For 12 tests, the significance level of 0.05 / 12 = 0.004 is usedfor each test
◮ guarantees chance of any false positive is α = 0.05
Less conservative to control the False Discovery Rate (FDR)
◮ when a certain number of false positives is ok◮ less stringent control of Type I error compared to FWER
methods
Recommendation: limit the number of questions or select a fewquestions as primary beforehand
Types of variables
Data can play the role of the response variable (dependent, Y) orthe explanatory variable (independent, X)
Data can be numeric (continuous or discrete). This is a real numberwith a real interpretation
Data can be categorical, which can be ordinal (small, medium,large) or nominal (red, green, blue)
The type of analysis depends on which type of variable is in each role
◮ The response variable is most important
Common Analyses
Continuous response variable
◮ t-test, regression, ANOVA, ANCOVA
Response variable is a count
◮ Poisson or negative binomial regression
Binary response variable
◮ contingency tables, logistic regression
Categorical responses are more complicated
◮ ordinal or nominal logistic regression
Questions?
Department of Statistics at UBC:
www.stat.ubc.ca/how-can-you-get-help-your-data
SOS Program - An hour of free consulting to UBC graduatestudents. Funded by the Provost and VP Research Office.
STAT 551 - Stat grad students taking this course offer freestatistical advice. Fall semester every academic year.
Short Term Consulting Service - Advice from Stat grad students.Fee-for-service on small projects (less than 15 hours).
Hourly Projects - ASDa professional staff. Fee-for-service consulting.