Embed Size (px)
Citation preview

Statistical Arbitrage Based on No-ArbitrageDynamic Term Structure Models
Liuren Wu
Zicklin School of Business, Baruch College
Wu (Baruch) Statistical Arbitrage 1 / 70

Outline
1 General Ideas
2 Bond market terminologies
3 Dynamic term structure models
4 Model design and estimation
5 Statistical arbitrage trading
Wu (Baruch) Statistical Arbitrage 2 / 70
Review: Valuation and investment in primary securities
The securities have direct claims to future cash flows.
Valuation is based on forecasts of future cash flows and risk:
DCF (Discounted Cash Flow Method): Discount time-series forecastedfuture cash flow with a discount rate that is commensurate with theforecasted risk.
Investment: Buy if market price is lower than model value; sellotherwise.
Both valuation and investment depend crucially on forecasts of futurecash flows (earnings, growth rates) and risks (beta, credit risk).
This is not what we do.
Wu (Baruch) Statistical Arbitrage 3 / 70

Compare: Derivative securities
Payoffs are linked directly to the price of an “underlying” security.
Valuation is mostly based on replication/hedging arguments.
Find a portfolio that includes the underlying security, and possiblyother related derivatives, to replicate the payoff of the target derivative.The value of the derivative security should be equal to the replicatingcost; otherwise, there is an arbitrage.Models of this type are called “no-arbitrage” models.
Key: No forecasts are involved. Valuation is based on cross-sectionalcomparison.
It is not about whether the underlying security price will go up ordown, but about the relative pricing relation between the underlyingand the derivatives under all possible scenarios.If you can replicate the derivative for a cost of $1, you are willing tosell the derivative for (a little more than) $1, regardless of whether thederivative or underlying price will go up or down in the future.
Investment: Find value mismatches between the target security andthe replicating portfolio.
Wu (Baruch) Statistical Arbitrage 4 / 70
Readings behind the technical jargons: P v. Q
P: Actual probabilities that earnings will be high or low, estimatedbased on historical data and other insights about the company.
Valuation is all about getting the forecasts right and assigning theappropriate price (”risk premium”) for the forecasted risk — fair wrtfuture cashflows/risks and your risk preference.
Q: “Risk-neutral” probabilities that we can use to aggregate expectedfuture payoffs and discount them back with riskfree rate, regardless ofhow risky the cash flow is.
It is related to real-time scenarios, but has nothing to do with real-timeprobability.Since the intention is to hedge away risk under all scenarios anddiscount back with riskfree rate, we do not really care about the actualprobability of each scenario happening.We just care about what all the possible scenarios are and whether ourhedging works under all scenarios.Q is not about getting close to the actual probability, but about beingfair wrt the prices of securities that you use for hedging/replicating.
Wu (Baruch) Statistical Arbitrage 5 / 70

A Micky Mouse example
Consider a non-dividend paying stock in a world with zero riskfree interestrate. Currently, the market price for the stock is $100. What should bethe forward price for the stock with one year maturity?
The forward price is $100.
Standard forward pricing argument says that the forward price shouldbe equal to the cost of buying the stock and carrying it over tomaturity.The buying cost is $100, with no storage or interest cost or dividendbenefit.
How should you value the forward differently if you have insideinformation that the company will be bought tomorrow and the stockprice is going to double?
Shorting a forward at $100 is still safe for you if you can buy the stockat $100 to hedge.
Wu (Baruch) Statistical Arbitrage 6 / 70

Investing in derivative securities without forecasts
If you can really forecast the cashflow (with inside information), youprobably do not care much about hedging or no-arbitrage modeling.
What is risk to the market is an opportunity for you.You just lift the market and try not getting caught for inside trading.
But if you do not have insights on cash flows (earnings growth etc)and still want to invest in derivatives, the focus does not need to beon forecasting, but on cross-sectional consistency.
The no-arbitrage pricing models can be useful.
Wu (Baruch) Statistical Arbitrage 7 / 70

Example: No-arbitrage dynamic term structure models
(The focus of this lecture series)
Basic idea:
Interest rates across different maturities are related.
A dynamic term structure model (DTSM) provides a functional formfor this relation that excludes arbitrage.
The model usually consists of specifications of risk-neutral factordynamics (X ) and the short rate as a function of the factors, e.g.,rt = ar + b>r Xt .
Nothing about the forecasts: The “risk-neutral dynamics” areestimated to match historical term structure shapes.
A model is well-specified ifIt can fit most of the term structure shapes reasonably well.Hedging against the modeled risk factors generates stable (riskfree)portfolios.
Wu (Baruch) Statistical Arbitrage 8 / 70

A 3-factor affine model
with adjustments for discrete Fed policy changes:
Pricing errors on USD swap rates in bps
Maturity Mean MAE Std Auto Max R2
2 y 0.80 2.70 3.27 0.76 12.42 99.963 y 0.06 1.56 1.94 0.70 7.53 99.985 y -0.09 0.68 0.92 0.49 5.37 99.997 y 0.08 0.71 0.93 0.52 7.53 99.9910 y -0.14 0.84 1.20 0.46 8.14 99.9915 y 0.40 2.20 2.84 0.69 16.35 99.9030 y -0.37 4.51 5.71 0.81 22.00 99.55
Superb pricing performance: R-squared is greater than 99%.Maximum pricing errors is 22bps.Pricing errors are transient compared to swap rates (0.99):Average half life of the pricing errors is 3 weeks.The average half life for swap rates is 1.5 years.
Wu (Baruch) Statistical Arbitrage 9 / 70

Investing in interest rate swaps based on DTSMs
If you can forecast interest rate movements,Long swap if you think rates will go down.Forget about dynamic term structure model: It does not help yourinterest rate forecasting.
If you cannot forecast interest rate movements (it is hard), use thedynamic term structure model not for forecasting, but as adecomposition tool:
yt = f (Xt) + etWhat the model captures (f (Xt)) is the persistent component, which isdifficult to forecast.What the model misses (the pricing error e) is the more transient andhence more predictable component.
Form swap-rate portfolios thatneutralize their first-order dependence on the persistent factors.only vary with the transient residual movements.
Result: The portfolios are strongly predictable, even though theindividual interest-rate series are not.
Wu (Baruch) Statistical Arbitrage 10 / 70

Static arbitrage trading based on no-arbitrage DTSMs
For a three-factor model, we can form a 4-swap rate portfolio thathas zero exposure to the factors.
The portfolio should have duration close to zeroNo systematic interest rate risk exposure.The fair value of the portfolio should be relatively flat over time.
The variation of the portfolio’s market value is mainly induced byshort-term liquidity shocks...
Long/short the swap portfolio based on its deviation from the fairmodel value.
Provide liquidity to where the market needs it and receives a premiumfrom doing so.
Wu (Baruch) Statistical Arbitrage 11 / 70

The time-series of 10-year USD swap rates
95 97 00 02 05 07 10 12−40
−30
−20
−10
0
10
20
30
Inte
rest
Rate
Port
folio
, B
ps
US
95 97 00 02 05 07 10 121
2
3
4
5
6
7
8
9
10−
Year
Sw
ap, %
US
The left panel represents the 10-year swap rate hedged with 2, 5, and30-year swap rates. The right panel is the 10-year swap rateunhedged.
It is much easier to predict the hedged portfolio (left panel) than theunhedged swap contract (right panel).
Some regime shifting after the crisis (e.g., zero bound)...
Wu (Baruch) Statistical Arbitrage 12 / 70

Other economies
99 00 01 02 03 04 05 06 07 08 09 10 11 12 13−60
−50
−40
−30
−20
−10
0
Inte
rest
Rat
e P
ortfo
lio, B
ps
CD
00 02 05 07 10 12−90
−80
−70
−60
−50
−40
−30
−20
−10
0
10
Inte
rest
Rat
e P
ortfo
lio, B
ps
EU
99 00 01 02 03 04 05 06 07 08 09 10 11 12 13−20
−10
0
10
20
30
40
Inte
rest
Rat
e P
ortfo
lio, B
ps
BP
99 00 01 02 03 04 05 06 07 08 09 10 11 12 13−280
−260
−240
−220
−200
−180
−160
−140
−120
−100
Inte
rest
Rat
e P
ortfo
lio, B
ps
JY
Wu (Baruch) Statistical Arbitrage 13 / 70

Backtesting results from a simple investment strategy
Holding each investment for 4 weeks.
99 00 01 02 03 04 05 06 07 08 09 10 11
2
4
6
8
10
12
14
x 105
Cu
mu
lative
We
alth
US: Mean−variance
02 03 04 05 06 07 08 09 10 110
1
2
3
4
5
6
7
8
x 105
Cu
mu
lative
We
alth
CD: Mean−variance
03 04 05 06 07 08 09 10 11
1
2
3
4
5
6
7
8
x 105
Cu
mu
lative
We
alth
EU: Mean−variance
02 03 04 05 06 07 08 09 10 11
1
2
3
4
5
6
7
8
9
x 105
Cu
mu
lative
We
alth
BP: Mean−variance
02 03 04 05 06 07 08 09 10 110
1
2
3
4
5
6
7
x 105
Cu
mu
lative
We
alth
JY: Mean−variance
Wu (Baruch) Statistical Arbitrage 14 / 70

Caveats
Convergence takes time: We take a 4-week horizon.
Accurate hedging is vital for the success of the strategy. The modelneeds to be estimated with dynamic consistency:
Parameters are held constant. Only state variables vary.
Appropriate model design is important: parsimony, stability, adjustmentfor some calendar effects.
Daily fitting of a simpler model (with daily varying parameters) isdangerous.
Spread trading (one factor) generates low Sharpe ratios.
Butterfly trading (2 factors) is also not guaranteed to succeed.
Reference: Bali, Heidari, Wu, Predictability of Interest Rates and Interest-Rate Portfolios.
Wu (Baruch) Statistical Arbitrage 15 / 70

Another example: Trading the linkages between sovereignCDS and currency options
When a sovereign country’s default concern (over its foreign debt)increases, the country’s currency tend to depreciate, and currencyvolatility tend to rise.
“Money as stock” corporate analogy.
Observation: Sovereign credit default swap spreads tend to movepositively with currency’s
option implied volatilities (ATMV): A measure of the return volatility.risk reversals (RR): A measure of distributional asymmetry.
Reference: Carr and Wu, Theory and Evidence on the Dynamic Interactions Between Sovereign Credit Default
Swaps and Currency Options, Journal of Banking and Finance, 2007, 31(8), 2383–2403.
Wu (Baruch) Statistical Arbitrage 16 / 70

Co-movements between CDS and ATMV/RR
Dec01 Jul02 Jan03 Aug03 Feb04 Sep04 Mar050
2
4
6
CD
S S
prea
d, %
Mexico
Dec01 Jul02 Jan03 Aug03 Feb04 Sep04 Mar0510
20
30
40
Impl
ied
Vol
atili
ty F
acto
r, %
Dec01 Jul02 Jan03 Aug03 Feb04 Sep04 Mar050
50
100
CD
S S
prea
d, %
Brazil
Dec01 Jul02 Jan03 Aug03 Feb04 Sep04 Mar050
100
200
Impl
ied
Vol
atili
ty F
acto
r, %
Dec01 Jul02 Jan03 Aug03 Feb04 Sep04 Mar050
1
2
3
4
5
CD
S S
prea
d, %
Mexico
Dec01 Jul02 Jan03 Aug03 Feb04 Sep04 Mar050
2
4
6
8
10
Ris
k R
ever
sal F
acto
r, %
Dec01 Jul02 Jan03 Aug03 Feb04 Sep04 Mar050
50
100
CD
S S
prea
d, %
Brazil
Dec01 Jul02 Jan03 Aug03 Feb04 Sep04 Mar050
20
40
Ris
k R
ever
sal F
acto
r, %
Wu (Baruch) Statistical Arbitrage 17 / 70

A no-arbitrage model that prices both CDS and currencyoptions
Model specification:At normal times, the currency price (dollar price of a local currency, saypeso) follows a diffusive process with stochastic volatility.
When the country defaults on its foreign debt, the currency price jumpsby a large amount.
The arrival rate of sovereign default is also stochastic and correlatedwith the currency return volatility.
Under these model specifications, we can price both CDS andcurrency options via no-arbitrage arguments. The pricing equations istractable. Numerical implementation is fast.
Estimate the model with dynamic consistency: Each day, three thingsvary: (i) Currency price (both diffusive moves and jumps), (ii)currency volatility, and (iii) default arrival rate.
All model parameters are fixed over time.
Wu (Baruch) Statistical Arbitrage 18 / 70

The hedged portfolio of CDS and currency options
Suppose we start with an option contract on the currency. We need fourother instruments to hedge the risk exposure of the option position:
1 The underlying currency to hedge infinitesimal movements inexchange rate
2 A risk reversal (out of money option) to hedge the impact of defaulton the currency value.
3 A straddle (at-the-money option) to hedge the currency volatilitymovement.
4 A CDS contract to hedge the default arrival rate variation.
The portfolio needs to be rebalanced over time to maintain neutral to therisk factors.
The value of hedged portfolio is much more transient than volatilitiesor cds spreads.
Wu (Baruch) Statistical Arbitrage 19 / 70
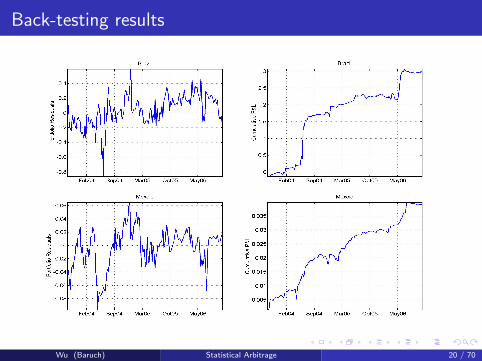
Back-testing results
Wu (Baruch) Statistical Arbitrage 20 / 70

Similar linkages between corporate CDS and stock options
02 03 04 05 06
−2
−1
0
1
2
3
GM: Default risk and stock price
Negative stock priceCDS spread
02 03 04 05 06
−1
−0.5
0
0.5
1
1.5
2
2.5
3
3.5
GM: Default risk and long−term implied volatility
ATMVCDS spread
02 03 04 05 06−1
0
1
2
3
4
GM: Default risk and long−term implied volatility skew
Negative skewCDS spread
All series are standardized to have similar scales in the plots.Reference: Carr and Wu, Stock Options and Credit Default Swaps: A Joint Framework for Valuation and Estimation
Wu (Baruch) Statistical Arbitrage 21 / 70

Information ratios from investing in hedged portfolios
5 10 15 20 25 300
0.5
1
1.5
2
2.5
Info
rmat
ion
Ratio
Portfolios
GM
5 10 15 20 25 300
0.5
1
1.5
2
2.5
Info
rmat
ion
Ratio
Portfolios
F
Each bar represents one hedged portfolio. Each hedged portfolio includes 5instruments: two CDS contracts, two options at two maturities, and theunderlying stock.
Wu (Baruch) Statistical Arbitrage 22 / 70

Bottom line
If you have a working crystal ball, others’ risks become youropportunities.
Forget about no-arbitrage models; lift the market.
No-arbitrage type models become useful whenYou cannot forecast the future accurately: Risk persists.Hedge risk exposures.Perform statistical arbitrage trading on derivative products that profitfrom short-term market dislocations.
CaveatsWhen hedging is off, risk can overwhelm profit opportunities.Accurate hedging requires modeling all risk dimensions.
Interest rates do not just move in parallel, but also experiencesystematic moves in slopes and curvatures.Capital structure arbitrage: Volatility and default rates are not static,but vary strongly over time in unpredictable ways.
Fulfilling these requirements is a quant’s job !
Wu (Baruch) Statistical Arbitrage 23 / 70

Plan of this lecture series
We illustrate the idea using the first example:Interest rate swap statistical arbitrage using dynamic term structuremodels.
The math and implementation are both simpler for term structuremodels than for option pricing models.The idea is the same.
Things we need to learn before we can put on a trade:Bond market terminologiesTheories on dynamic term structure models (DTSM)
Not a summary of existing models, but an approach to design modelsthat are simple, parsimonious, and yet flexible enough to match thedata behavior.
Model estimation:Data sources, market conventions.Maximum likelihood estimation with unscented Kalman filter.
Implementation details on portfolio construction, P&L calculation.
Wu (Baruch) Statistical Arbitrage 24 / 70

Notations and terminologies
B(t,T ) — the time-t value of a zero-coupon bond that pays $1 attime T .
y(t,T ) — the time-t continuously compounded spot interest ratewith expiry rate T .
y(t,T ) = − lnB(t,T )
T − t, B(t,T ) = exp(−y(t,T )(T−t)), B(t, t) = 1.
f (t,T ,S) —The time-t continuously compounded forward rateprevailing at future time interval (T ,S):
f (t,T ,S) = − lnB(t, S)/B(t,T )
S − T,
B(t,S)
B(t,T )= e−f (t,T ,S)(S−T )
f (t,T ) — the time-t instantaneous forward rate prevailing at T :
f (t,T ) = f (t,T ,T ) = −∂ lnB(t,T )
∂T, B(t,T ) = e−
∫ Tt f (t,s)ds
r(t) — the instantaneous interest rate defined by the limit:r(t) = f (t, t) = limT↓t y(t,T ).
Wu (Baruch) Statistical Arbitrage 25 / 70

The pricing kernel
If there is no arbitrage in a market, there must exist at least onestrictly positive process Mt such that the deflated gains processassociated with any trading strategy is a martingale:
MtPt = EPt [MTPT ] , (1)
where Pt denotes the time-t value of a trading strategy, P denotesthe statistical probability measure.
Consider the strategy of buying a zero-coupon bond at time t andhold it to maturity at T , we haveMtB(t,T ) = EP
t [MTB(T ,T )] = EPt [MT ] .
If the market is complete, this process Mt is unique.
If the available securities cannot complete the market, there can bemultiple processes that satisfy equation (1).
If we cannot find a single positive process that can price all securities,there is arbitrage.
Mt is called the state-price deflator. The ratio Mt,T = MT/Mt iscalled the stochastic discount factor, or the pricing kernel:B(t,T ) = EP
t [Mt,T ].Wu (Baruch) Statistical Arbitrage 26 / 70

From pricing kernel to exchange rates
Let Mht,T denote the pricing kernel in economy h that prices all
securities in that economy with its currency denomination.The h-currency price of currency-f (h is home currency) is linked tothe pricing kernels of the two economies by,
S fhT
S fht
=M f
t,T
Mht,T
The log currency return over period [t,T ], ln S fhT /S
fht equals the
difference between the log pricing kernels of the two economies.Let S denote the dollar price of pound (e.g. St = $2.06), then
lnST/St = lnMpoundt,T − lnMdollar
t,T .If markets are completed by primary securities (e.g., bonds andstocks), there is one unique pricing kernel per economy. Theexchange rate movement is uniquely determined by the ratio of thepricing kernels.If the markets are not completed by primary securities, exchange rates(and currency options) help complete the markets by requiring thatthe ratio of any two viable pricing kernels go through the exchangerate.
Wu (Baruch) Statistical Arbitrage 27 / 70

Multiplicative decomposition of the pricing kernel
In a discrete-time representative agent economy with an additiveCRRA utility, the pricing kernel equals the ratio of the marginalutilities of consumption,
Mt,t+1 = βu′(ct+1)
u′(ct)= β
(ct+1
ct
)−γ, γ − relative risk aversion.
In continuous time, it is convenient to perform the followingmultiplicative decomposition on the pricing kernel:
Mt,T = exp
(−∫ T
trsds
)E(−∫ T
tγ>s dXs
)r is the instantaneous riskfree rate, E is the stochastic exponentialmartingale operator, X denotes the risk sources in the economy, andγ is the market price of the risk X .
If Xt = Wt , E(−∫ T
tγsdWs
)= e−
∫ Tt
γsdWs− 12
∫ Tt
γ2s ds .
In a continuous time version of the representative agent example,dXs = d ln ct and γ is relative risk aversion.r is normally a function of X .Wu (Baruch) Statistical Arbitrage 28 / 70

Bond pricing
Recall the multiplicative decomposition of the pricing kernel:
Mt,T = exp
(−∫ T
trsds
)E(−∫ T
tγ>s dXs
)Given the pricing kernel, the value of the zero-coupon bond can bewritten as
B(t,T ) = EPt [Mt,T ]
= EPt
[exp
(−∫ Tt rsds
)E(−∫ Tt γ>s dXs
)]= EQ
t
[exp
(−∫ Tt rsds
)]where the measure change from P to Q is defined by the exponentialmartingale E(·).
The risk sources X and their market prices γ matter for bond pricingthrough the correlation between r and X .
Wu (Baruch) Statistical Arbitrage 29 / 70

Measure change defined by exponential martingales
Consider the following exponential martingale that defines the measurechange from P to Q:dQdP
∣∣∣t
= E(−∫ t
0 γsdWs
),
If the P dynamics is: dS it = µiS i
tdt + σiS itdW
it , with
ρidt = E[dWtdWit ], then the dynamics of S i
t under Q is:dS i
t = µiS itdt + σiS i
tdWit + E[−γtdWt , σ
iS itdW
it ] =(
µit − γσiρi)S itdt + σiS i
tdWit
If S it is the price of a traded security, we need r = µit − γσiρi . The
risk premium on the security is µit − r = γσiρi .
How do things change if the pricing kernel is given by:
Mt,T = exp(−∫ Tt rsds
)E(−∫ Tt γ>s dWs
)E(−∫ Tt γ>s dZs
),
where Zt is another set of Brownian motions independent of Wt or W it .
Z does not affect bond pricing if it is not correlated with r .
Wu (Baruch) Statistical Arbitrage 30 / 70

Measure change defined by exponential martingales: Jumps
Let X denote a pure jump process with its compensator being ν(x , t)under P.
Consider a measure change defined by the exponential martingale:dQdP
∣∣∣t
= E (−γXt),
The compensator of the jump process under Q becomes:ν(x , t)Q = e−γxν(x , t).
Example: Merton (176)’s compound Poisson jump process,
ν(x , t) = λ 1σJ√
2πe− (x−µJ )2
2σ2J . Under Q, it becomes
ν(x , t)Q = λ 1σJ√
2πe−γx− (x−µJ )2
2σ2J = λQ 1
σJ√
2πe−
(x−µQJ
)2
2σ2J with
µQ = µJ − γσ2J and λQ = λe
12γ(γσ2
J−2µJ).
Reference: Kuchler & Sørensen, Exponential Families of Stochastic Processes, Springer, 1997.
Wu (Baruch) Statistical Arbitrage 31 / 70

Dynamic term structure models
A long list of papers propose different dynamic term structure models:
Specific examples:Vasicek, 1977, JFE: The instantaneous interest rate follows anOrnstein-Uhlenbeck process.
Cox, Ingersoll, Ross, 1985, Econometrica: The instantaneous interestrate follows a square-root process.
Many multi-factor examples ...
Classifications (back-filling)Duffie, Kan, 1996, Mathematical Finance: Spot rates are affinefunctions of state variables.Duffie, Pan, Singleton, 2000, Econometrica: Affine with jumps.Duffie, Filipovic, Schachermayer, 2003, Annals of Applied Probability:Super mathematical representation and generalization of affine models.Leippold, Wu, 2002, JFQA: Spot rates are quadratic functions of statevariables.Filipovic, 2002, Mathematical Finance: How far can we go?
Wu (Baruch) Statistical Arbitrage 32 / 70

The “back-filling” procedure of DTSM identification
The traditional procedure:First, we make assumptions on factor dynamics (X ), market prices (γ),and how interest rates are related to the factors r(X ), based on whatwe think is reasonable.
Then, we derive the fair valuation of bonds based on these dynamicsand market price specifications.
The back-filling (reverse engineering) procedure:First, we state the form of solution that we want for bond prices (spotrates).Then, we try to figure out what dynamics specifications generate thepricing solutions that we want.
The dynamics are not specified to be reasonable, but specified togenerate a form of solution that we like.
It is good to be able to go both ways.It is important not only to understand existing models, but also toderive new models that meet your work requirements.
Wu (Baruch) Statistical Arbitrage 33 / 70

Back-filling affine models
What we want: Zero-coupon bond prices are exponential affinefunctions of state variables.
Continuously compounded spot rates are affine in state variables.It is simple and tractable. We can use spot rates as factors.
Let X denote the state variables, let B(Xt , τ) denote the time-t fairvalue of a zero-coupon bond with time to maturity τ = T − t, wehave
B(Xt , τ) = EQt
[exp
(−∫ T
tr(Xs)ds
)]= exp
(−a(τ)− b(τ)>Xt
)Implicit assumptions:
By writing B(Xt , τ) and r(Xt), and solutions A(τ), b(τ), I am implicitlyfocusing on time-homogeneous models. Calendar dates do not matter.This assumption is for (notational) simplicity more than anything else.With calendar time dependence, the notation can be changed to,B(Xt , t,T ) and r(Xt , t). The solutions would be a(t,T ), b(t,T ).
Questions to be answered:What is the short rate function r(Xt)?What’s the dynamics of Xt under measure Q?
Wu (Baruch) Statistical Arbitrage 34 / 70

Diffusion dynamics
To make the derivation easier, let’s focus on diffusion factordynamics: dXt = µ(X )dt + σ(X )dWt under Q.We want to know: What kind of specifications for µ(X ), σ(X ) andr(X ) generate the affine solutions?For a generic valuation problem,
f (Xt , t,T ) = EQt
[exp
(−∫ T
tr(Xs)ds
)πT
],
where ΠT denotes terminal payoff, the value satisfies the followingpartial differential equation:
ft + Lf = rf , Lf − infinitesimal generator
with boundary condition f (T ) = ΠT .Apply the PDE to the bond valuation problem,
Bt + B>X µ(X ) +1
2
∑BXX · σ(X )σ(X )> = rB
with boundary condition B(XT , 0) = 1.Wu (Baruch) Statistical Arbitrage 35 / 70

Back filling
Starting with the PDE,
Bt + B>X µ(X ) +1
2
∑BXX · σ(X )σ(X )> = rB, B(XT , 0) = 1.
If B(Xt , τ) = exp(−a(τ)− b(τ)>Xt), we have
Bt = B(a′(τ) + b′(τ)>Xt
), BX = −Bb(τ), BXX = Bb(τ)b(τ)>,
y(t, τ) = 1τ
(a(τ) + b(τ)>Xt
), r(Xt) = a′(0) + b′(0)>Xt = ar + b>r Xt .
Plug these back to the PDE,
a′(τ)+b′(τ)>Xt−b(τ)>µ(X )+1
2
∑b(τ)b(τ)>·σ(X )σ(X )> = ar+b>r Xt
Question: What specifications of µ(X ) and σ(X ) guarantee the abovePDE to hold at all X?
Power expand µ(X ) and σ(X )σ(X )> around X and then collectcoefficients of X p for p = 0, 1, 2 · · · . These coefficients have to be zeroseparately for the PDE to hold at all times.
Wu (Baruch) Statistical Arbitrage 36 / 70

Back filling
a′(τ)+b′(τ)>Xt−b(τ)>µ(X )+1
2
∑b(τ)b(τ)> ·σ(X )σ(X )> = ar +b>r Xt
Set µ(X ) = am + bmX + cmXX> + · · · and
[σ(X )σ(X )>]i = αi + β>i X + ηiXX> + · · · , and collect terms:
constant a′(τ)− b(τ)>am + 12
∑b(τ)b(τ)> · αi = ar
X b′(τ)> − b(τ)>bm + 12
∑b(τ)b(τ)> · β>i = b>r
XX> −b(τ)>cm + 12
∑b(τ)b(τ)> · ηi = 0
The quadratic and higher-order terms are almost surely zero.We thus have the conditions to have exponential-affine bond prices:
µ(X ) = am +bmX , [σ(X )σ(X )>]i = αi +β>i X , r(X ) = ar +b>r X .
We can solve the coefficients [a(τ), b(τ)] via the following ordinarydifferential equations:
a′(τ) = ar + b(τ)>am − 12
∑b(τ)b(τ)> · αi
b′(τ) = br + b>mb(τ)− 12
∑b(τ)b(τ)> · βi
starting at a(0) = 0 and b(0) = 0.Wu (Baruch) Statistical Arbitrage 37 / 70

From Q to P, not from P to Q
The affine conditions,
µ(X ) = am +bmX , [σ(X )σ(X )>]i = αi +β>i X , r(X ) = ar +b>r X .
are about the Q-dynamics, not about the P-dynamics.
Traditionally, researchers start with the P-dynamics (the real thing),and specify risk preferences (market prices of risks). From these two,they derive the Q-dynamics and derivative (bond) prices.
But the back-filling exercise shows that the real requirement fortractability (e.g., affine) is on Q-dynamics.
Hence, we should also back fill the specification:
Start with Q-dynamics specification to generate tractable derivativepricing solutions.Fill in any market price of risk specification.It does not matter if the P-dynamics is complex or not.
Wu (Baruch) Statistical Arbitrage 38 / 70

A one-factor example
Suppose the short rate follows the following P-dynamics
drt =(a + brt + cr2
t + dr3t + er4
t
)dt + σrdWt
and we specify the martingale component of the pricing kernel as
E(−∫ Tt γsdWt
), with
γs = γ0 + γ1rt + (c/σr )r2t + (d/σr )r3
t + (d/σr )r4t .
Can you price zero-coupon bonds based on this specification?
Reversely, if the Q-dynamics are given by
µ(X ) = am + bmX , [σ(X )σ(X )>]i = αi + β>i X
and the measure change is defined by E(−∫ Tt γ>s dWt
), we have the
drift of the P-dynamics as
µ(X )P = am + bmX + σ(X )γt
The market price of risk γt can be anything...
Wu (Baruch) Statistical Arbitrage 39 / 70

Quadratic and others
Can you identify the conditions for quadratic models: Bond prices areexponential quadratic in state variables?
Can you identify the conditions for “cubic” models: Bond prices areexponential cubic in state variables?
Affine bond prices: Recently Xavier Gabaix derive a model wherebond prices are affine (not exponential affine!) in state variables.
Wu (Baruch) Statistical Arbitrage 40 / 70

Model design
The models that we have derived can have many many factors.
How many factors you use depend on the data (how many sources ofindependent variation) – A PCA analysis is useful.
The super general specification has many parameters that are notidentifiable. You need to analyze the model carefully to get rid ofredundant parameters.
Once you know that you have the capability to go complex, youactually want to go as simple as possible.
Everything should be made as simple as possible, but not simpler.— Albert Einstein.
Wu (Baruch) Statistical Arbitrage 41 / 70

Data
We estimate a DTSM using US dollar LIBOR and swap rates:LIBOR maturities: 1, 2, 3, 6, and 12 monthsSwap maturities: 2, 3, 5, 7, 10, 15, and 30 years.
Quoting conventions: actual/360 for LIBOR; 30/360 withsemi-annual payment for swaps.
LIBOR(Xt , τ) = 100τ
(1
B(Xt ,τ) − 1), (simple compounding rates)
SWAP(Xt , τ) = 200× 1−B(Xt ,τ)∑2τi=1 B(Xt ,i/2)
, (par bond coupon rates).
LIBOR and swaps on other currencies have slightly differentday-counting conventions.
Sample period: I want it as long as possible, but data are not fullyavailable before 1995.
Sampling frequency: For model estimation, I often sample dataweekly to avoid weekday effects.
Wu (Baruch) Statistical Arbitrage 42 / 70

Data: Time series and term structure
95 96 97 98 99 00 01 02 03 04 05 06 070
1
2
3
4
5
6
7
8
9
LIB
OR
and
sw
ap ra
tes,
%
USLBOR and swap rates
0 1 2 3 4 5 6 7 8 9 100
1
2
3
4
5
6
7
8
9
Maturity, yearsLI
BO
R a
nd s
wap
rate
s, %
USLBOR and swap rates
Wu (Baruch) Statistical Arbitrage 43 / 70

Data: Summary statistics
Maturity Mean Std Skew Kurt Auto
1m 4.329 1.807 -0.703 -1.077 0.9982m 4.365 1.813 -0.710 -1.067 0.9983m 4.399 1.818 -0.708 -1.055 0.9986m 4.474 1.814 -0.705 -0.998 0.9989m 4.550 1.800 -0.689 -0.935 0.997
12m 4.638 1.780 -0.659 -0.874 0.9962y 4.887 1.576 -0.547 -0.691 0.9943y 5.100 1.417 -0.421 -0.651 0.9934y 5.265 1.301 -0.297 -0.686 0.9915y 5.397 1.213 -0.187 -0.751 0.9907y 5.594 1.096 -0.015 -0.873 0.989
10y 5.793 1.003 0.136 -0.994 0.987Average weekly autocorrelation for swap rates (φ) is 0.991:Half-life = lnφ/2/ lnφ ≈ 78 weeks(1.5years)Interest rates are highly persistent; forecasting is difficult.
Wu (Baruch) Statistical Arbitrage 44 / 70
Data: Principal component analysis
0 1 2 3 4 5 6 70
10
20
30
40
50
60
70
80
Principal components
Expl
aine
d va
riatio
n, %
0 1 2 3 4 5 6 7 8 9 10−0.8
−0.6
−0.4
−0.2
0
0.2
0.4
0.6
Maturity, years
Fact
or lo
adin
g
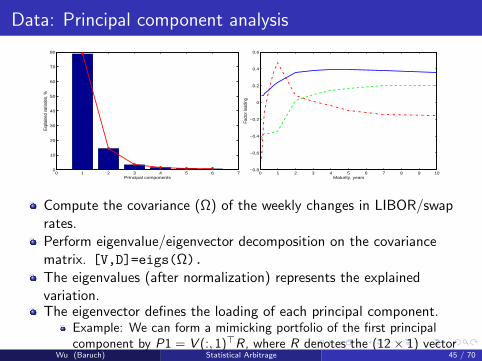
Compute the covariance (Ω) of the weekly changes in LIBOR/swaprates.Perform eigenvalue/eigenvector decomposition on the covariancematrix. [V,D]=eigs(Ω).
The eigenvalues (after normalization) represents the explainedvariation.The eigenvector defines the loading of each principal component.
Example: We can form a mimicking portfolio of the first principalcomponent by P1 = V (:, 1)>R, where R denotes the (12× 1) vectorof interest rates.Wu (Baruch) Statistical Arbitrage 45 / 70

Model design: Three-factor affine DTSMs
Affine specifications:
Risk-neutral (Q) factor dynamics:dXt = κ (θ − Xt) dt +
√ΩtdW
Qt , [Ωt ]ii = αi + β>i Xt .
Short rate function: r(Xt) = ar + b>r Xt
Bond pricing: Zero-coupon bond prices:B(Xt , τ) = exp
(−a(τ)− b(τ)>Xt
).
Affine forecasting dynamics (P): dXt = κP(θP − Xt
)dt +
√ΩtdW
Pt
Does not matter for bond pricing.Specification is up to identification.
Dai, Singleton (2000): Am(3) classification with m = 0, 1, 2, 3.
[Ωt ]ii =
Xt,i i = 1, · · · ,m;1 + β>i Xt , i = m + 1, · · · , n.
Wu (Baruch) Statistical Arbitrage 46 / 70

Model design: A 3-factor Gaussian affine model
The simplest among all Am(3) models:
The specification and normalization:
dXt = −κPXtdt + dW Pt
dXt = −κ (θ − Xt) dt + dWQt , r(Xt) = ar + b>r Xt .
The instantaneous covariance matrix is normalized to I .The long-run statistical mean is normalized to zero.
Zero-coupon bond prices: B(Xt , τ) = exp(−a(τ)− b(τ)>Xt
), with
a′(τ) = ar + b(τ)κθ − 12b(τ)>b(τ) and b′(τ) = br − κ>b(τ).
The coefficients can be solved analytically: b(τ) = e−κ>τbr .
Properties: Bond yields (spot, forward rates) are affine functions ofGaussian variables.
Wu (Baruch) Statistical Arbitrage 47 / 70

Estimation: Maximum likelihood with UKF
State propagation (discretization of the forecasting dynamics):
Xt+1 = A + ΦXt +√
Qεt+1.
A = 0, Φ = e−κP∆t , Q =
∫ ∆t0 e−κse−κ
>sds.
= ∆t.
Measurement equation: Assume LIBOR and swap rates are observedwith error:
yt =
[LIBOR(Xt , i)SWAP(Xt , j)
]+√
Σet ,i = 1, 2, 3, 6, 12 monthsj = 2, 3, 5, 7, 10, 15, 30 years.
Unscented Kalman Filter (UKF) generates conditional forecasts of themean and covariance of the state vector and observations.
Likelihood is built on the forecasting errors:
lt+1 = − 12 log
∣∣V t+1
∣∣− 12
((yt+1 − y t+1
)> (V t+1
)−1 (yt+1 − y t+1
)).
Choose model parameters (κP, κ, θ, ar , br ,Σ) to maximize the sum ofthe weekly log likelihood function.
Wu (Baruch) Statistical Arbitrage 48 / 70

The Classic Kalman filter
Kalman filter (KF) generates efficient forecasts and updates underlinear-Gaussian state-space setup:
State : Xt+1 = A + ΦXt +√Qεt+1,
Measurement : yt = HXt +√
Σet
The ex ante predictions as
X t = A + ΦXt−1;
Ωt = ΦΩt−1Φ> + Q;
y t = HX t ;
V t = HV tH> + Σ.
The ex post filtering updates are,
Xt+1 = X t+1 + Kt+1
(yt+1 − y t+1
);
Ωt+1 = Ωt+1 − Kt+1V t+1K>t+1,
where Kt+1 = Ωt+1H> (V t+1
)−1is the Kalman gain.
Wu (Baruch) Statistical Arbitrage 49 / 70

The Extended Kalman filter: Linearly approximating themeasurement equation
In our application, LIBOR and swap rates are NOT linear in states:
State : Xt+1 = A + ΦXt +√Qεt+1,
Measurement : yt = h(Xt) +√
Σet
One way to use the Kalman filter is by linear approximating themeasurement equation,
yt ≈ HtXt +√
Σet , Ht =∂h(Xt)
∂Xt
∣∣∣∣Xt=Xt
It works well when the nonlinearity in the measurement equation issmall.
Numerical issueHow to compute the gradient?The covariance matrix can become negative.
Wu (Baruch) Statistical Arbitrage 50 / 70

Approximating the distribution
Measurement : yt = h(Xt) +√
Σet
The Kalman filter applies Bayesian rules in updating the conditionallynormal distributions.
Instead of approximating the measurement equation h(Xt), wedirectly approximate the distribution and then apply Bayesian rules onthe approximate distribution.
There are two ways of approximating the distribution:
Draw a large amount of random numbers, and propagate these randomnumbers — Particle filter. (more generic)Choose “sigma” points deterministically to approximate thedistribution (think of binominal tree approximating a normaldistribution) — unscented filter. (faster, easier to implement)
Wu (Baruch) Statistical Arbitrage 51 / 70

The unscented Kalman filter
Let k = 3 be the number of states and δ > 0 be a control parameter.A set of 2k + 1 sigma vectors χi are generated according to:
χt,0 = Xt , χt,i = Xt ±√
(k + δ)(Ωt + Q)j (2)
with corresponding weights wi given by
w0 = δ/(k + δ), wi = 1/[2(k + δ)].
We can regard these sigma vectors as forming a discrete distributionwith wi as the corresponding probabilities.
We can verify that the mean, covariance, skewness, and kurtosis ofthis distribution are Xt , Ωt + Q, 0, and k + δ, respectively.
Wu (Baruch) Statistical Arbitrage 52 / 70

The unscented Kalman filter
Given the sigma points, the prediction steps are given by
X t+1 = A +2k∑i=0
wi (Φχt,i );
Ωt+1 =2k∑i=0
wi (A + Φχt,i − X t+1)(A + Φχt,i − X t+1)>;
y t+1 =2k∑i=0
wih (A + Φχt,i ) ;
V t+1 =2k∑i=0
wi
[h (A + Φχt,i )− y t+1
] [h (A + Φχt,i )− y t+1
]>+ Σ,
The filtering updates are given by
Xt+1 = X t+1 + Kt+1
(yt+1 − y t+1
);
Ωt+1 = Ωt+1 − Kt+1V t+1K>t+1,
with Kt+1 = St+1
(V t+1
)−1.
Wu (Baruch) Statistical Arbitrage 53 / 70

Alternative estimation approaches
Instead of estimating the model on LIBOR and swap rates, we canestimate the model on stripped continuously compounded spot orforward rates, which are affine in the state vector.
Pros: We can use Kalman filter, with no approximation.Cons: Which spot maturities to choose? The measurement errors willdepend on the stripping method.For our trading strategy, we actually need to know the pricing error ontradable securities.
Exact matching: Assume that three of the LIBOR/swap rates (orthree spot rates) are priced exactly by the 3 factors. Then, we candirectly invert the state variables at each date exactly.
The likelihood function can be built on the state variables directly,maybe with additional likelihood on pricing errors on other series.Which rate series are priced fair? Which rates have error?Kalman filter amounts to a least square fitting to all rates.
Wu (Baruch) Statistical Arbitrage 54 / 70

Static v. dynamic consistency
In many applications, banks choose to use a simpler model (say, onefactor interest rate model), but recalibrate the model parameters eachday to the market data.
The “same model” with different parameters are essentially differentmodels.
When a model is re-calibrated daily, the model parameters alsobecome state variables.
At a fixed point in time, the model-generated prices satisfyno-arbitrage conditions. They are internally consistent.
But model-generated prices at different days with differentre-calibrated parameters are no longer consistency with each other.
Static consistency (across different securities) could be sufficient forshort-term investors and market makers who do not hold overnightpositions.
Dynamic consistency (over time) becomes important when a firm(such as a hedge fund) places long-term bets.Wu (Baruch) Statistical Arbitrage 55 / 70

Estimated factor dynamics
Forecasting dynamics κP Risk-neutral dynamics κ∗
0.002 0 0(0.02) −− −−−0.186 0.480 0(0.42) (1.19) −−−0.749 −2.628 0.586(1.80) (3.40) (2.55)
0.014 0 0(11.6) −− −−0.068 0.707 0(1.92) (20.0) −−−2.418 −3.544 1.110(10.7) (12.0) (20.0)
The t-values are smaller for κP than for κ.
The largest eigenvalue of κP is 0.586⇒ Weekly autocorrelation 0.989, half life 62 weeks.
Wu (Baruch) Statistical Arbitrage 56 / 70

Summary statistics of the pricing errors (bps)
Maturity Mean MAE Std Max Auto R2
1 m 1.82 6.89 10.53 60.50 0.80 99.653 m 0.35 1.87 3.70 31.96 0.73 99.96
12 m −9.79 10.91 10.22 55.12 0.79 99.702 y −0.89 2.93 4.16 23.03 0.87 99.945 y 0.20 1.30 1.80 10.12 0.56 99.98
10 y 0.07 2.42 3.12 12.34 0.70 99.9115 y 2.16 5.79 7.07 22.29 0.85 99.4030 y −0.53 8.74 11.07 34.58 0.90 98.31
Average −0.79 4.29 5.48 27.06 0.69 99.71
The errors are small. The 3 factors explain over 99%.
The average persistence of the pricing errors (0.69, half life 3 weeks)is much smaller than that of the interest rates (0.991, 1.5 years).
Wu (Baruch) Statistical Arbitrage 57 / 70

4-week ahead forecasting
Three strategies:(1) random walk (RW); (2) AR(1) regression (OLS); (3) DTSM.Explained Variation = 100× [1− var(Err)/var(∆R)]
Maturity RW OLS DTSM
6 m 0.00 0.53 -31.712 y 0.00 0.02 -7.873 y 0.00 0.13 -0.885 y 0.00 0.44 0.8110 y 0.00 1.07 -3.8730 y 0.00 1.53 -36.64
OLS is not that much better than RW, due to high persistence (max1.5%).
DTSM is the worst! DTSM can be used to fit the term structure(99%), but not forecast interest rates.
Wu (Baruch) Statistical Arbitrage 58 / 70
Use DTSM as a decomposition tool
Linearly decompose the LIBOR/swap rates (y) as
y it ≈ H>i Xt + e it , Hi =∂y it∂Xt
∣∣∣∣Xt=0
Form a portfolio (m = [m1,m2,m3,m4]>) of 4 LIBOR/swap rates sothat
pt =4∑
i=1
miyit ≈
4∑i=1
miH>i Xt +
4∑i=1
mieit =
4∑i=1
mieit .
Choose the portfolio weights to hedge away its dependence on thethree factors: Hm = 0.
2 rates are needed to cancel out their dependence on 1 factor.3 rates are needed to cancel out their dependence on 2 factors.4 rates are needed to cancel out their dependence on 3 factors.
Wu (Baruch) Statistical Arbitrage 59 / 70

Example: A 4-rate portfolio (2-5-10-30)
Portfolio weights: m = [0.0277,−0.4276, 1.0000,−0.6388].Long 10-yr swap, use 2, 5, and 30-yr swaps to hedge.
Jan96 Jan98 Jan00 Jan02
−45
−40
−35
−30
−25
−20
−15
Inte
rest
Rat
e Po
rtfol
io, B
ps
Jan96 Jan98 Jan00 Jan023.5
4
4.5
5
5.5
6
6.5
7
7.5
8
10−Y
ear S
wap
, %
Hedged 10-yr swap Unhedged 10-yr swapφ (half life): 0.816 (one month) vs. 0.987 (one year).∆Rt+1 = −0.0849 − 0.2754Rt + et+1, R2 = 0.14,
(0.0096) (0.0306)
R2 = 1.07% for the unhedged 10-year swap rate.
Wu (Baruch) Statistical Arbitrage 60 / 70

Predictability of 4-rate portfolios
0 10 20 30 40 50 600
10
20
30
40
50
60
70
80
90
100
Percentage Explained Variance, %
Four−Instrument Portfolios
12 rates can generate 495 4-instrument portfolios.
Improved predictability for all portfolios (against unhedged singlerates)
Wu (Baruch) Statistical Arbitrage 61 / 70

Predictability of 2- and 3-rate portfolios
0 10 20 30 40 50 600
10
20
30
40
50
60
70
80
90
100
Percentage Explained Variance, %
Two−Instrument Portfolios
0 10 20 30 40 50 600
10
20
30
40
50
60
70
80
90
100
Percentage Explained Variance, %
Three−Instrument Portfolios
No guaranteed success for spread (2-rate) and butterfly (3-rate)portfolios.
Predictability improves dramatically after the 3rd factor.
Wu (Baruch) Statistical Arbitrage 62 / 70

A simple buy and hold investment strategyon interest-rate portfolios
Form 4-instrument swap portfolios (m). Regard each swap contractas a par bond.
At each time, long the portfolio if the portfolio swap rate is higherthan the model value. Short otherwise:
wt = c[m> (yt − SWAP(Xt))
]Hold each investment for 4 weeks and liquidate.
Need interpolation to obtain swap quotes at off-grid maturities.For discounting, one can use piece-wise constant forward to strip theyield curve.
Remark: The (over-simplified) strategy is for illustration only; it is notan optimized strategy.
Wu (Baruch) Statistical Arbitrage 63 / 70

P&L calculation
Consider a 4-instrument swap portfolio with fixed portfolio weights m.
At time t, the investment in this portfolio is wt (based on whetherthis portfolio value is higher or lower than the model value.
The initial cost of this investment is Ct = 100wt∑4
i=1 mi , regardingeach swap contract as a par bond with $100 par value.
At the end of the holding horizon T (4 weeks later), liquidate theportfolio. The revenue from the liquation is:
PT = wt
4∑i=1
mi
(S it
∑ti
D(T , ti ) + 100D(T ,Ti )
)
D(T , ti ) — the time-T discount factor at expiry date ti .ti — the coupon dates of the ith bond with coupon rate being thetime-t swap rate S i
t .
P&L = PT − Ctert(T−t), with rt denoting the continuously
compounded rate corresponding to the time-t three-month LIBOR,the financing rate of the swap contract.Wu (Baruch) Statistical Arbitrage 64 / 70

Profitability of investing in four-instrument swap portfolios
Jan96 Jan98 Jan00 Jan02
0
50
100
150
200
Cu
mu
lative
We
alth
0.4 0.5 0.6 0.7 0.8 0.90
1
2
3
4
5
6
Annualized Information Ratio
Wu (Baruch) Statistical Arbitrage 65 / 70

The sources of the profitability
Risk and return characteristics
The investment returns are not related to traditional stock and bondmarket factors (the usual suspects):Rm, HML, SMB, UMD, Credit spread, interest rate volatility,...But are positively related to some swap market liquidity measures.
Interpretation
The first 3 factors relate to systematic economic movements:Inflation rate, output gap, monetary policy, ...What is left is mainly due to short-term liquidity shocks.By providing liquidity to the market, one can earn economicallysignificant returns.Duarte, Longstaff, Yu (2005): Compensation for intellectual capital.
Wu (Baruch) Statistical Arbitrage 66 / 70

A mean-variance setup
Let yt ∈ RN denote a vector of observed derivative prices, let h(Xt)denote the model-implied value as a function of the state vectorXt ∈ Rk . Let Ht = ∂h(Xt)/∂Xt ∈ RN×k denote the gradient matrixat time t.
−et = h(Xt)− yt can be regarded as the “alpha” of the asset and Ht
its risk exposure.
We can solve the following quadratic program:
maxwt−w>t et −
1
2γw>t Σewt
subject to factor exposure constraints:
H>t wt = c ∈ Rk .
The above equation maximizes the expected return (alpha) of theportfolio subject to factor exposure constraints.Setting c = 0 maintains (first order) factor-neutrality.
Wu (Baruch) Statistical Arbitrage 67 / 70

Updated out-of-sample cumulative P&L on US swap rates
99 00 01 02 03 04 05 06 07 08 09 10 11 12 13 14 15
2
4
6
8
10
12
14
x 105
Cum
ulat
ive
Wea
lth
Mean−variance
Wu (Baruch) Statistical Arbitrage 68 / 70
After thoughts: Implications for modeling
Models based on a low-dimensional state vector is important insmoothing and achieving dimension reduction.
Wherever there is a new instrument, there are new supply-demandshocks.
Modeling/understanding these supply-demand shocks can beeconomically important when:
making short-term investments / market making,
pricing interest-rate derivatives / unspanned volatility,
understanding the covariation of different interest-rate series.
Wu (Baruch) Statistical Arbitrage 69 / 70

After thoughts: The role of no-arbitrage models
No-arbitrage models provide relative valuation across assets, andhence can be best used for cross-sectional comparison.
No-arbitrage theory does not tell us how to predict the factors,
but it does tell us how each instrument is related to the factor risk(factor loading).
⇒ It is the most useful for hedging:
Hedge away the risk, exploit the opportunity.
Wu (Baruch) Statistical Arbitrage 70 / 70