Embed Size (px)
Citation preview
Static and fatigue failure simulation of concrete material by discrete analysis
K. Nagai The University of Tokyo, Tokyo, Japan
K. Matsumoto Tokyo Institute of Technology, Tokyo, Japan
ABSTRACT: This paper describes an approach to develop an analytical scheme for a prediction of life span of concrete material. Failure simulation of concrete at material scale by discrete analysis method, which can consider the effect of its component including environmental effect, is conducted to evaluate the concrete mechanical damage or fracture directly. As the chronological damage, a frost damage effect is introduced by the meso scale fracture. Fatigue simulation is conducted by modeling the time-depend phenomenon including elastic, visco-elastic, visco-plastic and cracking component.
1 INTRODUTION
Concrete material is, in fact, consisted of aggregates and cement paste, therefore its behavior is hetero-geneous. However, as stress-strain model of concrete in continuous numerical method such as finite element analysis corresponds to an average response of certain area, concrete is often treated as homo-geneous material in engineering field. While such homogeneous modeling of concrete is useful in design, there are some problems. Especially, modeling of crack is one of the most difficult points. For example, localization of mass diffusion in cracked concrete cannot be simulated directly by smeared crack model in which crack is averagely introduced over the elements. One of the solutions for the problem is discrete numerical analyses, in which cracks are discontinuously introduced.
The Rigid Body-Spring Model (RBSM) (Kawai 1978), in which mechanical behavior of the object is represented by rigid body elements and springs interconnect them, is a discrete numerical method and has been applied for analysis of concrete structures and materials (Bolander & Saito 1997, 1998). In this study, RBSM was applied for mortar and concrete subjected to static and fatigue loadings in two dimension. Modeling of the material is based on the meso-scale concept, in which material failure at the macro scale is assumed to be an accumulation of tensile and shear fractures at micro scale, therefore no fracture occur in compression region of stress-strain model of the connected springs. The tensile and shear behavior are represented by liner softening model and shear slipping criteria which is
a function of normal and shear stresses, respectively. For the static analyses, aggregate, mortar and their interface were separately modeled and the constitutive law was introduced. Based on this concept, chrono-logical phenomenon is predicted in this study that are deterioration by frost damage and fatigue loading. To simulate the mechanical characteristics of damaged concrete by frost-damage, zero strength elements and the concept of mesoscale plastic tensile strain are introduced into the normal RBSM springs to consider the experimentally observed cracking and plastic deformation caused by frost damage. For the fatigue analyses, time-dependent model which includes elastic, visco-elastic, visco-plastic and cracking component was developed based on the static model and then introduced into RBSM.
2 STATIC SIMULATION OF CONCRETE MATERIAL
The RBSM developed by Kawai (1978) is one of discrete numerical analysis method. Analytical model is divided into polyhedron elements whose faces are interconnected by springs. Each element has two transitional and one rotational degrees of freedom those are given at some point inside of element. The point works as a node that constructs a spring network. Normal and shear springs are placed on the face (Fig. 1). Since cracks initiate and propagate along the boundary face, the mesh arrangement may affect fracture direction. To avoid formation of cracks with a certain direction, a random geometry is introduced using a Voronoi
Fracture Mechanics of Concrete and Concrete Structures -Recent Advances in Fracture Mechanics of Concrete - B. H. Oh, et al.(eds)
ⓒ 2010 Korea Concrete Institute, Seoul, ISBN 978-89-5708-180-8
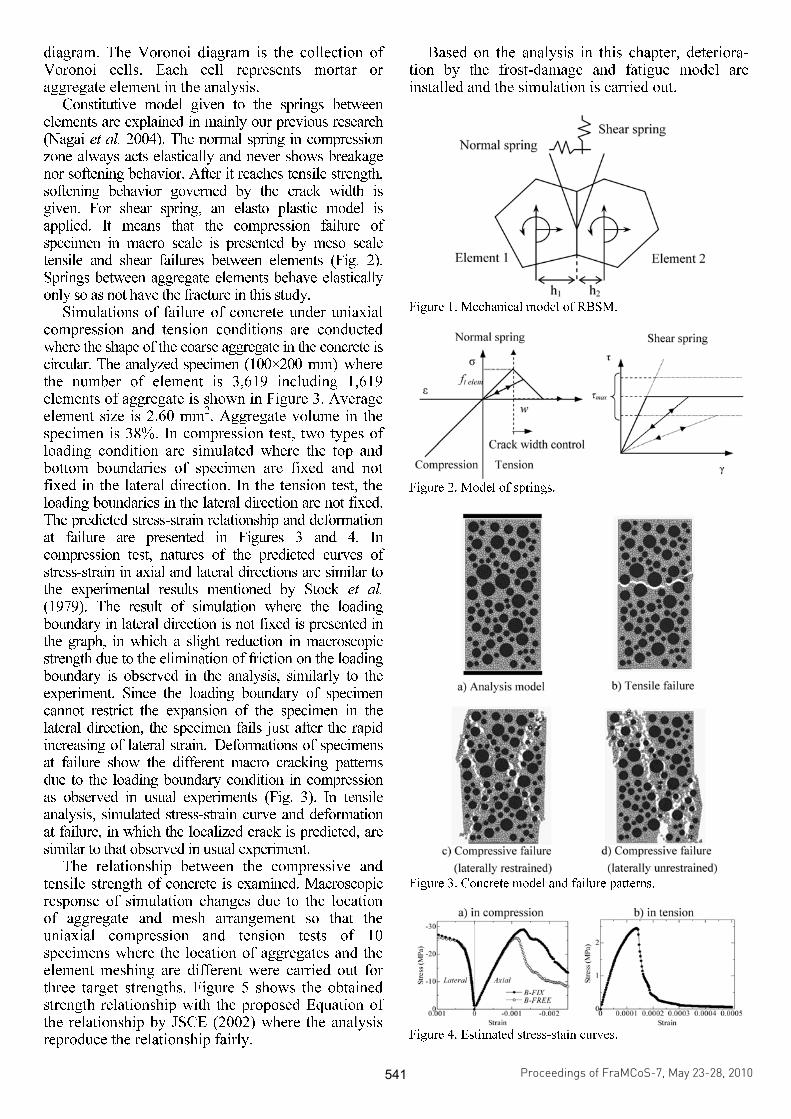
diagram. The Voronoi diagram is the collection of Voronoi cells. Each cell represents mortar or aggregate element in the analysis.
Constitutive model given to the springs between elements are explained in mainly our previous research (Nagai et al. 2004). The normal spring in compression zone always acts elastically and never shows breakage nor softening behavior. After it reaches tensile strength, softening behavior governed by the crack width is given. For shear spring, an elasto plastic model is applied. It means that the compression failure of specimen in macro scale is presented by meso scale tensile and shear failures between elements (Fig. 2). Springs between aggregate elements behave elastically only so as not have the fracture in this study.
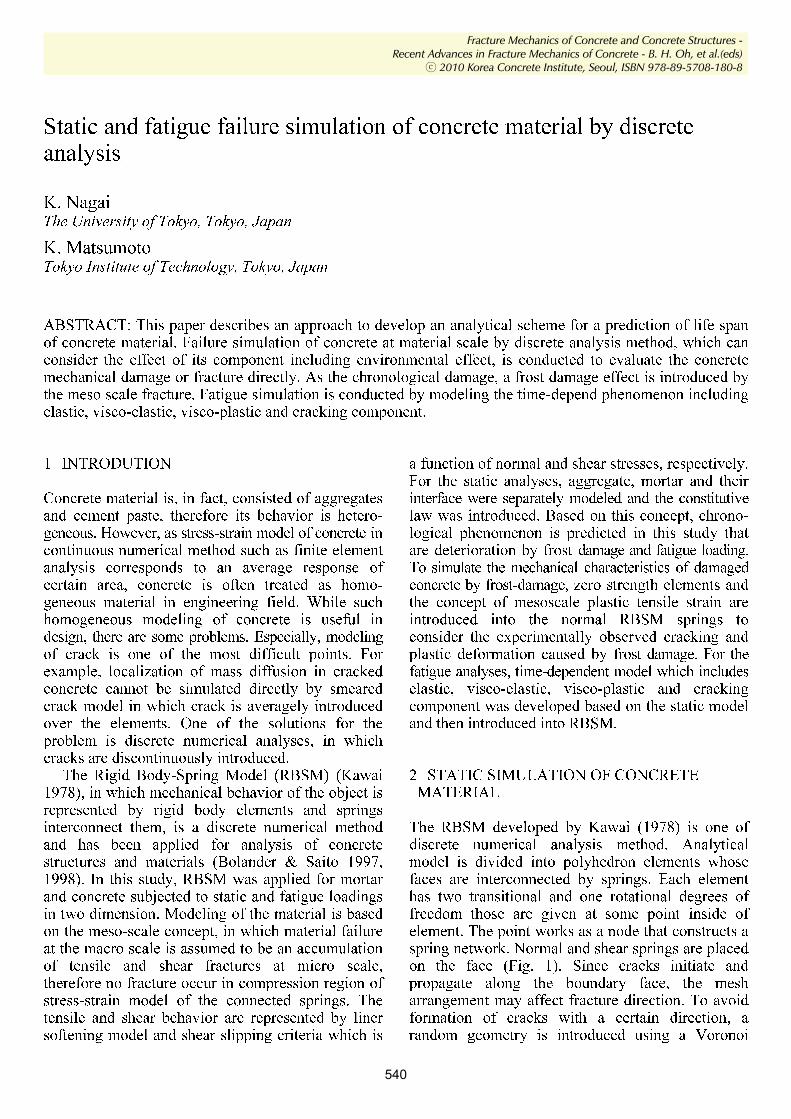
Simulations of failure of concrete under uniaxial compression and tension conditions are conducted where the shape of the coarse aggregate in the concrete is circular. The analyzed specimen (100×200 mm) where the number of element is 3,619 including 1,619 elements of aggregate is shown in Figure 3. Average element size is 2.60 mm
2. Aggregate volume in the
specimen is 38%. In compression test, two types of loading condition are simulated where the top and bottom boundaries of specimen are fixed and not fixed in the lateral direction. In the tension test, the loading boundaries in the lateral direction are not fixed. The predicted stress-strain relationship and deformation at failure are presented in Figures 3 and 4. In compression test, natures of the predicted curves of stress-strain in axial and lateral directions are similar to the experimental results mentioned by Stock et al. (1979). The result of simulation where the loading boundary in lateral direction is not fixed is presented in the graph, in which a slight reduction in macroscopic strength due to the elimination of friction on the loading boundary is observed in the analysis, similarly to the experiment. Since the loading boundary of specimen cannot restrict the expansion of the specimen in the lateral direction, the specimen fails just after the rapid increasing of lateral strain. Deformations of specimens at failure show the different macro cracking patterns due to the loading boundary condition in compression as observed in usual experiments (Fig. 3). In tensile analysis, simulated stress-strain curve and deformation at failure, in which the localized crack is predicted, are similar to that observed in usual experiment.
The relationship between the compressive and tensile strength of concrete is examined. Macroscopic response of simulation changes due to the location of aggregate and mesh arrangement so that the uniaxial compression and tension tests of 10 specimens where the location of aggregates and the element meshing are different were carried out for three target strengths. Figure 5 shows the obtained strength relationship with the proposed Equation of the relationship by JSCE (2002) where the analysis reproduce the relationship fairly.
Based on the analysis in this chapter, deteriora-tion by the frost-damage and fatigue model are installed and the simulation is carried out.
Figure 1. Mechanical model of RBSM.
Figure 2. Model of springs.
Figure 3. Concrete model and failure patterns.
Figure 4. Estimated stress-stain curves.
Proceedings of FraMCoS-7, May 23-28, 2010
hThD ∇−= ),(J (1)
The proportionality coefficient D(h,T) is called moisture permeability and it is a nonlinear function of the relative humidity h and temperature T (Bažant & Najjar 1972). The moisture mass balance requires that the variation in time of the water mass per unit volume of concrete (water content w) be equal to the divergence of the moisture flux J
J•∇=∂
∂−
t
w (2)
The water content w can be expressed as the sum
of the evaporable water we (capillary water, water vapor, and adsorbed water) and the non-evaporable (chemically bound) water wn (Mills 1966, Pantazopoulo & Mills 1995). It is reasonable to assume that the evaporable water is a function of relative humidity, h, degree of hydration, αc, and degree of silica fume reaction, αs, i.e. we=we(h,αc,αs) = age-dependent sorption/desorption isotherm (Norling Mjonell 1997). Under this assumption and by substituting Equation 1 into Equation 2 one obtains
nscw
s
ew
c
ew
hh
Dt
h
h
ew
&&& ++∂
∂
∂
∂
=∇•∇+∂
∂
∂
∂
− αα
αα
)(
(3)
where ∂we/∂h is the slope of the sorption/desorption isotherm (also called moisture capacity). The governing equation (Equation 3) must be completed by appropriate boundary and initial conditions.
The relation between the amount of evaporable water and relative humidity is called ‘‘adsorption isotherm” if measured with increasing relativity humidity and ‘‘desorption isotherm” in the opposite case. Neglecting their difference (Xi et al. 1994), in the following, ‘‘sorption isotherm” will be used with reference to both sorption and desorption conditions. By the way, if the hysteresis of the moisture isotherm would be taken into account, two different relation, evaporable water vs relative humidity, must be used according to the sign of the variation of the relativity humidity. The shape of the sorption isotherm for HPC is influenced by many parameters, especially those that influence extent and rate of the chemical reactions and, in turn, determine pore structure and pore size distribution (water-to-cement ratio, cement chemical composition, SF content, curing time and method, temperature, mix additives, etc.). In the literature various formulations can be found to describe the sorption isotherm of normal concrete (Xi et al. 1994). However, in the present paper the semi-empirical expression proposed by Norling Mjornell (1997) is adopted because it
explicitly accounts for the evolution of hydration reaction and SF content. This sorption isotherm reads
( ) ( )( )
( ) ( )⎥⎥
⎦
⎤
⎢⎢
⎣
⎡
⎥⎥⎥
⎦
⎤
⎢⎢⎢
⎣
⎡
−
−∞
+
−∞
−=
1110
,1
110
11,
1,,
hcc
ge
scK
hcc
ge
scG
sch
ew
αα
αα
αα
αααα
(4)
where the first term (gel isotherm) represents the physically bound (adsorbed) water and the second term (capillary isotherm) represents the capillary water. This expression is valid only for low content of SF. The coefficient G1 represents the amount of water per unit volume held in the gel pores at 100% relative humidity, and it can be expressed (Norling Mjornell 1997) as
( ) ss
s
vgkc
c
c
vgk
scG αααα +=,1
(5)
where k
cvg and k
svg are material parameters. From the
maximum amount of water per unit volume that can fill all pores (both capillary pores and gel pores), one can calculate K1 as one obtains
( )1
110
110
11
22.0188.00
,1
−⎟⎠
⎞⎜⎝
⎛−∞
⎥⎥⎥
⎦
⎤
⎢⎢⎢
⎣
⎡⎟⎠
⎞⎜⎝
⎛−∞
−−+−
=
hcc
ge
hcc
geGs
ssc
w
scK
αα
αα
αα
αα
(6)
The material parameters k
cvg and k
svg and g1 can
be calibrated by fitting experimental data relevant to free (evaporable) water content in concrete at various ages (Di Luzio & Cusatis 2009b).
2.2 Temperature evolution
Note that, at early age, since the chemical reactions associated with cement hydration and SF reaction are exothermic, the temperature field is not uniform for non-adiabatic systems even if the environmental temperature is constant. Heat conduction can be described in concrete, at least for temperature not exceeding 100°C (Bažant & Kaplan 1996), by Fourier’s law, which reads
T∇−= λq (7)
where q is the heat flux, T is the absolute temperature, and λ is the heat conductivity; in this
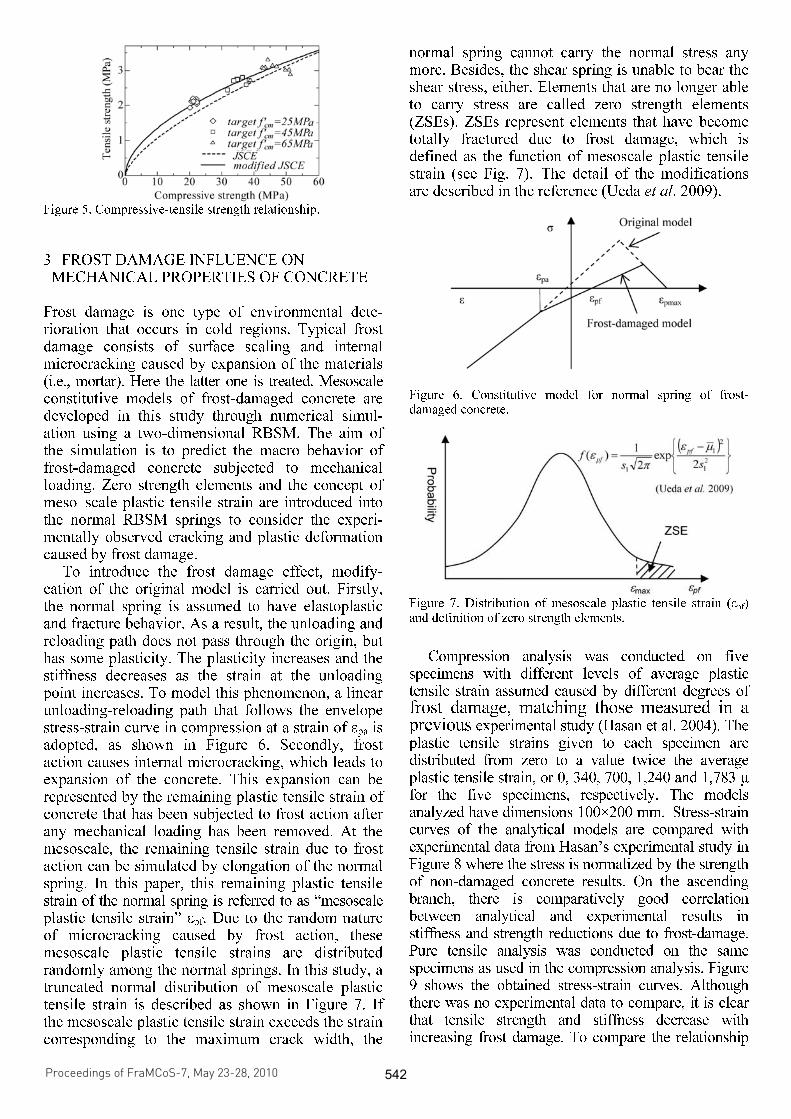
Figure 5. Compressive-tensile strength relationship.
3 FROST DAMAGE INFLUENCE ON MECHANICAL PROPERTIES OF CONCRETE
Frost damage is one type of environmental dete-rioration that occurs in cold regions. Typical frost damage consists of surface scaling and internal microcracking caused by expansion of the materials (i.e., mortar). Here the latter one is treated. Mesoscale constitutive models of frost-damaged concrete are developed in this study through numerical simul-ation using a two-dimensional RBSM. The aim of the simulation is to predict the macro behavior of frost-damaged concrete subjected to mechanical loading. Zero strength elements and the concept of meso scale plastic tensile strain are introduced into the normal RBSM springs to consider the experi-mentally observed cracking and plastic deformation caused by frost damage.
To introduce the frost damage effect, modify-cation of the original model is carried out. Firstly, the normal spring is assumed to have elastoplastic and fracture behavior. As a result, the unloading and reloading path does not pass through the origin, but has some plasticity. The plasticity increases and the stiffness decreases as the strain at the unloading point increases. To model this phenomenon, a linear unloading-reloading path that follows the envelope stress-strain curve in compression at a strain of εpa is adopted, as shown in Figure 6. Secondly, frost action causes internal microcracking, which leads to expansion of the concrete. This expansion can be represented by the remaining plastic tensile strain of concrete that has been subjected to frost action after any mechanical loading has been removed. At the mesoscale, the remaining tensile strain due to frost action can be simulated by elongation of the normal spring. In this paper, this remaining plastic tensile strain of the normal spring is referred to as “mesoscale plastic tensile strain” εpf. Due to the random nature of microcracking caused by frost action, these mesoscale plastic tensile strains are distributed randomly among the normal springs. In this study, a truncated normal distribution of mesoscale plastic tensile strain is described as shown in Figure 7. If the mesoscale plastic tensile strain exceeds the strain corresponding to the maximum crack width, the
normal spring cannot carry the normal stress any more. Besides, the shear spring is unable to bear the shear stress, either. Elements that are no longer able to carry stress are called zero strength elements (ZSEs). ZSEs represent elements that have become totally fractured due to frost damage, which is defined as the function of mesoscale plastic tensile strain (see Fig. 7). The detail of the modifications are described in the reference (Ueda et al. 2009).
Figure 6. Constitutive model for normal spring of frost- damaged concrete.
Figure 7. Distribution of mesoscale plastic tensile strain (εpf) and definition of zero strength elements.
Compression analysis was conducted on five specimens with different levels of average plastic tensile strain assumed caused by different degrees of frost damage, matching those measured in a previous experimental study (Hasan et al. 2004). The plastic tensile strains given to each specimen are distributed from zero to a value twice the average plastic tensile strain, or 0, 340, 700, 1,240 and 1,783 µ for the five specimens, respectively. The models analyzed have dimensions 100×200 mm. Stress-strain curves of the analytical models are compared with experimental data from Hasan’s experimental study in Figure 8 where the stress is normalized by the strength of non-damaged concrete results. On the ascending branch, there is comparatively good correlation between analytical and experimental results in stiffness and strength reductions due to frost-damage. Pure tensile analysis was conducted on the same specimens as used in the compression analysis. Figure 9 shows the obtained stress-strain curves. Although there was no experimental data to compare, it is clear that tensile strength and stiffness decrease with increasing frost damage. To compare the relationship
Proceedings of FraMCoS-7, May 23-28, 2010
hThD ∇−= ),(J (1)
The proportionality coefficient D(h,T) is called moisture permeability and it is a nonlinear function of the relative humidity h and temperature T (Bažant & Najjar 1972). The moisture mass balance requires that the variation in time of the water mass per unit volume of concrete (water content w) be equal to the divergence of the moisture flux J
J•∇=∂
∂−
t
w (2)
The water content w can be expressed as the sum
of the evaporable water we (capillary water, water vapor, and adsorbed water) and the non-evaporable (chemically bound) water wn (Mills 1966, Pantazopoulo & Mills 1995). It is reasonable to assume that the evaporable water is a function of relative humidity, h, degree of hydration, αc, and degree of silica fume reaction, αs, i.e. we=we(h,αc,αs) = age-dependent sorption/desorption isotherm (Norling Mjonell 1997). Under this assumption and by substituting Equation 1 into Equation 2 one obtains
nscw
s
ew
c
ew
hh
Dt
h
h
ew
&&& ++∂
∂
∂
∂
=∇•∇+∂
∂
∂
∂
− αα
αα
)(
(3)
where ∂we/∂h is the slope of the sorption/desorption isotherm (also called moisture capacity). The governing equation (Equation 3) must be completed by appropriate boundary and initial conditions.
The relation between the amount of evaporable water and relative humidity is called ‘‘adsorption isotherm” if measured with increasing relativity humidity and ‘‘desorption isotherm” in the opposite case. Neglecting their difference (Xi et al. 1994), in the following, ‘‘sorption isotherm” will be used with reference to both sorption and desorption conditions. By the way, if the hysteresis of the moisture isotherm would be taken into account, two different relation, evaporable water vs relative humidity, must be used according to the sign of the variation of the relativity humidity. The shape of the sorption isotherm for HPC is influenced by many parameters, especially those that influence extent and rate of the chemical reactions and, in turn, determine pore structure and pore size distribution (water-to-cement ratio, cement chemical composition, SF content, curing time and method, temperature, mix additives, etc.). In the literature various formulations can be found to describe the sorption isotherm of normal concrete (Xi et al. 1994). However, in the present paper the semi-empirical expression proposed by Norling Mjornell (1997) is adopted because it
explicitly accounts for the evolution of hydration reaction and SF content. This sorption isotherm reads
( ) ( )( )
( ) ( )⎥⎥
⎦
⎤
⎢⎢
⎣
⎡
⎥⎥⎥
⎦
⎤
⎢⎢⎢
⎣
⎡
−
−∞
+
−∞
−=
1110
,1
110
11,
1,,
hcc
ge
scK
hcc
ge
scG
sch
ew
αα
αα
αα
αααα
(4)
where the first term (gel isotherm) represents the physically bound (adsorbed) water and the second term (capillary isotherm) represents the capillary water. This expression is valid only for low content of SF. The coefficient G1 represents the amount of water per unit volume held in the gel pores at 100% relative humidity, and it can be expressed (Norling Mjornell 1997) as
( ) ss
s
vgkc
c
c
vgk
scG αααα +=,1
(5)
where k
cvg and k
svg are material parameters. From the
maximum amount of water per unit volume that can fill all pores (both capillary pores and gel pores), one can calculate K1 as one obtains
( )1
110
110
11
22.0188.00
,1
−⎟⎠
⎞⎜⎝
⎛−∞
⎥⎥⎥
⎦
⎤
⎢⎢⎢
⎣
⎡⎟⎠
⎞⎜⎝
⎛−∞
−−+−
=
hcc
ge
hcc
geGs
ssc
w
scK
αα
αα
αα
αα
(6)
The material parameters k
cvg and k
svg and g1 can
be calibrated by fitting experimental data relevant to free (evaporable) water content in concrete at various ages (Di Luzio & Cusatis 2009b).
2.2 Temperature evolution
Note that, at early age, since the chemical reactions associated with cement hydration and SF reaction are exothermic, the temperature field is not uniform for non-adiabatic systems even if the environmental temperature is constant. Heat conduction can be described in concrete, at least for temperature not exceeding 100°C (Bažant & Kaplan 1996), by Fourier’s law, which reads
T∇−= λq (7)
where q is the heat flux, T is the absolute temperature, and λ is the heat conductivity; in this
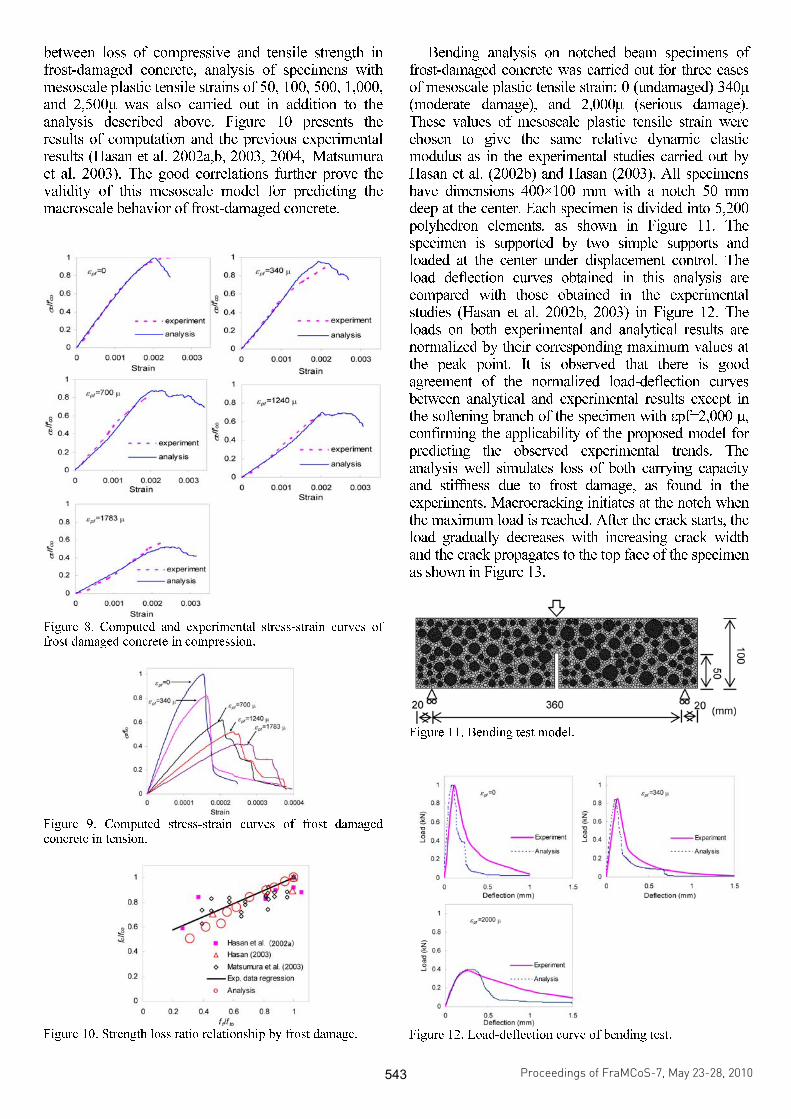
between loss of compressive and tensile strength in frost-damaged concrete, analysis of specimens with mesoscale plastic tensile strains of 50, 100, 500, 1,000, and 2,500µ was also carried out in addition to the analysis described above. Figure 10 presents the results of computation and the previous experimental results (Hasan et al. 2002a,b, 2003, 2004, Matsumura et al. 2003). The good correlations further prove the validity of this mesoscale model for predicting the macroscale behavior of frost-damaged concrete.
Figure 8. Computed and experimental stress-strain curves of frost damaged concrete in compression.
Figure 9. Computed stress-strain curves of frost damaged concrete in tension.
Figure 10. Strength loss ratio relationship by frost damage.
Bending analysis on notched beam specimens of frost-damaged concrete was carried out for three cases of mesoscale plastic tensile strain: 0 (undamaged) 340µ (moderate damage), and 2,000µ (serious damage). These values of mesoscale plastic tensile strain were chosen to give the same relative dynamic elastic modulus as in the experimental studies carried out by Hasan et al. (2002b) and Hasan (2003). All specimens have dimensions 400×100 mm with a notch 50 mm deep at the center. Each specimen is divided into 5,200 polyhedron elements, as shown in Figure 11. The specimen is supported by two simple supports and loaded at the center under displacement control. The load deflection curves obtained in this analysis are compared with those obtained in the experimental studies (Hasan et al. 2002b, 2003) in Figure 12. The loads on both experimental and analytical results are normalized by their corresponding maximum values at the peak point. It is observed that there is good agreement of the normalized load-deflection curves between analytical and experimental results except in the softening branch of the specimen with εpf=2,000 µ, confirming the applicability of the proposed model for predicting the observed experimental trends. The analysis well simulates loss of both carrying capacity and stiffness due to frost damage, as found in the experiments. Macrocracking initiates at the notch when the maximum load is reached. After the crack starts, the load gradually decreases with increasing crack width and the crack propagates to the top face of the specimen as shown in Figure 13.
Figure 11. Bending test model.
Figure 12. Load-deflection curve of bending test.
Proceedings of FraMCoS-7, May 23-28, 2010
hThD ∇−= ),(J (1)
The proportionality coefficient D(h,T) is called moisture permeability and it is a nonlinear function of the relative humidity h and temperature T (Bažant & Najjar 1972). The moisture mass balance requires that the variation in time of the water mass per unit volume of concrete (water content w) be equal to the divergence of the moisture flux J
J•∇=∂
∂−
t
w (2)
The water content w can be expressed as the sum
of the evaporable water we (capillary water, water vapor, and adsorbed water) and the non-evaporable (chemically bound) water wn (Mills 1966, Pantazopoulo & Mills 1995). It is reasonable to assume that the evaporable water is a function of relative humidity, h, degree of hydration, αc, and degree of silica fume reaction, αs, i.e. we=we(h,αc,αs) = age-dependent sorption/desorption isotherm (Norling Mjonell 1997). Under this assumption and by substituting Equation 1 into Equation 2 one obtains
nscw
s
ew
c
ew
hh
Dt
h
h
ew
&&& ++∂
∂
∂
∂
=∇•∇+∂
∂
∂
∂
− αα
αα
)(
(3)
where ∂we/∂h is the slope of the sorption/desorption isotherm (also called moisture capacity). The governing equation (Equation 3) must be completed by appropriate boundary and initial conditions.
The relation between the amount of evaporable water and relative humidity is called ‘‘adsorption isotherm” if measured with increasing relativity humidity and ‘‘desorption isotherm” in the opposite case. Neglecting their difference (Xi et al. 1994), in the following, ‘‘sorption isotherm” will be used with reference to both sorption and desorption conditions. By the way, if the hysteresis of the moisture isotherm would be taken into account, two different relation, evaporable water vs relative humidity, must be used according to the sign of the variation of the relativity humidity. The shape of the sorption isotherm for HPC is influenced by many parameters, especially those that influence extent and rate of the chemical reactions and, in turn, determine pore structure and pore size distribution (water-to-cement ratio, cement chemical composition, SF content, curing time and method, temperature, mix additives, etc.). In the literature various formulations can be found to describe the sorption isotherm of normal concrete (Xi et al. 1994). However, in the present paper the semi-empirical expression proposed by Norling Mjornell (1997) is adopted because it
explicitly accounts for the evolution of hydration reaction and SF content. This sorption isotherm reads
( ) ( )( )
( ) ( )⎥⎥
⎦
⎤
⎢⎢
⎣
⎡
⎥⎥⎥
⎦
⎤
⎢⎢⎢
⎣
⎡
−
−∞
+
−∞
−=
1110
,1
110
11,
1,,
hcc
ge
scK
hcc
ge
scG
sch
ew
αα
αα
αα
αααα
(4)
where the first term (gel isotherm) represents the physically bound (adsorbed) water and the second term (capillary isotherm) represents the capillary water. This expression is valid only for low content of SF. The coefficient G1 represents the amount of water per unit volume held in the gel pores at 100% relative humidity, and it can be expressed (Norling Mjornell 1997) as
( ) ss
s
vgkc
c
c
vgk
scG αααα +=,1
(5)
where k
cvg and k
svg are material parameters. From the
maximum amount of water per unit volume that can fill all pores (both capillary pores and gel pores), one can calculate K1 as one obtains
( )1
110
110
11
22.0188.00
,1
−⎟⎠
⎞⎜⎝
⎛−∞
⎥⎥⎥
⎦
⎤
⎢⎢⎢
⎣
⎡⎟⎠
⎞⎜⎝
⎛−∞
−−+−
=
hcc
ge
hcc
geGs
ssc
w
scK
αα
αα
αα
αα
(6)
The material parameters k
cvg and k
svg and g1 can
be calibrated by fitting experimental data relevant to free (evaporable) water content in concrete at various ages (Di Luzio & Cusatis 2009b).
2.2 Temperature evolution
Note that, at early age, since the chemical reactions associated with cement hydration and SF reaction are exothermic, the temperature field is not uniform for non-adiabatic systems even if the environmental temperature is constant. Heat conduction can be described in concrete, at least for temperature not exceeding 100°C (Bažant & Kaplan 1996), by Fourier’s law, which reads
T∇−= λq (7)
where q is the heat flux, T is the absolute temperature, and λ is the heat conductivity; in this
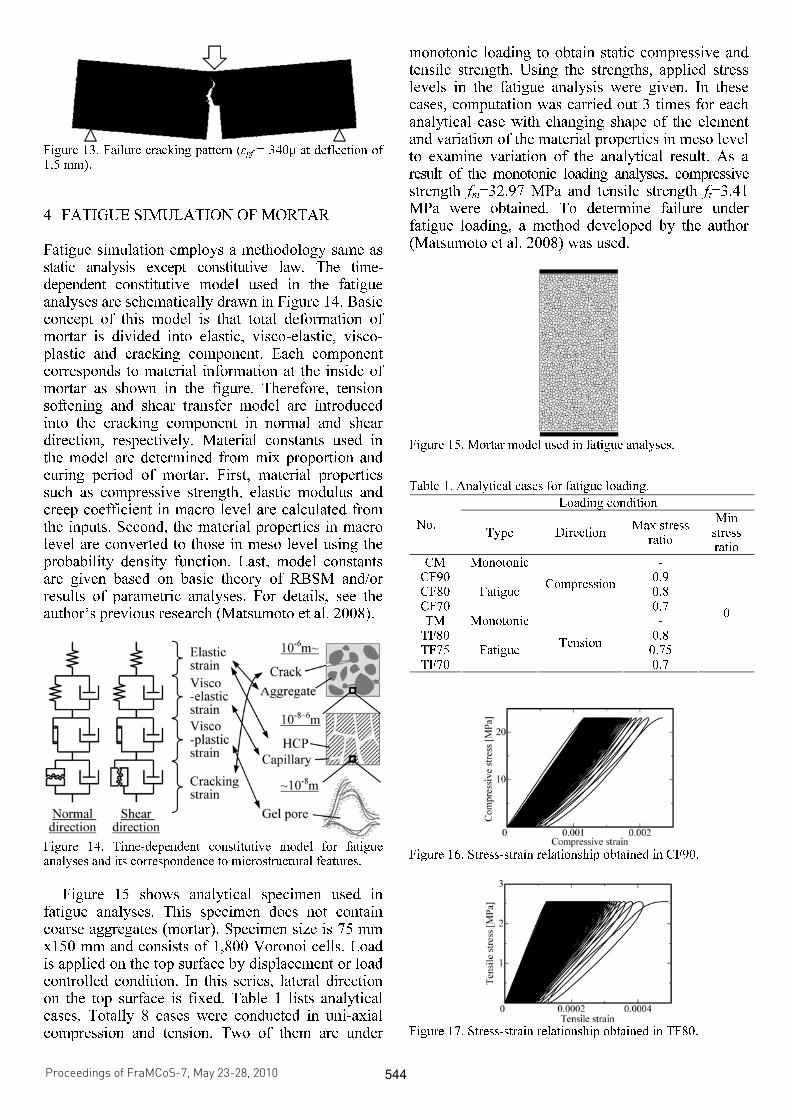
Figure 13. Failure cracking pattern (εpf = 340µ at deflection of 1.5 mm).
4 FATIGUE SIMULATION OF MORTAR
Fatigue simulation employs a methodology same as static analysis except constitutive law. The time- dependent constitutive model used in the fatigue analyses are schematically drawn in Figure 14. Basic concept of this model is that total deformation of mortar is divided into elastic, visco-elastic, visco- plastic and cracking component. Each component corresponds to material information at the inside of mortar as shown in the figure. Therefore, tension softening and shear transfer model are introduced into the cracking component in normal and shear direction, respectively. Material constants used in the model are determined from mix proportion and curing period of mortar. First, material properties such as compressive strength, elastic modulus and creep coefficient in macro level are calculated from the inputs. Second, the material properties in macro level are converted to those in meso level using the probability density function. Last, model constants are given based on basic theory of RBSM and/or results of parametric analyses. For details, see the author’s previous research (Matsumoto et al. 2008).
Figure 14. Time-dependent constitutive model for fatigue analyses and its correspondence to microstructural features.
Figure 15 shows analytical specimen used in
fatigue analyses. This specimen does not contain coarse aggregates (mortar). Specimen size is 75 mm x150 mm and consists of 1,800 Voronoi cells. Load is applied on the top surface by displacement or load controlled condition. In this series, lateral direction on the top surface is fixed. Table 1 lists analytical cases. Totally 8 cases were conducted in uni-axial compression and tension. Two of them are under
monotonic loading to obtain static compressive and tensile strength. Using the strengths, applied stress levels in the fatigue analysis were given. In these cases, computation was carried out 3 times for each analytical case with changing shape of the element and variation of the material properties in meso level to examine variation of the analytical result. As a result of the monotonic loading analyses, compressive strength fm=32.97 MPa and tensile strength ft=3.41 MPa were obtained. To determine failure under fatigue loading, a method developed by the author (Matsumoto et al. 2008) was used.
Figure 15. Mortar model used in fatigue analyses.
Table 1. Analytical cases for fatigue loading.
Loading condition
No. Type Direction
Max stress ratio
Min stress ratio
CM Monotonic - CF90 0.9 CF80 0.8 CF70
Fatigue Compression
0.7 TM Monotonic -
TF80 0.8 TF75 0.75 TF70
Fatigue Tension
0.7
0
Figure 16. Stress-strain relationship obtained in CF90.
Figure 17. Stress-strain relationship obtained in TF80.
Proceedings of FraMCoS-7, May 23-28, 2010
hThD ∇−= ),(J (1)
The proportionality coefficient D(h,T) is called moisture permeability and it is a nonlinear function of the relative humidity h and temperature T (Bažant & Najjar 1972). The moisture mass balance requires that the variation in time of the water mass per unit volume of concrete (water content w) be equal to the divergence of the moisture flux J
J•∇=∂
∂−
t
w (2)
The water content w can be expressed as the sum
of the evaporable water we (capillary water, water vapor, and adsorbed water) and the non-evaporable (chemically bound) water wn (Mills 1966, Pantazopoulo & Mills 1995). It is reasonable to assume that the evaporable water is a function of relative humidity, h, degree of hydration, αc, and degree of silica fume reaction, αs, i.e. we=we(h,αc,αs) = age-dependent sorption/desorption isotherm (Norling Mjonell 1997). Under this assumption and by substituting Equation 1 into Equation 2 one obtains
nscw
s
ew
c
ew
hh
Dt
h
h
ew
&&& ++∂
∂
∂
∂
=∇•∇+∂
∂
∂
∂
− αα
αα
)(
(3)
where ∂we/∂h is the slope of the sorption/desorption isotherm (also called moisture capacity). The governing equation (Equation 3) must be completed by appropriate boundary and initial conditions.
The relation between the amount of evaporable water and relative humidity is called ‘‘adsorption isotherm” if measured with increasing relativity humidity and ‘‘desorption isotherm” in the opposite case. Neglecting their difference (Xi et al. 1994), in the following, ‘‘sorption isotherm” will be used with reference to both sorption and desorption conditions. By the way, if the hysteresis of the moisture isotherm would be taken into account, two different relation, evaporable water vs relative humidity, must be used according to the sign of the variation of the relativity humidity. The shape of the sorption isotherm for HPC is influenced by many parameters, especially those that influence extent and rate of the chemical reactions and, in turn, determine pore structure and pore size distribution (water-to-cement ratio, cement chemical composition, SF content, curing time and method, temperature, mix additives, etc.). In the literature various formulations can be found to describe the sorption isotherm of normal concrete (Xi et al. 1994). However, in the present paper the semi-empirical expression proposed by Norling Mjornell (1997) is adopted because it
explicitly accounts for the evolution of hydration reaction and SF content. This sorption isotherm reads
( ) ( )( )
( ) ( )⎥⎥
⎦
⎤
⎢⎢
⎣
⎡
⎥⎥⎥
⎦
⎤
⎢⎢⎢
⎣
⎡
−
−∞
+
−∞
−=
1110
,1
110
11,
1,,
hcc
ge
scK
hcc
ge
scG
sch
ew
αα
αα
αα
αααα
(4)
where the first term (gel isotherm) represents the physically bound (adsorbed) water and the second term (capillary isotherm) represents the capillary water. This expression is valid only for low content of SF. The coefficient G1 represents the amount of water per unit volume held in the gel pores at 100% relative humidity, and it can be expressed (Norling Mjornell 1997) as
( ) ss
s
vgkc
c
c
vgk
scG αααα +=,1
(5)
where k
cvg and k
svg are material parameters. From the
maximum amount of water per unit volume that can fill all pores (both capillary pores and gel pores), one can calculate K1 as one obtains
( )1
110
110
11
22.0188.00
,1
−⎟⎠
⎞⎜⎝
⎛−∞
⎥⎥⎥
⎦
⎤
⎢⎢⎢
⎣
⎡⎟⎠
⎞⎜⎝
⎛−∞
−−+−
=
hcc
ge
hcc
geGs
ssc
w
scK
αα
αα
αα
αα
(6)
The material parameters k
cvg and k
svg and g1 can
be calibrated by fitting experimental data relevant to free (evaporable) water content in concrete at various ages (Di Luzio & Cusatis 2009b).
2.2 Temperature evolution
Note that, at early age, since the chemical reactions associated with cement hydration and SF reaction are exothermic, the temperature field is not uniform for non-adiabatic systems even if the environmental temperature is constant. Heat conduction can be described in concrete, at least for temperature not exceeding 100°C (Bažant & Kaplan 1996), by Fourier’s law, which reads
T∇−= λq (7)
where q is the heat flux, T is the absolute temperature, and λ is the heat conductivity; in this
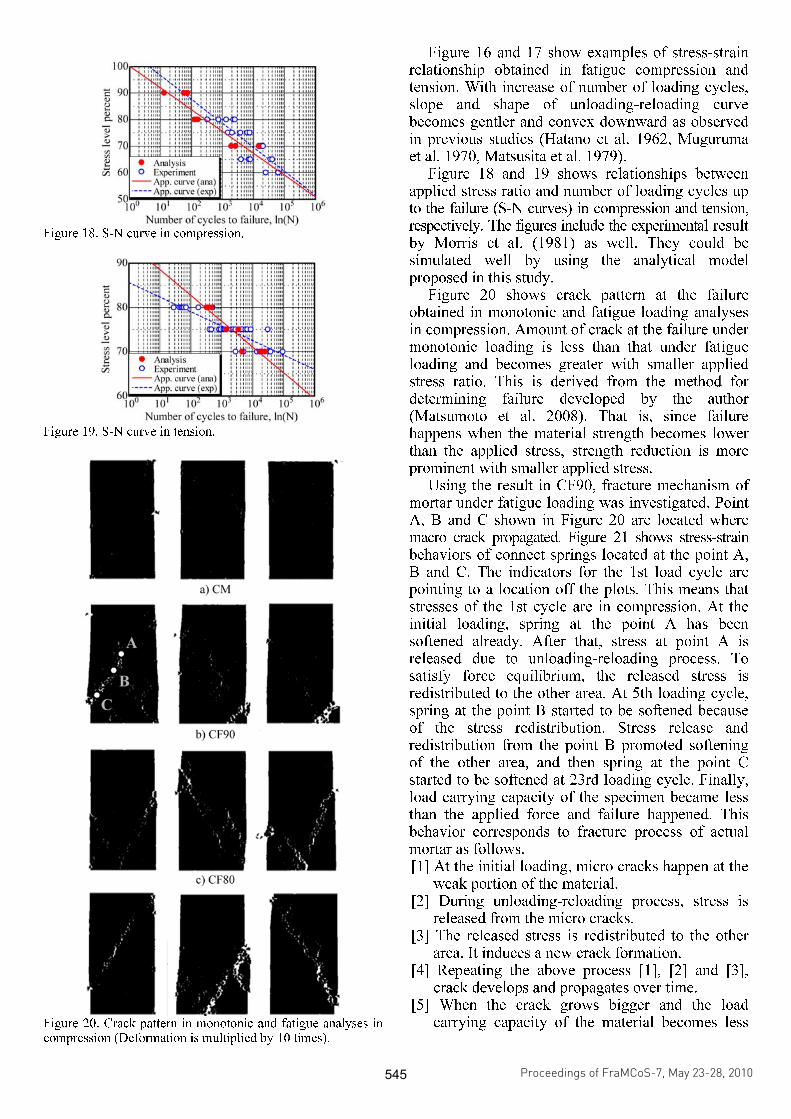
Figure 18. S-N curve in compression.
Figure 19. S-N curve in tension.
Figure 20. Crack pattern in monotonic and fatigue analyses in compression (Deformation is multiplied by 10 times).
Figure 16 and 17 show examples of stress-strain relationship obtained in fatigue compression and tension. With increase of number of loading cycles, slope and shape of unloading-reloading curve becomes gentler and convex downward as observed in previous studies (Hatano et al. 1962, Muguruma et al. 1970, Matsusita et al. 1979).
Figure 18 and 19 shows relationships between applied stress ratio and number of loading cycles up to the failure (S-N curves) in compression and tension, respectively. The figures include the experimental result by Morris et al. (1981) as well. They could be simulated well by using the analytical model proposed in this study.
Figure 20 shows crack pattern at the failure obtained in monotonic and fatigue loading analyses in compression. Amount of crack at the failure under monotonic loading is less than that under fatigue loading and becomes greater with smaller applied stress ratio. This is derived from the method for determining failure developed by the author (Matsumoto et al. 2008). That is, since failure happens when the material strength becomes lower than the applied stress, strength reduction is more prominent with smaller applied stress.
Using the result in CF90, fracture mechanism of mortar under fatigue loading was investigated. Point A, B and C shown in Figure 20 are located where macro crack propagated. Figure 21 shows stress-strain behaviors of connect springs located at the point A, B and C. The indicators for the 1st load cycle are pointing to a location off the plots. This means that stresses of the 1st cycle are in compression. At the initial loading, spring at the point A has been softened already. After that, stress at point A is released due to unloading-reloading process. To satisfy force equilibrium, the released stress is redistributed to the other area. At 5th loading cycle, spring at the point B started to be softened because of the stress redistribution. Stress release and redistribution from the point B promoted softening of the other area, and then spring at the point C started to be softened at 23rd loading cycle. Finally, load carrying capacity of the specimen became less than the applied force and failure happened. This behavior corresponds to fracture process of actual mortar as follows. [1] At the initial loading, micro cracks happen at the
weak portion of the material. [2] During unloading-reloading process, stress is
released from the micro cracks. [3] The released stress is redistributed to the other
area. It induces a new crack formation. [4] Repeating the above process [1], [2] and [3],
crack develops and propagates over time. [5] When the crack grows bigger and the load
carrying capacity of the material becomes less
Proceedings of FraMCoS-7, May 23-28, 2010
hThD ∇−= ),(J (1)
The proportionality coefficient D(h,T) is called moisture permeability and it is a nonlinear function of the relative humidity h and temperature T (Bažant & Najjar 1972). The moisture mass balance requires that the variation in time of the water mass per unit volume of concrete (water content w) be equal to the divergence of the moisture flux J
J•∇=∂
∂−
t
w (2)
The water content w can be expressed as the sum
of the evaporable water we (capillary water, water vapor, and adsorbed water) and the non-evaporable (chemically bound) water wn (Mills 1966, Pantazopoulo & Mills 1995). It is reasonable to assume that the evaporable water is a function of relative humidity, h, degree of hydration, αc, and degree of silica fume reaction, αs, i.e. we=we(h,αc,αs) = age-dependent sorption/desorption isotherm (Norling Mjonell 1997). Under this assumption and by substituting Equation 1 into Equation 2 one obtains
nscw
s
ew
c
ew
hh
Dt
h
h
ew
&&& ++∂
∂
∂
∂
=∇•∇+∂
∂
∂
∂
− αα
αα
)(
(3)
where ∂we/∂h is the slope of the sorption/desorption isotherm (also called moisture capacity). The governing equation (Equation 3) must be completed by appropriate boundary and initial conditions.
The relation between the amount of evaporable water and relative humidity is called ‘‘adsorption isotherm” if measured with increasing relativity humidity and ‘‘desorption isotherm” in the opposite case. Neglecting their difference (Xi et al. 1994), in the following, ‘‘sorption isotherm” will be used with reference to both sorption and desorption conditions. By the way, if the hysteresis of the moisture isotherm would be taken into account, two different relation, evaporable water vs relative humidity, must be used according to the sign of the variation of the relativity humidity. The shape of the sorption isotherm for HPC is influenced by many parameters, especially those that influence extent and rate of the chemical reactions and, in turn, determine pore structure and pore size distribution (water-to-cement ratio, cement chemical composition, SF content, curing time and method, temperature, mix additives, etc.). In the literature various formulations can be found to describe the sorption isotherm of normal concrete (Xi et al. 1994). However, in the present paper the semi-empirical expression proposed by Norling Mjornell (1997) is adopted because it
explicitly accounts for the evolution of hydration reaction and SF content. This sorption isotherm reads
( ) ( )( )
( ) ( )⎥⎥
⎦
⎤
⎢⎢
⎣
⎡
⎥⎥⎥
⎦
⎤
⎢⎢⎢
⎣
⎡
−
−∞
+
−∞
−=
1110
,1
110
11,
1,,
hcc
ge
scK
hcc
ge
scG
sch
ew
αα
αα
αα
αααα
(4)
where the first term (gel isotherm) represents the physically bound (adsorbed) water and the second term (capillary isotherm) represents the capillary water. This expression is valid only for low content of SF. The coefficient G1 represents the amount of water per unit volume held in the gel pores at 100% relative humidity, and it can be expressed (Norling Mjornell 1997) as
( ) ss
s
vgkc
c
c
vgk
scG αααα +=,1
(5)
where k
cvg and k
svg are material parameters. From the
maximum amount of water per unit volume that can fill all pores (both capillary pores and gel pores), one can calculate K1 as one obtains
( )1
110
110
11
22.0188.00
,1
−⎟⎠
⎞⎜⎝
⎛−∞
⎥⎥⎥
⎦
⎤
⎢⎢⎢
⎣
⎡⎟⎠
⎞⎜⎝
⎛−∞
−−+−
=
hcc
ge
hcc
geGs
ssc
w
scK
αα
αα
αα
αα
(6)
The material parameters k
cvg and k
svg and g1 can
be calibrated by fitting experimental data relevant to free (evaporable) water content in concrete at various ages (Di Luzio & Cusatis 2009b).
2.2 Temperature evolution
Note that, at early age, since the chemical reactions associated with cement hydration and SF reaction are exothermic, the temperature field is not uniform for non-adiabatic systems even if the environmental temperature is constant. Heat conduction can be described in concrete, at least for temperature not exceeding 100°C (Bažant & Kaplan 1996), by Fourier’s law, which reads
T∇−= λq (7)
where q is the heat flux, T is the absolute temperature, and λ is the heat conductivity; in this
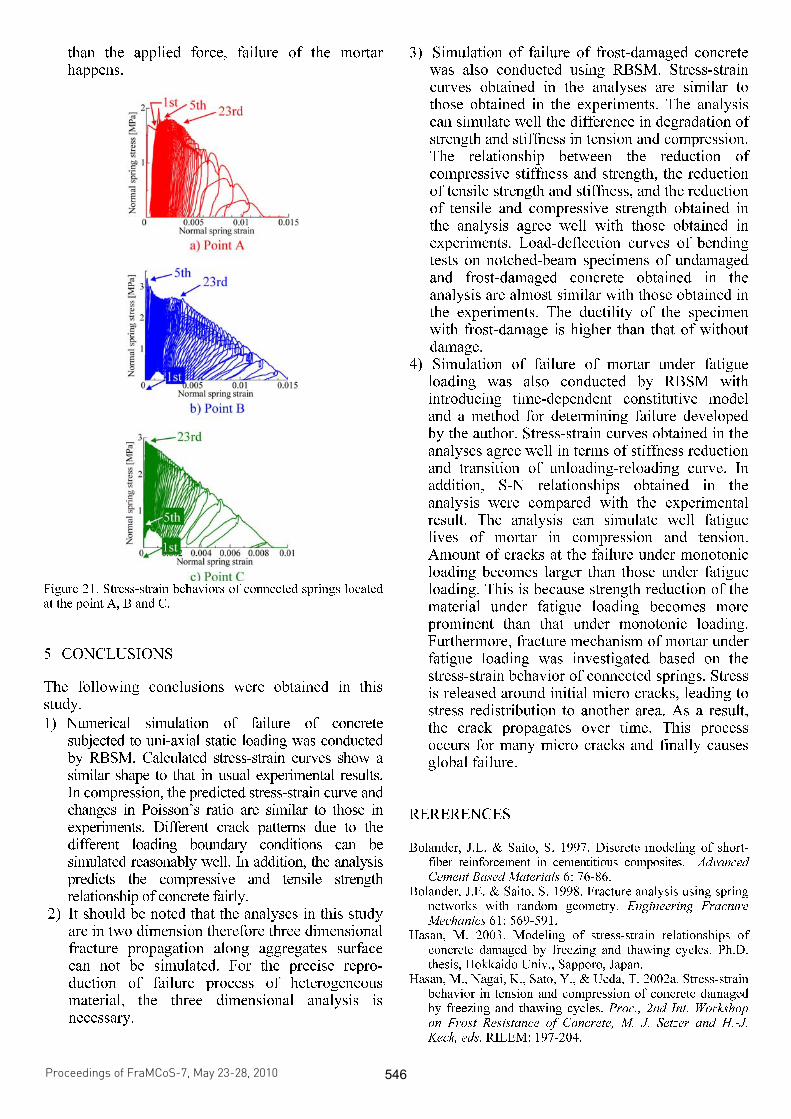
than the applied force, failure of the mortar happens.
Figure 21. Stress-strain behaviors of connected springs located at the point A, B and C.
5 CONCLUSIONS
The following conclusions were obtained in this study.
1) Numerical simulation of failure of concrete subjected to uni-axial static loading was conducted by RBSM. Calculated stress-strain curves show a similar shape to that in usual experimental results. In compression, the predicted stress-strain curve and changes in Poisson’s ratio are similar to those in experiments. Different crack patterns due to the different loading boundary conditions can be simulated reasonably well. In addition, the analysis predicts the compressive and tensile strength relationship of concrete fairly.
2) It should be noted that the analyses in this study are in two dimension therefore three dimensional fracture propagation along aggregates surface can not be simulated. For the precise repro-duction of failure process of heterogeneous material, the three dimensional analysis is necessary.
3) Simulation of failure of frost-damaged concrete was also conducted using RBSM. Stress-strain curves obtained in the analyses are similar to those obtained in the experiments. The analysis can simulate well the difference in degradation of strength and stiffness in tension and compression. The relationship between the reduction of compressive stiffness and strength, the reduction of tensile strength and stiffness, and the reduction of tensile and compressive strength obtained in the analysis agree well with those obtained in experiments. Load-deflection curves of bending tests on notched-beam specimens of undamaged and frost-damaged concrete obtained in the analysis are almost similar with those obtained in the experiments. The ductility of the specimen with frost-damage is higher than that of without damage.
4) Simulation of failure of mortar under fatigue loading was also conducted by RBSM with introducing time-dependent constitutive model and a method for determining failure developed by the author. Stress-strain curves obtained in the analyses agree well in terms of stiffness reduction and transition of unloading-reloading curve. In addition, S-N relationships obtained in the analysis were compared with the experimental result. The analysis can simulate well fatigue lives of mortar in compression and tension. Amount of cracks at the failure under monotonic loading becomes larger than those under fatigue loading. This is because strength reduction of the material under fatigue loading becomes more prominent than that under monotonic loading. Furthermore, fracture mechanism of mortar under fatigue loading was investigated based on the stress-strain behavior of connected springs. Stress is released around initial micro cracks, leading to stress redistribution to another area. As a result, the crack propagates over time. This process occurs for many micro cracks and finally causes global failure.
RERERENCES
Bolander, J.E. & Saito, S. 1997. Discrete modeling of short- fiber reinforcement in cementitious composites. Advanced Cement Based Materials 6: 76-86.
Bolander, J.E. & Saito, S. 1998. Fracture analysis using spring networks with random geometry. Engineering Fracture Mechanics 61: 569-591.
Hasan, M. 2003. Modeling of stress-strain relationships of concrete damaged by freezing and thawing cycles. Ph.D. thesis, Hokkaido Univ., Sapporo, Japan.
Hasan, M., Nagai, K., Sato, Y., & Ueda, T. 2002a. Stress-strain behavior in tension and compression of concrete damaged by freezing and thawing cycles. Proc., 2nd Int. Workshop on Frost Resistance of Concrete, M. J. Setzer and H.-J. Keck, eds. RILEM: 197-204.
Proceedings of FraMCoS-7, May 23-28, 2010
hThD ∇−= ),(J (1)
The proportionality coefficient D(h,T) is called moisture permeability and it is a nonlinear function of the relative humidity h and temperature T (Bažant & Najjar 1972). The moisture mass balance requires that the variation in time of the water mass per unit volume of concrete (water content w) be equal to the divergence of the moisture flux J
J•∇=∂
∂−
t
w (2)
The water content w can be expressed as the sum
of the evaporable water we (capillary water, water vapor, and adsorbed water) and the non-evaporable (chemically bound) water wn (Mills 1966, Pantazopoulo & Mills 1995). It is reasonable to assume that the evaporable water is a function of relative humidity, h, degree of hydration, αc, and degree of silica fume reaction, αs, i.e. we=we(h,αc,αs) = age-dependent sorption/desorption isotherm (Norling Mjonell 1997). Under this assumption and by substituting Equation 1 into Equation 2 one obtains
nscw
s
ew
c
ew
hh
Dt
h
h
ew
&&& ++∂
∂
∂
∂
=∇•∇+∂
∂
∂
∂
− αα
αα
)(
(3)
where ∂we/∂h is the slope of the sorption/desorption isotherm (also called moisture capacity). The governing equation (Equation 3) must be completed by appropriate boundary and initial conditions.
The relation between the amount of evaporable water and relative humidity is called ‘‘adsorption isotherm” if measured with increasing relativity humidity and ‘‘desorption isotherm” in the opposite case. Neglecting their difference (Xi et al. 1994), in the following, ‘‘sorption isotherm” will be used with reference to both sorption and desorption conditions. By the way, if the hysteresis of the moisture isotherm would be taken into account, two different relation, evaporable water vs relative humidity, must be used according to the sign of the variation of the relativity humidity. The shape of the sorption isotherm for HPC is influenced by many parameters, especially those that influence extent and rate of the chemical reactions and, in turn, determine pore structure and pore size distribution (water-to-cement ratio, cement chemical composition, SF content, curing time and method, temperature, mix additives, etc.). In the literature various formulations can be found to describe the sorption isotherm of normal concrete (Xi et al. 1994). However, in the present paper the semi-empirical expression proposed by Norling Mjornell (1997) is adopted because it
explicitly accounts for the evolution of hydration reaction and SF content. This sorption isotherm reads
( ) ( )( )
( ) ( )⎥⎥
⎦
⎤
⎢⎢
⎣
⎡
⎥⎥⎥
⎦
⎤
⎢⎢⎢
⎣
⎡
−
−∞
+
−∞
−=
1110
,1
110
11,
1,,
hcc
ge
scK
hcc
ge
scG
sch
ew
αα
αα
αα
αααα
(4)
where the first term (gel isotherm) represents the physically bound (adsorbed) water and the second term (capillary isotherm) represents the capillary water. This expression is valid only for low content of SF. The coefficient G1 represents the amount of water per unit volume held in the gel pores at 100% relative humidity, and it can be expressed (Norling Mjornell 1997) as
( ) ss
s
vgkc
c
c
vgk
scG αααα +=,1
(5)
where k
cvg and k
svg are material parameters. From the
maximum amount of water per unit volume that can fill all pores (both capillary pores and gel pores), one can calculate K1 as one obtains
( )1
110
110
11
22.0188.00
,1
−⎟⎠
⎞⎜⎝
⎛−∞
⎥⎥⎥
⎦
⎤
⎢⎢⎢
⎣
⎡⎟⎠
⎞⎜⎝
⎛−∞
−−+−
=
hcc
ge
hcc
geGs
ssc
w
scK
αα
αα
αα
αα
(6)
The material parameters k
cvg and k
svg and g1 can
be calibrated by fitting experimental data relevant to free (evaporable) water content in concrete at various ages (Di Luzio & Cusatis 2009b).
2.2 Temperature evolution
Note that, at early age, since the chemical reactions associated with cement hydration and SF reaction are exothermic, the temperature field is not uniform for non-adiabatic systems even if the environmental temperature is constant. Heat conduction can be described in concrete, at least for temperature not exceeding 100°C (Bažant & Kaplan 1996), by Fourier’s law, which reads
T∇−= λq (7)
where q is the heat flux, T is the absolute temperature, and λ is the heat conductivity; in this
Hasan, M., Nagai, K., Sato, Y., & Ueda, T. 2002b. Tensile stress crack width model for plain concrete damaged by freezing and thawing action. Proc. of Japan Concrete Institute 24(2):109-114.
Hasan, M., Okuyama, H., & Ueda, T. 2003. The damage mechanism and strain induced in frost cycles of concrete. Proc. of Japan Concrete Institute 25(1):401-406.
Hasan, M., Okuyama, H., Sato, Y., & Ueda, T. 2004. Stress-strain model of concrete damaged by freezing and thawing cycles. Journal of Advanced Concrete Technology 2(1): 89-99.
Hatano, T. 1962. Behavior of concrete by cyclic compression load. Proceedings of JSCE 84: 19-28. (in Japanese)
JSCE. 2002. Standard specification for concrete structures, Structural performance verification. Tokyo: JSCE.
Kawai, T. 1978. New discrete models and their application to seismic response analysis of structure. Nuclear Engineering and Design 48: 207-229.
Matsumoto, K., Sato, Y., Ueda, T. and Wang, L. 2008. Mesoscopic Analysis of Mortar under High-Stress Creep and Low-Cycle Fatigue Loading. Journal of Advanced Concrete Technology 6(2): 337-352.
Matsumura, T., Katsura, O. & Yoshino, T. 2003. Properties of frost damaged concrete and the estimation of the degree of frost damage. J. Struct. Constr. Eng. 563: 9-13. (in Japanese)
Matsushita, H. & Makizumi, T. 1979. Deformational characteristic of concrete under repeated compression stress. Proceedings of Japan Concrete Institute 1: 77-80. (in Japanese)
Morris, A. D. & Garrett, G. G. 1981. A comparative study of the static and fatigue behaviour of plain and steel fibre reinforced mortar in compression and direct tension, The International Journal of Cement Composite and Lightweight Concrete 3(2): 73-91.
Muguruma, H. & Tominaga, M. 1970. Stress-strain relations of concrete under repeated over-load. Journal of the Society of Materils Science, Japan 19(200): 1-10. (in Japanese)
Nagai, K., Sato, Y. & Ueda, T. 2004. Mesoscopic simulation of failure of mortar and concrete by 2D RBSM. Journal of Advanced Concrete Technology 2(3): 359-374.
Stock A.F., Hannant, D.J. & Williams, R.I.T. 1979. The effect of aggregate concentration upon the strength and modulus of elasticity of concrete. Magazine of Concrete Research 31(109): 225-234.
Ueda, T., Hasan, M., Nagai, K., Sato, Y. & Wang, L. 2009 Mesoscale simulation of influence of frost damage on mechanical properties of concrete. Journal of Materials in Civil Engineering 21(6): 244-252.
Proceedings of FraMCoS-7, May 23-28, 2010
hThD ∇−= ),(J (1)
The proportionality coefficient D(h,T) is called moisture permeability and it is a nonlinear function of the relative humidity h and temperature T (Bažant & Najjar 1972). The moisture mass balance requires that the variation in time of the water mass per unit volume of concrete (water content w) be equal to the divergence of the moisture flux J
J•∇=∂
∂−
t
w (2)
The water content w can be expressed as the sum
of the evaporable water we (capillary water, water vapor, and adsorbed water) and the non-evaporable (chemically bound) water wn (Mills 1966, Pantazopoulo & Mills 1995). It is reasonable to assume that the evaporable water is a function of relative humidity, h, degree of hydration, αc, and degree of silica fume reaction, αs, i.e. we=we(h,αc,αs) = age-dependent sorption/desorption isotherm (Norling Mjonell 1997). Under this assumption and by substituting Equation 1 into Equation 2 one obtains
nscw
s
ew
c
ew
hh
Dt
h
h
ew
&&& ++∂
∂
∂
∂
=∇•∇+∂
∂
∂
∂
− αα
αα
)(
(3)
where ∂we/∂h is the slope of the sorption/desorption isotherm (also called moisture capacity). The governing equation (Equation 3) must be completed by appropriate boundary and initial conditions.
The relation between the amount of evaporable water and relative humidity is called ‘‘adsorption isotherm” if measured with increasing relativity humidity and ‘‘desorption isotherm” in the opposite case. Neglecting their difference (Xi et al. 1994), in the following, ‘‘sorption isotherm” will be used with reference to both sorption and desorption conditions. By the way, if the hysteresis of the moisture isotherm would be taken into account, two different relation, evaporable water vs relative humidity, must be used according to the sign of the variation of the relativity humidity. The shape of the sorption isotherm for HPC is influenced by many parameters, especially those that influence extent and rate of the chemical reactions and, in turn, determine pore structure and pore size distribution (water-to-cement ratio, cement chemical composition, SF content, curing time and method, temperature, mix additives, etc.). In the literature various formulations can be found to describe the sorption isotherm of normal concrete (Xi et al. 1994). However, in the present paper the semi-empirical expression proposed by Norling Mjornell (1997) is adopted because it
explicitly accounts for the evolution of hydration reaction and SF content. This sorption isotherm reads
( ) ( )( )
( ) ( )⎥⎥
⎦
⎤
⎢⎢
⎣
⎡
⎥⎥⎥
⎦
⎤
⎢⎢⎢
⎣
⎡
−
−∞
+
−∞
−=
1110
,1
110
11,
1,,
hcc
ge
scK
hcc
ge
scG
sch
ew
αα
αα
αα
αααα
(4)
where the first term (gel isotherm) represents the physically bound (adsorbed) water and the second term (capillary isotherm) represents the capillary water. This expression is valid only for low content of SF. The coefficient G1 represents the amount of water per unit volume held in the gel pores at 100% relative humidity, and it can be expressed (Norling Mjornell 1997) as
( ) ss
s
vgkc
c
c
vgk
scG αααα +=,1
(5)
where k
cvg and k
svg are material parameters. From the
maximum amount of water per unit volume that can fill all pores (both capillary pores and gel pores), one can calculate K1 as one obtains
( )1
110
110
11
22.0188.00
,1
−⎟⎠
⎞⎜⎝
⎛−∞
⎥⎥⎥
⎦
⎤
⎢⎢⎢
⎣
⎡⎟⎠
⎞⎜⎝
⎛−∞
−−+−
=
hcc
ge
hcc
geGs
ssc
w
scK
αα
αα
αα
αα
(6)
The material parameters k
cvg and k
svg and g1 can
be calibrated by fitting experimental data relevant to free (evaporable) water content in concrete at various ages (Di Luzio & Cusatis 2009b).
2.2 Temperature evolution
Note that, at early age, since the chemical reactions associated with cement hydration and SF reaction are exothermic, the temperature field is not uniform for non-adiabatic systems even if the environmental temperature is constant. Heat conduction can be described in concrete, at least for temperature not exceeding 100°C (Bažant & Kaplan 1996), by Fourier’s law, which reads
T∇−= λq (7)
where q is the heat flux, T is the absolute temperature, and λ is the heat conductivity; in this