Embed Size (px)
Citation preview
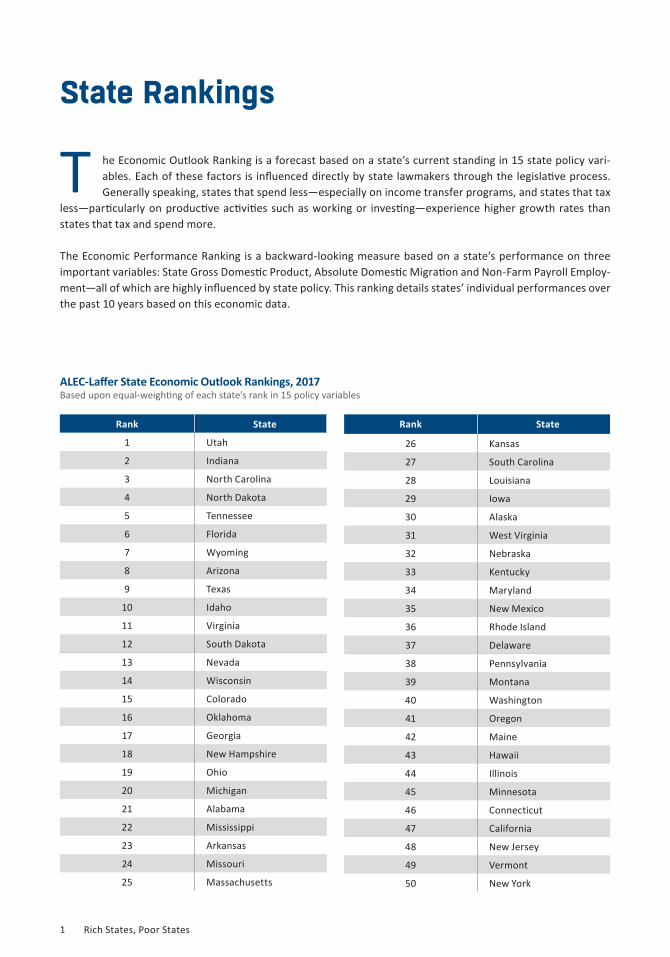
State Rankings
Rank State
1 Utah
2 Indiana
3 North Carolina
4 North Dakota
5 Tennessee
6 Florida
7 Wyoming
8 Arizona
9 Texas
10 Idaho
11 Virginia
12 South Dakota
13 Nevada
14 Wisconsin
15 Colorado
16 Oklahoma
17 Georgia
18 New Hampshire
19 Ohio
20 Michigan
21 Alabama
22 Mississippi
23 Arkansas
24 Missouri
25 Massachusetts
ALEC-Laffer State Economic Outlook Rankings, 2017 Based upon equal-weighting of each state’s rank in 15 policy variables
Rank State
26 Kansas
27 South Carolina
28 Louisiana
29 Iowa
30 Alaska
31 West Virginia
32 Nebraska
33 Kentucky
34 Maryland
35 New Mexico
36 Rhode Island
37 Delaware
38 Pennsylvania
39 Montana
40 Washington
41 Oregon
42 Maine
43 Hawaii
44 Illinois
45 Minnesota
46 Connecticut
47 California
48 New Jersey
49 Vermont
50 New York
he Economic Outlook Ranking is a forecast based on a state’s current standing in 15 state policy vari-ables. Each of these factors is influenced directly by state lawmakers through the legislative process. Generally speaking, states that spend less—especially on income transfer programs, and states that tax
less—particularly on productive activities such as working or investing—experience higher growth rates than states that tax and spend more.
The Economic Performance Ranking is a backward-looking measure based on a state’s performance on three important variables: State Gross Domestic Product, Absolute Domestic Migration and Non-Farm Payroll Employ-ment—all of which are highly influenced by state policy. This ranking details states’ individual performances over the past 10 years based on this economic data.
T
1 Rich States, Poor States
2016 ALEC-LAFFER STATE ECONOMIC COMPETITIVENESS INDEX
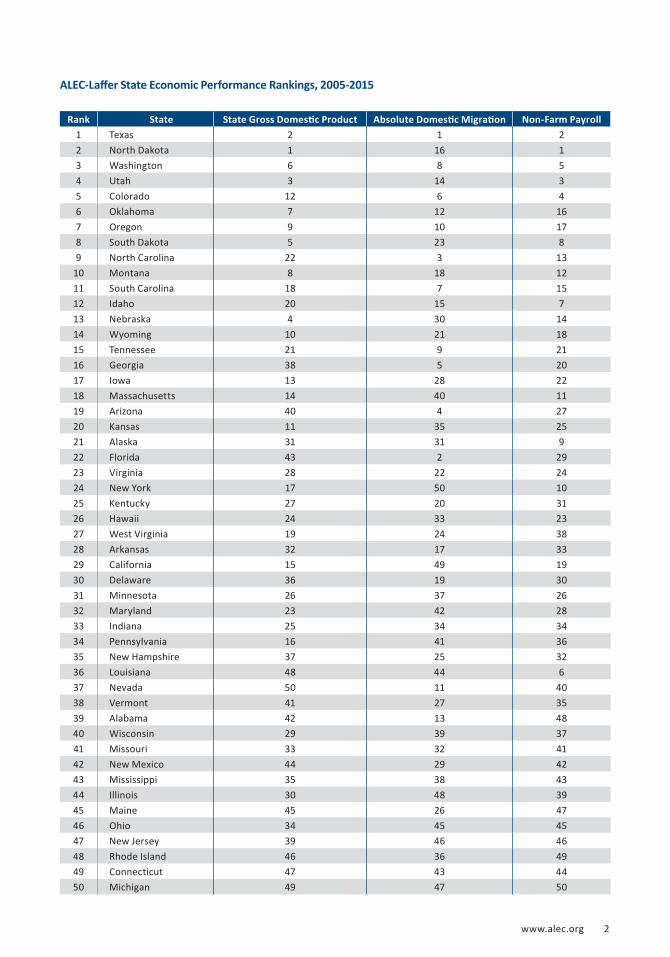
Rank State State Gross Domestic Product Absolute Domestic Migration Non-Farm Payroll
1 Texas 2 1 22 North Dakota 1 16 13 Washington 6 8 54 Utah 3 14 35 Colorado 12 6 46 Oklahoma 7 12 167 Oregon 9 10 178 South Dakota 5 23 89 North Carolina 22 3 13
10 Montana 8 18 1211 South Carolina 18 7 1512 Idaho 20 15 713 Nebraska 4 30 1414 Wyoming 10 21 1815 Tennessee 21 9 2116 Georgia 38 5 2017 Iowa 13 28 2218 Massachusetts 14 40 1119 Arizona 40 4 2720 Kansas 11 35 2521 Alaska 31 31 922 Florida 43 2 2923 Virginia 28 22 2424 New York 17 50 1025 Kentucky 27 20 3126 Hawaii 24 33 2327 West Virginia 19 24 3828 Arkansas 32 17 3329 California 15 49 1930 Delaware 36 19 3031 Minnesota 26 37 2632 Maryland 23 42 2833 Indiana 25 34 3434 Pennsylvania 16 41 3635 New Hampshire 37 25 3236 Louisiana 48 44 637 Nevada 50 11 4038 Vermont 41 27 3539 Alabama 42 13 4840 Wisconsin 29 39 3741 Missouri 33 32 4142 New Mexico 44 29 4243 Mississippi 35 38 4344 Illinois 30 48 3945 Maine 45 26 4746 Ohio 34 45 4547 New Jersey 39 46 4648 Rhode Island 46 36 4949 Connecticut 47 43 4450 Michigan 49 47 50
ALEC-Laffer State Economic Performance Rankings, 2005-2015
www.alec.org 2
’06 ’07 ’08 ’09 ’10 ’11 ’12 ’13 ’14 ’15
’06 ’07 ’08 ’09 ’10 ’11 ’12 ’13 ’14 ’15
’06 ’07 ’08 ’09 ’10 ’11 ’12 ’13 ’14 ’15 -5
0
5
10
15
20
25
30
35
40
-3%
-2%
-1%
0%
1%
2%
3%
4%
5%
6%
7%
Absolute Domestic MigrationCumulative 2006-2015
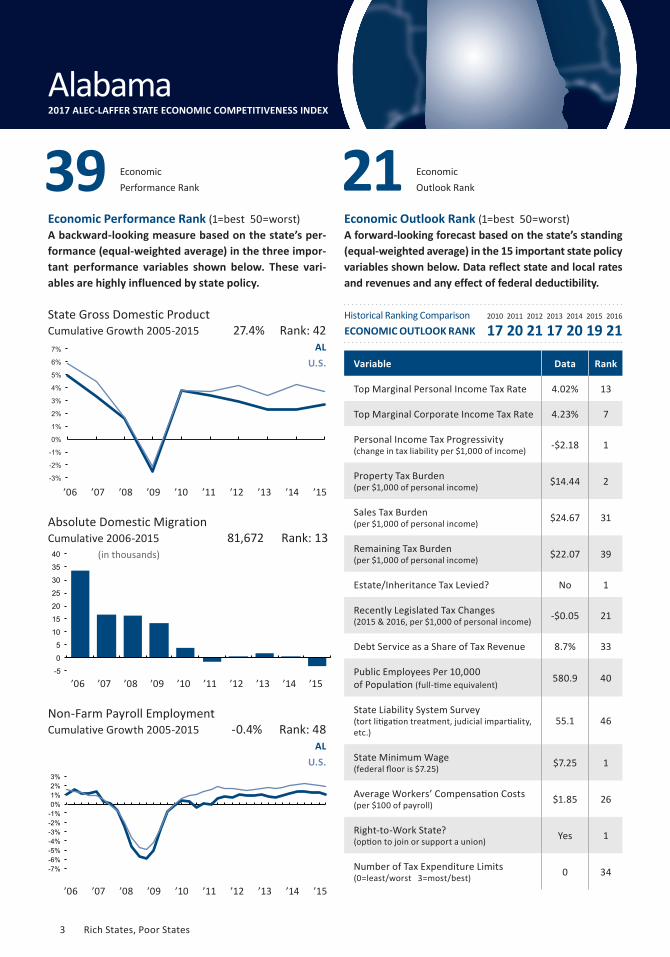
Economic Outlook Rank 2139 Economic
Performance Rank
Non-Farm Payroll EmploymentCumulative Growth 2005-2015
Variable Data Rank
Top Marginal Personal Income Tax Rate 4.02% 13
Top Marginal Corporate Income Tax Rate 4.23% 7
Personal Income Tax Progressivity (change in tax liability per $1,000 of income) -$2.18 1
Property Tax Burden(per $1,000 of personal income) $14.44 2
Sales Tax Burden(per $1,000 of personal income) $24.67 31
Remaining Tax Burden(per $1,000 of personal income) $22.07 39
Estate/Inheritance Tax Levied? No 1
Recently Legislated Tax Changes(2015 & 2016, per $1,000 of personal income) -$0.05 21
Debt Service as a Share of Tax Revenue 8.7% 33
Public Employees Per 10,000 of Population (full-time equivalent)
580.9 40
State Liability System Survey(tort litigation treatment, judicial impartiality, etc.)
55.1 46
State Minimum Wage(federal floor is $7.25) $7.25 1
Average Workers’ Compensation Costs(per $100 of payroll) $1.85 26
Right-to-Work State?(option to join or support a union) Yes 1
Number of Tax Expenditure Limits(0=least/worst 3=most/best) 0 34
State Gross Domestic ProductCumulative Growth 2005-2015 27.4% Rank: 42
Economic Performance Rank (1=best 50=worst)A backward-looking measure based on the state’s per-formance (equal-weighted average) in the three impor-tant performance variables shown below. These vari-ables are highly influenced by state policy.
Economic Outlook Rank (1=best 50=worst)A forward-looking forecast based on the state’s standing (equal-weighted average) in the 15 important state policy variables shown below. Data reflect state and local rates and revenues and any effect of federal deductibility.
81,672 Rank: 13
-0.4% Rank: 48 AL
U.S.
AL
U.S.
(in thousands)
Connecticut Alabama2017 ALEC-LAFFER STATE ECONOMIC COMPETITIVENESS INDEX
Historical Ranking ComparisonECONOMIC OUTLOOK RANK
2010 2011 2012 2013 2014 2015 2016
17 20 21 17 20 19 21
-7% -6% -5% -4% -3% -2% -1% 0% 1% 2% 3%
3 Rich States, Poor States
’06 ’07 ’08 ’09 ’10 ’11 ’12 ’13 ’14 ’15
’06 ’07 ’08 ’09 ’10 ’11 ’12 ’13 ’14 ’15
www.alec.org 59
’06 ’07 ’08 ’09 ’10 ’11 ’12 ’13 ’14 ’15
-12
-10
-8
-6
-4
-2
0
2
4
6
-10%
-5%
0%
5%
10%
15%
Non-Farm Payroll EmploymentCumulative Growth 2005-2015
Absolute Domestic MigrationCumulative 2006-2015
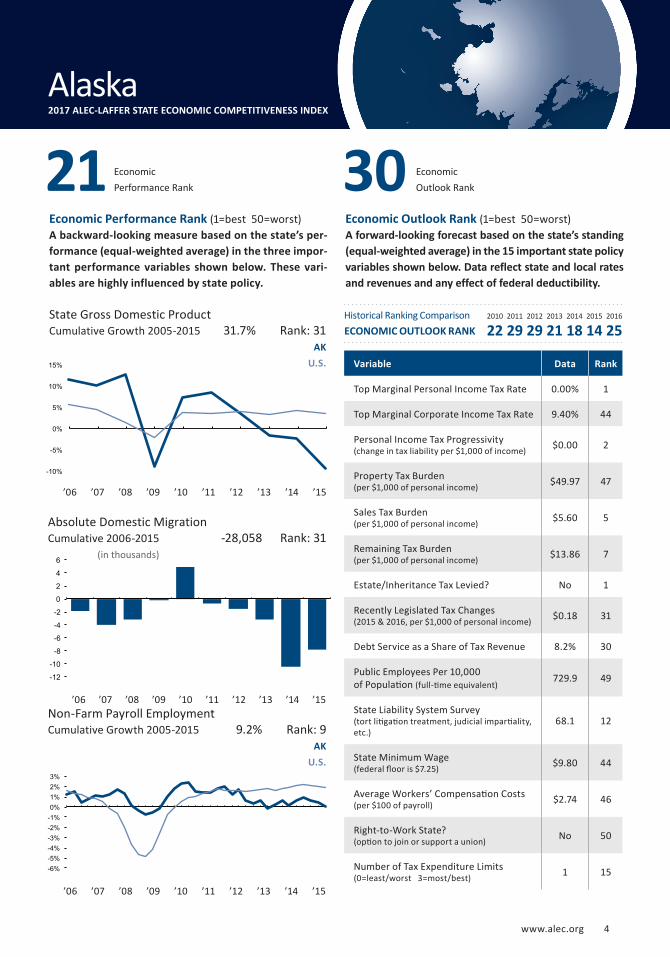
21 Economic Performance Rank
Variable Data Rank
Top Marginal Personal Income Tax Rate 0.00% 1
Top Marginal Corporate Income Tax Rate 9.40% 44
Personal Income Tax Progressivity (change in tax liability per $1,000 of income) $0.00 2
Property Tax Burden(per $1,000 of personal income) $49.97 47
Sales Tax Burden(per $1,000 of personal income) $5.60 5
Remaining Tax Burden(per $1,000 of personal income) $13.86 7
Estate/Inheritance Tax Levied? No 1
Recently Legislated Tax Changes(2015 & 2016, per $1,000 of personal income) $0.18 31
Debt Service as a Share of Tax Revenue 8.2% 30
Public Employees Per 10,000 of Population (full-time equivalent)
729.9 49
State Liability System Survey(tort litigation treatment, judicial impartiality, etc.)
68.1 12
State Minimum Wage(federal floor is $7.25) $9.80 44
Average Workers’ Compensation Costs(per $100 of payroll) $2.74 46
Right-to-Work State?(option to join or support a union) No 50
Number of Tax Expenditure Limits(0=least/worst 3=most/best) 1 15
State Gross Domestic ProductCumulative Growth 2005-2015
Economic Outlook Rank
Economic Performance Rank (1=best 50=worst)A backward-looking measure based on the state’s per-formance (equal-weighted average) in the three impor-tant performance variables shown below. These vari-ables are highly influenced by state policy.
Economic Outlook Rank (1=best 50=worst)A forward-looking forecast based on the state’s standing (equal-weighted average) in the 15 important state policy variables shown below. Data reflect state and local rates and revenues and any effect of federal deductibility.
30
AK
U.S.
AK
U.S.
(in thousands)
Delaware Alaska2017 ALEC-LAFFER STATE ECONOMIC COMPETITIVENESS INDEX
31.7% Rank: 31
-28,058 Rank: 31
9.2% Rank: 9
Historical Ranking ComparisonECONOMIC OUTLOOK RANK
2010 2011 2012 2013 2014 2015 2016
22 29 29 21 18 14 25
-6% -5% -4% -3% -2% -1% 0% 1% 2% 3%
www.alec.org 4
’06 ’07 ’08 ’09 ’10 ’11 ’12 ’13 ’14 ’15
’06 ’07 ’08 ’09 ’10 ’11 ’12 ’13 ’14 ’15
’06 ’07 ’08 ’09 ’10 ’11 ’12 ’13 ’14 ’15
-10%
-8%
-6%
-4%
-2%
0%
2%
4%
6%
-6%
-4%
-2%
0%
2%
4%
6%
8%
10%
12%
Non-Farm Payroll EmploymentCumulative Growth 2005-2015
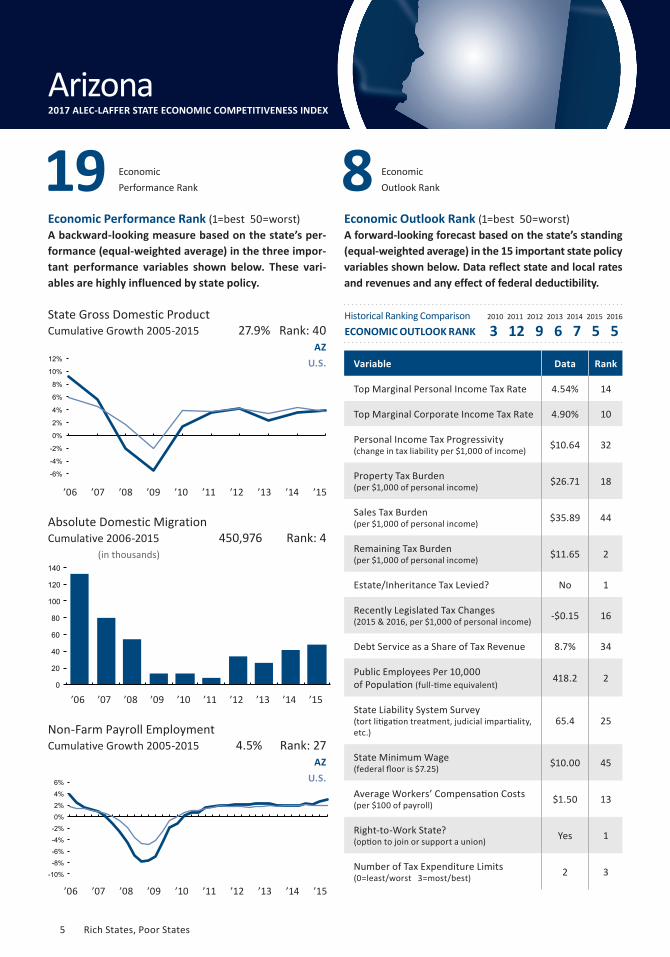
19 Economic Performance Rank
Variable Data Rank
Top Marginal Personal Income Tax Rate 4.54% 14
Top Marginal Corporate Income Tax Rate 4.90% 10
Personal Income Tax Progressivity (change in tax liability per $1,000 of income) $10.64 32
Property Tax Burden(per $1,000 of personal income) $26.71 18
Sales Tax Burden(per $1,000 of personal income) $35.89 44
Remaining Tax Burden(per $1,000 of personal income) $11.65 2
Estate/Inheritance Tax Levied? No 1
Recently Legislated Tax Changes(2015 & 2016, per $1,000 of personal income) -$0.15 16
Debt Service as a Share of Tax Revenue 8.7% 34
Public Employees Per 10,000 of Population (full-time equivalent)
418.2 2
State Liability System Survey(tort litigation treatment, judicial impartiality, etc.)
65.4 25
State Minimum Wage(federal floor is $7.25) $10.00 45
Average Workers’ Compensation Costs(per $100 of payroll) $1.50 13
Right-to-Work State?(option to join or support a union) Yes 1
Number of Tax Expenditure Limits(0=least/worst 3=most/best) 2 3
State Gross Domestic ProductCumulative Growth 2005-2015 27.9% Rank: 40
Absolute Domestic MigrationCumulative 2006-2015
Economic Outlook Rank
Economic Performance Rank (1=best 50=worst)A backward-looking measure based on the state’s per-formance (equal-weighted average) in the three impor-tant performance variables shown below. These vari-ables are highly influenced by state policy.
Economic Outlook Rank (1=best 50=worst)A forward-looking forecast based on the state’s standing (equal-weighted average) in the 15 important state policy variables shown below. Data reflect state and local rates and revenues and any effect of federal deductibility.
8
450,976 Rank: 4
4.5% Rank: 27 AZ
U.S.
AZ
U.S.
(in thousands)
Connecticut Arizona2017 ALEC-LAFFER STATE ECONOMIC COMPETITIVENESS INDEX
Historical Ranking ComparisonECONOMIC OUTLOOK RANK
2010 2011 2012 2013 2014 2015 2016
3 12 9 6 7 5 5
0
20
40
60
80
100
120
140
5 Rich States, Poor States
’06 ’07 ’08 ’09 ’10 ’11 ’12 ’13 ’14 ’15
www.alec.org 61
’06 ’07 ’08 ’09 ’10 ’11 ’12 ’13 ’14 ’15
’06 ’07 ’08 ’09 ’10 ’11 ’12 ’13 ’14 ’15 -5
0
5
10
15
20
25
- 3%
-2%
-1%
0%
1%
2%
3%
4%
5%
6%
Non-Farm Payroll EmploymentCumulative Growth 2005-2015
Absolute Domestic MigrationCumulative 2006-2015
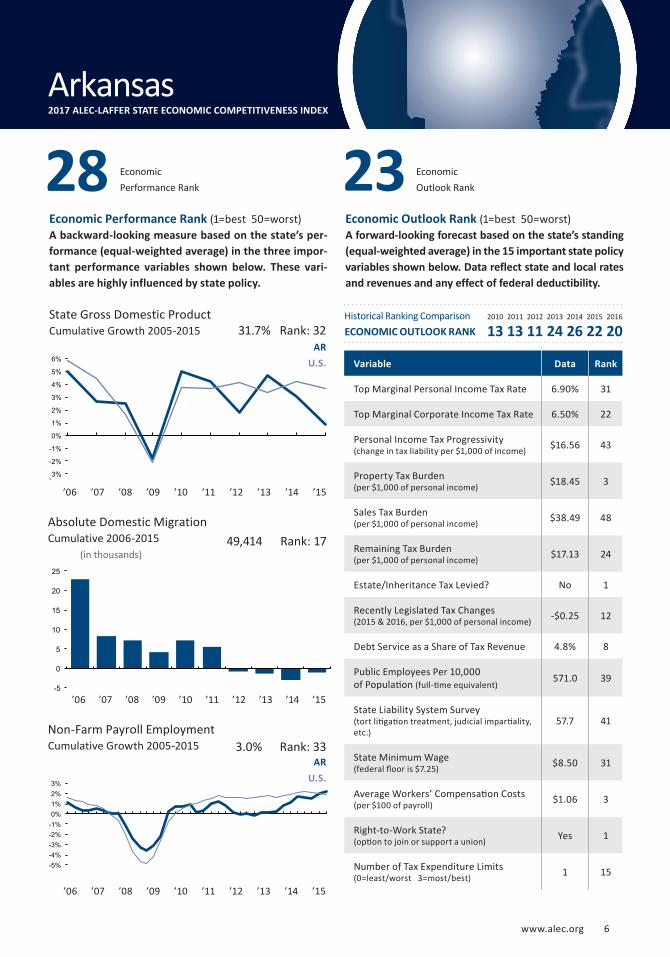
28 Economic Performance Rank
Variable Data Rank
Top Marginal Personal Income Tax Rate 6.90% 31
Top Marginal Corporate Income Tax Rate 6.50% 22
Personal Income Tax Progressivity (change in tax liability per $1,000 of income) $16.56 43
Property Tax Burden(per $1,000 of personal income) $18.45 3
Sales Tax Burden(per $1,000 of personal income) $38.49 48
Remaining Tax Burden(per $1,000 of personal income) $17.13 24
Estate/Inheritance Tax Levied? No 1
Recently Legislated Tax Changes(2015 & 2016, per $1,000 of personal income) -$0.25 12
Debt Service as a Share of Tax Revenue 4.8% 8
Public Employees Per 10,000 of Population (full-time equivalent)
571.0 39
State Liability System Survey(tort litigation treatment, judicial impartiality, etc.)
57.7 41
State Minimum Wage(federal floor is $7.25) $8.50 31
Average Workers’ Compensation Costs(per $100 of payroll) $1.06 3
Right-to-Work State?(option to join or support a union) Yes 1
Number of Tax Expenditure Limits(0=least/worst 3=most/best) 1 15
State Gross Domestic ProductCumulative Growth 2005-2015
Economic Outlook Rank
Economic Performance Rank (1=best 50=worst)A backward-looking measure based on the state’s per-formance (equal-weighted average) in the three impor-tant performance variables shown below. These vari-ables are highly influenced by state policy.
Economic Outlook Rank (1=best 50=worst)A forward-looking forecast based on the state’s standing (equal-weighted average) in the 15 important state policy variables shown below. Data reflect state and local rates and revenues and any effect of federal deductibility.
23
AR
U.S.
AR
U.S.
(in thousands)
Delaware Arkansas2017 ALEC-LAFFER STATE ECONOMIC COMPETITIVENESS INDEX
31.7% Rank: 32
49,414 Rank: 17
3.0% Rank: 33
Historical Ranking ComparisonECONOMIC OUTLOOK RANK
2010 2011 2012 2013 2014 2015 2016
13 13 11 24 26 22 20
-5% -4% -3% -2% -1% 0% 1% 2% 3%
www.alec.org 6
’06 ’07 ’08 ’09 ’10 ’11 ’12 ’13 ’14 ’15
(in thousands)
’06 ’07 ’08 ’09 ’10 ’11 ’12 ’13 ’14 ’15 -8%
-6%
-4%
-2%
0%
2%
4%
’06 ’07 ’08 ’09 ’10 ’11 ’12 ’13 ’14 ’15 -350
-300
-250
-200
-150
-100
-50
0
-4%
-2%
0%
2%
4%
6%
8%
Absolute Domestic MigrationCumulative 2006-2015
State Gross Domestic ProductCumulative Growth 2005-2015
CA
U.S. Variable Data Rank
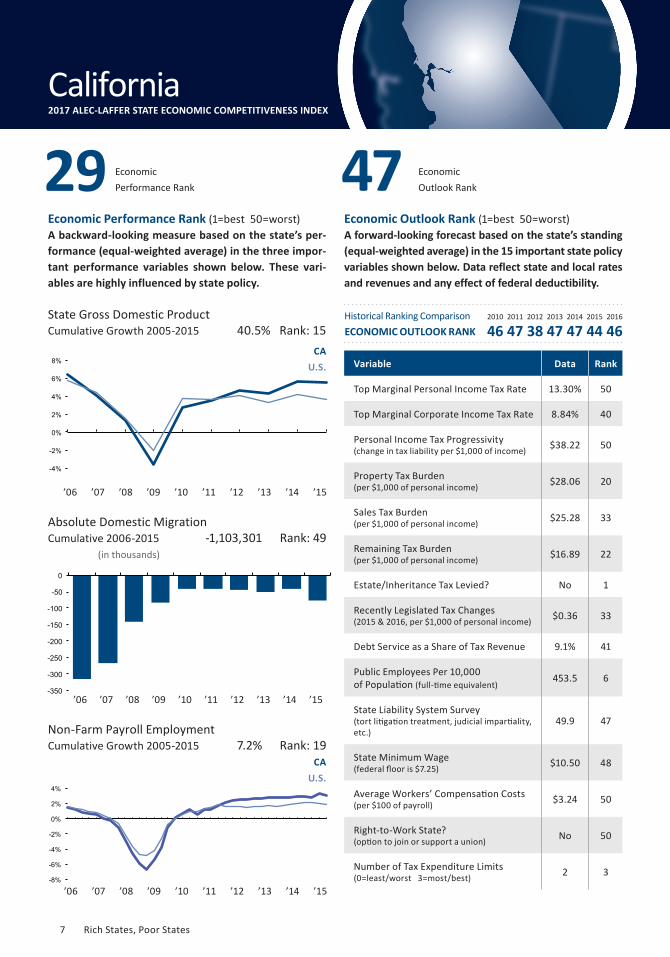
Top Marginal Personal Income Tax Rate 13.30% 50
Top Marginal Corporate Income Tax Rate 8.84% 40
Personal Income Tax Progressivity (change in tax liability per $1,000 of income) $38.22 50
Property Tax Burden(per $1,000 of personal income) $28.06 20
Sales Tax Burden(per $1,000 of personal income) $25.28 33
Remaining Tax Burden(per $1,000 of personal income) $16.89 22
Estate/Inheritance Tax Levied? No 1
Recently Legislated Tax Changes(2015 & 2016, per $1,000 of personal income) $0.36 33
Debt Service as a Share of Tax Revenue 9.1% 41
Public Employees Per 10,000 of Population (full-time equivalent)
453.5 6
State Liability System Survey(tort litigation treatment, judicial impartiality, etc.)
49.9 47
State Minimum Wage(federal floor is $7.25) $10.50 48
Average Workers’ Compensation Costs(per $100 of payroll) $3.24 50
Right-to-Work State?(option to join or support a union) No 50
Number of Tax Expenditure Limits(0=least/worst 3=most/best) 2 3
CA
U.S.
7.2% Rank: 19
-1,103,301 Rank: 49
40.5% Rank: 15
Non-Farm Payroll EmploymentCumulative Growth 2005-2015
Economic Outlook Rank
Economic Performance Rank (1=best 50=worst)A backward-looking measure based on the state’s per-formance (equal-weighted average) in the three impor-tant performance variables shown below. These vari-ables are highly influenced by state policy.
Economic Outlook Rank (1=best 50=worst)A forward-looking forecast based on the state’s standing (equal-weighted average) in the 15 important state policy variables shown below. Data reflect state and local rates and revenues and any effect of federal deductibility.
4729 Economic Performance Rank
Connecticut California2017 ALEC-LAFFER STATE ECONOMIC COMPETITIVENESS INDEX
Historical Ranking ComparisonECONOMIC OUTLOOK RANK
2010 2011 2012 2013 2014 2015 2016
46 47 38 47 47 44 46
7 Rich States, Poor States
www.alec.org 63
Economic Performance Rank (1=best 50=worst)A backward-looking measure based on the state’s per-formance (equal-weighted average) in the three impor-tant performance variables shown below. These vari-ables are highly influenced by state policy.
Economic Outlook Rank (1=best 50=worst)A forward-looking forecast based on the state’s standing (equal-weighted average) in the 15 important state policy variables shown below. Data reflect state and local rates and revenues and any effect of federal deductibility.
(in thousands)
’06 ’07 ’08 ’09 ’10 ’11 ’12 ’13 ’14 ’15
’06 ’07 ’08 ’09 ’10 ’11 ’12 ’13 ’14 ’15
-6%
-4%
-2%
0%
2%
4%
6%
0
10
20
30
40
50
60
-4%
-2%
0%
2%
4%
6%
8%
’06 ’07 ’08 ’09 ’10 ’11 ’12 ’13 ’14 ’15
Absolute Domestic MigrationCumulative 2006-2015
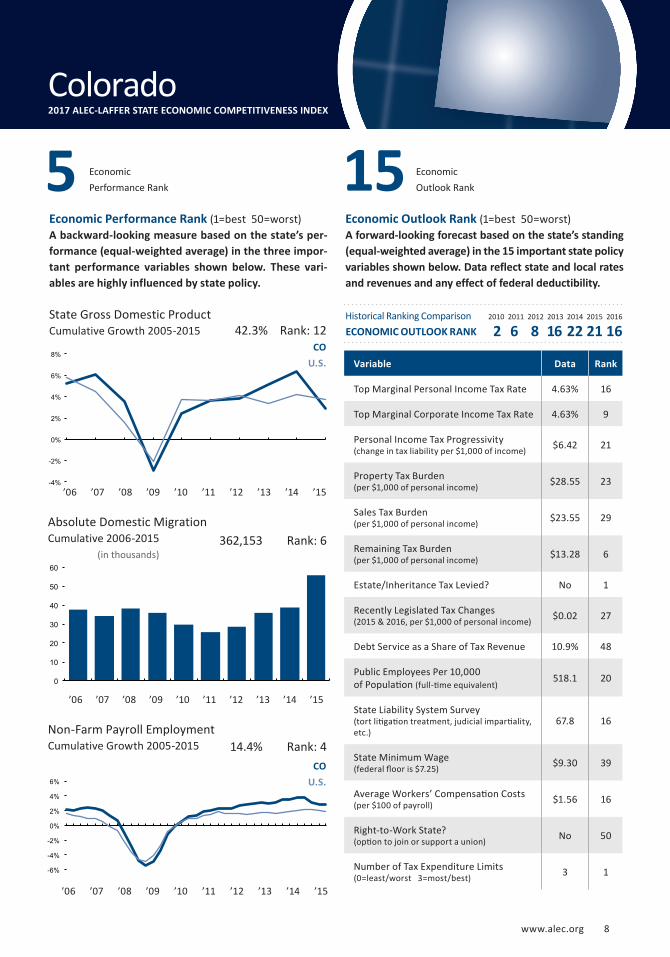
State Gross Domestic ProductCumulative Growth 2005-2015
CO
U.S. Variable Data Rank
Top Marginal Personal Income Tax Rate 4.63% 16
Top Marginal Corporate Income Tax Rate 4.63% 9
Personal Income Tax Progressivity (change in tax liability per $1,000 of income) $6.42 21
Property Tax Burden(per $1,000 of personal income) $28.55 23
Sales Tax Burden(per $1,000 of personal income) $23.55 29
Remaining Tax Burden(per $1,000 of personal income) $13.28 6
Estate/Inheritance Tax Levied? No 1
Recently Legislated Tax Changes(2015 & 2016, per $1,000 of personal income) $0.02 27
Debt Service as a Share of Tax Revenue 10.9% 48
Public Employees Per 10,000 of Population (full-time equivalent)
518.1 20
State Liability System Survey(tort litigation treatment, judicial impartiality, etc.)
67.8 16
State Minimum Wage(federal floor is $7.25) $9.30 39
Average Workers’ Compensation Costs(per $100 of payroll) $1.56 16
Right-to-Work State?(option to join or support a union) No 50
Number of Tax Expenditure Limits(0=least/worst 3=most/best) 3 1
Economic Outlook Rank 155 Economic
Performance Rank
CO
U.S.
Non-Farm Payroll EmploymentCumulative Growth 2005-2015
Delaware Colorado2017 ALEC-LAFFER STATE ECONOMIC COMPETITIVENESS INDEX
14.4% Rank: 4
362,153 Rank: 6
42.3% Rank: 12Historical Ranking ComparisonECONOMIC OUTLOOK RANK
2010 2011 2012 2013 2014 2015 2016
2 6 8 16 22 21 16
www.alec.org 8
’06 ’07 ’08 ’09 ’10 ’11 ’12 ’13 ’14 ’15
Economic Performance Rank (1=best 50=worst)A backward-looking measure based on the state’s per-formance (equal-weighted average) in the three impor-tant performance variables shown below. These vari-ables are highly influenced by state policy.
Economic Outlook Rank (1=best 50=worst)A forward-looking forecast based on the state’s standing (equal-weighted average) in the 15 important state policy variables shown below. Data reflect state and local rates and revenues and any effect of federal deductibility.
(in thousands)
’06 ’07 ’08 ’09 ’10 ’11 ’12 ’13 ’14 ’15
’06 ’07 ’08 ’09 ’10 ’11 ’12 ’13 ’14 ’15
-6% -5% -4% -3% -2% -1% 0% 1% 2% 3%
-30
-25
-20
-15
-10
-5
0
-3%
-2%
-1%
0%
1%
2%
3%
4%
5%
6%
7%
8%
Absolute Domestic MigrationCumulative 2006-2015
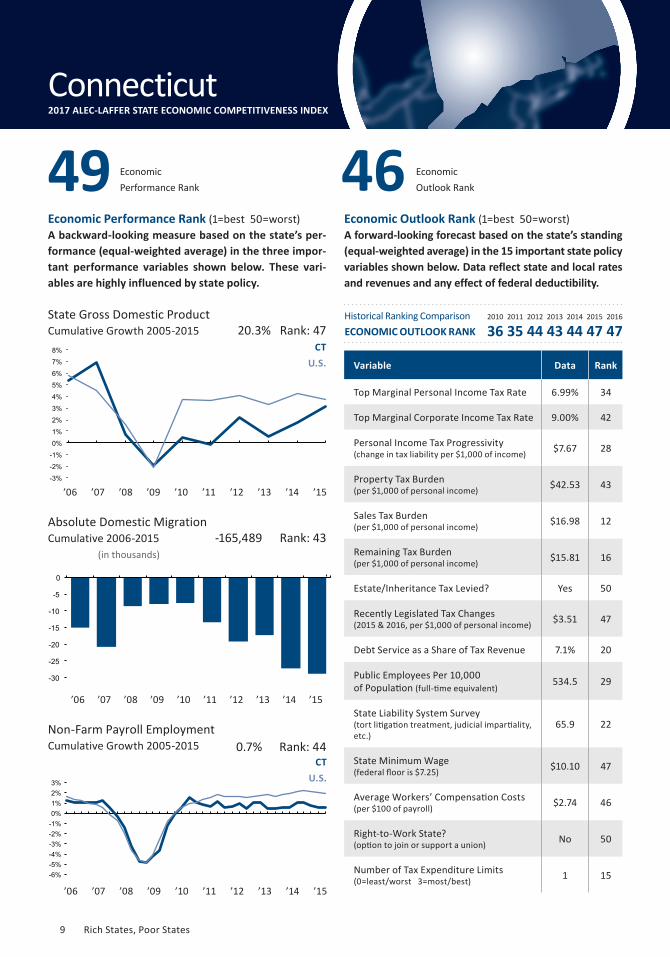
State Gross Domestic ProductCumulative Growth 2005-2015
Non-Farm Payroll EmploymentCumulative Growth 2005-2015
CT
U.S.
CT
U.S.
0.7% Rank: 44
-165,489 Rank: 43
20.3% Rank: 47
Variable Data Rank
Top Marginal Personal Income Tax Rate 6.99% 34
Top Marginal Corporate Income Tax Rate 9.00% 42
Personal Income Tax Progressivity (change in tax liability per $1,000 of income) $7.67 28
Property Tax Burden(per $1,000 of personal income) $42.53 43
Sales Tax Burden(per $1,000 of personal income) $16.98 12
Remaining Tax Burden(per $1,000 of personal income) $15.81 16
Estate/Inheritance Tax Levied? Yes 50
Recently Legislated Tax Changes(2015 & 2016, per $1,000 of personal income) $3.51 47
Debt Service as a Share of Tax Revenue 7.1% 20
Public Employees Per 10,000 of Population (full-time equivalent)
534.5 29
State Liability System Survey(tort litigation treatment, judicial impartiality, etc.)
65.9 22
State Minimum Wage(federal floor is $7.25) $10.10 47
Average Workers’ Compensation Costs(per $100 of payroll) $2.74 46
Right-to-Work State?(option to join or support a union) No 50
Number of Tax Expenditure Limits(0=least/worst 3=most/best) 1 15
Economic Performance Rank 49 Economic
Outlook Rank 46
Connecticut2017 ALEC-LAFFER STATE ECONOMIC COMPETITIVENESS INDEX
Historical Ranking ComparisonECONOMIC OUTLOOK RANK
2010 2011 2012 2013 2014 2015 2016
36 35 44 43 44 47 47
9 Rich States, Poor States
’06 ’07 ’08 ’09 ’10 ’11 ’12 ’13 ’14 ’15
www.alec.org 65
Economic Performance Rank (1=best 50=worst)A backward-looking measure based on the state’s per-formance (equal-weighted average) in the three impor-tant performance variables shown below. These vari-ables are highly influenced by state policy.
Economic Outlook Rank (1=best 50=worst)A forward-looking forecast based on the state’s standing (equal-weighted average) in the 15 important state policy variables shown below. Data reflect state and local rates and revenues and any effect of federal deductibility.
(in thousands)
’06 ’07 ’08 ’09 ’10 ’11 ’12 ’13 ’14 ’15
-6% -5% -4% -3% -2% -1% 0% 1% 2% 3%
0
1
2
3
4
5
6
7
8
-4%
-2%
0%
2%
4%
6%
8%
’06 ’07 ’08 ’09 ’10 ’11 ’12 ’13 ’14 ’15
Absolute Domestic MigrationCumulative 2006-2015
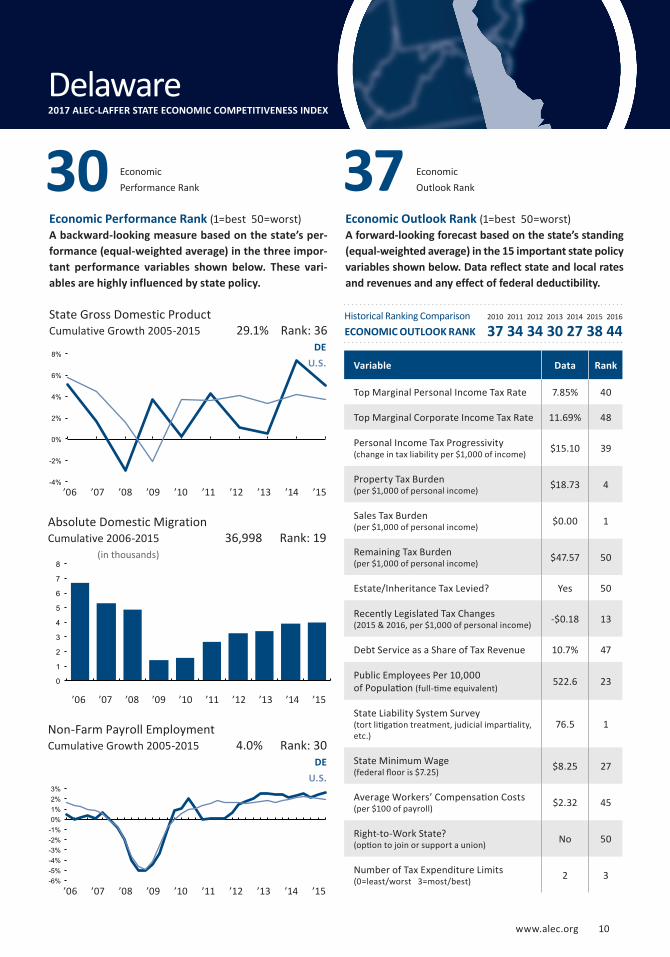
State Gross Domestic ProductCumulative Growth 2005-2015
Non-Farm Payroll EmploymentCumulative Growth 2005-2015
DE
U.S.
DE
U.S.
4.0% Rank: 30
36,998 Rank: 19
29.1% Rank: 36
Variable Data Rank
Top Marginal Personal Income Tax Rate 7.85% 40
Top Marginal Corporate Income Tax Rate 11.69% 48
Personal Income Tax Progressivity (change in tax liability per $1,000 of income) $15.10 39
Property Tax Burden(per $1,000 of personal income) $18.73 4
Sales Tax Burden(per $1,000 of personal income) $0.00 1
Remaining Tax Burden(per $1,000 of personal income) $47.57 50
Estate/Inheritance Tax Levied? Yes 50
Recently Legislated Tax Changes(2015 & 2016, per $1,000 of personal income) -$0.18 13
Debt Service as a Share of Tax Revenue 10.7% 47
Public Employees Per 10,000 of Population (full-time equivalent)
522.6 23
State Liability System Survey(tort litigation treatment, judicial impartiality, etc.)
76.5 1
State Minimum Wage(federal floor is $7.25) $8.25 27
Average Workers’ Compensation Costs(per $100 of payroll) $2.32 45
Right-to-Work State?(option to join or support a union) No 50
Number of Tax Expenditure Limits(0=least/worst 3=most/best) 2 3
Economic Performance Rank 30 Economic
Outlook Rank 37
Delaware2017 ALEC-LAFFER STATE ECONOMIC COMPETITIVENESS INDEX
Historical Ranking ComparisonECONOMIC OUTLOOK RANK
2010 2011 2012 2013 2014 2015 2016
37 34 34 30 27 38 44
www.alec.org 10

’06 ’07 ’08 ’09 ’10 ’11 ’12 ’13 ’14 ’15
Absolute Domestic MigrationCumulative 2006-2015
Economic Performance Rank (1=best 50=worst)A backward-looking measure based on the state’s per-formance (equal-weighted average) in the three impor-tant performance variables shown below. These vari-ables are highly influenced by state policy.
Economic Outlook Rank (1=best 50=worst)A forward-looking forecast based on the state’s standing (equal-weighted average) in the 15 important state policy variables shown below. Data reflect state and local rates and revenues and any effect of federal deductibility.
(in thousands)
’06 ’07 ’08 ’09 ’10 ’11 ’12 ’13 ’14 ’15
’06 ’07 ’08 ’09 ’10 ’11 ’12 ’13 ’14 ’15
-8%
-6%
-4%
-2%
0%
2%
4%
6%
-50
0
50
100
150
200
250
-4%
-2%
0%
2%
4%
6%
8%
State Gross Domestic ProductCumulative Growth 2005-2015
Non-Farm Payroll EmploymentCumulative Growth 2005-2015
Economic Performance Rank
FL
U.S.
FL
U.S.
4.0% Rank: 29
779,441 Rank: 2
26.8% Rank: 43
Variable Data Rank
Top Marginal Personal Income Tax Rate 0.00% 1
Top Marginal Corporate Income Tax Rate 5.50% 15
Personal Income Tax Progressivity (change in tax liability per $1,000 of income) $0.00 2
Property Tax Burden(per $1,000 of personal income) $28.63 24
Sales Tax Burden(per $1,000 of personal income) $28.33 36
Remaining Tax Burden(per $1,000 of personal income) $20.80 34
Estate/Inheritance Tax Levied? No 1
Recently Legislated Tax Changes(2015 & 2016, per $1,000 of personal income) -$0.47 10
Debt Service as a Share of Tax Revenue 9.0% 39
Public Employees Per 10,000 of Population (full-time equivalent)
432.3 3
State Liability System Survey(tort litigation treatment, judicial impartiality, etc.)
56.0 44
State Minimum Wage(federal floor is $7.25) $8.10 24
Average Workers’ Compensation Costs(per $100 of payroll) $1.66 18
Right-to-Work State?(option to join or support a union) Yes 1
Number of Tax Expenditure Limits(0=least/worst 3=most/best) 2 3
22 Economic Outlook Rank 6
Florida2017 ALEC-LAFFER STATE ECONOMIC COMPETITIVENESS INDEX
Historical Ranking ComparisonECONOMIC OUTLOOK RANK
2010 2011 2012 2013 2014 2015 2016
5 10 13 9 16 15 8
11 Rich States, Poor States
’06 ’07 ’08 ’09 ’10 ’11 ’12 ’13 ’14 ’15
Absolute Domestic MigrationCumulative 2006-2015
www.alec.org 67
Economic Performance Rank (1=best 50=worst)A backward-looking measure based on the state’s per-formance (equal-weighted average) in the three impor-tant performance variables shown below. These vari-ables are highly influenced by state policy.
Economic Outlook Rank (1=best 50=worst)A forward-looking forecast based on the state’s standing (equal-weighted average) in the 15 important state policy variables shown below. Data reflect state and local rates and revenues and any effect of federal deductibility.
’06 ’07 ’08 ’09 ’10 ’11 ’12 ’13 ’14 ’15
-8%
-6%
-4%
-2%
0%
2%
4%
-20
0
20
40
60
80
100
120
140
’06 ’07 ’08 ’09 ’10 ’11 ’12 ’13 ’14 ’15
(in thousands)
State Gross Domestic ProductCumulative Growth 2005-2015
Non-Farm Payroll EmploymentCumulative Growth 2005-2015
GA
U.S.
GA
U.S.
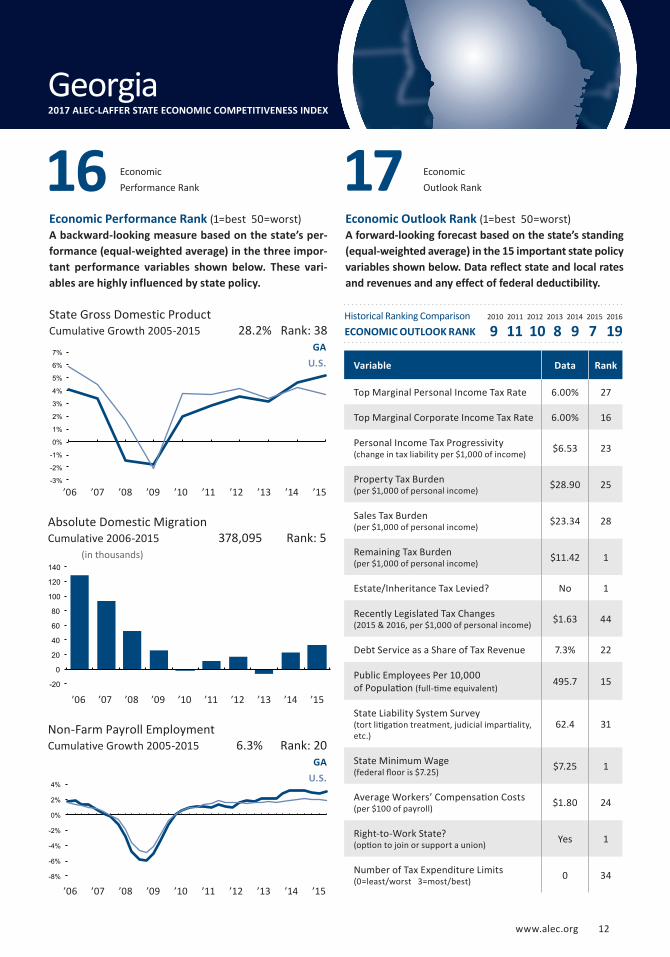
6.3% Rank: 20
378,095 Rank: 5
28.2% Rank: 38
Variable Data Rank
Top Marginal Personal Income Tax Rate 6.00% 27
Top Marginal Corporate Income Tax Rate 6.00% 16
Personal Income Tax Progressivity (change in tax liability per $1,000 of income) $6.53 23
Property Tax Burden(per $1,000 of personal income) $28.90 25
Sales Tax Burden(per $1,000 of personal income) $23.34 28
Remaining Tax Burden(per $1,000 of personal income) $11.42 1
Estate/Inheritance Tax Levied? No 1
Recently Legislated Tax Changes(2015 & 2016, per $1,000 of personal income) $1.63 44
Debt Service as a Share of Tax Revenue 7.3% 22
Public Employees Per 10,000 of Population (full-time equivalent)
495.7 15
State Liability System Survey(tort litigation treatment, judicial impartiality, etc.)
62.4 31
State Minimum Wage(federal floor is $7.25) $7.25 1
Average Workers’ Compensation Costs(per $100 of payroll) $1.80 24
Right-to-Work State?(option to join or support a union) Yes 1
Number of Tax Expenditure Limits(0=least/worst 3=most/best) 0 34
Economic Performance Rank 16 Economic
Outlook Rank 17
Georgia2017 ALEC-LAFFER STATE ECONOMIC COMPETITIVENESS INDEX
Historical Ranking ComparisonECONOMIC OUTLOOK RANK
2010 2011 2012 2013 2014 2015 2016
9 11 10 8 9 7 19
-3%
-2%
-1%
0%
1%
2%
3%
4%
5%
6%
7%
www.alec.org 12
’06 ’07 ’08 ’09 ’10 ’11 ’12 ’13 ’14 ’15
Absolute Domestic MigrationCumulative 2006-2015
Economic Performance Rank (1=best 50=worst)A backward-looking measure based on the state’s per-formance (equal-weighted average) in the three impor-tant performance variables shown below. These vari-ables are highly influenced by state policy.
Economic Outlook Rank (1=best 50=worst)A forward-looking forecast based on the state’s standing (equal-weighted average) in the 15 important state policy variables shown below. Data reflect state and local rates and revenues and any effect of federal deductibility.
(in thousands)
’06 ’07 ’08 ’09 ’10 ’11 ’12 ’13 ’14 ’15
’06 ’07 ’08 ’09 ’10 ’11 ’12 ’13 ’14 ’15
-3%
-2%
-1%
0%
1%
2%
3%
4%
5%
6%
7%
State Gross Domestic ProductCumulative Growth 2005-2015
Non-Farm Payroll EmploymentCumulative Growth 2005-2015
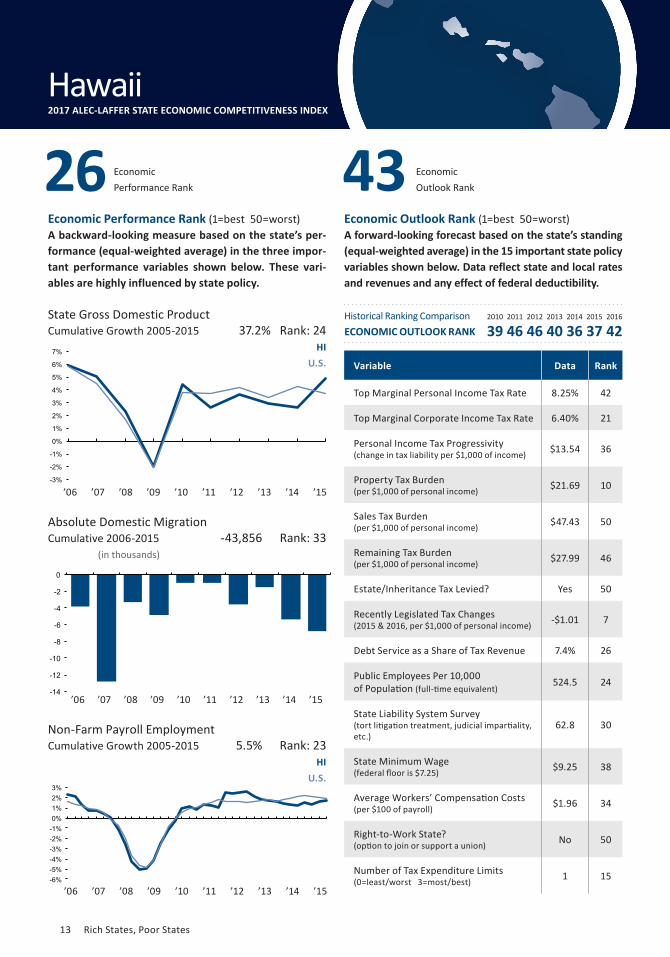
HI
U.S.
HI
U.S.
5.5% Rank: 23
-43,856 Rank: 33
37.2% Rank: 24
Variable Data Rank
Top Marginal Personal Income Tax Rate 8.25% 42
Top Marginal Corporate Income Tax Rate 6.40% 21
Personal Income Tax Progressivity (change in tax liability per $1,000 of income) $13.54 36
Property Tax Burden(per $1,000 of personal income) $21.69 10
Sales Tax Burden(per $1,000 of personal income) $47.43 50
Remaining Tax Burden(per $1,000 of personal income) $27.99 46
Estate/Inheritance Tax Levied? Yes 50
Recently Legislated Tax Changes(2015 & 2016, per $1,000 of personal income) -$1.01 7
Debt Service as a Share of Tax Revenue 7.4% 26
Public Employees Per 10,000 of Population (full-time equivalent)
524.5 24
State Liability System Survey(tort litigation treatment, judicial impartiality, etc.)
62.8 30
State Minimum Wage(federal floor is $7.25) $9.25 38
Average Workers’ Compensation Costs(per $100 of payroll) $1.96 34
Right-to-Work State?(option to join or support a union) No 50
Number of Tax Expenditure Limits(0=least/worst 3=most/best) 1 15
Economic Performance Rank 26 Economic
Outlook Rank 43
Hawaii2017 ALEC-LAFFER STATE ECONOMIC COMPETITIVENESS INDEX
Historical Ranking ComparisonECONOMIC OUTLOOK RANK
2010 2011 2012 2013 2014 2015 2016
39 46 46 40 36 37 42
-14
-12
-10
-8
-6
-4
-2
0
-6% -5% -4% -3% -2% -1% 0% 1% 2% 3%
13 Rich States, Poor States
’06 ’07 ’08 ’09 ’10 ’11 ’12 ’13 ’14 ’15
www.alec.org 69
Economic Performance Rank (1=best 50=worst)A backward-looking measure based on the state’s per-formance (equal-weighted average) in the three impor-tant performance variables shown below. These vari-ables are highly influenced by state policy.
Economic Outlook Rank (1=best 50=worst)A forward-looking forecast based on the state’s standing (equal-weighted average) in the 15 important state policy variables shown below. Data reflect state and local rates and revenues and any effect of federal deductibility.
(in thousands)
’06 ’07 ’08 ’09 ’10 ’11 ’12 ’13 ’14 ’15
’06 ’07 ’08 ’09 ’10 ’11 ’12 ’13 ’14 ’15
State Gross Domestic ProductCumulative Growth 2005-2015
Economic Outlook Rank
Absolute Domestic MigrationCumulative 2006-2015
Non-Farm Payroll EmploymentCumulative Growth 2005-2015
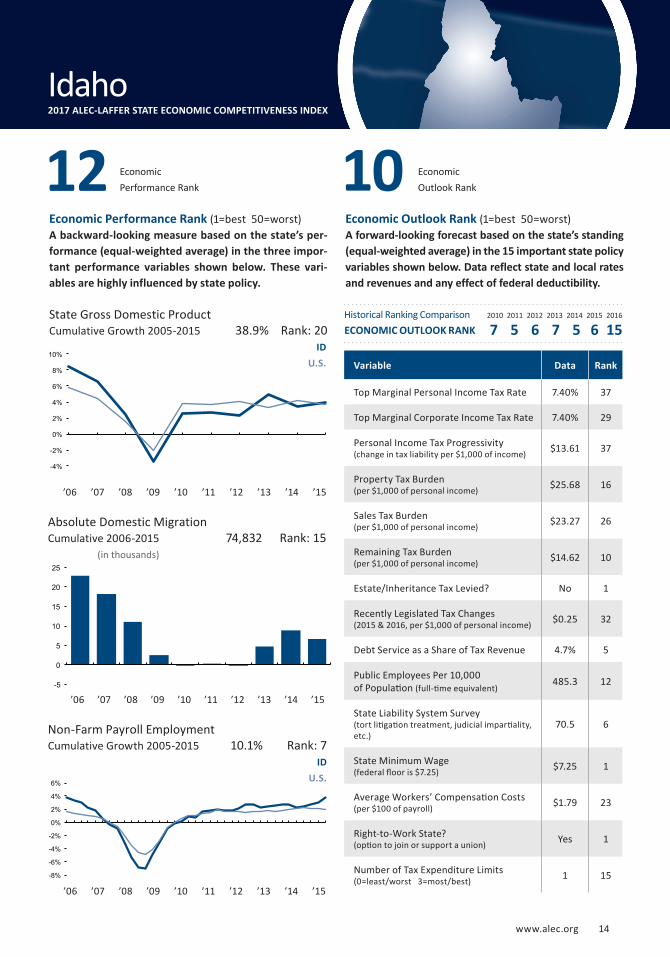
ID
U.S.
ID
U.S.
74,832 Rank: 15
38.9% Rank: 20
Variable Data Rank
Top Marginal Personal Income Tax Rate 7.40% 37
Top Marginal Corporate Income Tax Rate 7.40% 29
Personal Income Tax Progressivity (change in tax liability per $1,000 of income) $13.61 37
Property Tax Burden(per $1,000 of personal income) $25.68 16
Sales Tax Burden(per $1,000 of personal income) $23.27 26
Remaining Tax Burden(per $1,000 of personal income) $14.62 10
Estate/Inheritance Tax Levied? No 1
Recently Legislated Tax Changes(2015 & 2016, per $1,000 of personal income) $0.25 32
Debt Service as a Share of Tax Revenue 4.7% 5
Public Employees Per 10,000 of Population (full-time equivalent)
485.3 12
State Liability System Survey(tort litigation treatment, judicial impartiality, etc.)
70.5 6
State Minimum Wage(federal floor is $7.25) $7.25 1
Average Workers’ Compensation Costs(per $100 of payroll) $1.79 23
Right-to-Work State?(option to join or support a union) Yes 1
Number of Tax Expenditure Limits(0=least/worst 3=most/best) 1 15
Economic Performance Rank 12
Idaho2017 ALEC-LAFFER STATE ECONOMIC COMPETITIVENESS INDEX
10
10.1% Rank: 7
Historical Ranking ComparisonECONOMIC OUTLOOK RANK
2010 2011 2012 2013 2014 2015 2016
7 5 6 7 5 6 15
-4%
-2%
0%
2%
4%
6%
8%
10%
-5
0
5
10
15
20
25
-8%
-6%
-4%
-2%
0%
2%
4%
6%
www.alec.org 14
’06 ’07 ’08 ’09 ’10 ’11 ’12 ’13 ’14 ’15
Absolute Domestic MigrationCumulative 2006-2015
Economic Performance Rank (1=best 50=worst)A backward-looking measure based on the state’s per-formance (equal-weighted average) in the three impor-tant performance variables shown below. These vari-ables are highly influenced by state policy.
Economic Outlook Rank (1=best 50=worst)A forward-looking forecast based on the state’s standing (equal-weighted average) in the 15 important state policy variables shown below. Data reflect state and local rates and revenues and any effect of federal deductibility.
(in thousands)
’06 ’07 ’08 ’09 ’10 ’11 ’12 ’13 ’14 ’15
’06 ’07 ’08 ’09 ’10 ’11 ’12 ’13 ’14 ’15
State Gross Domestic ProductCumulative Growth 2005-2015
Non-Farm Payroll EmploymentCumulative Growth 2005-2015
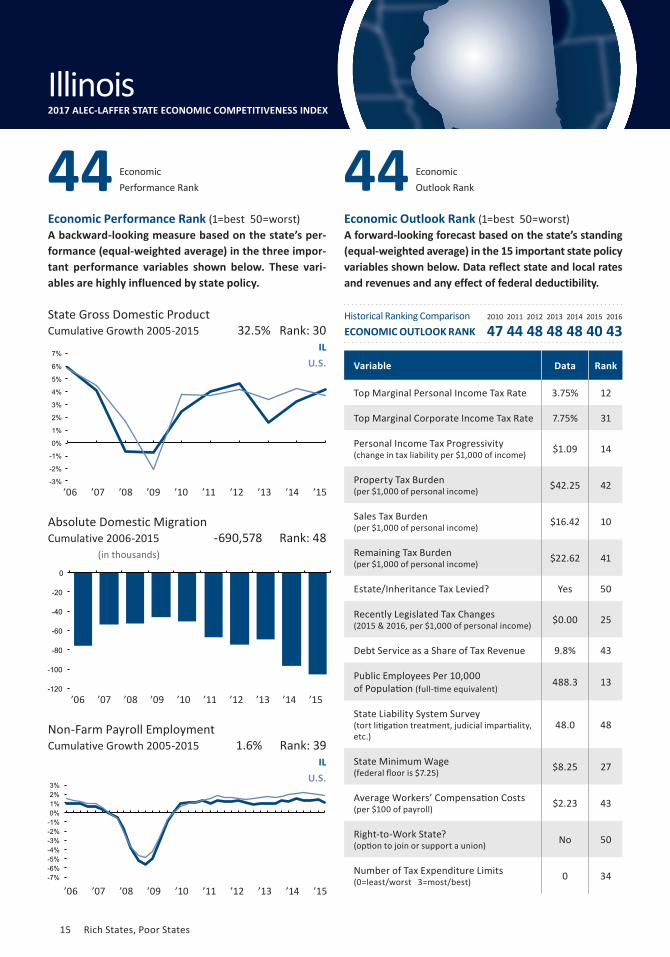
IL
U.S.
IL
U.S.
1.6% Rank: 39
-690,578 Rank: 48
32.5% Rank: 30
Variable Data Rank
Top Marginal Personal Income Tax Rate 3.75% 12
Top Marginal Corporate Income Tax Rate 7.75% 31
Personal Income Tax Progressivity (change in tax liability per $1,000 of income) $1.09 14
Property Tax Burden(per $1,000 of personal income) $42.25 42
Sales Tax Burden(per $1,000 of personal income) $16.42 10
Remaining Tax Burden(per $1,000 of personal income) $22.62 41
Estate/Inheritance Tax Levied? Yes 50
Recently Legislated Tax Changes(2015 & 2016, per $1,000 of personal income) $0.00 25
Debt Service as a Share of Tax Revenue 9.8% 43
Public Employees Per 10,000 of Population (full-time equivalent)
488.3 13
State Liability System Survey(tort litigation treatment, judicial impartiality, etc.)
48.0 48
State Minimum Wage(federal floor is $7.25) $8.25 27
Average Workers’ Compensation Costs(per $100 of payroll) $2.23 43
Right-to-Work State?(option to join or support a union) No 50
Number of Tax Expenditure Limits(0=least/worst 3=most/best) 0 34
Economic Performance Rank 44 Economic
Outlook Rank 44
Illinois2017 ALEC-LAFFER STATE ECONOMIC COMPETITIVENESS INDEX
Historical Ranking ComparisonECONOMIC OUTLOOK RANK
2010 2011 2012 2013 2014 2015 2016
47 44 48 48 48 40 43
-3%
-2%
-1%
0%
1%
2%
3%
4%
5%
6%
7%
-120
-100
-80
-60
-40
-20
0
-7% -6% -5% -4% -3% -2% -1% 0% 1% 2% 3%
15 Rich States, Poor States
’06 ’07 ’08 ’09 ’10 ’11 ’12 ’13 ’14 ’15
’06 ’07 ’08 ’09 ’10 ’11 ’12 ’13 ’14 ’15
Absolute Domestic MigrationCumulative 2006-2015
www.alec.org 71
Economic Performance Rank (1=best 50=worst)A backward-looking measure based on the state’s per-formance (equal-weighted average) in the three impor-tant performance variables shown below. These vari-ables are highly influenced by state policy.
Economic Outlook Rank (1=best 50=worst)A forward-looking forecast based on the state’s standing (equal-weighted average) in the 15 important state policy variables shown below. Data reflect state and local rates and revenues and any effect of federal deductibility.
(in thousands)
’06 ’07 ’08 ’09 ’10 ’11 ’12 ’13 ’14 ’15
-8% -7% -6% -5% -4% -3% -2% -1% 0% 1% 2% 3%
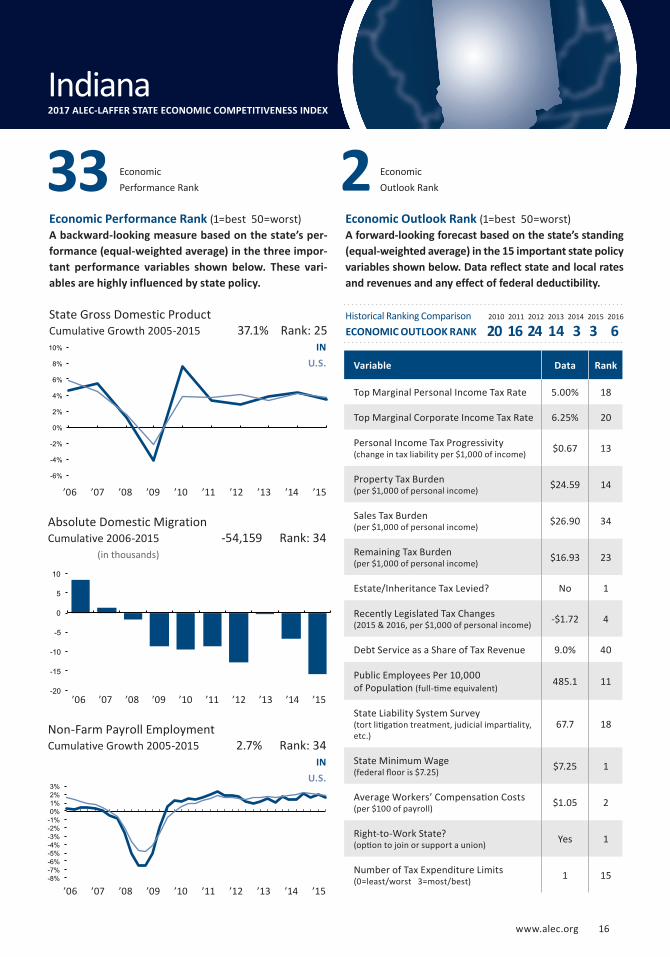
State Gross Domestic ProductCumulative Growth 2005-2015
Non-Farm Payroll EmploymentCumulative Growth 2005-2015
IN
U.S.
IN
U.S.
2.7% Rank: 34
-54,159 Rank: 34
37.1% Rank: 25
Variable Data Rank
Top Marginal Personal Income Tax Rate 5.00% 18
Top Marginal Corporate Income Tax Rate 6.25% 20
Personal Income Tax Progressivity (change in tax liability per $1,000 of income) $0.67 13
Property Tax Burden(per $1,000 of personal income) $24.59 14
Sales Tax Burden(per $1,000 of personal income) $26.90 34
Remaining Tax Burden(per $1,000 of personal income) $16.93 23
Estate/Inheritance Tax Levied? No 1
Recently Legislated Tax Changes(2015 & 2016, per $1,000 of personal income) -$1.72 4
Debt Service as a Share of Tax Revenue 9.0% 40
Public Employees Per 10,000 of Population (full-time equivalent)
485.1 11
State Liability System Survey(tort litigation treatment, judicial impartiality, etc.)
67.7 18
State Minimum Wage(federal floor is $7.25) $7.25 1
Average Workers’ Compensation Costs(per $100 of payroll) $1.05 2
Right-to-Work State?(option to join or support a union) Yes 1
Number of Tax Expenditure Limits(0=least/worst 3=most/best) 1 15
Economic Performance Rank 33 Economic
Outlook Rank 2
Indiana2017 ALEC-LAFFER STATE ECONOMIC COMPETITIVENESS INDEX
Historical Ranking ComparisonECONOMIC OUTLOOK RANK
2010 2011 2012 2013 2014 2015 2016
20 16 24 14 3 3 6
-6%
-4%
-2%
0%
2%
4%
6%
8%
10%
-20
-15
-10
-5
0
5
10
www.alec.org 16

’06 ’07 ’08 ’09 ’10 ’11 ’12 ’13 ’14 ’15
Absolute Domestic MigrationCumulative 2006-2015
Economic Performance Rank (1=best 50=worst)A backward-looking measure based on the state’s per-formance (equal-weighted average) in the three impor-tant performance variables shown below. These vari-ables are highly influenced by state policy.
Economic Outlook Rank (1=best 50=worst)A forward-looking forecast based on the state’s standing (equal-weighted average) in the 15 important state policy variables shown below. Data reflect state and local rates and revenues and any effect of federal deductibility.
(in thousands)
’06 ’07 ’08 ’09 ’10 ’11 ’12 ’13 ’14 ’15
’06 ’07 ’08 ’09 ’10 ’11 ’12 ’13 ’14 ’15
-5% -4% -3% -2% -1% 0% 1% 2% 3%
State Gross Domestic ProductCumulative Growth 2005-2015
Non-Farm Payroll EmploymentCumulative Growth 2005-2015
IA
U.S.
IA
U.S.
5.5% Rank: 22
-13,141 Rank: 28
41.1% Rank: 13
Variable Data Rank
Top Marginal Personal Income Tax Rate 5.42% 23
Top Marginal Corporate Income Tax Rate 9.90% 46
Personal Income Tax Progressivity (change in tax liability per $1,000 of income) $11.86 33
Property Tax Burden(per $1,000 of personal income) $35.04 35
Sales Tax Burden(per $1,000 of personal income) $21.86 21
Remaining Tax Burden(per $1,000 of personal income) $17.38 25
Estate/Inheritance Tax Levied? Yes 50
Recently Legislated Tax Changes(2015 & 2016, per $1,000 of personal income) $1.52 43
Debt Service as a Share of Tax Revenue 4.8% 6
Public Employees Per 10,000 of Population (full-time equivalent)
583.6 41
State Liability System Survey(tort litigation treatment, judicial impartiality, etc.)
72.2 4
State Minimum Wage(federal floor is $7.25) $7.25 1
Average Workers’ Compensation Costs(per $100 of payroll) $1.86 27
Right-to-Work State?(option to join or support a union) Yes 1
Number of Tax Expenditure Limits(0=least/worst 3=most/best) 1 15
Economic Performance Rank 17 Economic
Outlook Rank 29
Iowa2017 ALEC-LAFFER STATE ECONOMIC COMPETITIVENESS INDEX
Historical Ranking ComparisonECONOMIC OUTLOOK RANK
2010 2011 2012 2013 2014 2015 2016
28 23 22 25 25 25 29
-4%
-2%
0%
2%
4%
6%
8%
10%
-5
-4
-3
-2
-1
0
1
17 Rich States, Poor States
’06 ’07 ’08 ’09 ’10 ’11 ’12 ’13 ’14 ’15
’06 ’07 ’08 ’09 ’10 ’11 ’12 ’13 ’14 ’15
Absolute Domestic MigrationCumulative 2006-2015
www.alec.org 73
Economic Performance Rank (1=best 50=worst)A backward-looking measure based on the state’s per-formance (equal-weighted average) in the three impor-tant performance variables shown below. These vari-ables are highly influenced by state policy.
Economic Outlook Rank (1=best 50=worst)A forward-looking forecast based on the state’s standing (equal-weighted average) in the 15 important state policy variables shown below. Data reflect state and local rates and revenues and any effect of federal deductibility.
(in thousands)
’06 ’07 ’08 ’09 ’10 ’11 ’12 ’13 ’14 ’15
-14
-12
-10
-8
-6
-4
-2
0
2
4
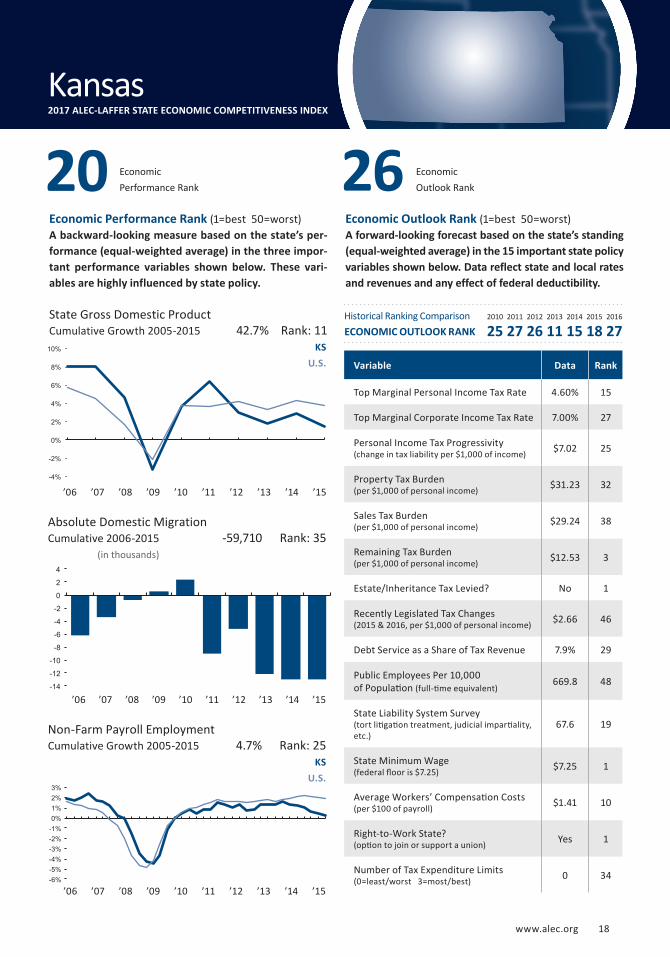
State Gross Domestic ProductCumulative Growth 2005-2015
Non-Farm Payroll EmploymentCumulative Growth 2005-2015
KS
U.S.
KS
U.S.
4.7% Rank: 25
-59,710 Rank: 35
42.7% Rank: 11
Variable Data Rank
Top Marginal Personal Income Tax Rate 4.60% 15
Top Marginal Corporate Income Tax Rate 7.00% 27
Personal Income Tax Progressivity (change in tax liability per $1,000 of income) $7.02 25
Property Tax Burden(per $1,000 of personal income) $31.23 32
Sales Tax Burden(per $1,000 of personal income) $29.24 38
Remaining Tax Burden(per $1,000 of personal income) $12.53 3
Estate/Inheritance Tax Levied? No 1
Recently Legislated Tax Changes(2015 & 2016, per $1,000 of personal income) $2.66 46
Debt Service as a Share of Tax Revenue 7.9% 29
Public Employees Per 10,000 of Population (full-time equivalent)
669.8 48
State Liability System Survey(tort litigation treatment, judicial impartiality, etc.)
67.6 19
State Minimum Wage(federal floor is $7.25) $7.25 1
Average Workers’ Compensation Costs(per $100 of payroll) $1.41 10
Right-to-Work State?(option to join or support a union) Yes 1
Number of Tax Expenditure Limits(0=least/worst 3=most/best) 0 34
Economic Performance Rank 20 Economic
Outlook Rank 26
Kansas2017 ALEC-LAFFER STATE ECONOMIC COMPETITIVENESS INDEX
Historical Ranking ComparisonECONOMIC OUTLOOK RANK
2010 2011 2012 2013 2014 2015 2016
25 27 26 11 15 18 27
-4%
-2%
0%
2%
4%
6%
8%
10%
-6% -5% -4% -3% -2% -1% 0% 1% 2% 3%
www.alec.org 18
’06 ’07 ’08 ’09 ’10 ’11 ’12 ’13 ’14 ’15
Absolute Domestic MigrationCumulative 2006-2015
Economic Performance Rank (1=best 50=worst)A backward-looking measure based on the state’s per-formance (equal-weighted average) in the three impor-tant performance variables shown below. These vari-ables are highly influenced by state policy.
Economic Outlook Rank (1=best 50=worst)A forward-looking forecast based on the state’s standing (equal-weighted average) in the 15 important state policy variables shown below. Data reflect state and local rates and revenues and any effect of federal deductibility.
(in thousands)
’06 ’07 ’08 ’09 ’10 ’11 ’12 ’13 ’14 ’15
’06 ’07 ’08 ’09 ’10 ’11 ’12 ’13 ’14 ’15 -10
-5
0
5
10
15
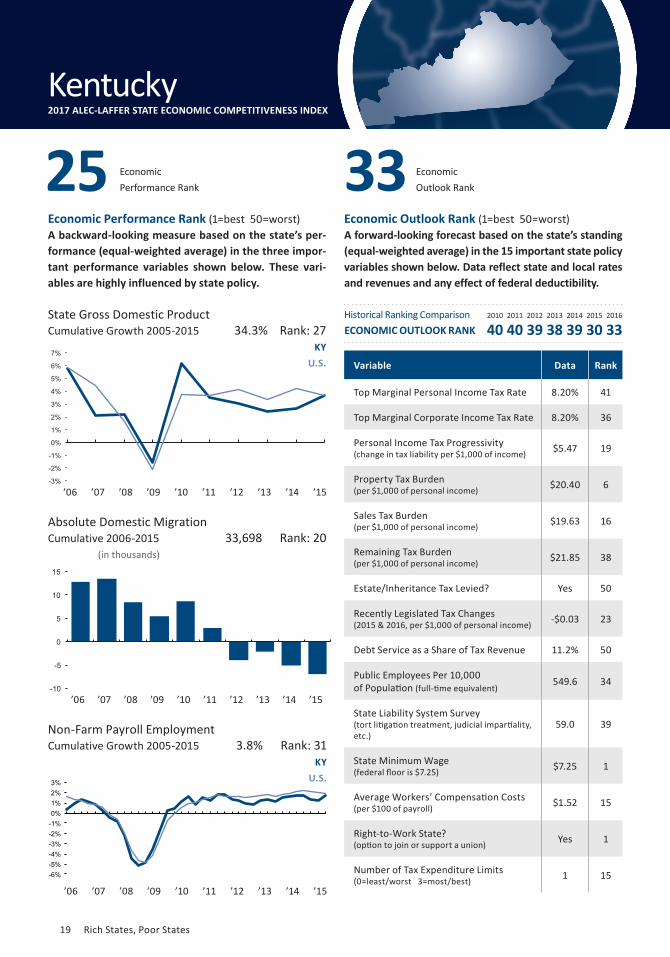
State Gross Domestic ProductCumulative Growth 2005-2015
Non-Farm Payroll EmploymentCumulative Growth 2005-2015
KY
U.S.
KY
U.S.
3.8% Rank: 31
33,698 Rank: 20
34.3% Rank: 27
Variable Data Rank
Top Marginal Personal Income Tax Rate 8.20% 41
Top Marginal Corporate Income Tax Rate 8.20% 36
Personal Income Tax Progressivity (change in tax liability per $1,000 of income) $5.47 19
Property Tax Burden(per $1,000 of personal income) $20.40 6
Sales Tax Burden(per $1,000 of personal income) $19.63 16
Remaining Tax Burden(per $1,000 of personal income) $21.85 38
Estate/Inheritance Tax Levied? Yes 50
Recently Legislated Tax Changes(2015 & 2016, per $1,000 of personal income) -$0.03 23
Debt Service as a Share of Tax Revenue 11.2% 50
Public Employees Per 10,000 of Population (full-time equivalent)
549.6 34
State Liability System Survey(tort litigation treatment, judicial impartiality, etc.)
59.0 39
State Minimum Wage(federal floor is $7.25) $7.25 1
Average Workers’ Compensation Costs(per $100 of payroll) $1.52 15
Right-to-Work State?(option to join or support a union) Yes 1
Number of Tax Expenditure Limits(0=least/worst 3=most/best) 1 15
Economic Performance Rank 25 Economic
Outlook Rank 33
Kentucky2017 ALEC-LAFFER STATE ECONOMIC COMPETITIVENESS INDEX
Historical Ranking ComparisonECONOMIC OUTLOOK RANK
2010 2011 2012 2013 2014 2015 2016
40 40 39 38 39 30 33
-3%
-2%
-1%
0%
1%
2%
3%
4%
5%
6%
7%
-6% -5% -4% -3% -2% -1% 0% 1% 2% 3%
19 Rich States, Poor States
’06 ’07 ’08 ’09 ’10 ’11 ’12 ’13 ’14 ’15
Absolute Domestic MigrationCumulative 2006-2015
www.alec.org 75
Economic Performance Rank (1=best 50=worst)A backward-looking measure based on the state’s per-formance (equal-weighted average) in the three impor-tant performance variables shown below. These vari-ables are highly influenced by state policy.
Economic Outlook Rank (1=best 50=worst)A forward-looking forecast based on the state’s standing (equal-weighted average) in the 15 important state policy variables shown below. Data reflect state and local rates and revenues and any effect of federal deductibility.
(in thousands)
’06 ’07 ’08 ’09 ’10 ’11 ’12 ’13 ’14 ’15
’06 ’07 ’08 ’09 ’10 ’11 ’12 ’13 ’14 ’15 -300
-250
-200
-150
-100
-50
0
50
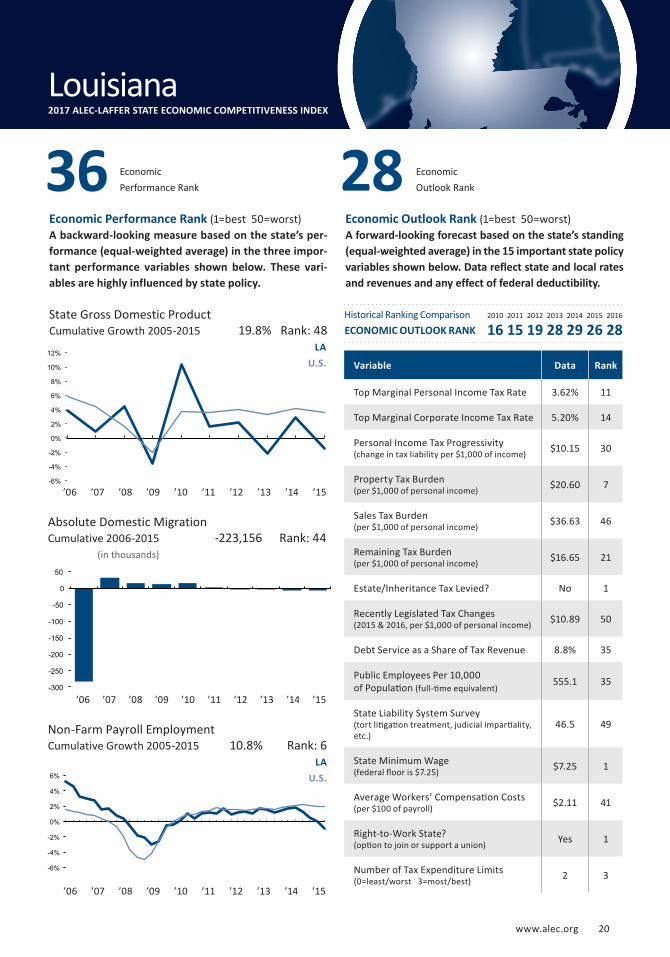
State Gross Domestic ProductCumulative Growth 2005-2015
Non-Farm Payroll EmploymentCumulative Growth 2005-2015
LA
U.S.
LA
U.S.
10.8% Rank: 6
-223,156 Rank: 44
19.8% Rank: 48
Variable Data Rank
Top Marginal Personal Income Tax Rate 3.62% 11
Top Marginal Corporate Income Tax Rate 5.20% 14
Personal Income Tax Progressivity (change in tax liability per $1,000 of income) $10.15 30
Property Tax Burden(per $1,000 of personal income) $20.60 7
Sales Tax Burden(per $1,000 of personal income) $36.63 46
Remaining Tax Burden(per $1,000 of personal income) $16.65 21
Estate/Inheritance Tax Levied? No 1
Recently Legislated Tax Changes(2015 & 2016, per $1,000 of personal income) $10.89 50
Debt Service as a Share of Tax Revenue 8.8% 35
Public Employees Per 10,000 of Population (full-time equivalent)
555.1 35
State Liability System Survey(tort litigation treatment, judicial impartiality, etc.)
46.5 49
State Minimum Wage(federal floor is $7.25) $7.25 1
Average Workers’ Compensation Costs(per $100 of payroll) $2.11 41
Right-to-Work State?(option to join or support a union) Yes 1
Number of Tax Expenditure Limits(0=least/worst 3=most/best) 2 3
Economic Performance Rank 36 Economic
Outlook Rank 28
Louisiana2017 ALEC-LAFFER STATE ECONOMIC COMPETITIVENESS INDEX
Historical Ranking ComparisonECONOMIC OUTLOOK RANK
2010 2011 2012 2013 2014 2015 2016
16 15 19 28 29 26 28
-6%
-4%
-2%
0%
2%
4%
6%
8%
10%
12%
-6%
-4%
-2%
0%
2%
4%
6%
www.alec.org 20
’06 ’07 ’08 ’09 ’10 ’11 ’12 ’13 ’14 ’15
Absolute Domestic MigrationCumulative 2006-2015
Economic Performance Rank (1=best 50=worst)A backward-looking measure based on the state’s per-formance (equal-weighted average) in the three impor-tant performance variables shown below. These vari-ables are highly influenced by state policy.
Economic Outlook Rank (1=best 50=worst)A forward-looking forecast based on the state’s standing (equal-weighted average) in the 15 important state policy variables shown below. Data reflect state and local rates and revenues and any effect of federal deductibility.
(in thousands)
’06 ’07 ’08 ’09 ’10 ’11 ’12 ’13 ’14 ’15
’06 ’07 ’08 ’09 ’10 ’11 ’12 ’13 ’14 ’15
-6% -5% -4% -3% -2% -1% 0% 1% 2% 3%
-5
-4
-3
-2
-1
0
1
2
-3%
-2%
-1%
0%
1%
2%
3%
4%
5%
6%
State Gross Domestic ProductCumulative Growth 2005-2015
Non-Farm Payroll EmploymentCumulative Growth 2005-2015
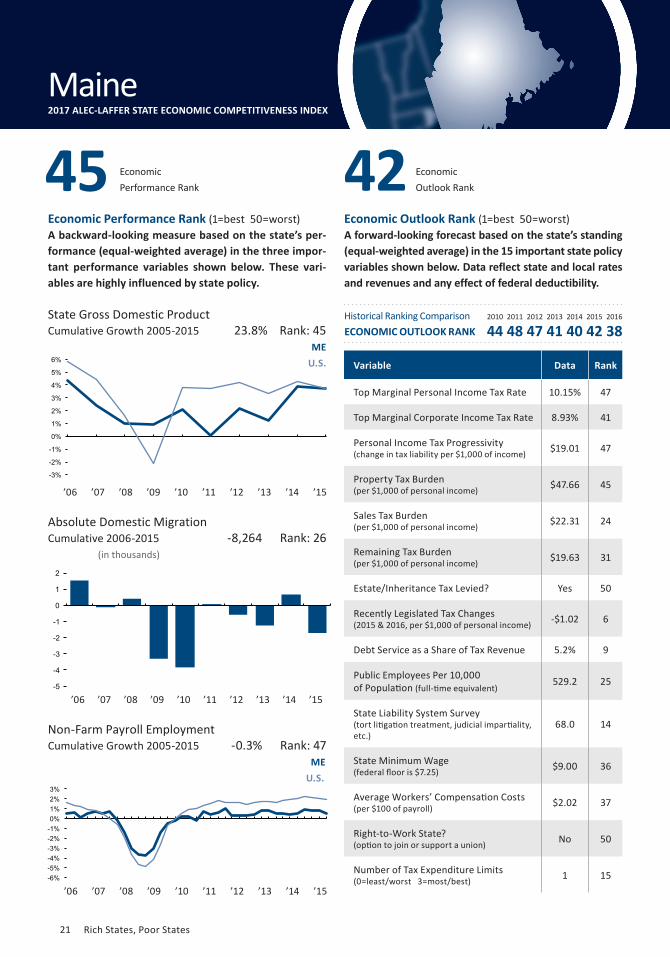
ME
U.S.
ME
U.S.
-0.3% Rank: 47
-8,264 Rank: 26
23.8% Rank: 45
Variable Data Rank
Top Marginal Personal Income Tax Rate 10.15% 47
Top Marginal Corporate Income Tax Rate 8.93% 41
Personal Income Tax Progressivity (change in tax liability per $1,000 of income) $19.01 47
Property Tax Burden(per $1,000 of personal income) $47.66 45
Sales Tax Burden(per $1,000 of personal income) $22.31 24
Remaining Tax Burden(per $1,000 of personal income) $19.63 31
Estate/Inheritance Tax Levied? Yes 50
Recently Legislated Tax Changes(2015 & 2016, per $1,000 of personal income) -$1.02 6
Debt Service as a Share of Tax Revenue 5.2% 9
Public Employees Per 10,000 of Population (full-time equivalent)
529.2 25
State Liability System Survey(tort litigation treatment, judicial impartiality, etc.)
68.0 14
State Minimum Wage(federal floor is $7.25) $9.00 36
Average Workers’ Compensation Costs(per $100 of payroll) $2.02 37
Right-to-Work State?(option to join or support a union) No 50
Number of Tax Expenditure Limits(0=least/worst 3=most/best) 1 15
Economic Performance Rank 45 Economic
Outlook Rank 42
Maine2017 ALEC-LAFFER STATE ECONOMIC COMPETITIVENESS INDEX
Historical Ranking ComparisonECONOMIC OUTLOOK RANK
2010 2011 2012 2013 2014 2015 2016
44 48 47 41 40 42 38
21 Rich States, Poor States
’06 ’07 ’08 ’09 ’10 ’11 ’12 ’13 ’14 ’15
’06 ’07 ’08 ’09 ’10 ’11 ’12 ’13 ’14 ’15
Absolute Domestic MigrationCumulative 2006-2015
www.alec.org 77
Economic Performance Rank (1=best 50=worst)A backward-looking measure based on the state’s per-formance (equal-weighted average) in the three impor-tant performance variables shown below. These vari-ables are highly influenced by state policy.
Economic Outlook Rank (1=best 50=worst)A forward-looking forecast based on the state’s standing (equal-weighted average) in the 15 important state policy variables shown below. Data reflect state and local rates and revenues and any effect of federal deductibility.
(in thousands)
’06 ’07 ’08 ’09 ’10 ’11 ’12 ’13 ’14 ’15
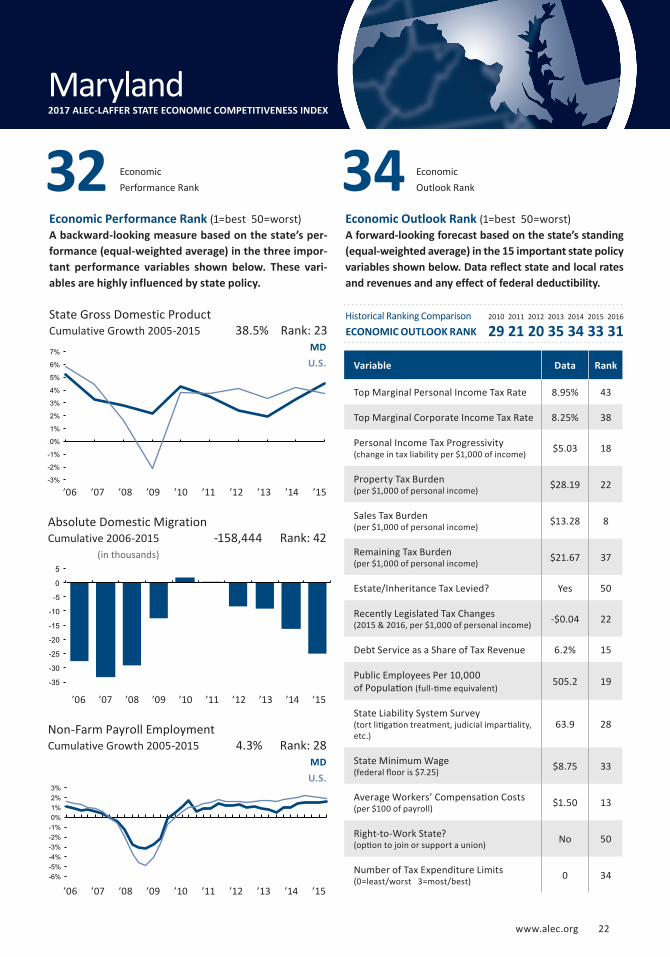
State Gross Domestic ProductCumulative Growth 2005-2015
Non-Farm Payroll EmploymentCumulative Growth 2005-2015
MD
U.S.
MD
U.S.
4.3% Rank: 28
-158,444 Rank: 42
38.5% Rank: 23
Variable Data Rank
Top Marginal Personal Income Tax Rate 8.95% 43
Top Marginal Corporate Income Tax Rate 8.25% 38
Personal Income Tax Progressivity (change in tax liability per $1,000 of income) $5.03 18
Property Tax Burden(per $1,000 of personal income) $28.19 22
Sales Tax Burden(per $1,000 of personal income) $13.28 8
Remaining Tax Burden(per $1,000 of personal income) $21.67 37
Estate/Inheritance Tax Levied? Yes 50
Recently Legislated Tax Changes(2015 & 2016, per $1,000 of personal income) -$0.04 22
Debt Service as a Share of Tax Revenue 6.2% 15
Public Employees Per 10,000 of Population (full-time equivalent)
505.2 19
State Liability System Survey(tort litigation treatment, judicial impartiality, etc.)
63.9 28
State Minimum Wage(federal floor is $7.25) $8.75 33
Average Workers’ Compensation Costs(per $100 of payroll) $1.50 13
Right-to-Work State?(option to join or support a union) No 50
Number of Tax Expenditure Limits(0=least/worst 3=most/best) 0 34
Economic Performance Rank 32 Economic
Outlook Rank 34
Maryland2017 ALEC-LAFFER STATE ECONOMIC COMPETITIVENESS INDEX
Historical Ranking ComparisonECONOMIC OUTLOOK RANK
2010 2011 2012 2013 2014 2015 2016
29 21 20 35 34 33 31
-3%
-2%
-1%
0%
1%
2%
3%
4%
5%
6%
7%
-35
-30
-25
-20
-15
-10
-5
0
5
-6% -5% -4% -3% -2% -1% 0% 1% 2% 3%
www.alec.org 22
’06 ’07 ’08 ’09 ’10 ’11 ’12 ’13 ’14 ’15
Absolute Domestic MigrationCumulative 2006-2015
Economic Performance Rank (1=best 50=worst)A backward-looking measure based on the state’s per-formance (equal-weighted average) in the three impor-tant performance variables shown below. These vari-ables are highly influenced by state policy.
Economic Outlook Rank (1=best 50=worst)A forward-looking forecast based on the state’s standing (equal-weighted average) in the 15 important state policy variables shown below. Data reflect state and local rates and revenues and any effect of federal deductibility.
(in thousands)
’06 ’07 ’08 ’09 ’10 ’11 ’12 ’13 ’14 ’15
’06 ’07 ’08 ’09 ’10 ’11 ’12 ’13 ’14 ’15 -50
-40
-30
-20
-10
0
10
State Gross Domestic ProductCumulative Growth 2005-2015
Non-Farm Payroll EmploymentCumulative Growth 2005-2015
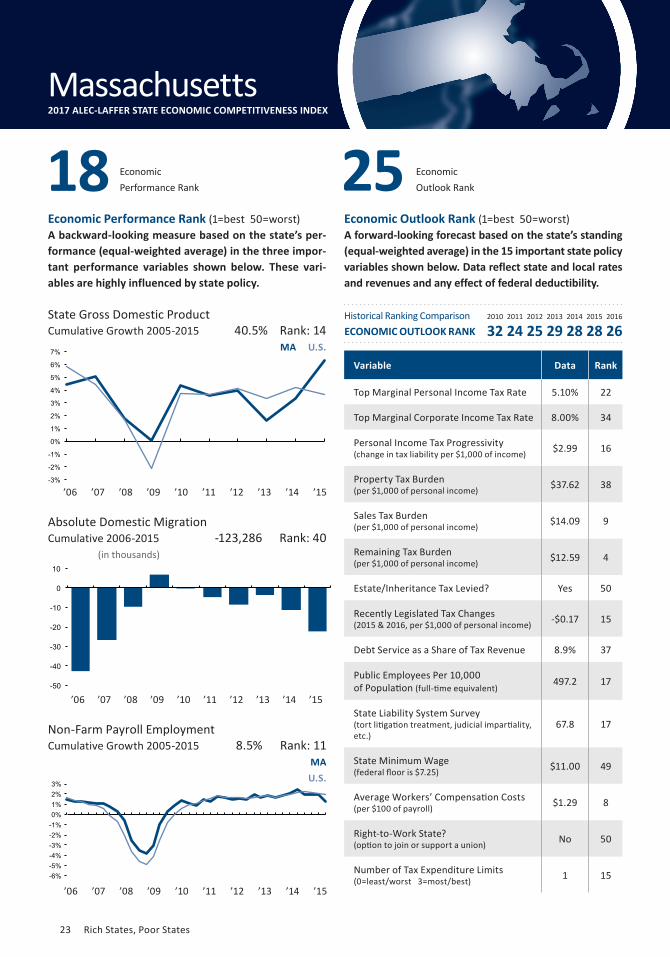
MA
U.S.
MA U.S.
8.5% Rank: 11
-123,286 Rank: 40
40.5% Rank: 14
Variable Data Rank
Top Marginal Personal Income Tax Rate 5.10% 22
Top Marginal Corporate Income Tax Rate 8.00% 34
Personal Income Tax Progressivity (change in tax liability per $1,000 of income) $2.99 16
Property Tax Burden(per $1,000 of personal income) $37.62 38
Sales Tax Burden(per $1,000 of personal income) $14.09 9
Remaining Tax Burden(per $1,000 of personal income) $12.59 4
Estate/Inheritance Tax Levied? Yes 50
Recently Legislated Tax Changes(2015 & 2016, per $1,000 of personal income) -$0.17 15
Debt Service as a Share of Tax Revenue 8.9% 37
Public Employees Per 10,000 of Population (full-time equivalent)
497.2 17
State Liability System Survey(tort litigation treatment, judicial impartiality, etc.)
67.8 17
State Minimum Wage(federal floor is $7.25) $11.00 49
Average Workers’ Compensation Costs(per $100 of payroll) $1.29 8
Right-to-Work State?(option to join or support a union) No 50
Number of Tax Expenditure Limits(0=least/worst 3=most/best) 1 15
Economic Performance Rank 18 Economic
Outlook Rank 25
Massachusetts2017 ALEC-LAFFER STATE ECONOMIC COMPETITIVENESS INDEX
Historical Ranking ComparisonECONOMIC OUTLOOK RANK
2010 2011 2012 2013 2014 2015 2016
32 24 25 29 28 28 26
-3%
-2%
-1%
0%
1%
2%
3%
4%
5%
6%
7%
-6% -5% -4% -3% -2% -1% 0% 1% 2% 3%
23 Rich States, Poor States
’06 ’07 ’08 ’09 ’10 ’11 ’12 ’13 ’14 ’15
’06 ’07 ’08 ’09 ’10 ’11 ’12 ’13 ’14 ’15
Absolute Domestic MigrationCumulative 2006-2015
www.alec.org 79
Economic Performance Rank (1=best 50=worst)A backward-looking measure based on the state’s per-formance (equal-weighted average) in the three impor-tant performance variables shown below. These vari-ables are highly influenced by state policy.
Economic Outlook Rank (1=best 50=worst)A forward-looking forecast based on the state’s standing (equal-weighted average) in the 15 important state policy variables shown below. Data reflect state and local rates and revenues and any effect of federal deductibility.
(in thousands)
’06 ’07 ’08 ’09 ’10 ’11 ’12 ’13 ’14 ’15
-120
-100
-80
-60
-40
-20
0
State Gross Domestic ProductCumulative Growth 2005-2015
Non-Farm Payroll EmploymentCumulative Growth 2005-2015
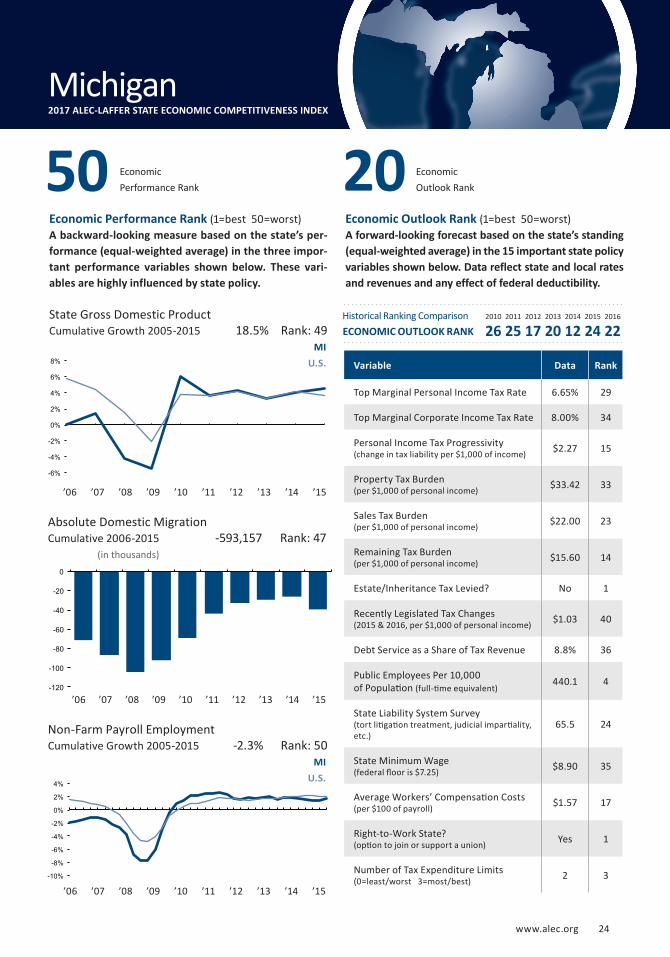
MI
U.S.
MI
U.S.
-2.3% Rank: 50
-593,157 Rank: 47
18.5% Rank: 49
Variable Data Rank
Top Marginal Personal Income Tax Rate 6.65% 29
Top Marginal Corporate Income Tax Rate 8.00% 34
Personal Income Tax Progressivity (change in tax liability per $1,000 of income) $2.27 15
Property Tax Burden(per $1,000 of personal income) $33.42 33
Sales Tax Burden(per $1,000 of personal income) $22.00 23
Remaining Tax Burden(per $1,000 of personal income) $15.60 14
Estate/Inheritance Tax Levied? No 1
Recently Legislated Tax Changes(2015 & 2016, per $1,000 of personal income) $1.03 40
Debt Service as a Share of Tax Revenue 8.8% 36
Public Employees Per 10,000 of Population (full-time equivalent)
440.1 4
State Liability System Survey(tort litigation treatment, judicial impartiality, etc.)
65.5 24
State Minimum Wage(federal floor is $7.25) $8.90 35
Average Workers’ Compensation Costs(per $100 of payroll) $1.57 17
Right-to-Work State?(option to join or support a union) Yes 1
Number of Tax Expenditure Limits(0=least/worst 3=most/best) 2 3
Economic Performance Rank 50 Economic
Outlook Rank 20
Michigan2017 ALEC-LAFFER STATE ECONOMIC COMPETITIVENESS INDEX
Historical Ranking ComparisonECONOMIC OUTLOOK RANK
2010 2011 2012 2013 2014 2015 2016
26 25 17 20 12 24 22
-6%
-4%
-2%
0%
2%
4%
6%
8%
-10%
-8%
-6%
-4%
-2%
0%
2%
4%
www.alec.org 24
’06 ’07 ’08 ’09 ’10 ’11 ’12 ’13 ’14 ’15
Absolute Domestic MigrationCumulative 2006-2015
Economic Performance Rank (1=best 50=worst)A backward-looking measure based on the state’s per-formance (equal-weighted average) in the three impor-tant performance variables shown below. These vari-ables are highly influenced by state policy.
Economic Outlook Rank (1=best 50=worst)A forward-looking forecast based on the state’s standing (equal-weighted average) in the 15 important state policy variables shown below. Data reflect state and local rates and revenues and any effect of federal deductibility.
(in thousands)
’06 ’07 ’08 ’09 ’10 ’11 ’12 ’13 ’14 ’15
’06 ’07 ’08 ’09 ’10 ’11 ’12 ’13 ’14 ’15
-14
-12
-10
-8
-6
-4
-2
0
State Gross Domestic ProductCumulative Growth 2005-2015
Non-Farm Payroll EmploymentCumulative Growth 2005-2015
MN
U.S.
MN
U.S.
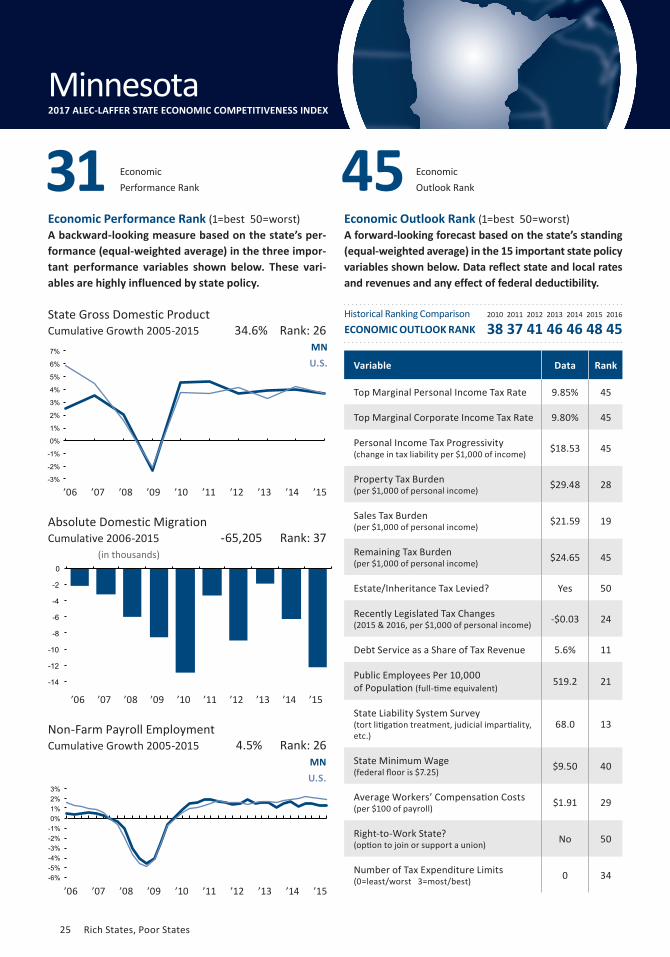
4.5% Rank: 26
-65,205 Rank: 37
34.6% Rank: 26
Variable Data Rank
Top Marginal Personal Income Tax Rate 9.85% 45
Top Marginal Corporate Income Tax Rate 9.80% 45
Personal Income Tax Progressivity (change in tax liability per $1,000 of income) $18.53 45
Property Tax Burden(per $1,000 of personal income) $29.48 28
Sales Tax Burden(per $1,000 of personal income) $21.59 19
Remaining Tax Burden(per $1,000 of personal income) $24.65 45
Estate/Inheritance Tax Levied? Yes 50
Recently Legislated Tax Changes(2015 & 2016, per $1,000 of personal income) -$0.03 24
Debt Service as a Share of Tax Revenue 5.6% 11
Public Employees Per 10,000 of Population (full-time equivalent)
519.2 21
State Liability System Survey(tort litigation treatment, judicial impartiality, etc.)
68.0 13
State Minimum Wage(federal floor is $7.25) $9.50 40
Average Workers’ Compensation Costs(per $100 of payroll) $1.91 29
Right-to-Work State?(option to join or support a union) No 50
Number of Tax Expenditure Limits(0=least/worst 3=most/best) 0 34
Economic Performance Rank 31 Economic
Outlook Rank 45
Minnesota2017 ALEC-LAFFER STATE ECONOMIC COMPETITIVENESS INDEX
Historical Ranking ComparisonECONOMIC OUTLOOK RANK
2010 2011 2012 2013 2014 2015 2016
38 37 41 46 46 48 45
-3%
-2%
-1%
0%
1%
2%
3%
4%
5%
6%
7%
-6% -5% -4% -3% -2% -1% 0% 1% 2% 3%
25 Rich States, Poor States
’06 ’07 ’08 ’09 ’10 ’11 ’12 ’13 ’14 ’15
’06 ’07 ’08 ’09 ’10 ’11 ’12 ’13 ’14 ’15
Absolute Domestic MigrationCumulative 2006-2015
www.alec.org 81
Economic Performance Rank (1=best 50=worst)A backward-looking measure based on the state’s per-formance (equal-weighted average) in the three impor-tant performance variables shown below. These vari-ables are highly influenced by state policy.
Economic Outlook Rank (1=best 50=worst)A forward-looking forecast based on the state’s standing (equal-weighted average) in the 15 important state policy variables shown below. Data reflect state and local rates and revenues and any effect of federal deductibility.
(in thousands)
’06 ’07 ’08 ’09 ’10 ’11 ’12 ’13 ’14 ’15
-6% -5% -4% -3% -2% -1% 0% 1% 2% 3%
State Gross Domestic ProductCumulative Growth 2005-2015
Non-Farm Payroll EmploymentCumulative Growth 2005-2015
MS
U.S.
MS
U.S.
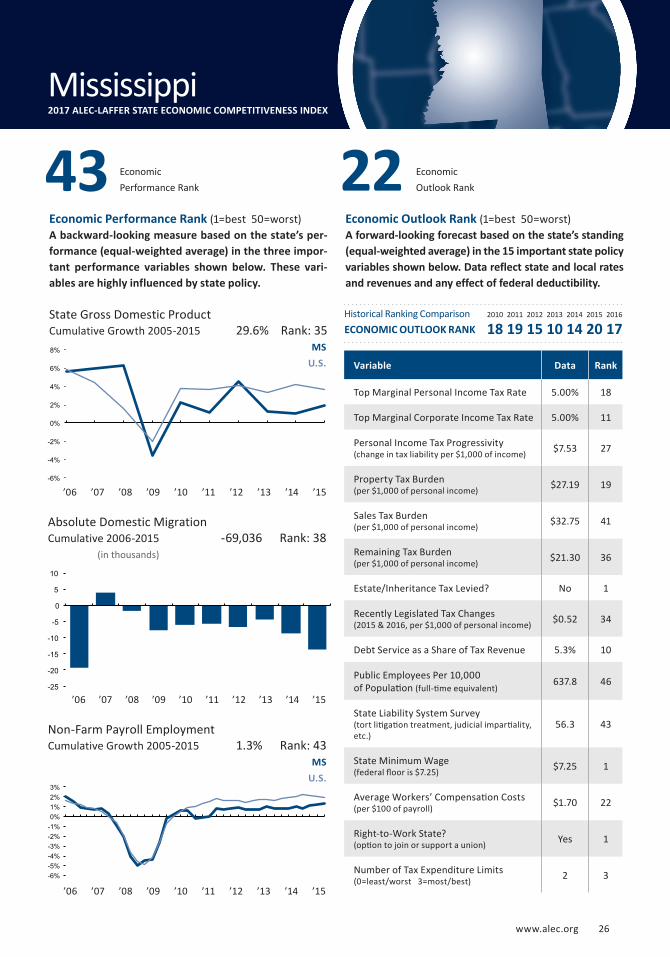
1.3% Rank: 43
-69,036 Rank: 38
29.6% Rank: 35
Variable Data Rank
Top Marginal Personal Income Tax Rate 5.00% 18
Top Marginal Corporate Income Tax Rate 5.00% 11
Personal Income Tax Progressivity (change in tax liability per $1,000 of income) $7.53 27
Property Tax Burden(per $1,000 of personal income) $27.19 19
Sales Tax Burden(per $1,000 of personal income) $32.75 41
Remaining Tax Burden(per $1,000 of personal income) $21.30 36
Estate/Inheritance Tax Levied? No 1
Recently Legislated Tax Changes(2015 & 2016, per $1,000 of personal income) $0.52 34
Debt Service as a Share of Tax Revenue 5.3% 10
Public Employees Per 10,000 of Population (full-time equivalent)
637.8 46
State Liability System Survey(tort litigation treatment, judicial impartiality, etc.)
56.3 43
State Minimum Wage(federal floor is $7.25) $7.25 1
Average Workers’ Compensation Costs(per $100 of payroll) $1.70 22
Right-to-Work State?(option to join or support a union) Yes 1
Number of Tax Expenditure Limits(0=least/worst 3=most/best) 2 3
Economic Performance Rank 43 Economic
Outlook Rank 22
Mississippi2017 ALEC-LAFFER STATE ECONOMIC COMPETITIVENESS INDEX
Historical Ranking ComparisonECONOMIC OUTLOOK RANK
2010 2011 2012 2013 2014 2015 2016
18 19 15 10 14 20 17
-6%
-4%
-2%
0%
2%
4%
6%
8%
-25
-20
-15
-10
-5
0
5
10
www.alec.org 26
’06 ’07 ’08 ’09 ’10 ’11 ’12 ’13 ’14 ’15
Economic Performance Rank (1=best 50=worst)A backward-looking measure based on the state’s per-formance (equal-weighted average) in the three impor-tant performance variables shown below. These vari-ables are highly influenced by state policy.
Economic Outlook Rank (1=best 50=worst)A forward-looking forecast based on the state’s standing (equal-weighted average) in the 15 important state policy variables shown below. Data reflect state and local rates and revenues and any effect of federal deductibility.
’06 ’07 ’08 ’09 ’10 ’11 ’12 ’13 ’14 ’15
’06 ’07 ’08 ’09 ’10 ’11 ’12 ’13 ’14 ’15
State Gross Domestic ProductCumulative Growth 2005-2015
Absolute Domestic MigrationCumulative 2006-2015
(in thousands)
Non-Farm Payroll EmploymentCumulative Growth 2005-2015
MO
U.S.
MO
U.S.
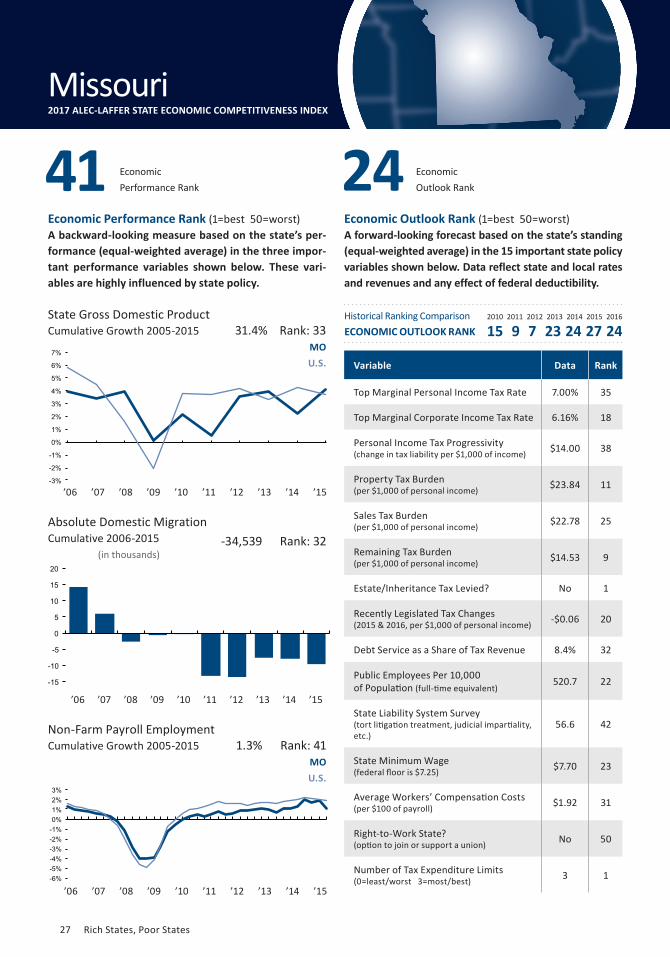
1.3% Rank: 41
-34,539 Rank: 32
31.4% Rank: 33
Variable Data Rank
Top Marginal Personal Income Tax Rate 7.00% 35
Top Marginal Corporate Income Tax Rate 6.16% 18
Personal Income Tax Progressivity (change in tax liability per $1,000 of income) $14.00 38
Property Tax Burden(per $1,000 of personal income) $23.84 11
Sales Tax Burden(per $1,000 of personal income) $22.78 25
Remaining Tax Burden(per $1,000 of personal income) $14.53 9
Estate/Inheritance Tax Levied? No 1
Recently Legislated Tax Changes(2015 & 2016, per $1,000 of personal income) -$0.06 20
Debt Service as a Share of Tax Revenue 8.4% 32
Public Employees Per 10,000 of Population (full-time equivalent)
520.7 22
State Liability System Survey(tort litigation treatment, judicial impartiality, etc.)
56.6 42
State Minimum Wage(federal floor is $7.25) $7.70 23
Average Workers’ Compensation Costs(per $100 of payroll) $1.92 31
Right-to-Work State?(option to join or support a union) No 50
Number of Tax Expenditure Limits(0=least/worst 3=most/best) 3 1
Economic Performance Rank
Economic Outlook Rank 24
Missouri2017 ALEC-LAFFER STATE ECONOMIC COMPETITIVENESS INDEX
Historical Ranking ComparisonECONOMIC OUTLOOK RANK
2010 2011 2012 2013 2014 2015 2016
15 9 7 23 24 27 24
41
-3%
-2%
-1%
0%
1%
2%
3%
4%
5%
6%
7%
-15
-10
-5
0
5
10
15
20
-6% -5% -4% -3% -2% -1% 0% 1% 2% 3%
27 Rich States, Poor States
’06 ’07 ’08 ’09 ’10 ’11 ’12 ’13 ’14 ’15
’06 ’07 ’08 ’09 ’10 ’11 ’12 ’13 ’14 ’15
Absolute Domestic MigrationCumulative 2006-2015
www.alec.org 83
Economic Performance Rank (1=best 50=worst)A backward-looking measure based on the state’s per-formance (equal-weighted average) in the three impor-tant performance variables shown below. These vari-ables are highly influenced by state policy.
Economic Outlook Rank (1=best 50=worst)A forward-looking forecast based on the state’s standing (equal-weighted average) in the 15 important state policy variables shown below. Data reflect state and local rates and revenues and any effect of federal deductibility.
’06 ’07 ’08 ’09 ’10 ’11 ’12 ’13 ’14 ’15
0
1
2
3
4
5
6
7
8 (in thousands)
State Gross Domestic ProductCumulative Growth 2005-2015
Non-Farm Payroll EmploymentCumulative Growth 2005-2015
Economic Performance Rank
MT
U.S.
MT
U.S.
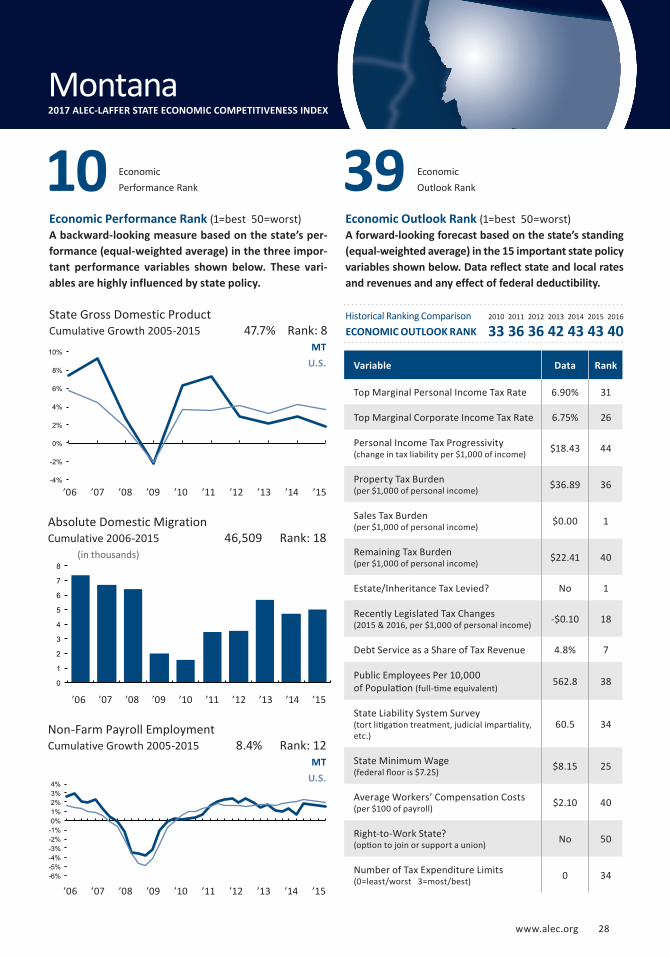
8.4% Rank: 12
46,509 Rank: 18
47.7% Rank: 8
Variable Data Rank
Top Marginal Personal Income Tax Rate 6.90% 31
Top Marginal Corporate Income Tax Rate 6.75% 26
Personal Income Tax Progressivity (change in tax liability per $1,000 of income) $18.43 44
Property Tax Burden(per $1,000 of personal income) $36.89 36
Sales Tax Burden(per $1,000 of personal income) $0.00 1
Remaining Tax Burden(per $1,000 of personal income) $22.41 40
Estate/Inheritance Tax Levied? No 1
Recently Legislated Tax Changes(2015 & 2016, per $1,000 of personal income) -$0.10 18
Debt Service as a Share of Tax Revenue 4.8% 7
Public Employees Per 10,000 of Population (full-time equivalent)
562.8 38
State Liability System Survey(tort litigation treatment, judicial impartiality, etc.)
60.5 34
State Minimum Wage(federal floor is $7.25) $8.15 25
Average Workers’ Compensation Costs(per $100 of payroll) $2.10 40
Right-to-Work State?(option to join or support a union) No 50
Number of Tax Expenditure Limits(0=least/worst 3=most/best) 0 34
10 Economic Outlook Rank 39
Montana2017 ALEC-LAFFER STATE ECONOMIC COMPETITIVENESS INDEX
Historical Ranking ComparisonECONOMIC OUTLOOK RANK
2010 2011 2012 2013 2014 2015 2016
33 36 36 42 43 43 40
-4%
-2%
0%
2%
4%
6%
8%
10%
-6% -5% -4% -3% -2% -1% 0% 1% 2% 3% 4%
www.alec.org 28
’06 ’07 ’08 ’09 ’10 ’11 ’12 ’13 ’14 ’15
Absolute Domestic MigrationCumulative 2006-2015
Economic Performance Rank (1=best 50=worst)A backward-looking measure based on the state’s per-formance (equal-weighted average) in the three impor-tant performance variables shown below. These vari-ables are highly influenced by state policy.
Economic Outlook Rank (1=best 50=worst)A forward-looking forecast based on the state’s standing (equal-weighted average) in the 15 important state policy variables shown below. Data reflect state and local rates and revenues and any effect of federal deductibility.
(in thousands)
’06 ’07 ’08 ’09 ’10 ’11 ’12 ’13 ’14 ’15
’06 ’07 ’08 ’09 ’10 ’11 ’12 ’13 ’14 ’15
State Gross Domestic ProductCumulative Growth 2005-2015
Non-Farm Payroll EmploymentCumulative Growth 2005-2015
NE
U.S.
NE
U.S.
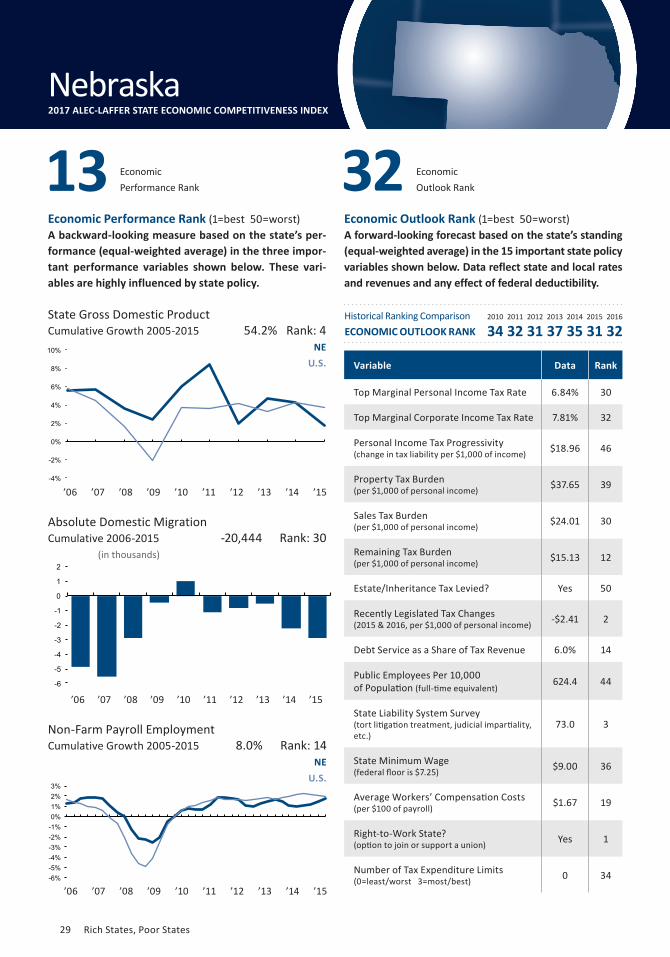
8.0% Rank: 14
-20,444 Rank: 30
54.2% Rank: 4
Variable Data Rank
Top Marginal Personal Income Tax Rate 6.84% 30
Top Marginal Corporate Income Tax Rate 7.81% 32
Personal Income Tax Progressivity (change in tax liability per $1,000 of income) $18.96 46
Property Tax Burden(per $1,000 of personal income) $37.65 39
Sales Tax Burden(per $1,000 of personal income) $24.01 30
Remaining Tax Burden(per $1,000 of personal income) $15.13 12
Estate/Inheritance Tax Levied? Yes 50
Recently Legislated Tax Changes(2015 & 2016, per $1,000 of personal income) -$2.41 2
Debt Service as a Share of Tax Revenue 6.0% 14
Public Employees Per 10,000 of Population (full-time equivalent)
624.4 44
State Liability System Survey(tort litigation treatment, judicial impartiality, etc.)
73.0 3
State Minimum Wage(federal floor is $7.25) $9.00 36
Average Workers’ Compensation Costs(per $100 of payroll) $1.67 19
Right-to-Work State?(option to join or support a union) Yes 1
Number of Tax Expenditure Limits(0=least/worst 3=most/best) 0 34
Economic Performance Rank 13 Economic
Outlook Rank 32
Nebraska2017 ALEC-LAFFER STATE ECONOMIC COMPETITIVENESS INDEX
Historical Ranking ComparisonECONOMIC OUTLOOK RANK
2010 2011 2012 2013 2014 2015 2016
34 32 31 37 35 31 32
-4%
-2%
0%
2%
4%
6%
8%
10%
-6
-5
-4
-3
-2
-1
0
1
2
-6% -5% -4% -3% -2% -1% 0% 1% 2% 3%
29 Rich States, Poor States
’06 ’07 ’08 ’09 ’10 ’11 ’12 ’13 ’14 ’15
’06 ’07 ’08 ’09 ’10 ’11 ’12 ’13 ’14 ’15
Absolute Domestic MigrationCumulative 2006-2015
www.alec.org 85
Economic Performance Rank (1=best 50=worst)A backward-looking measure based on the state’s per-formance (equal-weighted average) in the three impor-tant performance variables shown below. These vari-ables are highly influenced by state policy.
Economic Outlook Rank (1=best 50=worst)A forward-looking forecast based on the state’s standing (equal-weighted average) in the 15 important state policy variables shown below. Data reflect state and local rates and revenues and any effect of federal deductibility.
(in thousands)
’06 ’07 ’08 ’09 ’10 ’11 ’12 ’13 ’14 ’15
-20
-10
0
10
20
30
40
50
60
-8%
-6%
-4%
-2%
0%
2%
4%
6%
8%
10%
State Gross Domestic ProductCumulative Growth 2005-2015
Non-Farm Payroll EmploymentCumulative Growth 2005-2015
NV
U.S.
NV
U.S.
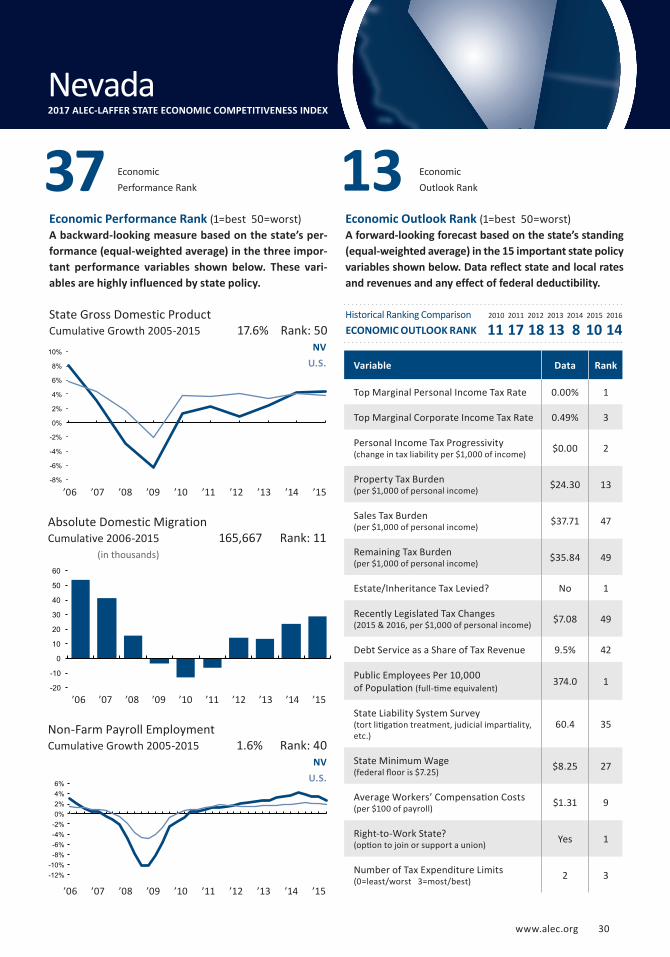
1.6% Rank: 40
165,667 Rank: 11
17.6% Rank: 50
Variable Data Rank
Top Marginal Personal Income Tax Rate 0.00% 1
Top Marginal Corporate Income Tax Rate 0.49% 3
Personal Income Tax Progressivity (change in tax liability per $1,000 of income) $0.00 2
Property Tax Burden(per $1,000 of personal income) $24.30 13
Sales Tax Burden(per $1,000 of personal income) $37.71 47
Remaining Tax Burden(per $1,000 of personal income) $35.84 49
Estate/Inheritance Tax Levied? No 1
Recently Legislated Tax Changes(2015 & 2016, per $1,000 of personal income) $7.08 49
Debt Service as a Share of Tax Revenue 9.5% 42
Public Employees Per 10,000 of Population (full-time equivalent)
374.0 1
State Liability System Survey(tort litigation treatment, judicial impartiality, etc.)
60.4 35
State Minimum Wage(federal floor is $7.25) $8.25 27
Average Workers’ Compensation Costs(per $100 of payroll) $1.31 9
Right-to-Work State?(option to join or support a union) Yes 1
Number of Tax Expenditure Limits(0=least/worst 3=most/best) 2 3
Economic Performance Rank 37 Economic
Outlook Rank 13
Nevada2017 ALEC-LAFFER STATE ECONOMIC COMPETITIVENESS INDEX
Historical Ranking ComparisonECONOMIC OUTLOOK RANK
2010 2011 2012 2013 2014 2015 2016
11 17 18 13 8 10 14
-12% -10%
-8% -6% -4% -2% 0% 2% 4% 6%
www.alec.org 30
’06 ’07 ’08 ’09 ’10 ’11 ’12 ’13 ’14 ’15
Economic Performance Rank (1=best 50=worst)A backward-looking measure based on the state’s per-formance (equal-weighted average) in the three impor-tant performance variables shown below. These vari-ables are highly influenced by state policy.
Economic Outlook Rank (1=best 50=worst)A forward-looking forecast based on the state’s standing (equal-weighted average) in the 15 important state policy variables shown below. Data reflect state and local rates and revenues and any effect of federal deductibility.
’06 ’07 ’08 ’09 ’10 ’11 ’12 ’13 ’14 ’15
’06 ’07 ’08 ’09 ’10 ’11 ’12 ’13 ’14 ’15 -4
-3
-2
-1
0
1
2
3
4
5
State Gross Domestic ProductCCumulative Growth 2005-2015
Absolute Domestic MigrationCumulative 2006-2015
(in thousands)
Non-Farm Payroll EmploymentCumulative Growth 2005-2015
NH
U.S.
NH
U.S.
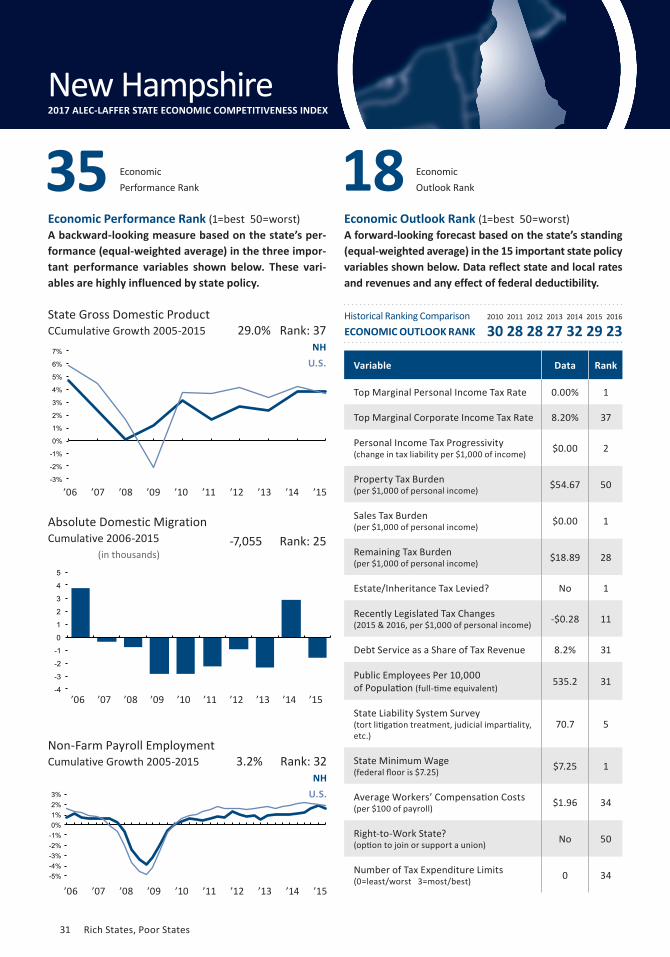
3.2% Rank: 32
-7,055 Rank: 25
29.0% Rank: 37
Variable Data Rank
Top Marginal Personal Income Tax Rate 0.00% 1
Top Marginal Corporate Income Tax Rate 8.20% 37
Personal Income Tax Progressivity (change in tax liability per $1,000 of income) $0.00 2
Property Tax Burden(per $1,000 of personal income) $54.67 50
Sales Tax Burden(per $1,000 of personal income) $0.00 1
Remaining Tax Burden(per $1,000 of personal income) $18.89 28
Estate/Inheritance Tax Levied? No 1
Recently Legislated Tax Changes(2015 & 2016, per $1,000 of personal income) -$0.28 11
Debt Service as a Share of Tax Revenue 8.2% 31
Public Employees Per 10,000 of Population (full-time equivalent)
535.2 31
State Liability System Survey(tort litigation treatment, judicial impartiality, etc.)
70.7 5
State Minimum Wage(federal floor is $7.25) $7.25 1
Average Workers’ Compensation Costs(per $100 of payroll) $1.96 34
Right-to-Work State?(option to join or support a union) No 50
Number of Tax Expenditure Limits(0=least/worst 3=most/best) 0 34
Economic Performance Rank 35 Economic
Outlook Rank 18
New Hampshire2017 ALEC-LAFFER STATE ECONOMIC COMPETITIVENESS INDEX
Historical Ranking ComparisonECONOMIC OUTLOOK RANK
2010 2011 2012 2013 2014 2015 2016
30 28 28 27 32 29 23
-3%
-2%
-1%
0%
1%
2%
3%
4%
5%
6%
7%
-5% -4% -3% -2% -1% 0% 1% 2% 3%
31 Rich States, Poor States
’06 ’07 ’08 ’09 ’10 ’11 ’12 ’13 ’14 ’15
www.alec.org 87
Economic Performance Rank (1=best 50=worst)A backward-looking measure based on the state’s per-formance (equal-weighted average) in the three impor-tant performance variables shown below. These vari-ables are highly influenced by state policy.
Economic Outlook Rank (1=best 50=worst)A forward-looking forecast based on the state’s standing (equal-weighted average) in the 15 important state policy variables shown below. Data reflect state and local rates and revenues and any effect of federal deductibility.
’06 ’07 ’08 ’09 ’10 ’11 ’12 ’13 ’14 ’15
’06 ’07 ’08 ’09 ’10 ’11 ’12 ’13 ’14 ’15
State Gross Domestic ProductCumulative Growth 2005-2015
Absolute Domestic MigrationCumulative 2006-2015
(in thousands)
Non-Farm Payroll EmploymentCumulative Growth 2005-2015
NJ
U.S.
NJ
U.S.
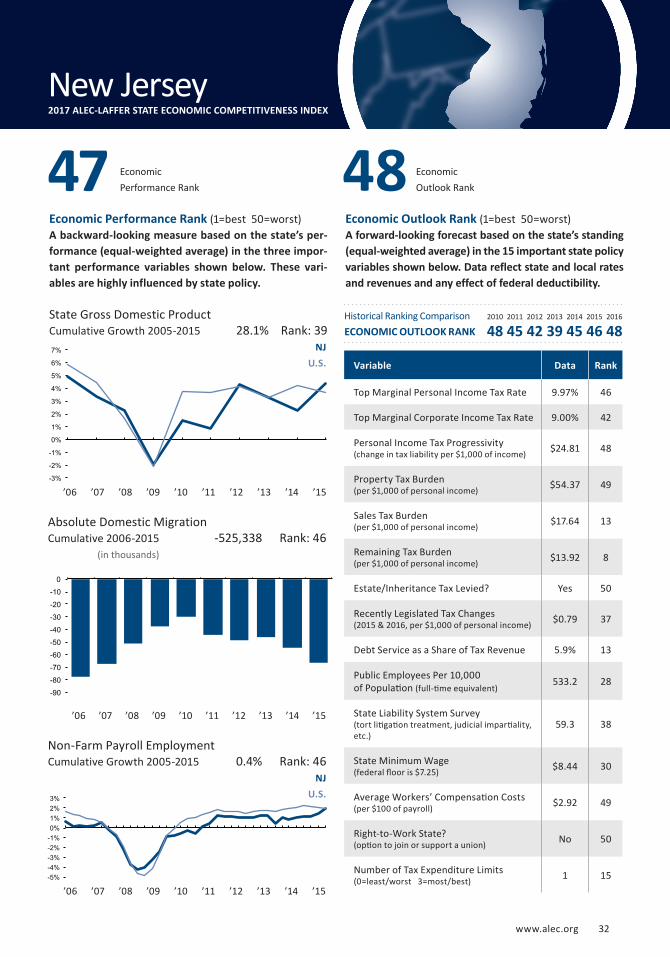
0.4% Rank: 46
-525,338 Rank: 46
28.1% Rank: 39
Variable Data Rank
Top Marginal Personal Income Tax Rate 9.97% 46
Top Marginal Corporate Income Tax Rate 9.00% 42
Personal Income Tax Progressivity (change in tax liability per $1,000 of income) $24.81 48
Property Tax Burden(per $1,000 of personal income) $54.37 49
Sales Tax Burden(per $1,000 of personal income) $17.64 13
Remaining Tax Burden(per $1,000 of personal income) $13.92 8
Estate/Inheritance Tax Levied? Yes 50
Recently Legislated Tax Changes(2015 & 2016, per $1,000 of personal income) $0.79 37
Debt Service as a Share of Tax Revenue 5.9% 13
Public Employees Per 10,000 of Population (full-time equivalent)
533.2 28
State Liability System Survey(tort litigation treatment, judicial impartiality, etc.)
59.3 38
State Minimum Wage(federal floor is $7.25) $8.44 30
Average Workers’ Compensation Costs(per $100 of payroll) $2.92 49
Right-to-Work State?(option to join or support a union) No 50
Number of Tax Expenditure Limits(0=least/worst 3=most/best) 1 15
Economic Performance Rank 47 Economic
Outlook Rank 48
New Jersey2017 ALEC-LAFFER STATE ECONOMIC COMPETITIVENESS INDEX
Historical Ranking ComparisonECONOMIC OUTLOOK RANK
2010 2011 2012 2013 2014 2015 2016
48 45 42 39 45 46 48
-3%
-2%
-1%
0%
1%
2%
3%
4%
5%
6%
7%
-90
-80
-70
-60
-50
-40
-30
-20
-10
0
-5% -4% -3% -2% -1% 0% 1% 2% 3%
www.alec.org 32
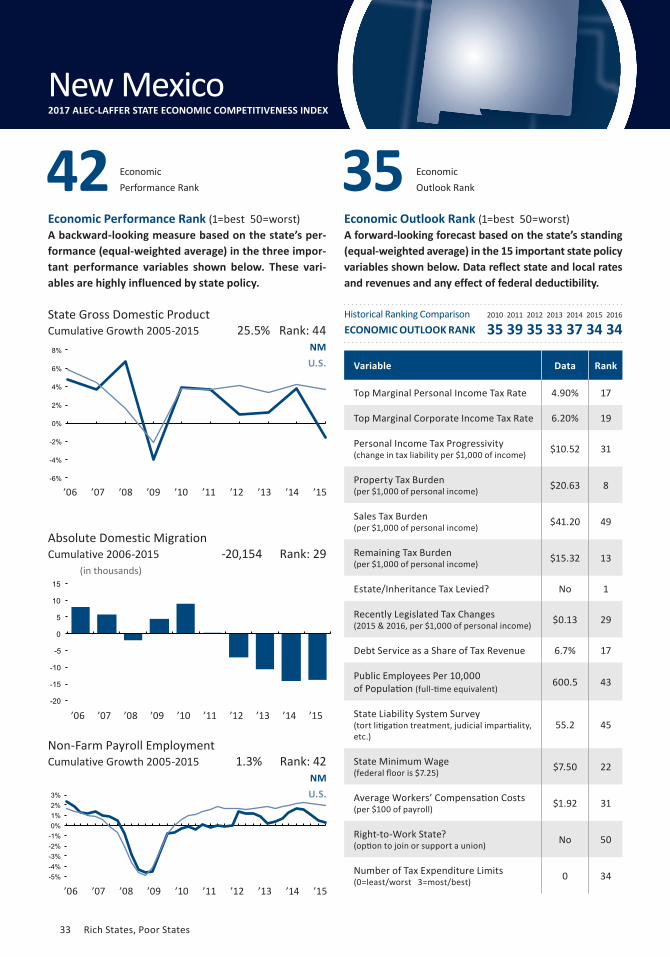
’06 ’07 ’08 ’09 ’10 ’11 ’12 ’13 ’14 ’15
Economic Performance Rank (1=best 50=worst)A backward-looking measure based on the state’s per-formance (equal-weighted average) in the three impor-tant performance variables shown below. These vari-ables are highly influenced by state policy.
Economic Outlook Rank (1=best 50=worst)A forward-looking forecast based on the state’s standing (equal-weighted average) in the 15 important state policy variables shown below. Data reflect state and local rates and revenues and any effect of federal deductibility.
’06 ’07 ’08 ’09 ’10 ’11 ’12 ’13 ’14 ’15
’06 ’07 ’08 ’09 ’10 ’11 ’12 ’13 ’14 ’15
State Gross Domestic ProductCumulative Growth 2005-2015
(in thousands)
Absolute Domestic MigrationCumulative 2006-2015
Non-Farm Payroll EmploymentCumulative Growth 2005-2015
NM
U.S.
NM
U.S.
1.3% Rank: 42
-20,154 Rank: 29
25.5% Rank: 44
Variable Data Rank
Top Marginal Personal Income Tax Rate 4.90% 17
Top Marginal Corporate Income Tax Rate 6.20% 19
Personal Income Tax Progressivity (change in tax liability per $1,000 of income) $10.52 31
Property Tax Burden(per $1,000 of personal income) $20.63 8
Sales Tax Burden(per $1,000 of personal income) $41.20 49
Remaining Tax Burden(per $1,000 of personal income) $15.32 13
Estate/Inheritance Tax Levied? No 1
Recently Legislated Tax Changes(2015 & 2016, per $1,000 of personal income) $0.13 29
Debt Service as a Share of Tax Revenue 6.7% 17
Public Employees Per 10,000 of Population (full-time equivalent)
600.5 43
State Liability System Survey(tort litigation treatment, judicial impartiality, etc.)
55.2 45
State Minimum Wage(federal floor is $7.25) $7.50 22
Average Workers’ Compensation Costs(per $100 of payroll) $1.92 31
Right-to-Work State?(option to join or support a union) No 50
Number of Tax Expenditure Limits(0=least/worst 3=most/best) 0 34
Economic Performance Rank 42 Economic
Outlook Rank 35
New Mexico2017 ALEC-LAFFER STATE ECONOMIC COMPETITIVENESS INDEX
Historical Ranking ComparisonECONOMIC OUTLOOK RANK
2010 2011 2012 2013 2014 2015 2016
35 39 35 33 37 34 34
-6%
-4%
-2%
0%
2%
4%
6%
8%
-20
-15
-10
-5
0
5
10
15
-5% -4% -3% -2% -1% 0% 1% 2% 3%
33 Rich States, Poor States
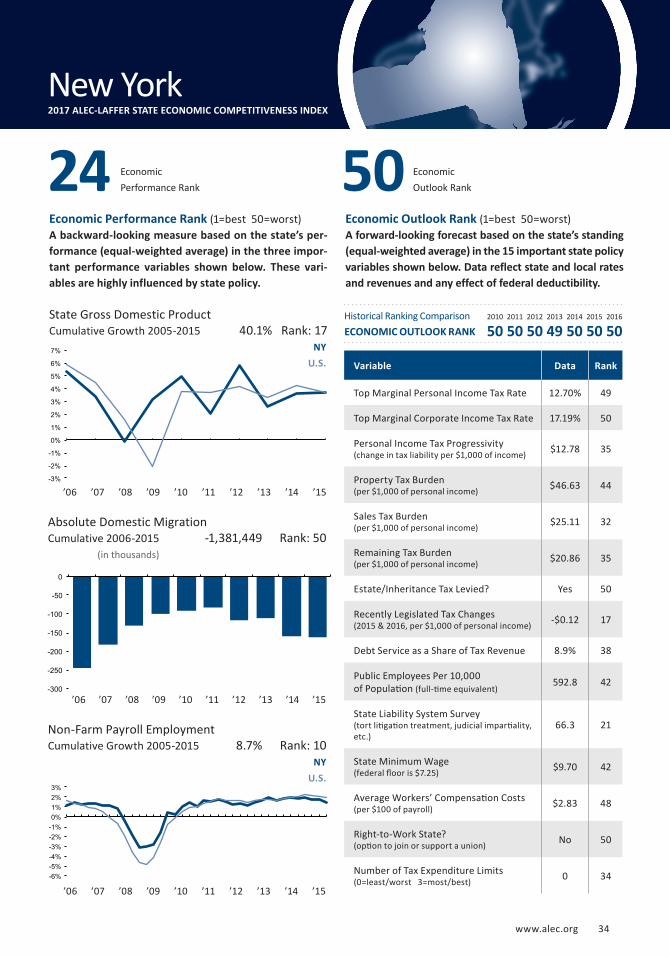
’06 ’07 ’08 ’09 ’10 ’11 ’12 ’13 ’14 ’15
’06 ’07 ’08 ’09 ’10 ’11 ’12 ’13 ’14 ’15
Absolute Domestic MigrationCumulative 2006-2015
www.alec.org 89
Economic Performance Rank (1=best 50=worst)A backward-looking measure based on the state’s per-formance (equal-weighted average) in the three impor-tant performance variables shown below. These vari-ables are highly influenced by state policy.
Economic Outlook Rank (1=best 50=worst)A forward-looking forecast based on the state’s standing (equal-weighted average) in the 15 important state policy variables shown below. Data reflect state and local rates and revenues and any effect of federal deductibility.
(in thousands)
’06 ’07 ’08 ’09 ’10 ’11 ’12 ’13 ’14 ’15
-300
-250
-200
-150
-100
-50
0
-3%
-2%
-1%
0%
1%
2%
3%
4%
5%
6%
7%
State Gross Domestic ProductCumulative Growth 2005-2015
Non-Farm Payroll EmploymentCumulative Growth 2005-2015
NY
U.S.
NY
U.S.
8.7% Rank: 10
-1,381,449 Rank: 50
40.1% Rank: 17
Variable Data Rank
Top Marginal Personal Income Tax Rate 12.70% 49
Top Marginal Corporate Income Tax Rate 17.19% 50
Personal Income Tax Progressivity (change in tax liability per $1,000 of income) $12.78 35
Property Tax Burden(per $1,000 of personal income) $46.63 44
Sales Tax Burden(per $1,000 of personal income) $25.11 32
Remaining Tax Burden(per $1,000 of personal income) $20.86 35
Estate/Inheritance Tax Levied? Yes 50
Recently Legislated Tax Changes(2015 & 2016, per $1,000 of personal income) -$0.12 17
Debt Service as a Share of Tax Revenue 8.9% 38
Public Employees Per 10,000 of Population (full-time equivalent)
592.8 42
State Liability System Survey(tort litigation treatment, judicial impartiality, etc.)
66.3 21
State Minimum Wage(federal floor is $7.25) $9.70 42
Average Workers’ Compensation Costs(per $100 of payroll) $2.83 48
Right-to-Work State?(option to join or support a union) No 50
Number of Tax Expenditure Limits(0=least/worst 3=most/best) 0 34
Economic Performance Rank 24 Economic
Outlook Rank 50
New York2017 ALEC-LAFFER STATE ECONOMIC COMPETITIVENESS INDEX
Historical Ranking ComparisonECONOMIC OUTLOOK RANK
2010 2011 2012 2013 2014 2015 2016
50 50 50 49 50 50 50
-6% -5% -4% -3% -2% -1% 0% 1% 2% 3%
www.alec.org 34
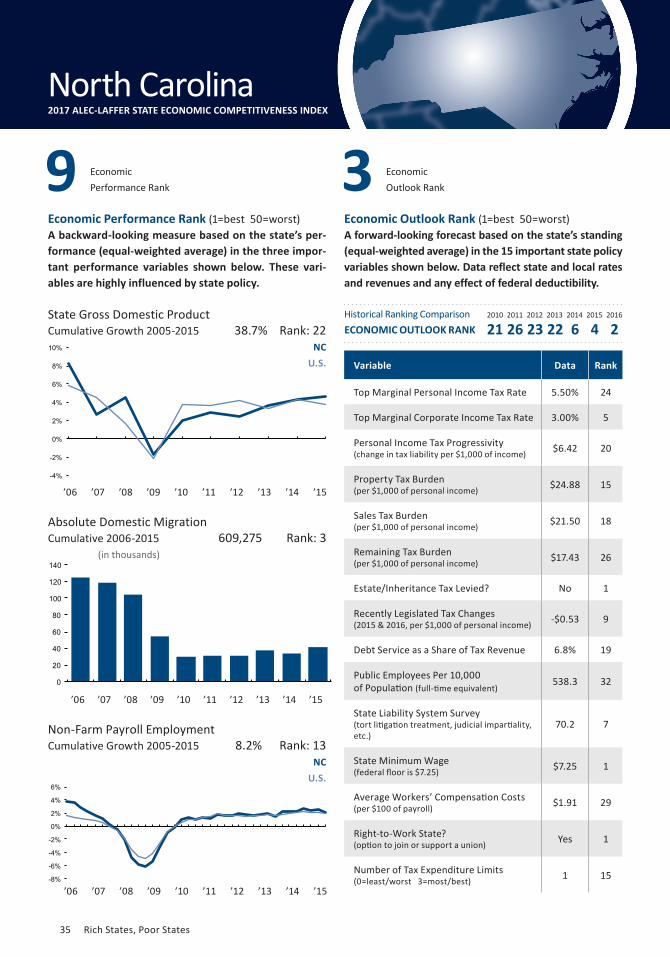
’06 ’07 ’08 ’09 ’10 ’11 ’12 ’13 ’14 ’15
Absolute Domestic MigrationCumulative 2006-2015
Economic Performance Rank (1=best 50=worst)A backward-looking measure based on the state’s per-formance (equal-weighted average) in the three impor-tant performance variables shown below. These vari-ables are highly influenced by state policy.
Economic Outlook Rank (1=best 50=worst)A forward-looking forecast based on the state’s standing (equal-weighted average) in the 15 important state policy variables shown below. Data reflect state and local rates and revenues and any effect of federal deductibility.
(in thousands)
’06 ’07 ’08 ’09 ’10 ’11 ’12 ’13 ’14 ’15
’06 ’07 ’08 ’09 ’10 ’11 ’12 ’13 ’14 ’15
-8%
-6%
-4%
-2%
0%
2%
4%
6%
State Gross Domestic ProductCumulative Growth 2005-2015
Non-Farm Payroll EmploymentCumulative Growth 2005-2015
NC
U.S.
NC
U.S.
8.2% Rank: 13
609,275 Rank: 3
38.7% Rank: 22
Variable Data Rank
Top Marginal Personal Income Tax Rate 5.50% 24
Top Marginal Corporate Income Tax Rate 3.00% 5
Personal Income Tax Progressivity (change in tax liability per $1,000 of income) $6.42 20
Property Tax Burden(per $1,000 of personal income) $24.88 15
Sales Tax Burden(per $1,000 of personal income) $21.50 18
Remaining Tax Burden(per $1,000 of personal income) $17.43 26
Estate/Inheritance Tax Levied? No 1
Recently Legislated Tax Changes(2015 & 2016, per $1,000 of personal income) -$0.53 9
Debt Service as a Share of Tax Revenue 6.8% 19
Public Employees Per 10,000 of Population (full-time equivalent)
538.3 32
State Liability System Survey(tort litigation treatment, judicial impartiality, etc.)
70.2 7
State Minimum Wage(federal floor is $7.25) $7.25 1
Average Workers’ Compensation Costs(per $100 of payroll) $1.91 29
Right-to-Work State?(option to join or support a union) Yes 1
Number of Tax Expenditure Limits(0=least/worst 3=most/best) 1 15
Economic Performance Rank 9 Economic
Outlook Rank 3
North Carolina2017 ALEC-LAFFER STATE ECONOMIC COMPETITIVENESS INDEX
Historical Ranking ComparisonECONOMIC OUTLOOK RANK
2010 2011 2012 2013 2014 2015 2016
21 26 23 22 6 4 2
-4%
-2%
0%
2%
4%
6%
8%
10%
0
20
40
60
80
100
120
140
35 Rich States, Poor States
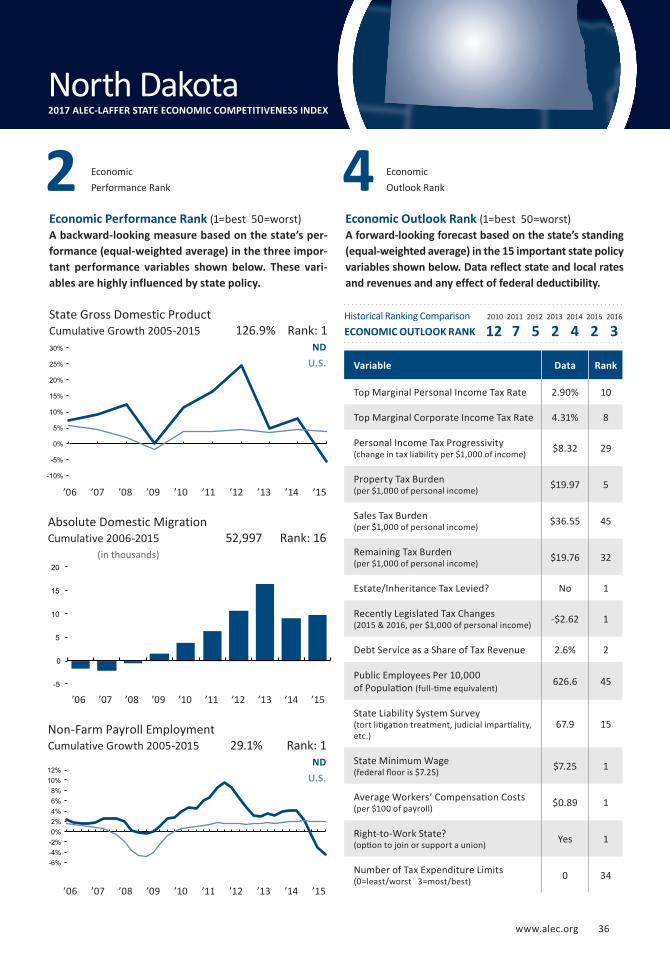
’06 ’07 ’08 ’09 ’10 ’11 ’12 ’13 ’14 ’15
www.alec.org 91
Economic Performance Rank (1=best 50=worst)A backward-looking measure based on the state’s per-formance (equal-weighted average) in the three impor-tant performance variables shown below. These vari-ables are highly influenced by state policy.
Economic Outlook Rank (1=best 50=worst)A forward-looking forecast based on the state’s standing (equal-weighted average) in the 15 important state policy variables shown below. Data reflect state and local rates and revenues and any effect of federal deductibility.
’06 ’07 ’08 ’09 ’10 ’11 ’12 ’13 ’14 ’15
’06 ’07 ’08 ’09 ’10 ’11 ’12 ’13 ’14 ’15 -5
0
5
10
15
20
-10%
-5%
0%
5%
10%
15%
20%
25%
30%
State Gross Domestic ProductCumulative Growth 2005-2015
(in thousands)
Absolute Domestic MigrationCumulative 2006-2015
Non-Farm Payroll EmploymentCumulative Growth 2005-2015
Economic Performance Rank
Economic Outlook Rank
ND
U.S.
ND
U.S.
29.1% Rank: 1
52,997 Rank: 16
126.9% Rank: 1
Variable Data Rank
Top Marginal Personal Income Tax Rate 2.90% 10
Top Marginal Corporate Income Tax Rate 4.31% 8
Personal Income Tax Progressivity (change in tax liability per $1,000 of income) $8.32 29
Property Tax Burden(per $1,000 of personal income) $19.97 5
Sales Tax Burden(per $1,000 of personal income) $36.55 45
Remaining Tax Burden(per $1,000 of personal income) $19.76 32
Estate/Inheritance Tax Levied? No 1
Recently Legislated Tax Changes(2015 & 2016, per $1,000 of personal income) -$2.62 1
Debt Service as a Share of Tax Revenue 2.6% 2
Public Employees Per 10,000 of Population (full-time equivalent)
626.6 45
State Liability System Survey(tort litigation treatment, judicial impartiality, etc.)
67.9 15
State Minimum Wage(federal floor is $7.25) $7.25 1
Average Workers’ Compensation Costs(per $100 of payroll) $0.89 1
Right-to-Work State?(option to join or support a union) Yes 1
Number of Tax Expenditure Limits(0=least/worst 3=most/best) 0 34
2 4
North Dakota2017 ALEC-LAFFER STATE ECONOMIC COMPETITIVENESS INDEX
Historical Ranking ComparisonECONOMIC OUTLOOK RANK
2010 2011 2012 2013 2014 2015 2016
12 7 5 2 4 2 3
-6% -4% -2% 0% 2% 4% 6% 8%
10% 12%
www.alec.org 36
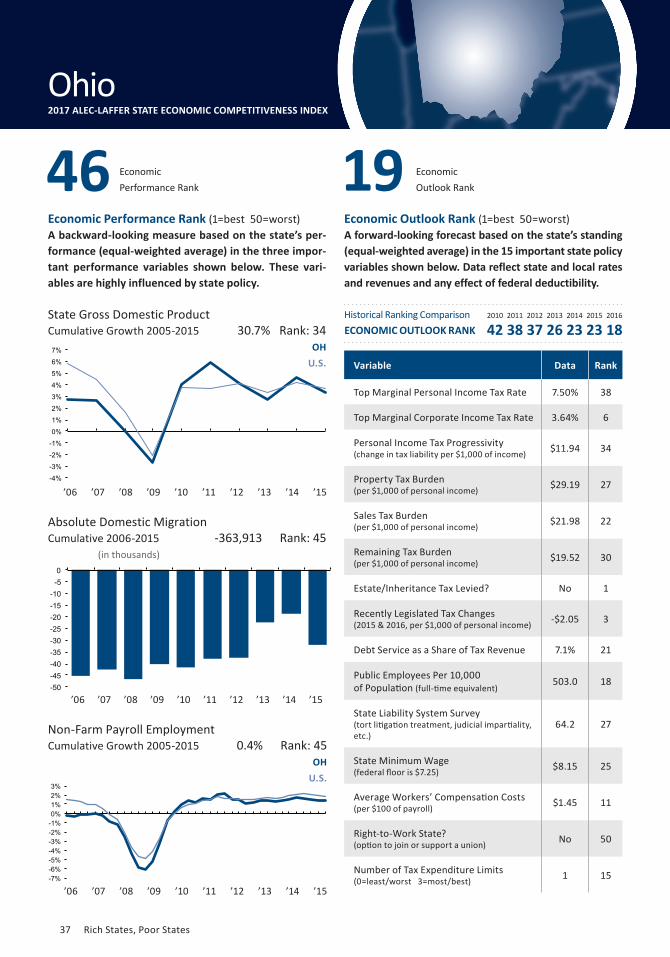
’06 ’07 ’08 ’09 ’10 ’11 ’12 ’13 ’14 ’15
Absolute Domestic MigrationCumulative 2006-2015
Economic Performance Rank (1=best 50=worst)A backward-looking measure based on the state’s per-formance (equal-weighted average) in the three impor-tant performance variables shown below. These vari-ables are highly influenced by state policy.
Economic Outlook Rank (1=best 50=worst)A forward-looking forecast based on the state’s standing (equal-weighted average) in the 15 important state policy variables shown below. Data reflect state and local rates and revenues and any effect of federal deductibility.
(in thousands)
’06 ’07 ’08 ’09 ’10 ’11 ’12 ’13 ’14 ’15
’06 ’07 ’08 ’09 ’10 ’11 ’12 ’13 ’14 ’15 -50 -45 -40 -35 -30 -25 -20 -15 -10
-5 0
-4%
-3%
-2%
-1%
0%
1%
2%
3%
4%
5%
6%
7%
State Gross Domestic ProductCumulative Growth 2005-2015
Non-Farm Payroll EmploymentCumulative Growth 2005-2015
OH
U.S.
OH
U.S.
0.4% Rank: 45
-363,913 Rank: 45
30.7% Rank: 34
Variable Data Rank
Top Marginal Personal Income Tax Rate 7.50% 38
Top Marginal Corporate Income Tax Rate 3.64% 6
Personal Income Tax Progressivity (change in tax liability per $1,000 of income) $11.94 34
Property Tax Burden(per $1,000 of personal income) $29.19 27
Sales Tax Burden(per $1,000 of personal income) $21.98 22
Remaining Tax Burden(per $1,000 of personal income) $19.52 30
Estate/Inheritance Tax Levied? No 1
Recently Legislated Tax Changes(2015 & 2016, per $1,000 of personal income) -$2.05 3
Debt Service as a Share of Tax Revenue 7.1% 21
Public Employees Per 10,000 of Population (full-time equivalent)
503.0 18
State Liability System Survey(tort litigation treatment, judicial impartiality, etc.)
64.2 27
State Minimum Wage(federal floor is $7.25) $8.15 25
Average Workers’ Compensation Costs(per $100 of payroll) $1.45 11
Right-to-Work State?(option to join or support a union) No 50
Number of Tax Expenditure Limits(0=least/worst 3=most/best) 1 15
Economic Performance Rank 46 Economic
Outlook Rank 19
Ohio2017 ALEC-LAFFER STATE ECONOMIC COMPETITIVENESS INDEX
Historical Ranking ComparisonECONOMIC OUTLOOK RANK
2010 2011 2012 2013 2014 2015 2016
42 38 37 26 23 23 18
-7% -6% -5% -4% -3% -2% -1% 0% 1% 2% 3%
37 Rich States, Poor States
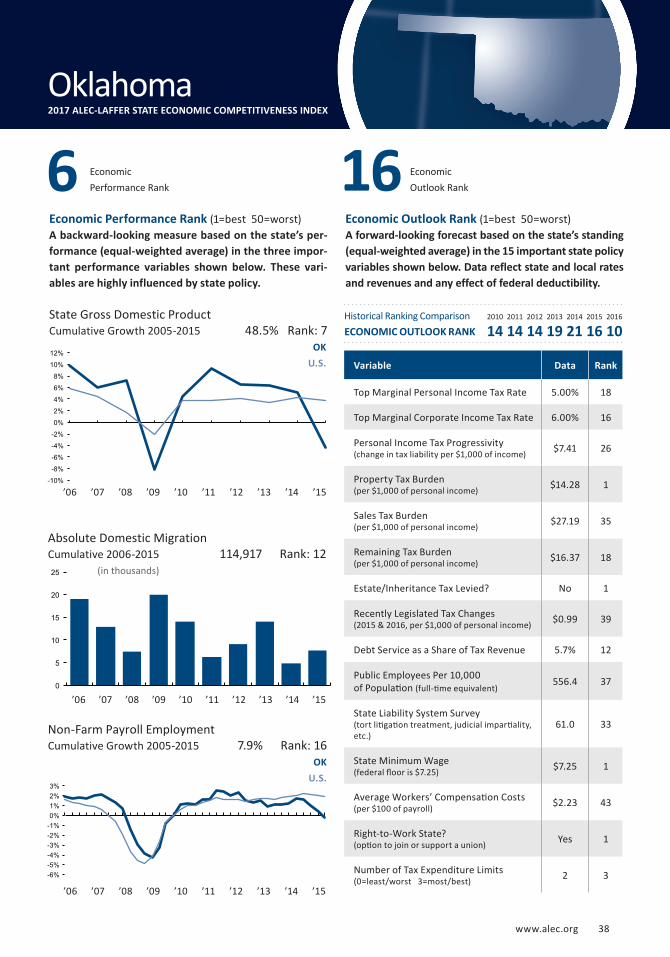
’06 ’07 ’08 ’09 ’10 ’11 ’12 ’13 ’14 ’15
’06 ’07 ’08 ’09 ’10 ’11 ’12 ’13 ’14 ’15
www.alec.org 93
Economic Performance Rank (1=best 50=worst)A backward-looking measure based on the state’s per-formance (equal-weighted average) in the three impor-tant performance variables shown below. These vari-ables are highly influenced by state policy.
Economic Outlook Rank (1=best 50=worst)A forward-looking forecast based on the state’s standing (equal-weighted average) in the 15 important state policy variables shown below. Data reflect state and local rates and revenues and any effect of federal deductibility.
’06 ’07 ’08 ’09 ’10 ’11 ’12 ’13 ’14 ’15
State Gross Domestic ProductCumulative Growth 2005-2015
(in thousands)
Absolute Domestic MigrationCumulative 2006-2015
Non-Farm Payroll EmploymentCumulative Growth 2005-2015
OK
U.S.
OK
U.S.
7.9% Rank: 16
114,917 Rank: 12
48.5% Rank: 7
Variable Data Rank
Top Marginal Personal Income Tax Rate 5.00% 18
Top Marginal Corporate Income Tax Rate 6.00% 16
Personal Income Tax Progressivity (change in tax liability per $1,000 of income) $7.41 26
Property Tax Burden(per $1,000 of personal income) $14.28 1
Sales Tax Burden(per $1,000 of personal income) $27.19 35
Remaining Tax Burden(per $1,000 of personal income) $16.37 18
Estate/Inheritance Tax Levied? No 1
Recently Legislated Tax Changes(2015 & 2016, per $1,000 of personal income) $0.99 39
Debt Service as a Share of Tax Revenue 5.7% 12
Public Employees Per 10,000 of Population (full-time equivalent)
556.4 37
State Liability System Survey(tort litigation treatment, judicial impartiality, etc.)
61.0 33
State Minimum Wage(federal floor is $7.25) $7.25 1
Average Workers’ Compensation Costs(per $100 of payroll) $2.23 43
Right-to-Work State?(option to join or support a union) Yes 1
Number of Tax Expenditure Limits(0=least/worst 3=most/best) 2 3
Economic Performance Rank 6 Economic
Outlook Rank 16
Oklahoma2017 ALEC-LAFFER STATE ECONOMIC COMPETITIVENESS INDEX
Historical Ranking ComparisonECONOMIC OUTLOOK RANK
2010 2011 2012 2013 2014 2015 2016
14 14 14 19 21 16 10
-10%
-8%
-6%
-4%
-2%
0%
2%
4%
6%
8%
10%
12%
0
5
10
15
20
25
-6% -5% -4% -3% -2% -1% 0% 1% 2% 3%
www.alec.org 38
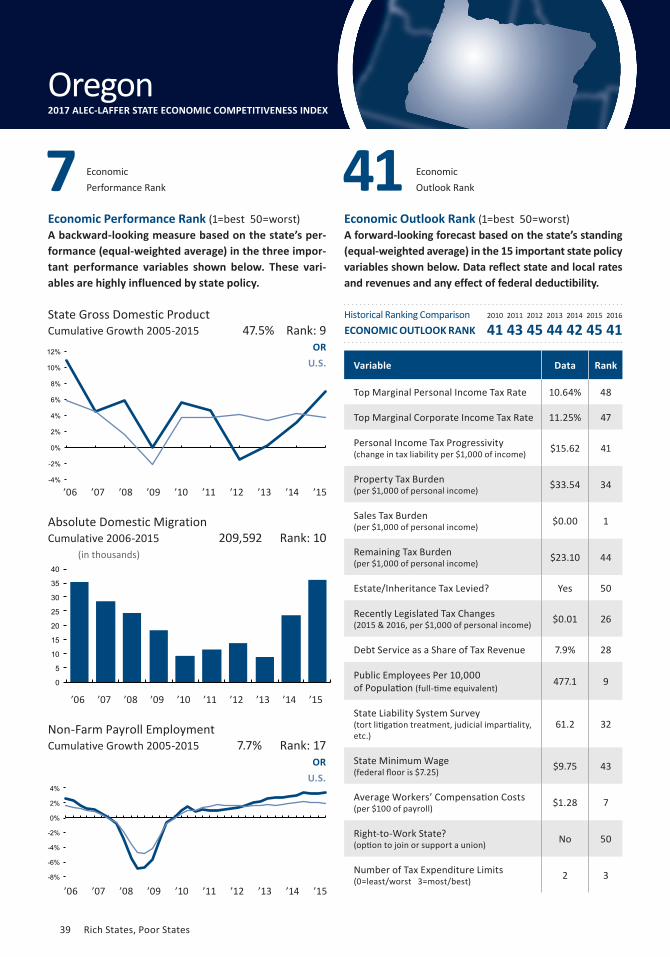
’06 ’07 ’08 ’09 ’10 ’11 ’12 ’13 ’14 ’15
Absolute Domestic MigrationCumulative 2006-2015
Economic Performance Rank (1=best 50=worst)A backward-looking measure based on the state’s per-formance (equal-weighted average) in the three impor-tant performance variables shown below. These vari-ables are highly influenced by state policy.
Economic Outlook Rank (1=best 50=worst)A forward-looking forecast based on the state’s standing (equal-weighted average) in the 15 important state policy variables shown below. Data reflect state and local rates and revenues and any effect of federal deductibility.
’06 ’07 ’08 ’09 ’10 ’11 ’12 ’13 ’14 ’15
’06 ’07 ’08 ’09 ’10 ’11 ’12 ’13 ’14 ’15
0
5
10
15
20
25
30
35
40
(in thousands)
State Gross Domestic ProductCumulative Growth 2005-2015
Non-Farm Payroll EmploymentCumulative Growth 2005-2015
OR
U.S.
OR
U.S.
7.7% Rank: 17
209,592 Rank: 10
47.5% Rank: 9
Variable Data Rank
Top Marginal Personal Income Tax Rate 10.64% 48
Top Marginal Corporate Income Tax Rate 11.25% 47
Personal Income Tax Progressivity (change in tax liability per $1,000 of income) $15.62 41
Property Tax Burden(per $1,000 of personal income) $33.54 34
Sales Tax Burden(per $1,000 of personal income) $0.00 1
Remaining Tax Burden(per $1,000 of personal income) $23.10 44
Estate/Inheritance Tax Levied? Yes 50
Recently Legislated Tax Changes(2015 & 2016, per $1,000 of personal income) $0.01 26
Debt Service as a Share of Tax Revenue 7.9% 28
Public Employees Per 10,000 of Population (full-time equivalent)
477.1 9
State Liability System Survey(tort litigation treatment, judicial impartiality, etc.)
61.2 32
State Minimum Wage(federal floor is $7.25) $9.75 43
Average Workers’ Compensation Costs(per $100 of payroll) $1.28 7
Right-to-Work State?(option to join or support a union) No 50
Number of Tax Expenditure Limits(0=least/worst 3=most/best) 2 3
Economic Performance Rank 7 Economic
Outlook Rank 41
Oregon2017 ALEC-LAFFER STATE ECONOMIC COMPETITIVENESS INDEX
Historical Ranking ComparisonECONOMIC OUTLOOK RANK
2010 2011 2012 2013 2014 2015 2016
41 43 45 44 42 45 41
-4%
-2%
0%
2%
4%
6%
8%
10%
12%
-8%
-6%
-4%
-2%
0%
2%
4%
39 Rich States, Poor States

’06 ’07 ’08 ’09 ’10 ’11 ’12 ’13 ’14 ’15
’06 ’07 ’08 ’09 ’10 ’11 ’12 ’13 ’14 ’15
www.alec.org 95
Economic Performance Rank (1=best 50=worst)A backward-looking measure based on the state’s per-formance (equal-weighted average) in the three impor-tant performance variables shown below. These vari-ables are highly influenced by state policy.
Economic Outlook Rank (1=best 50=worst)A forward-looking forecast based on the state’s standing (equal-weighted average) in the 15 important state policy variables shown below. Data reflect state and local rates and revenues and any effect of federal deductibility.
’06 ’07 ’08 ’09 ’10 ’11 ’12 ’13 ’14 ’15
-50
-40
-30
-20
-10
0
10
20
Absolute Domestic MigrationCumulative 2006-2015
(in thousands)
Non-Farm Payroll EmploymentCumulative Growth 2005-2015
PA
U.S.
PA
U.S.
2.5% Rank: 36
-127,785 Rank: 41
40.1% Rank: 16
Variable Data Rank
Top Marginal Personal Income Tax Rate 6.97% 33
Top Marginal Corporate Income Tax Rate 17.02% 49
Personal Income Tax Progressivity (change in tax liability per $1,000 of income) $0.00 2
Property Tax Burden(per $1,000 of personal income) $29.97 30
Sales Tax Burden(per $1,000 of personal income) $16.98 11
Remaining Tax Burden(per $1,000 of personal income) $22.82 42
Estate/Inheritance Tax Levied? Yes 50
Recently Legislated Tax Changes(2015 & 2016, per $1,000 of personal income) $0.82 38
Debt Service as a Share of Tax Revenue 7.5% 27
Public Employees Per 10,000 of Population (full-time equivalent)
443.4 5
State Liability System Survey(tort litigation treatment, judicial impartiality, etc.)
59.4 37
State Minimum Wage(federal floor is $7.25) $7.25 1
Average Workers’ Compensation Costs(per $100 of payroll) $1.84 25
Right-to-Work State?(option to join or support a union) No 50
Number of Tax Expenditure Limits(0=least/worst 3=most/best) 0 34
Economic Performance Rank 34 Economic
Outlook Rank 38
Pennsylvania2017 ALEC-LAFFER STATE ECONOMIC COMPETITIVENESS INDEX
State Gross Domestic ProductCumulative Growth 2005-2015
Historical Ranking ComparisonECONOMIC OUTLOOK RANK
2010 2011 2012 2013 2014 2015 2016
43 41 40 34 33 41 39
-3%
-2%
-1%
0%
1%
2%
3%
4%
5%
6%
7%
-6% -5% -4% -3% -2% -1% 0% 1% 2% 3%
www.alec.org 40
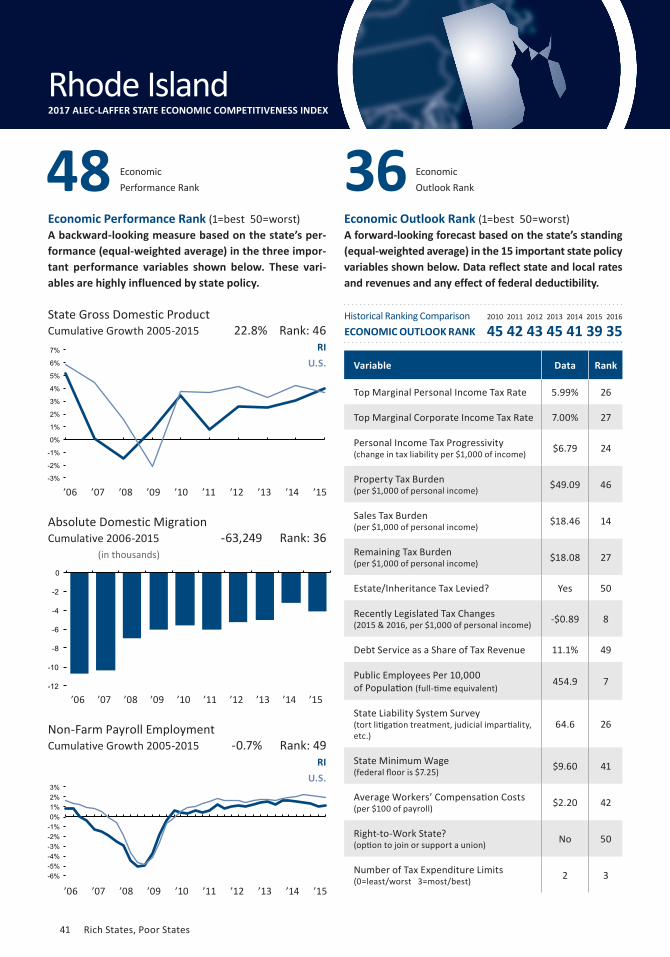
’06 ’07 ’08 ’09 ’10 ’11 ’12 ’13 ’14 ’15
Absolute Domestic MigrationCumulative 2006-2015
Economic Performance Rank (1=best 50=worst)A backward-looking measure based on the state’s per-formance (equal-weighted average) in the three impor-tant performance variables shown below. These vari-ables are highly influenced by state policy.
Economic Outlook Rank (1=best 50=worst)A forward-looking forecast based on the state’s standing (equal-weighted average) in the 15 important state policy variables shown below. Data reflect state and local rates and revenues and any effect of federal deductibility.
(in thousands)
’06 ’07 ’08 ’09 ’10 ’11 ’12 ’13 ’14 ’15
’06 ’07 ’08 ’09 ’10 ’11 ’12 ’13 ’14 ’15 -12
-10
-8
-6
-4
-2
0
State Gross Domestic ProductCumulative Growth 2005-2015
Non-Farm Payroll EmploymentCumulative Growth 2005-2015
RI
U.S.
RI
U.S.
-0.7% Rank: 49
-63,249 Rank: 36
22.8% Rank: 46
Variable Data Rank
Top Marginal Personal Income Tax Rate 5.99% 26
Top Marginal Corporate Income Tax Rate 7.00% 27
Personal Income Tax Progressivity (change in tax liability per $1,000 of income) $6.79 24
Property Tax Burden(per $1,000 of personal income) $49.09 46
Sales Tax Burden(per $1,000 of personal income) $18.46 14
Remaining Tax Burden(per $1,000 of personal income) $18.08 27
Estate/Inheritance Tax Levied? Yes 50
Recently Legislated Tax Changes(2015 & 2016, per $1,000 of personal income) -$0.89 8
Debt Service as a Share of Tax Revenue 11.1% 49
Public Employees Per 10,000 of Population (full-time equivalent)
454.9 7
State Liability System Survey(tort litigation treatment, judicial impartiality, etc.)
64.6 26
State Minimum Wage(federal floor is $7.25) $9.60 41
Average Workers’ Compensation Costs(per $100 of payroll) $2.20 42
Right-to-Work State?(option to join or support a union) No 50
Number of Tax Expenditure Limits(0=least/worst 3=most/best) 2 3
Economic Performance Rank 48 Economic
Outlook Rank 36
Rhode Island2017 ALEC-LAFFER STATE ECONOMIC COMPETITIVENESS INDEX
Historical Ranking ComparisonECONOMIC OUTLOOK RANK
2010 2011 2012 2013 2014 2015 2016
45 42 43 45 41 39 35
-3%
-2%
-1%
0%
1%
2%
3%
4%
5%
6%
7%
-6% -5% -4% -3% -2% -1% 0% 1% 2% 3%
41 Rich States, Poor States
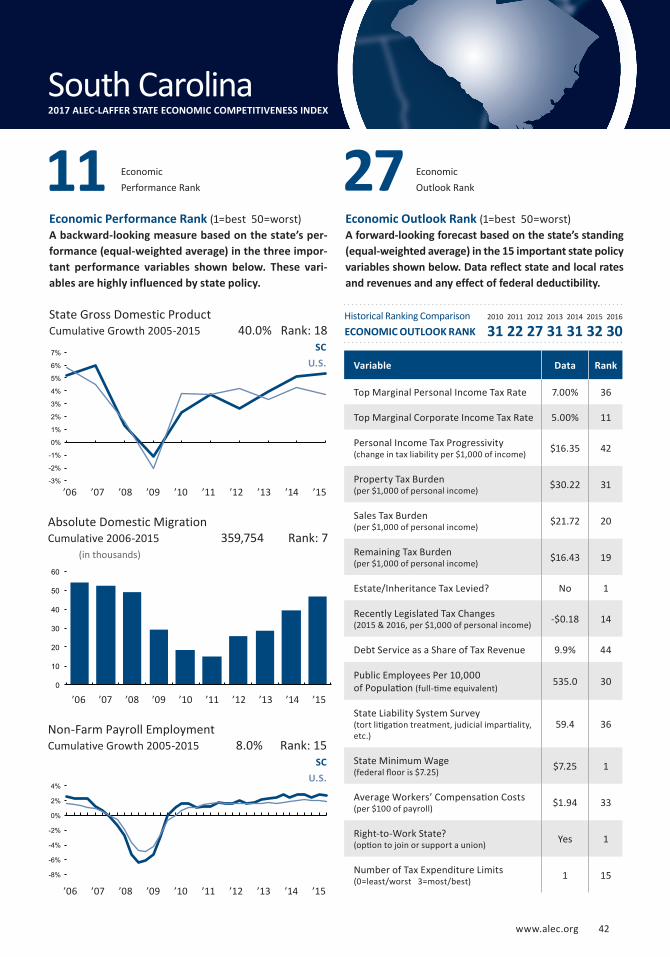
’06 ’07 ’08 ’09 ’10 ’11 ’12 ’13 ’14 ’15
’06 ’07 ’08 ’09 ’10 ’11 ’12 ’13 ’14 ’15
www.alec.org 97
Economic Performance Rank (1=best 50=worst)A backward-looking measure based on the state’s per-formance (equal-weighted average) in the three impor-tant performance variables shown below. These vari-ables are highly influenced by state policy.
Economic Outlook Rank (1=best 50=worst)A forward-looking forecast based on the state’s standing (equal-weighted average) in the 15 important state policy variables shown below. Data reflect state and local rates and revenues and any effect of federal deductibility.
’06 ’07 ’08 ’09 ’10 ’11 ’12 ’13 ’14 ’15
State Gross Domestic ProductCumulative Growth 2005-2015
Absolute Domestic MigrationCumulative 2006-2015
(in thousands)
Non-Farm Payroll EmploymentCumulative Growth 2005-2015
SC
U.S.
SC
U.S.
8.0% Rank: 15
359,754 Rank: 7
40.0% Rank: 18
Variable Data Rank
Top Marginal Personal Income Tax Rate 7.00% 36
Top Marginal Corporate Income Tax Rate 5.00% 11
Personal Income Tax Progressivity (change in tax liability per $1,000 of income) $16.35 42
Property Tax Burden(per $1,000 of personal income) $30.22 31
Sales Tax Burden(per $1,000 of personal income) $21.72 20
Remaining Tax Burden(per $1,000 of personal income) $16.43 19
Estate/Inheritance Tax Levied? No 1
Recently Legislated Tax Changes(2015 & 2016, per $1,000 of personal income) -$0.18 14
Debt Service as a Share of Tax Revenue 9.9% 44
Public Employees Per 10,000 of Population (full-time equivalent)
535.0 30
State Liability System Survey(tort litigation treatment, judicial impartiality, etc.)
59.4 36
State Minimum Wage(federal floor is $7.25) $7.25 1
Average Workers’ Compensation Costs(per $100 of payroll) $1.94 33
Right-to-Work State?(option to join or support a union) Yes 1
Number of Tax Expenditure Limits(0=least/worst 3=most/best) 1 15
Economic Performance Rank 11 Economic
Outlook Rank 27
South Carolina2017 ALEC-LAFFER STATE ECONOMIC COMPETITIVENESS INDEX
Historical Ranking ComparisonECONOMIC OUTLOOK RANK
2010 2011 2012 2013 2014 2015 2016
31 22 27 31 31 32 30
-3%
-2%
-1%
0%
1%
2%
3%
4%
5%
6%
7%
0
10
20
30
40
50
60
-8%
-6%
-4%
-2%
0%
2%
4%
www.alec.org 42
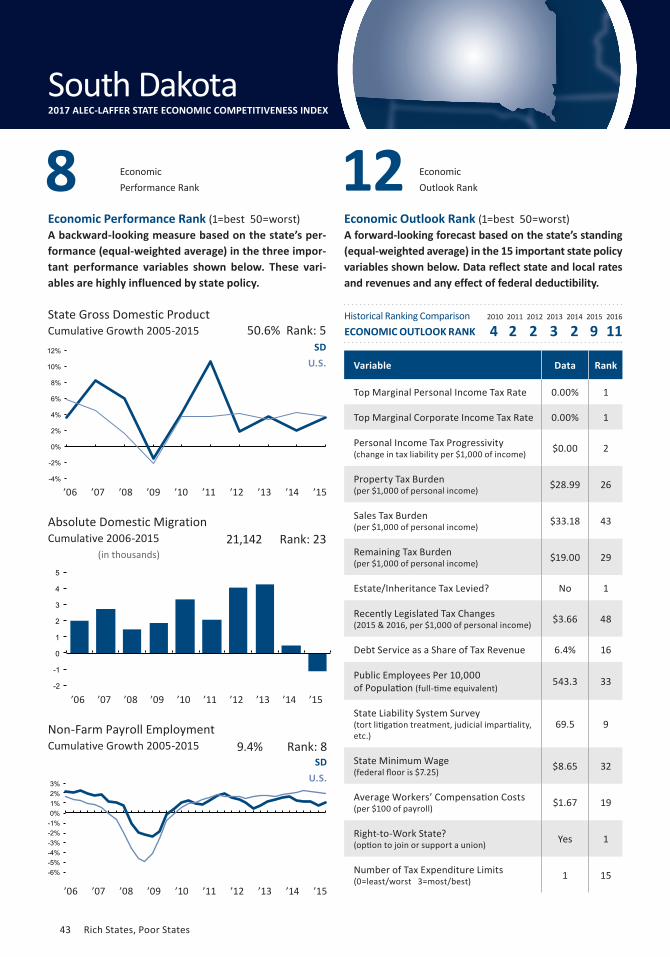
’06 ’07 ’08 ’09 ’10 ’11 ’12 ’13 ’14 ’15
Absolute Domestic MigrationCumulative 2006-2015
Economic Performance Rank (1=best 50=worst)A backward-looking measure based on the state’s per-formance (equal-weighted average) in the three impor-tant performance variables shown below. These vari-ables are highly influenced by state policy.
Economic Outlook Rank (1=best 50=worst)A forward-looking forecast based on the state’s standing (equal-weighted average) in the 15 important state policy variables shown below. Data reflect state and local rates and revenues and any effect of federal deductibility.
(in thousands)
’06 ’07 ’08 ’09 ’10 ’11 ’12 ’13 ’14 ’15
’06 ’07 ’08 ’09 ’10 ’11 ’12 ’13 ’14 ’15
-6% -5% -4% -3% -2% -1% 0% 1% 2% 3%
State Gross Domestic ProductCumulative Growth 2005-2015
Non-Farm Payroll EmploymentCumulative Growth 2005-2015
Economic Outlook Rank
SD
U.S.
SD
U.S.
9.4% Rank: 8
21,142 Rank: 23
50.6% Rank: 5
Variable Data Rank
Top Marginal Personal Income Tax Rate 0.00% 1
Top Marginal Corporate Income Tax Rate 0.00% 1
Personal Income Tax Progressivity (change in tax liability per $1,000 of income) $0.00 2
Property Tax Burden(per $1,000 of personal income) $28.99 26
Sales Tax Burden(per $1,000 of personal income) $33.18 43
Remaining Tax Burden(per $1,000 of personal income) $19.00 29
Estate/Inheritance Tax Levied? No 1
Recently Legislated Tax Changes(2015 & 2016, per $1,000 of personal income) $3.66 48
Debt Service as a Share of Tax Revenue 6.4% 16
Public Employees Per 10,000 of Population (full-time equivalent)
543.3 33
State Liability System Survey(tort litigation treatment, judicial impartiality, etc.)
69.5 9
State Minimum Wage(federal floor is $7.25) $8.65 32
Average Workers’ Compensation Costs(per $100 of payroll) $1.67 19
Right-to-Work State?(option to join or support a union) Yes 1
Number of Tax Expenditure Limits(0=least/worst 3=most/best) 1 15
Economic Performance Rank 8 12
South Dakota2017 ALEC-LAFFER STATE ECONOMIC COMPETITIVENESS INDEX
Historical Ranking ComparisonECONOMIC OUTLOOK RANK
2010 2011 2012 2013 2014 2015 2016
4 2 2 3 2 9 11
-4%
-2%
0%
2%
4%
6%
8%
10%
12%
-2
-1
0
1
2
3
4
5
43 Rich States, Poor States
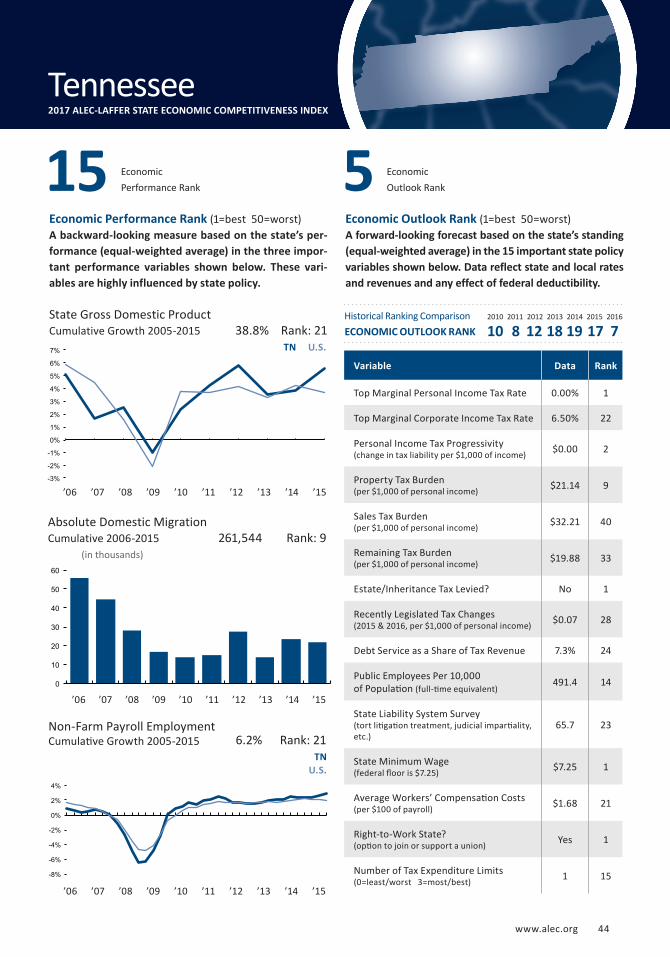
’06 ’07 ’08 ’09 ’10 ’11 ’12 ’13 ’14 ’15
’06 ’07 ’08 ’09 ’10 ’11 ’12 ’13 ’14 ’15
www.alec.org 99
Economic Performance Rank (1=best 50=worst)A backward-looking measure based on the state’s per-formance (equal-weighted average) in the three impor-tant performance variables shown below. These vari-ables are highly influenced by state policy.
Economic Outlook Rank (1=best 50=worst)A forward-looking forecast based on the state’s standing (equal-weighted average) in the 15 important state policy variables shown below. Data reflect state and local rates and revenues and any effect of federal deductibility.
’06 ’07 ’08 ’09 ’10 ’11 ’12 ’13 ’14 ’15
0
10
20
30
40
50
60
State Gross Domestic ProductCumulative Growth 2005-2015
Absolute Domestic MigrationCumulative 2006-2015
(in thousands)
Economic Outlook Rank
TNU.S.
TN U.S.
6.2% Rank: 21
261,544 Rank: 9
38.8% Rank: 21
Variable Data Rank
Top Marginal Personal Income Tax Rate 0.00% 1
Top Marginal Corporate Income Tax Rate 6.50% 22
Personal Income Tax Progressivity (change in tax liability per $1,000 of income) $0.00 2
Property Tax Burden(per $1,000 of personal income) $21.14 9
Sales Tax Burden(per $1,000 of personal income) $32.21 40
Remaining Tax Burden(per $1,000 of personal income) $19.88 33
Estate/Inheritance Tax Levied? No 1
Recently Legislated Tax Changes(2015 & 2016, per $1,000 of personal income) $0.07 28
Debt Service as a Share of Tax Revenue 7.3% 24
Public Employees Per 10,000 of Population (full-time equivalent)
491.4 14
State Liability System Survey(tort litigation treatment, judicial impartiality, etc.)
65.7 23
State Minimum Wage(federal floor is $7.25) $7.25 1
Average Workers’ Compensation Costs(per $100 of payroll) $1.68 21
Right-to-Work State?(option to join or support a union) Yes 1
Number of Tax Expenditure Limits(0=least/worst 3=most/best) 1 15
Economic Performance Rank 15 5
Tennessee2017 ALEC-LAFFER STATE ECONOMIC COMPETITIVENESS INDEX
Historical Ranking ComparisonECONOMIC OUTLOOK RANK
2010 2011 2012 2013 2014 2015 2016
10 8 12 18 19 17 7
Non-Farm Payroll EmploymentCumulative Growth 2005-2015
-3%
-2%
-1%
0%
1%
2%
3%
4%
5%
6%
7%
-8%
-6%
-4%
-2%
0%
2%
4%
www.alec.org 44
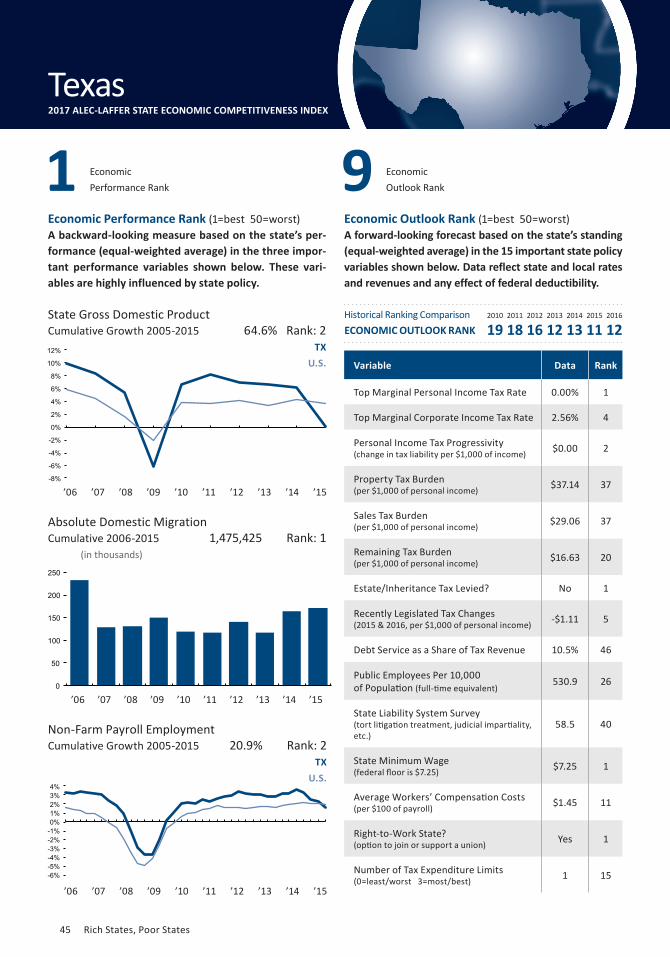
’06 ’07 ’08 ’09 ’10 ’11 ’12 ’13 ’14 ’15
Absolute Domestic MigrationCumulative 2006-2015
Economic Performance Rank (1=best 50=worst)A backward-looking measure based on the state’s per-formance (equal-weighted average) in the three impor-tant performance variables shown below. These vari-ables are highly influenced by state policy.
Economic Outlook Rank (1=best 50=worst)A forward-looking forecast based on the state’s standing (equal-weighted average) in the 15 important state policy variables shown below. Data reflect state and local rates and revenues and any effect of federal deductibility.
’06 ’07 ’08 ’09 ’10 ’11 ’12 ’13 ’14 ’15
’06 ’07 ’08 ’09 ’10 ’11 ’12 ’13 ’14 ’15
(in thousands)
State Gross Domestic ProductCumulative Growth 2005-2015
Non-Farm Payroll EmploymentCumulative Growth 2005-2015
TX
U.S.
TX
U.S.
20.9% Rank: 2
1,475,425 Rank: 1
64.6% Rank: 2
Variable Data Rank
Top Marginal Personal Income Tax Rate 0.00% 1
Top Marginal Corporate Income Tax Rate 2.56% 4
Personal Income Tax Progressivity (change in tax liability per $1,000 of income) $0.00 2
Property Tax Burden(per $1,000 of personal income) $37.14 37
Sales Tax Burden(per $1,000 of personal income) $29.06 37
Remaining Tax Burden(per $1,000 of personal income) $16.63 20
Estate/Inheritance Tax Levied? No 1
Recently Legislated Tax Changes(2015 & 2016, per $1,000 of personal income) -$1.11 5
Debt Service as a Share of Tax Revenue 10.5% 46
Public Employees Per 10,000 of Population (full-time equivalent)
530.9 26
State Liability System Survey(tort litigation treatment, judicial impartiality, etc.)
58.5 40
State Minimum Wage(federal floor is $7.25) $7.25 1
Average Workers’ Compensation Costs(per $100 of payroll) $1.45 11
Right-to-Work State?(option to join or support a union) Yes 1
Number of Tax Expenditure Limits(0=least/worst 3=most/best) 1 15
Economic Outlook Rank 9Economic
Performance Rank 1
Texas2017 ALEC-LAFFER STATE ECONOMIC COMPETITIVENESS INDEX
Historical Ranking ComparisonECONOMIC OUTLOOK RANK
2010 2011 2012 2013 2014 2015 2016
19 18 16 12 13 11 12
-8%
-6%
-4%
-2%
0%
2%
4%
6%
8%
10%
12%
0
50
100
150
200
250
-6% -5% -4% -3% -2% -1% 0% 1% 2% 3% 4%
45 Rich States, Poor States
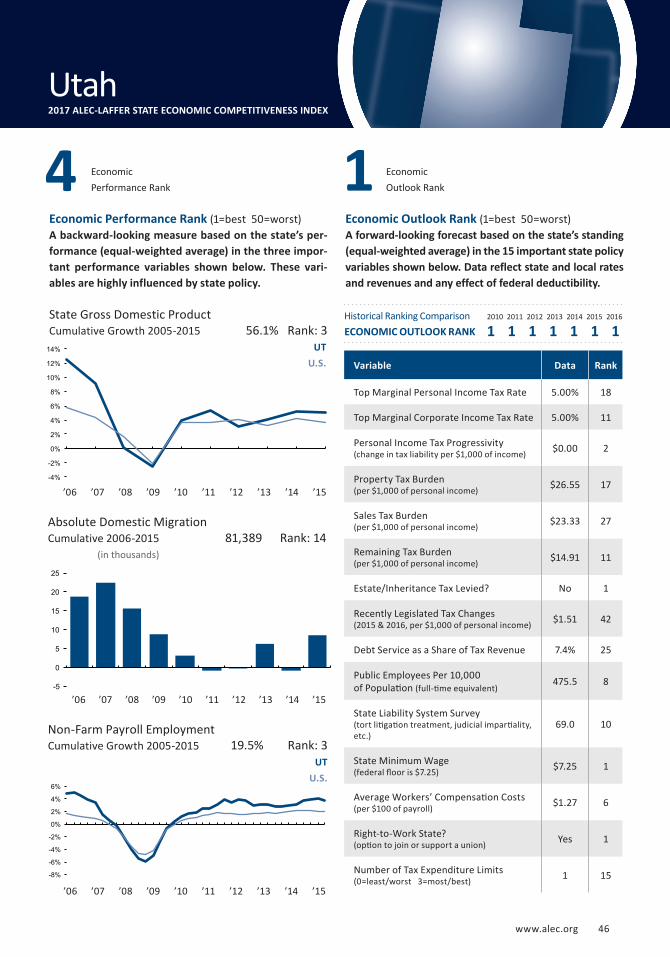
’06 ’07 ’08 ’09 ’10 ’11 ’12 ’13 ’14 ’15
’06 ’07 ’08 ’09 ’10 ’11 ’12 ’13 ’14 ’15
Absolute Domestic MigrationCumulative 2006-2015
www.alec.org 101
Economic Performance Rank (1=best 50=worst)A backward-looking measure based on the state’s per-formance (equal-weighted average) in the three impor-tant performance variables shown below. These vari-ables are highly influenced by state policy.
Economic Outlook Rank (1=best 50=worst)A forward-looking forecast based on the state’s standing (equal-weighted average) in the 15 important state policy variables shown below. Data reflect state and local rates and revenues and any effect of federal deductibility.
(in thousands)
’06 ’07 ’08 ’09 ’10 ’11 ’12 ’13 ’14 ’15
-5
0
5
10
15
20
25
State Gross Domestic ProductCumulative Growth 2005-2015
Economic Outlook Rank
Non-Farm Payroll EmploymentCumulative Growth 2005-2015
UT
U.S.
UT
U.S.
19.5% Rank: 3
81,389 Rank: 14
56.1% Rank: 3
Variable Data Rank
Top Marginal Personal Income Tax Rate 5.00% 18
Top Marginal Corporate Income Tax Rate 5.00% 11
Personal Income Tax Progressivity (change in tax liability per $1,000 of income) $0.00 2
Property Tax Burden(per $1,000 of personal income) $26.55 17
Sales Tax Burden(per $1,000 of personal income) $23.33 27
Remaining Tax Burden(per $1,000 of personal income) $14.91 11
Estate/Inheritance Tax Levied? No 1
Recently Legislated Tax Changes(2015 & 2016, per $1,000 of personal income) $1.51 42
Debt Service as a Share of Tax Revenue 7.4% 25
Public Employees Per 10,000 of Population (full-time equivalent)
475.5 8
State Liability System Survey(tort litigation treatment, judicial impartiality, etc.)
69.0 10
State Minimum Wage(federal floor is $7.25) $7.25 1
Average Workers’ Compensation Costs(per $100 of payroll) $1.27 6
Right-to-Work State?(option to join or support a union) Yes 1
Number of Tax Expenditure Limits(0=least/worst 3=most/best) 1 15
Economic Performance Rank 4 1
Utah2017 ALEC-LAFFER STATE ECONOMIC COMPETITIVENESS INDEX
Historical Ranking ComparisonECONOMIC OUTLOOK RANK
2010 2011 2012 2013 2014 2015 2016
1 1 1 1 1 1 1
-4%
-2%
0%
2%
4%
6%
8%
10%
12%
14%
-8%
-6%
-4%
-2%
0%
2%
4%
6%
www.alec.org 46
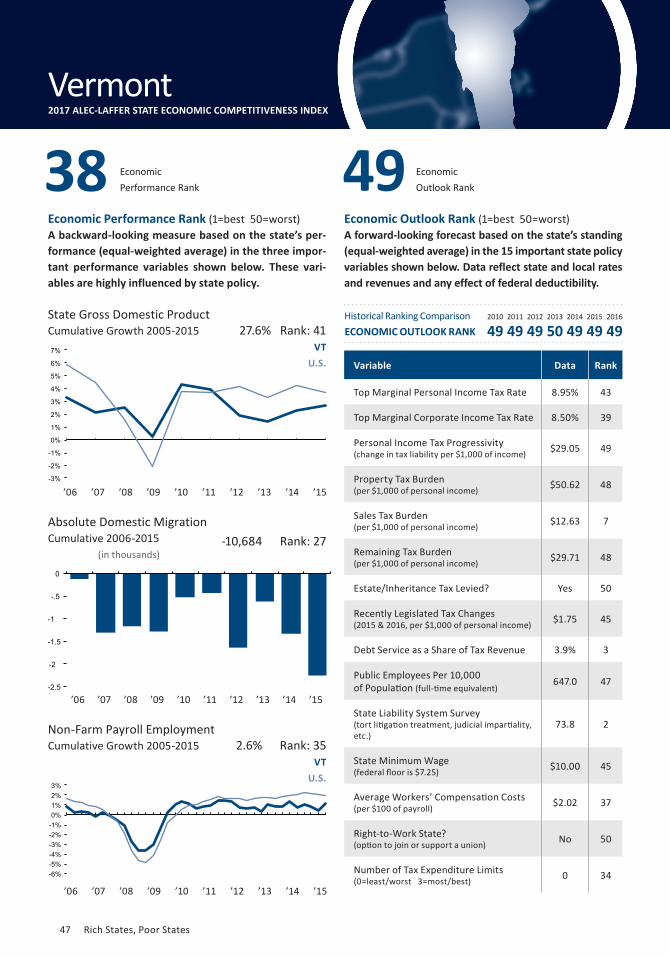
’06 ’07 ’08 ’09 ’10 ’11 ’12 ’13 ’14 ’15
Economic Performance Rank (1=best 50=worst)A backward-looking measure based on the state’s per-formance (equal-weighted average) in the three impor-tant performance variables shown below. These vari-ables are highly influenced by state policy.
Economic Outlook Rank (1=best 50=worst)A forward-looking forecast based on the state’s standing (equal-weighted average) in the 15 important state policy variables shown below. Data reflect state and local rates and revenues and any effect of federal deductibility.
’06 ’07 ’08 ’09 ’10 ’11 ’12 ’13 ’14 ’15
’06 ’07 ’08 ’09 ’10 ’11 ’12 ’13 ’14 ’15 -2.5
-2
-1.5
-1
-.5
0
State Gross Domestic ProductCumulative Growth 2005-2015
Absolute Domestic MigrationCumulative 2006-2015
(in thousands)
Non-Farm Payroll EmploymentCumulative Growth 2005-2015
VT
U.S.
VT
U.S.
2.6% Rank: 35
-10,684 Rank: 27
27.6% Rank: 41
Variable Data Rank
Top Marginal Personal Income Tax Rate 8.95% 43
Top Marginal Corporate Income Tax Rate 8.50% 39
Personal Income Tax Progressivity (change in tax liability per $1,000 of income) $29.05 49
Property Tax Burden(per $1,000 of personal income) $50.62 48
Sales Tax Burden(per $1,000 of personal income) $12.63 7
Remaining Tax Burden(per $1,000 of personal income) $29.71 48
Estate/Inheritance Tax Levied? Yes 50
Recently Legislated Tax Changes(2015 & 2016, per $1,000 of personal income) $1.75 45
Debt Service as a Share of Tax Revenue 3.9% 3
Public Employees Per 10,000 of Population (full-time equivalent)
647.0 47
State Liability System Survey(tort litigation treatment, judicial impartiality, etc.)
73.8 2
State Minimum Wage(federal floor is $7.25) $10.00 45
Average Workers’ Compensation Costs(per $100 of payroll) $2.02 37
Right-to-Work State?(option to join or support a union) No 50
Number of Tax Expenditure Limits(0=least/worst 3=most/best) 0 34
Economic Performance Rank 38 Economic
Outlook Rank 49
Vermont2017 ALEC-LAFFER STATE ECONOMIC COMPETITIVENESS INDEX
Historical Ranking ComparisonECONOMIC OUTLOOK RANK
2010 2011 2012 2013 2014 2015 2016
49 49 49 50 49 49 49
-3%
-2%
-1%
0%
1%
2%
3%
4%
5%
6%
7%
-6% -5% -4% -3% -2% -1% 0% 1% 2% 3%
47 Rich States, Poor States
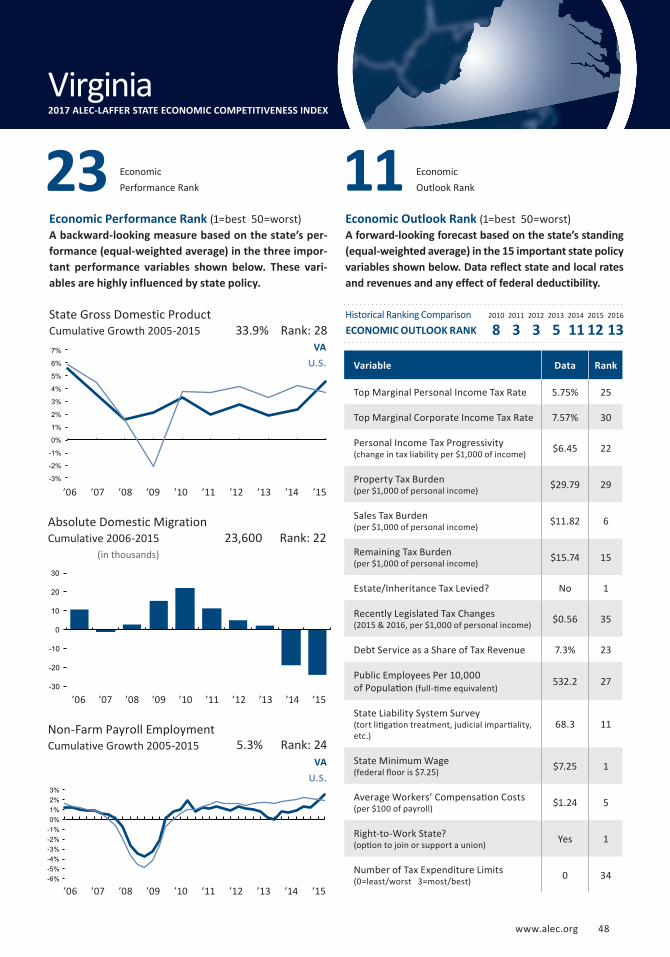
’06 ’07 ’08 ’09 ’10 ’11 ’12 ’13 ’14 ’15
’06 ’07 ’08 ’09 ’10 ’11 ’12 ’13 ’14 ’15
Absolute Domestic MigrationCumulative 2006-2015
www.alec.org 103
Economic Performance Rank (1=best 50=worst)A backward-looking measure based on the state’s per-formance (equal-weighted average) in the three impor-tant performance variables shown below. These vari-ables are highly influenced by state policy.
Economic Outlook Rank (1=best 50=worst)A forward-looking forecast based on the state’s standing (equal-weighted average) in the 15 important state policy variables shown below. Data reflect state and local rates and revenues and any effect of federal deductibility.
(in thousands)
’06 ’07 ’08 ’09 ’10 ’11 ’12 ’13 ’14 ’15
State Gross Domestic ProductCumulative Growth 2005-2015
Non-Farm Payroll EmploymentCumulative Growth 2005-2015
Economic Performance Rank
Economic Outlook Rank
VA
U.S.
VA
U.S.
5.3% Rank: 24
23,600 Rank: 22
33.9% Rank: 28
Variable Data Rank
Top Marginal Personal Income Tax Rate 5.75% 25
Top Marginal Corporate Income Tax Rate 7.57% 30
Personal Income Tax Progressivity (change in tax liability per $1,000 of income) $6.45 22
Property Tax Burden(per $1,000 of personal income) $29.79 29
Sales Tax Burden(per $1,000 of personal income) $11.82 6
Remaining Tax Burden(per $1,000 of personal income) $15.74 15
Estate/Inheritance Tax Levied? No 1
Recently Legislated Tax Changes(2015 & 2016, per $1,000 of personal income) $0.56 35
Debt Service as a Share of Tax Revenue 7.3% 23
Public Employees Per 10,000 of Population (full-time equivalent)
532.2 27
State Liability System Survey(tort litigation treatment, judicial impartiality, etc.)
68.3 11
State Minimum Wage(federal floor is $7.25) $7.25 1
Average Workers’ Compensation Costs(per $100 of payroll) $1.24 5
Right-to-Work State?(option to join or support a union) Yes 1
Number of Tax Expenditure Limits(0=least/worst 3=most/best) 0 34
23 11
Virginia2017 ALEC-LAFFER STATE ECONOMIC COMPETITIVENESS INDEX
Historical Ranking ComparisonECONOMIC OUTLOOK RANK
2010 2011 2012 2013 2014 2015 2016
8 3 3 5 11 12 13
-3%
-2%
-1%
0%
1%
2%
3%
4%
5%
6%
7%
-30
-20
-10
0
10
20
30
-6% -5% -4% -3% -2% -1% 0% 1% 2% 3%
www.alec.org 48
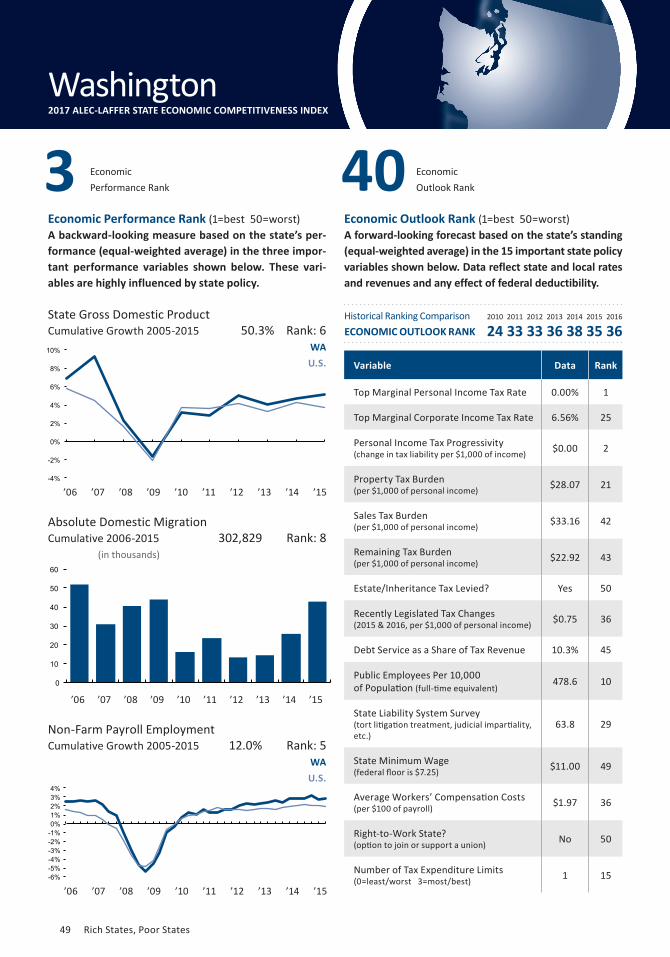
’06 ’07 ’08 ’09 ’10 ’11 ’12 ’13 ’14 ’15
Absolute Domestic MigrationCumulative 2006-2015
Economic Performance Rank (1=best 50=worst)A backward-looking measure based on the state’s per-formance (equal-weighted average) in the three impor-tant performance variables shown below. These vari-ables are highly influenced by state policy.
Economic Outlook Rank (1=best 50=worst)A forward-looking forecast based on the state’s standing (equal-weighted average) in the 15 important state policy variables shown below. Data reflect state and local rates and revenues and any effect of federal deductibility.
(in thousands)
’06 ’07 ’08 ’09 ’10 ’11 ’12 ’13 ’14 ’15
’06 ’07 ’08 ’09 ’10 ’11 ’12 ’13 ’14 ’15
-6% -5% -4% -3% -2% -1% 0% 1% 2% 3% 4%
0
10
20
30
40
50
60
State Gross Domestic ProductCumulative Growth 2005-2015
Non-Farm Payroll EmploymentCumulative Growth 2005-2015
WA
U.S.
WA
U.S.
12.0% Rank: 5
302,829 Rank: 8
50.3% Rank: 6
Variable Data Rank
Top Marginal Personal Income Tax Rate 0.00% 1
Top Marginal Corporate Income Tax Rate 6.56% 25
Personal Income Tax Progressivity (change in tax liability per $1,000 of income) $0.00 2
Property Tax Burden(per $1,000 of personal income) $28.07 21
Sales Tax Burden(per $1,000 of personal income) $33.16 42
Remaining Tax Burden(per $1,000 of personal income) $22.92 43
Estate/Inheritance Tax Levied? Yes 50
Recently Legislated Tax Changes(2015 & 2016, per $1,000 of personal income) $0.75 36
Debt Service as a Share of Tax Revenue 10.3% 45
Public Employees Per 10,000 of Population (full-time equivalent)
478.6 10
State Liability System Survey(tort litigation treatment, judicial impartiality, etc.)
63.8 29
State Minimum Wage(federal floor is $7.25) $11.00 49
Average Workers’ Compensation Costs(per $100 of payroll) $1.97 36
Right-to-Work State?(option to join or support a union) No 50
Number of Tax Expenditure Limits(0=least/worst 3=most/best) 1 15
Economic Performance Rank 3 Economic
Outlook Rank 40
Washington2017 ALEC-LAFFER STATE ECONOMIC COMPETITIVENESS INDEX
Historical Ranking ComparisonECONOMIC OUTLOOK RANK
2010 2011 2012 2013 2014 2015 2016
24 33 33 36 38 35 36
-4%
-2%
0%
2%
4%
6%
8%
10%
49 Rich States, Poor States
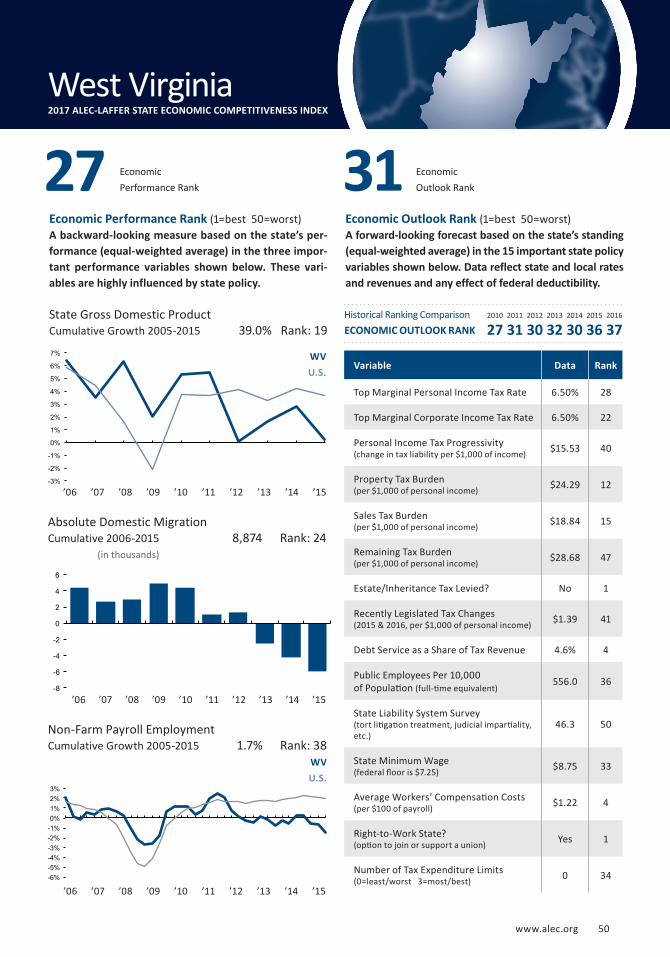
’06 ’07 ’08 ’09 ’10 ’11 ’12 ’13 ’14 ’15
’06 ’07 ’08 ’09 ’10 ’11 ’12 ’13 ’14 ’15
Absolute Domestic MigrationCumulative 2006-2015
www.alec.org 105
Economic Performance Rank (1=best 50=worst)A backward-looking measure based on the state’s per-formance (equal-weighted average) in the three impor-tant performance variables shown below. These vari-ables are highly influenced by state policy.
Economic Outlook Rank (1=best 50=worst)A forward-looking forecast based on the state’s standing (equal-weighted average) in the 15 important state policy variables shown below. Data reflect state and local rates and revenues and any effect of federal deductibility.
(in thousands)
’06 ’07 ’08 ’09 ’10 ’11 ’12 ’13 ’14 ’15
-6% -5% -4% -3% -2% -1% 0% 1% 2% 3%
-8
-6
-4
-2
0
2
4
6
State Gross Domestic ProductCumulative Growth 2005-2015
Non-Farm Payroll EmploymentCumulative Growth 2005-2015
WV
U.S.
WV
U.S.
1.7% Rank: 38
8,874 Rank: 24
39.0% Rank: 19
Variable Data Rank
Top Marginal Personal Income Tax Rate 6.50% 28
Top Marginal Corporate Income Tax Rate 6.50% 22
Personal Income Tax Progressivity (change in tax liability per $1,000 of income) $15.53 40
Property Tax Burden(per $1,000 of personal income) $24.29 12
Sales Tax Burden(per $1,000 of personal income) $18.84 15
Remaining Tax Burden(per $1,000 of personal income) $28.68 47
Estate/Inheritance Tax Levied? No 1
Recently Legislated Tax Changes(2015 & 2016, per $1,000 of personal income) $1.39 41
Debt Service as a Share of Tax Revenue 4.6% 4
Public Employees Per 10,000 of Population (full-time equivalent)
556.0 36
State Liability System Survey(tort litigation treatment, judicial impartiality, etc.)
46.3 50
State Minimum Wage(federal floor is $7.25) $8.75 33
Average Workers’ Compensation Costs(per $100 of payroll) $1.22 4
Right-to-Work State?(option to join or support a union) Yes 1
Number of Tax Expenditure Limits(0=least/worst 3=most/best) 0 34
Economic Performance Rank 27 Economic
Outlook Rank 31
West Virginia2017 ALEC-LAFFER STATE ECONOMIC COMPETITIVENESS INDEX
Historical Ranking ComparisonECONOMIC OUTLOOK RANK
2010 2011 2012 2013 2014 2015 2016
27 31 30 32 30 36 37
-3%
-2%
-1%
0%
1%
2%
3%
4%
5%
6%
7%
www.alec.org 50
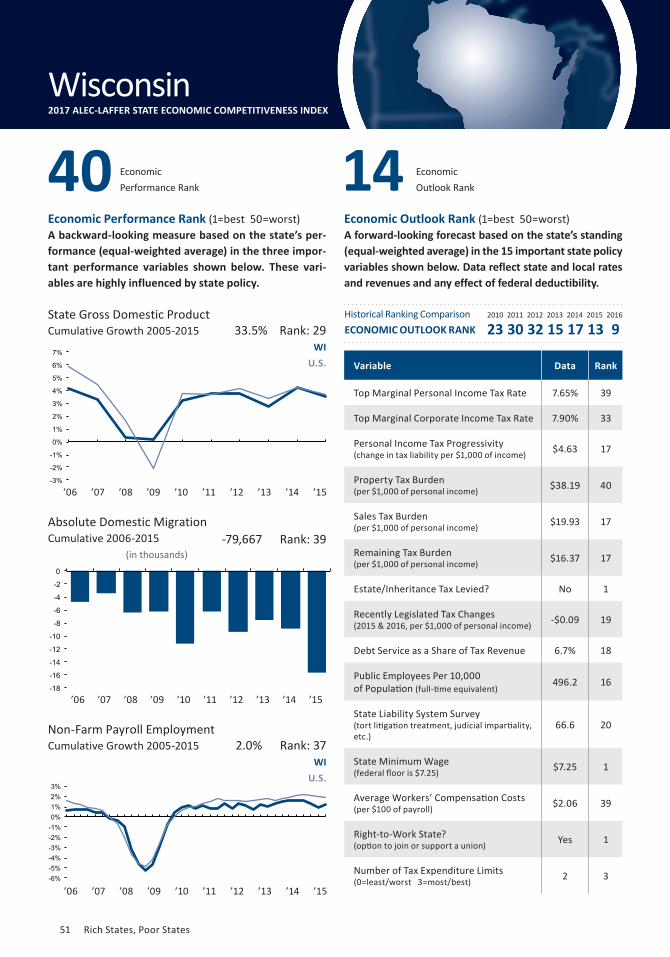
’06 ’07 ’08 ’09 ’10 ’11 ’12 ’13 ’14 ’15
Economic Performance Rank (1=best 50=worst)A backward-looking measure based on the state’s per-formance (equal-weighted average) in the three impor-tant performance variables shown below. These vari-ables are highly influenced by state policy.
Economic Outlook Rank (1=best 50=worst)A forward-looking forecast based on the state’s standing (equal-weighted average) in the 15 important state policy variables shown below. Data reflect state and local rates and revenues and any effect of federal deductibility.
’06 ’07 ’08 ’09 ’10 ’11 ’12 ’13 ’14 ’15
’06 ’07 ’08 ’09 ’10 ’11 ’12 ’13 ’14 ’15 -18
-16
-14
-12
-10
-8
-6
-4
-2
0
State Gross Domestic ProductCumulative Growth 2005-2015
Absolute Domestic MigrationCumulative 2006-2015
(in thousands)
Non-Farm Payroll EmploymentCumulative Growth 2005-2015
WI
U.S.
-79,667 Rank: 39
33.5% Rank: 29
Variable Data Rank
Top Marginal Personal Income Tax Rate 7.65% 39
Top Marginal Corporate Income Tax Rate 7.90% 33
Personal Income Tax Progressivity (change in tax liability per $1,000 of income) $4.63 17
Property Tax Burden(per $1,000 of personal income) $38.19 40
Sales Tax Burden(per $1,000 of personal income) $19.93 17
Remaining Tax Burden(per $1,000 of personal income) $16.37 17
Estate/Inheritance Tax Levied? No 1
Recently Legislated Tax Changes(2015 & 2016, per $1,000 of personal income) -$0.09 19
Debt Service as a Share of Tax Revenue 6.7% 18
Public Employees Per 10,000 of Population (full-time equivalent)
496.2 16
State Liability System Survey(tort litigation treatment, judicial impartiality, etc.)
66.6 20
State Minimum Wage(federal floor is $7.25) $7.25 1
Average Workers’ Compensation Costs(per $100 of payroll) $2.06 39
Right-to-Work State?(option to join or support a union) Yes 1
Number of Tax Expenditure Limits(0=least/worst 3=most/best) 2 3
Economic Performance Rank 40 Economic
Outlook Rank 14
WI
U.S.
2.0% Rank: 37
Wisconsin2017 ALEC-LAFFER STATE ECONOMIC COMPETITIVENESS INDEX
Historical Ranking ComparisonECONOMIC OUTLOOK RANK
2010 2011 2012 2013 2014 2015 2016
23 30 32 15 17 13 9
106 Rich States, Poor States
-3%
-2%
-1%
0%
1%
2%
3%
4%
5%
6%
7%
-6% -5% -4% -3% -2% -1% 0% 1% 2% 3%
51 Rich States, Poor States
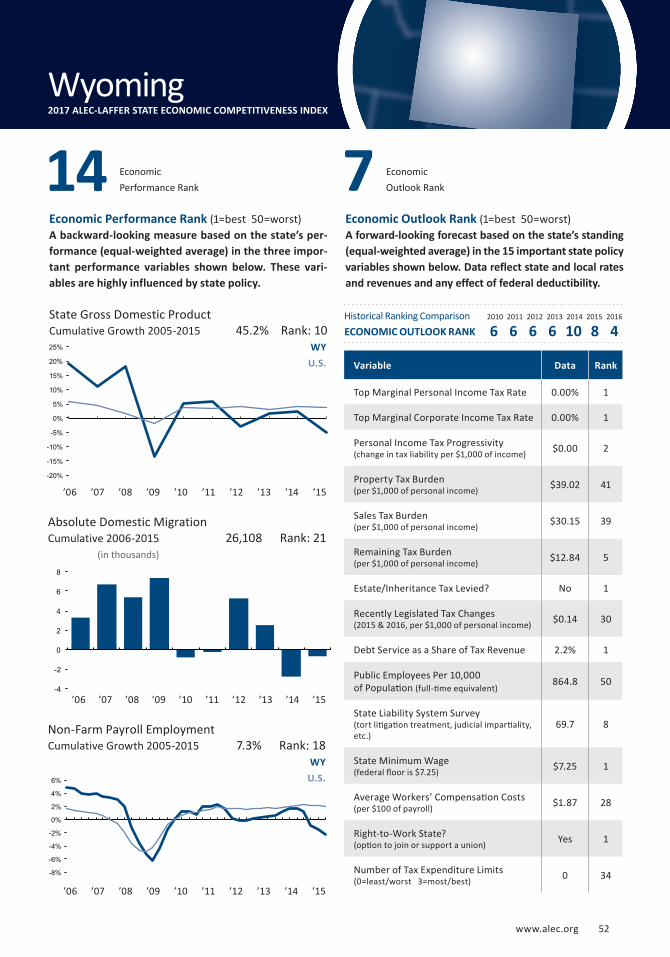
’06 ’07 ’08 ’09 ’10 ’11 ’12 ’13 ’14 ’15
’06 ’07 ’08 ’09 ’10 ’11 ’12 ’13 ’14 ’15
www.alec.org 107
Economic Performance Rank (1=best 50=worst)A backward-looking measure based on the state’s per-formance (equal-weighted average) in the three impor-tant performance variables shown below. These vari-ables are highly influenced by state policy.
Economic Outlook Rank (1=best 50=worst)A forward-looking forecast based on the state’s standing (equal-weighted average) in the 15 important state policy variables shown below. Data reflect state and local rates and revenues and any effect of federal deductibility.
’06 ’07 ’08 ’09 ’10 ’11 ’12 ’13 ’14 ’15
-20%
-15%
-10%
-5%
0%
5%
10%
15%
20%
25%
State Gross Domestic ProductCumulative Growth 2005-2015
Absolute Domestic MigrationCumulative 2006-2015
(in thousands)
14
Non-Farm Payroll EmploymentCumulative Growth 2005-2015
WY
U.S.
7.3% Rank: 18
Economic Performance Rank
Economic Outlook Rank
WY
U.S.
26,108 Rank: 21
45.2% Rank: 10
Variable Data Rank
Top Marginal Personal Income Tax Rate 0.00% 1
Top Marginal Corporate Income Tax Rate 0.00% 1
Personal Income Tax Progressivity (change in tax liability per $1,000 of income) $0.00 2
Property Tax Burden(per $1,000 of personal income) $39.02 41
Sales Tax Burden(per $1,000 of personal income) $30.15 39
Remaining Tax Burden(per $1,000 of personal income) $12.84 5
Estate/Inheritance Tax Levied? No 1
Recently Legislated Tax Changes(2015 & 2016, per $1,000 of personal income) $0.14 30
Debt Service as a Share of Tax Revenue 2.2% 1
Public Employees Per 10,000 of Population (full-time equivalent)
864.8 50
State Liability System Survey(tort litigation treatment, judicial impartiality, etc.)
69.7 8
State Minimum Wage(federal floor is $7.25) $7.25 1
Average Workers’ Compensation Costs(per $100 of payroll) $1.87 28
Right-to-Work State?(option to join or support a union) Yes 1
Number of Tax Expenditure Limits(0=least/worst 3=most/best) 0 34
7
Wyoming2017 ALEC-LAFFER STATE ECONOMIC COMPETITIVENESS INDEX
Historical Ranking ComparisonECONOMIC OUTLOOK RANK
2010 2011 2012 2013 2014 2015 2016
6 6 6 6 10 8 4
www.alec.org 107
-4
-2
0
2
4
6
8
-8%
-6%
-4%
-2%
0%
2%
4%
6%
www.alec.org 52
Appendix2017 ALEC-Laffer State Economic Competitiveness Index: Economic Outlook Methodology
I
APPENDIX
HIGHEST MARGINAL PERSONAL INCOME TAX RATE This ranking includes local taxes, if any, and any impact of federal deductibility, if allowed. A state’s largest city was used as a proxy for local tax rates. Data were drawn from Tax Analysts, Federation of Tax Administrators and individual state tax return forms. Tax rates are as of January 1, 2017.
HIGHEST MARGINAL CORPORATE INCOME TAX RATE This variable includes local taxes, if any, and in-cludes the effect of federal deductibility, if al-lowed. A state’s largest city was used as a proxy for local tax rates. In the case of gross receipts or business franchise taxes, an effective tax rate was approximated using NIPA profits, rental and proprietor’s income and gross domestic product data. The Texas franchise tax is not a traditional gross receipts tax, but is instead a “margin” tax with more than one rate. A margin tax creates less distortion than does a gross receipts tax. Therefore, what we believe is the best measure-ment for an effective corporate tax rate for Texas is to average the gross receipts tax and the margin tax, leading to our measure of 2.56 percent. Data were drawn from Tax Analysts, Federation of Tax Administrators, individual state tax return forms and the Bureau of Economic Analysis. Tax rates are as of January 1, 2017.
PERSONAL INCOME TAX PROGRESSIVITY This variable was measured as the difference between the average tax liability per $1,000 at incomes of $50,000 and $150,000. The tax liabili-ties were measured using a combination of effec-tive tax rates, exemptions and deductions at both
state and federal levels, which are calculations from Laffer Associates.
PROPERTY TAX BURDEN This variable was calculated by taking tax rev-enues from property taxes per $1,000 of personal income. We have used U.S. Census Bureau data, for which the most recent year available is 2014. These data were released in December 2016.
SALES TAX BURDEN This variable was calculated by taking tax rev-enues from sales taxes per $1,000 of personal in-come. Sales taxes taken into consideration include the general sales tax and specific sales taxes. We have used U.S. Census Bureau Data, for which the most recent year available is 2014. Where appro-priate, gross receipts or business franchise taxes, counted as sales taxes in the Census data, were subtracted from a state’s total sales taxes in order to avoid double-counting tax burden in a state. These data were released in June 2016.
REMAINING TAX BURDEN This variable was calculated by taking tax rev-enues from all taxes—excluding personal income, corporate income (including corporate license), property, sales and severance per $1,000 of per-sonal income. We used U.S. Census Bureau Data, for which the most recent year available is 2014. These data were released in September 2016.
ESTATE OR INHERITANCE TAX (YES OR NO) This variable assesses if a state levies an estate or inheritance tax. We chose to score states based on either a “yes” for the presence of a state-level estate or inheritance tax, or a “no” for the lack
n previous editions of this report we introduced 15 policy variables that have a proven impact on the migration of capital—both investment and human—into and out of states. The end result of an equal-weighted combination of these variables is the 2017 ALEC-Laffer Economic Outlook rank-
ings of the states. Each of these factors is influenced directly by state lawmakers through the legislative process. The 15 factors and a basic description of their purposes, sourcing and subsequent calculation methodologies are as follows:
108 Rich States, Poor States53 Rich States, Poor States
thereof. Data were drawn from McGuire Woods LLP, “State Death Tax Chart” and indicate the presence of an estate or inheritance tax as of January 1, 2017.
RECENTLY LEGISLATED TAX CHANGES This variable calculates each state’s relative change in tax burden over a two-year period (in this case, the 2015 and 2016 legislative session) for the next fiscal year, using revenue estimates of legislated tax changes per $1,000 of personal income. This timeframe ensures that tax changes will impact a state’s ranking immediately enough to overcome any lags in the tax revenue data. ALEC and Laffer Associates calculations used raw data from state legislative fiscal notes, state budget offices, state revenue offices and other sources, including the National Conference of State Legislators.
DEBT SERVICE AS A SHARE OF TAX REVENUE Interest paid on debt as a percentage of total tax revenue. This information comes from 2014 U.S. Census Bureau data. These data were released in June 2016.
PUBLIC EMPLOYEES PER 10,000 RESIDENTS This variable shows the full-time equivalent public employees per 10,000 of population. This infor-mation comes from 2015 U.S. Census Bureau data. These data were released in December 2016.
QUALITY OF STATE LEGAL SYSTEM This variable ranks tort systems by state. Informa-tion comes from the U.S. Chamber of Commerce Institute for Legal Reform 2015 Lawsuit Climate Survey.
STATE MINIMUM WAGE Minimum wage enforced on a state-by-state ba-sis. If a state does not have a minimum wage, we use the federal minimum wage floor. This infor-mation comes from the U.S. Department of Labor, as of January 1, 2017.
WORKERS’ COMPENSATION COSTS This variable highlights the 2016 Workers’ Com-pensation Index Rate (cost per $100 of payroll). This survey is conducted biennially by the Oregon Department of Consumer & Business Services, In-formation Management Division. RIGHT-TO-WORK STATE (YES OR NO) This variable assesses whether or not a state re-quires union membership for its employees. We have chosen to score states based on either a “yes” for the presence of a right-to-work law or a “no” for the lack thereof. This information comes from the National Right to Work Legal Defense and Education Foundation, Inc. Right-to-work sta-tus is as of January 8, 2017.
TAX OR EXPENDITURE LIMITStates were ranked only by the number of state tax or expenditure limits in place. We measure this by i) a state expenditure limit, ii) mandatory voter approval of tax increases and iii) a superma-jority requirement for tax increases. One point is awarded for each type of tax or expenditure limitation a state has. All tax or expenditure limi-tations measured apply directly to state govern-ment. This information comes from the Cato Insti-tute and other sources.
www.alec.org 109www.alec.org 54