Embed Size (px)
Citation preview
Reliance Restricted
ESSENTIAL INFORMATION:
FACTS AND FIGURES
STATE OF THE INDUSTRY
2017
Australian Food and Grocery Council: State of the Industry Report 2017 | Page 2 of 48
Clive Stiff
Chairman
Australian Food and Grocery
Council
This is the ninth edition of the Australian Food and Grocery Council’s annual State of the Industry series, providing key data on the
food and grocery manufacturing sector in order to inform rational and fact based analysis and policy.
The food and grocery manufacturing sector delivers the essentials of life to every Australian every day. From bread and milk to toilet
paper and detergents, salads and chocolate bars, these are the products that stock our pantries and the ingredients that go into
breakfasts, lunch boxes and dinners.
The food, beverage and fresh produce sectors rely on Australian farmers, transforming their produce into products that families
need every day; while the grocery sector makes solutions that enhance consumer health, hygiene and well-being. All sectors deliver
these high quality goods via a complex and increasingly efficient supply chain.
The data in this year’s State of the Industry report reflects a sector that has increasing significance to the future of Australian
manufacturing jobs, growth and investment. This is despite the substantial headwinds that are currently buffeting the $127.4 billion
food and grocery sector.
Employment growth in the sector is strong, with the addition of 7,300 jobs. This is a sector that employs 320,300 people and
remains a key driver of regional jobs, employing 40% of staff outside metropolitan areas. The sector represents over 33 per cent of
Australian manufacturing jobs and is growing employment at a time when there is a decrease in employment across total
manufacturing.
The small decline in turnover reflects the difficulties for companies that are operating in a low growth domestic market where retail
prices remain stagnant despite increases in input costs. This squeeze is likely to only increase as a doubling and in some cases
tripling of energy costs have occurred since this report’s data has been collected.
Rising electricity and gas costs are hampering the competitiveness and profitability of the domestic food and grocery manufacturing
industry, with more pain yet to come through not only direct energy costs but also the impact of energy costs on the industry’s inputs
such as ingredients, packaging and transportation. We have lost our cost advantage and energy is increasingly unaffordable for the
trade-exposed sector. This impact will be further exacerbated due to the impact of rising energy prices on households, which
impacts family budgets and consumer demand.
There is no doubt that the Australian food and grocery sector will be a vital piece of the economic jigsaw, as we look to the post-
mining investment period and traditional manufacturing sectors, such as car manufacturing, move off shore. This report also shows
encouraging signs with capital investment reversing the last three years of decline, rising by 4.7 per cent in 2015-16 to a total of $2.9
billion. However, looking forward, there is a significant risk that increases in energy costs could stall the recent turnaround in capital
investment and employment and could lead to a loss of existing jobs and production to lower cost economies.
At first glance, a 15.4 percent decline in the real value of food, beverage and grocery exports is alarming. However this decline
appears driven by price factors and cyclical events such as a restocking of cattle herd and the end of the drought in key markets
such as the United States. In nominal terms, exports have increased by 3.6 per cent, which is still below recent strong growth trends
and where Australia should be, given our trading advantages into key markets of China, Japan and Korea. This is a healthy
reminder to redouble efforts to maximise the hard fought gains of free trade agreement and attack the rising costs of manufacturing.
CHAIRMAN’S FOREWORD
Australian Food and Grocery Council: State of the Industry Report 2017 | Page 3 of 48
Introduction
Page 4
Summary: the essentials1
Page 6
Industry Turnover
2
Page 15
Industry value-add3
Page 19
International Trade4
Page 24
Employment
5
Page 38
Capital Investment6
Page 42
Introduction
Table of contents
Introduction 6 Capital Investment
1 Summary: the essentials
2 Industry Turnover
3 Industry value-add
4 International Trade
5 Employment
This year’s State of the Industry Report has been restructured to present the most relevant information in a concise manner and includes analysis on the impact of
different economic indicators that affect the industry. For this purpose an examination that contrasts specific indicators has been included in the body of the Report.
However, recognising the importance of the specific data to the industry, all detailed data that formed part of previous years’ reports has been included as an annex to the
report, including the detailed methodology. The accompanying Annex can be found at www.afgc.org.au.
Australian Food and Grocery Council: State of the Industry Report 2017 | Page 4 of 48
This report (“Report”) has been prepared jointly by the Australian Food and Grocery Council (AFGC) and EY. EY has prepared the analysis in relation to industry
turnover, industry value-add, international trade, employment and capital investment. AFGC has provided insights in relation to each of these topics. The results of EY’s
analysis, including the assumptions and qualifications made in compiling the Report, are set out in the Report. In conducting its work and preparing the Report, EY has
acted in accordance with the instructions of AFGC as set out in its engagement agreement dated 2 April 2015, and, in doing so, has prepared the Report for the benefit of
the AFGC, and has considered only the interests of the AFGC. EY has not been engaged to act, and has not acted, as advisor to any other party in relation to this Report.
Accordingly, EY makes no representations as to the appropriateness, accuracy or completeness of the Report for any other party's purposes. No reliance may be placed
upon the Report or any of its contents by any party other than the AFGC ("Recipient"), for any purpose other than receiving this Report and any Recipient receiving a
copy of the Report must make and rely on their own enquiries in relation to the issues to which the Report relates, the contents of the Report and all matters arising from
or relating to or in any way connected with the Report or its contents.
This communication provides general information which is current at the time of production. The information contained in this communication does not constitute advice
and should not be relied on as such. Professional advice should be sought prior to any action being taken in reliance on any of the information. EY disclaims all
responsibility and liability (including, without limitation, for any direct or indirect or consequential costs, loss or damage or loss of profits) arising from anything done or
omitted to be done by any party in reliance, whether wholly or partially, on any of the information contained in this Report. Any party that relies on the information in this
Report does so at its own risk. EY’s liability is limited by a scheme approved under Professional Standards Legislation.
About EY
EY is a global leader in assurance, tax, transaction and advisory services. The insights and quality services we deliver help build trust and confidence in the capital
markets and in economies the world over. We develop outstanding leaders who team to deliver on our promises to all of our stakeholders. In so doing, we play a critical
role in building a better working world for our people, for our clients and for our communities.
EY refers to the global organisation, and may refer to one or more, of the member firms of Ernst & Young Global Limited, each of which is a separate legal entity. Ernst &
Young Global Limited, a UK company limited by guarantee, does not provide services to clients. For more information about our organisation, please visit ey.com.
© 2017 Ernst & Young, Australia. All Rights Reserved.
ey.com
Introduction Introduction 6 Capital Investment
1 Summary: the essentials
2 Industry Turnover
3 Industry value-add
4 International Trade
5 Employment
Australian Food and Grocery Council: State of the Industry Report 2017 | Page 5 of 48
EYAt EY, we are committed to building a better working world with increased trust and
confidence in business, sustainable growth, development of talent in all its forms, and
greater collaboration. We want to build a better working world through our own actions
and by engaging with like-minded organisations and individuals. This is our purpose
— and why we exist as an organisation.
EY’s Food, Fibre, Agribusiness and Biosecurity practice
Food companies face a challenging and volatile environment. Issues such as the
need to understand changing consumer needs, innovate effectively, and put goods on
the shelf at a price that works for producers, manufacturers and consumers continue
to arise in today’s market. Ongoing commodity price volatility, fluctuating exchange
rates and uncertain tax and regulatory environments, particularly in emerging
markets, makes decision-making complex. As emerging markets leaders take their
place on the global stage and start challenging for share in both developed and
developing markets, food manufacturers are focusing more closely than ever on the
need to maximise volume to maintain growth.
The Australian food and agribusiness sector is a world leader in the provision of high
quality food and fibre using innovative technologies and sustainable natural resource
management. There is strong interest from both government and business for the
growth of this industry. Whilst the sector’s longer-term fundamentals remain strong
and the prospect of rapid increases in global demand continues, there are challenges
for business and government to navigate along the way.
EY’s Food, Fibre, Agribusiness and Biosecurity practice brings together a worldwide
team of professionals to help organisations achieve their goals. We are passionate
about helping Australia create a vibrant future for the people and businesses involved
in the production of food, fibre and agribusiness.
For more information, visit www.ey.com/AU/en/Industries/Consumer-Products/EY-
consumer-products-agribusiness
AFGC
‘Sustaining Australia’
The Australian Food and Grocery Council (AFGC) is Australia’s
peak national industry association, representing the $127.4bn food,
beverage and grocery manufacturing industry.
As Australia’s largest manufacturing sector – accounting for one third of total
manufacturing – the food and grocery manufacturing industry is a vital
contributor to the wealth and health of our nation. The industry’s products are
consumed by 24 million Australians every day of the year.
The AFGC’s aim is for the Australian food, beverage and grocery
manufacturing industry to be world-class, sustainable, socially-responsible and
competing profitably, both domestically and internationally. The AFGC
represents one of the few manufacturing sectors in Australia that continues to
grow and has significant potential for even further growth into the future.
We provide a strong, united voice from industry to government, NGOs,
retailers/trading partners, industry groups and the media, as well as promoting
the industry, for the benefit of members, across the wider community. The
AFGC is respected for advancing scientific policies and research to support
industry positions. As part of our advocacy role, we advance best practice
policy, promote industry’s views, and make submissions to governments on
the development of policy and regulation affecting members.
With industry facing many challenges, we help members stay competitive and
well-informed on important issues including retailer relations, food regulation,
labelling, supply chain and sustainability issues. The AFGC has been proudly
representing the interests of Australia’s largest manufacturing sector since
1995. We are dedicated to keeping the industry strong, innovative and
profitable.
For more information, visit www.afgc.org.au
Who we are
Introduction Introduction 6 Capital Investment
1 Summary: the essentials
2 Industry Turnover
3 Industry value-add
4 International Trade
5 Employment

Australian Food and Grocery Council: State of the Industry Report 2017 | Page 6 of 48
1Summary: the essentials
Australian Food and Grocery Council: State of the Industry Report 2017 | Page 7 of 48
Introduction 6 Capital Investment
1 Summary: the essentials
2 Industry Turnover
3 Industry value-add
4 International Trade
5 Employment
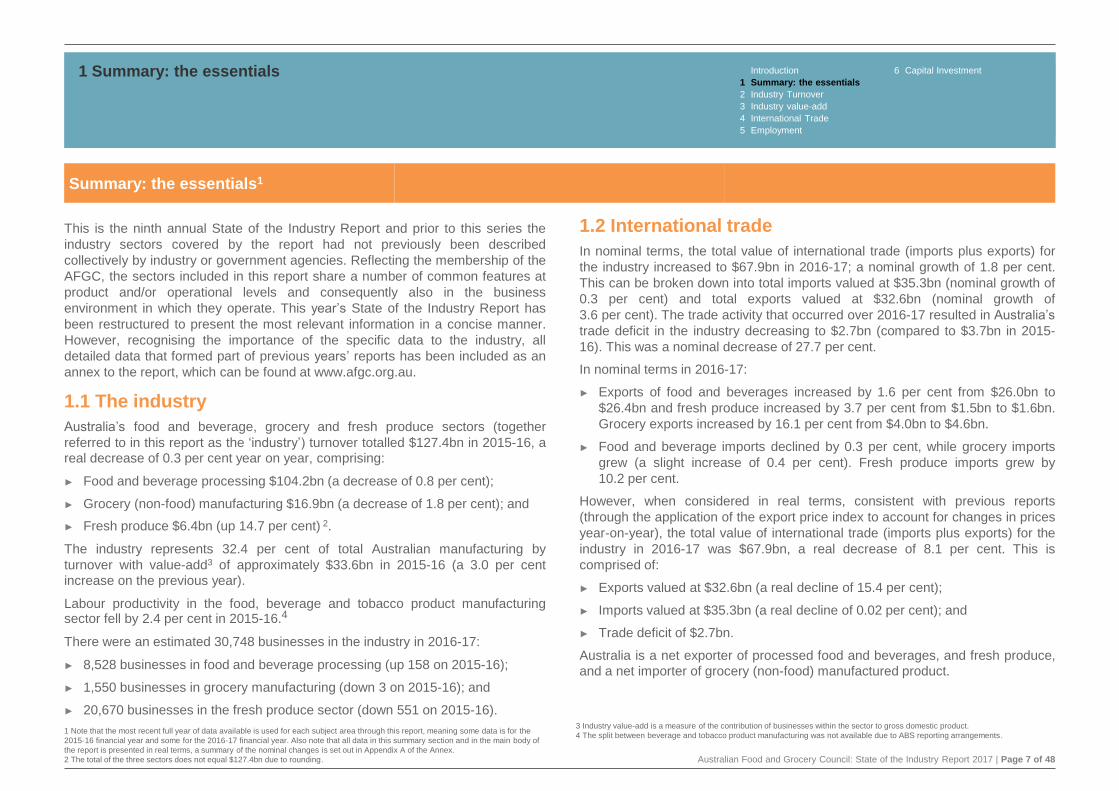
1.2 International trade
In nominal terms, the total value of international trade (imports plus exports) for
the industry increased to $67.9bn in 2016-17; a nominal growth of 1.8 per cent.
This can be broken down into total imports valued at $35.3bn (nominal growth of
0.3 per cent) and total exports valued at $32.6bn (nominal growth of
3.6 per cent). The trade activity that occurred over 2016-17 resulted in Australia’s
trade deficit in the industry decreasing to $2.7bn (compared to $3.7bn in 2015-
16). This was a nominal decrease of 27.7 per cent.
In nominal terms in 2016-17:
► Exports of food and beverages increased by 1.6 per cent from $26.0bn to
$26.4bn and fresh produce increased by 3.7 per cent from $1.5bn to $1.6bn.
Grocery exports increased by 16.1 per cent from $4.0bn to $4.6bn.
► Food and beverage imports declined by 0.3 per cent, while grocery imports
grew (a slight increase of 0.4 per cent). Fresh produce imports grew by
10.2 per cent.
However, when considered in real terms, consistent with previous reports
(through the application of the export price index to account for changes in prices
year-on-year), the total value of international trade (imports plus exports) for the
industry in 2016-17 was $67.9bn, a real decrease of 8.1 per cent. This is
comprised of:
► Exports valued at $32.6bn (a real decline of 15.4 per cent);
► Imports valued at $35.3bn (a real decline of 0.02 per cent); and
► Trade deficit of $2.7bn.
Australia is a net exporter of processed food and beverages, and fresh produce,
and a net importer of grocery (non-food) manufactured product.
This is the ninth annual State of the Industry Report and prior to this series the
industry sectors covered by the report had not previously been described
collectively by industry or government agencies. Reflecting the membership of the
AFGC, the sectors included in this report share a number of common features at
product and/or operational levels and consequently also in the business
environment in which they operate. This year’s State of the Industry Report has
been restructured to present the most relevant information in a concise manner.
However, recognising the importance of the specific data to the industry, all
detailed data that formed part of previous years’ reports has been included as an
annex to the report, which can be found at www.afgc.org.au.
1.1 The industry
Australia’s food and beverage, grocery and fresh produce sectors (together
referred to in this report as the ‘industry’) turnover totalled $127.4bn in 2015-16, areal decrease of 0.3 per cent year on year, comprising:
► Food and beverage processing $104.2bn (a decrease of 0.8 per cent);
► Grocery (non-food) manufacturing $16.9bn (a decrease of 1.8 per cent); and
► Fresh produce $6.4bn (up 14.7 per cent) 2.
The industry represents 32.4 per cent of total Australian manufacturing by
turnover with value-add3 of approximately $33.6bn in 2015-16 (a 3.0 per cent
increase on the previous year).
Labour productivity in the food, beverage and tobacco product manufacturingsector fell by 2.4 per cent in 2015-16.4
There were an estimated 30,748 businesses in the industry in 2016-17:
► 8,528 businesses in food and beverage processing (up 158 on 2015-16);
► 1,550 businesses in grocery manufacturing (down 3 on 2015-16); and
► 20,670 businesses in the fresh produce sector (down 551 on 2015-16).
1 Summary: the essentials
1 Note that the most recent full year of data available is used for each subject area through this report, meaning some data is for the
2015-16 financial year and some for the 2016-17 financial year. Also note that all data in this summary section and in the main body of
the report is presented in real terms, a summary of the nominal changes is set out in Appendix A of the Annex.
2 The total of the three sectors does not equal $127.4bn due to rounding.
Summary: the essentials1
3 Industry value-add is a measure of the contribution of businesses within the sector to gross domestic product.
4 The split between beverage and tobacco product manufacturing was not available due to ABS reporting arrangements.
Australian Food and Grocery Council: State of the Industry Report 2017 | Page 8 of 48
Introduction 6 Capital Investment
1 Summary: the essentials
2 Industry Turnover
3 Industry value-add
4 International Trade
5 Employment
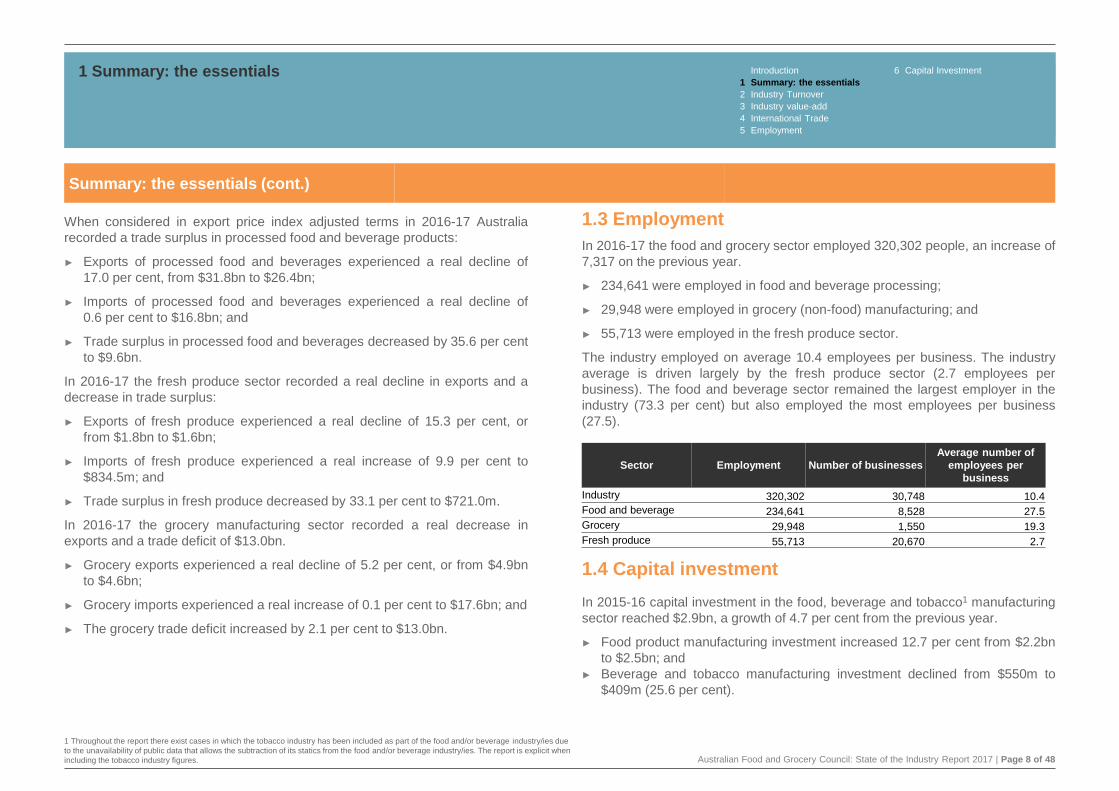
1.3 Employment
In 2016-17 the food and grocery sector employed 320,302 people, an increase of
7,317 on the previous year.
► 234,641 were employed in food and beverage processing;
► 29,948 were employed in grocery (non-food) manufacturing; and
► 55,713 were employed in the fresh produce sector.
The industry employed on average 10.4 employees per business. The industry
average is driven largely by the fresh produce sector (2.7 employees per
business). The food and beverage sector remained the largest employer in the
industry (73.3 per cent) but also employed the most employees per business
(27.5).
1.4 Capital investment
In 2015-16 capital investment in the food, beverage and tobacco1 manufacturing
sector reached $2.9bn, a growth of 4.7 per cent from the previous year.
► Food product manufacturing investment increased 12.7 per cent from $2.2bn
to $2.5bn; and
► Beverage and tobacco manufacturing investment declined from $550m to
$409m (25.6 per cent).
When considered in export price index adjusted terms in 2016-17 Australia
recorded a trade surplus in processed food and beverage products:
► Exports of processed food and beverages experienced a real decline of
17.0 per cent, from $31.8bn to $26.4bn;
► Imports of processed food and beverages experienced a real decline of
0.6 per cent to $16.8bn; and
► Trade surplus in processed food and beverages decreased by 35.6 per cent
to $9.6bn.
In 2016-17 the fresh produce sector recorded a real decline in exports and a
decrease in trade surplus:
► Exports of fresh produce experienced a real decline of 15.3 per cent, or
from $1.8bn to $1.6bn;
► Imports of fresh produce experienced a real increase of 9.9 per cent to
$834.5m; and
► Trade surplus in fresh produce decreased by 33.1 per cent to $721.0m.
In 2016-17 the grocery manufacturing sector recorded a real decrease in
exports and a trade deficit of $13.0bn.
► Grocery exports experienced a real decline of 5.2 per cent, or from $4.9bn
to $4.6bn;
► Grocery imports experienced a real increase of 0.1 per cent to $17.6bn; and
► The grocery trade deficit increased by 2.1 per cent to $13.0bn.
1 Summary: the essentials
Summary: the essentials (cont.)
Sector Employment Number of businesses
Average number of
employees per
business
Industry 320,302 30,748 10.4
Food and beverage 234,641 8,528 27.5
Grocery 29,948 1,550 19.3
Fresh produce 55,713 20,670 2.7
1 Throughout the report there exist cases in which the tobacco industry has been included as part of the food and/or beverage industry/ies due
to the unavailability of public data that allows the subtraction of its statics from the food and/or beverage industry/ies. The report is explicit when
including the tobacco industry figures.
Australian Food and Grocery Council: State of the Industry Report 2017 | Page 9 of 48
Introduction 6 Capital Investment
1 Summary: the essentials
2 Industry Turnover
3 Industry value-add
4 International Trade
5 Employment
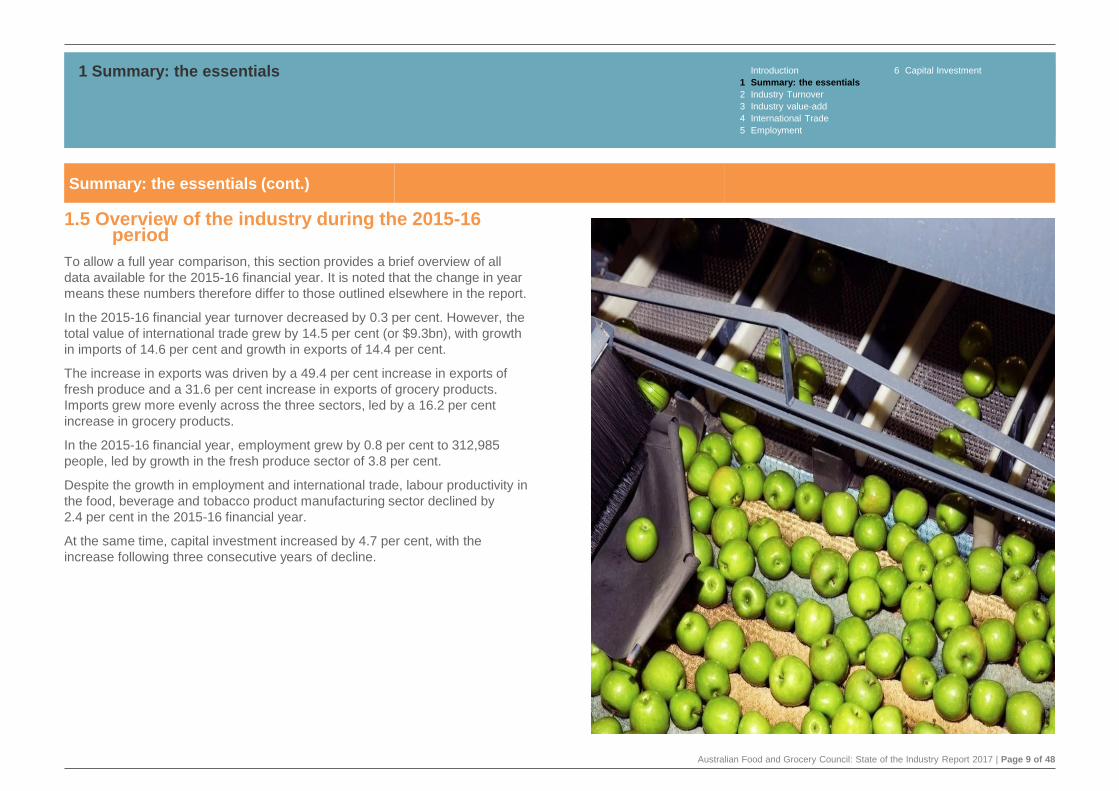
1.5 Overview of the industry during the 2015-16 period
To allow a full year comparison, this section provides a brief overview of all
data available for the 2015-16 financial year. It is noted that the change in year
means these numbers therefore differ to those outlined elsewhere in the report.
In the 2015-16 financial year turnover decreased by 0.3 per cent. However, the
total value of international trade grew by 14.5 per cent (or $9.3bn), with growth
in imports of 14.6 per cent and growth in exports of 14.4 per cent.
The increase in exports was driven by a 49.4 per cent increase in exports of
fresh produce and a 31.6 per cent increase in exports of grocery products.
Imports grew more evenly across the three sectors, led by a 16.2 per cent
increase in grocery products.
In the 2015-16 financial year, employment grew by 0.8 per cent to 312,985
people, led by growth in the fresh produce sector of 3.8 per cent.
Despite the growth in employment and international trade, labour productivity in
the food, beverage and tobacco product manufacturing sector declined by
2.4 per cent in the 2015-16 financial year.
At the same time, capital investment increased by 4.7 per cent, with the
increase following three consecutive years of decline.
1 Summary: the essentials
Summary: the essentials (cont.)
Australian Food and Grocery Council: State of the Industry Report 2017 | Page 10 of 48
Introduction 6 Capital Investment
1 Summary: the essentials
2 Industry Turnover
3 Industry value-add
4 International Trade
5 Employment
1 Summary: the essentials
What does this mean? Analysing the data
The data collected throughout this report highlights a number of interesting
conclusions about the industry and its potential future. The industry as defined
in this report, along with a number of other sectors, forms part of the
manufacturing industry.
While the manufacturing industry declined in terms of turnover and investment
in 2015-16 (the most recent year of available data for these indicators), the
food, beverage and grocery industry has managed to maintain turnover (albeit
with a small real decline in the latest year). At the same time, there has been an
increase in investment in the industry in the last year. These results manifest an
increasing importance of the sector in the manufacturing industry.
Another important indicator analysed is the industry’s value added (IVA). IVA is
the measure of the contribution of businesses within each sector to overall
gross domestic product. While the IVA on an aggregate basis has increased,
labour productivity on a per worker basis (IVA per hour of labour worked) has
decreased (by 2.4 per cent).
IVA per business can be used to assess the average size and contribution of
businesses in each sector. This analysis shows that companies in the food and
beverage processing sector have a higher turnover and contribution to value-
add ($12.4m and $3.1m on average per business, respectively) than those in
the grocery sector ($10.9m and $3.1m) and fresh produce sector ($300,000 and
$125,000).
Trade and employment data is available for 2016-17. From an international
trade perspective, total trade – imports plus exports – showed a decrease of
8.1 per cent in real terms in 2016-17. However in nominal terms the total trade
showed an increase of 1.8 per cent increasing from $66.6bn in 2015-16 to
$67.9bn in 2016-17. The main factor that explains this difference is a high
export price index1 for the 2016-17 period, with the export inflation factor
accounted for an adjustment of circa 22 per cent during the period of 2015-16 to
2016-17. The high indexation factor in the period was primarily a result of a
steep increase in the price of mining commodities.
While the USA and China remain Australia’s main trading partners, other
countries including India, Malaysia and the Netherlands are increasing their
trade activity with Australia. However, the industry remains relatively protected
from external economic events given domestic consumption levels. On average
69.8 per cent of the total sector turnover is consumed domestically while the
remainder is exported. That said, the fresh produce sector is dependent on the
export market as 76.8 per cent of locally produced goods are consumed
overseas.
The industry employs a significant proportion of Australians, above other high
profile sectors such as the mining industry, utilities and the information media
and telecommunications industry.
NSW and Victoria employ the largest number of people working in the sector (a
combined 56.7 per cent) and 39 per cent of all employed persons in the industry
worked in non-metropolitan areas in the period of 2016-17. However, while the
food and beverage sector increased employment, the grocery sector and the
fresh produce sector showed slight declines (a increase of 3.5 per cent in the
food and beverage sector and decrease of 1.2 per cent and 0.4 per cent in the
grocery sector and fresh produce sector, respectively, for the period of 2016-
17).
Food and beverage sector
The food and beverage sector’s turnover, which represents 81.8 per cent of
industry sales and over 30 per cent manufacturing sales, decreased
0.8 per cent in real terms in 2015-16. This sector has therefore been the major
driver of industry performance.
At the same time, the sector’s industry value-add increased. This occurred
despite a decrease in investment in real terms over the last 3 years to 2014-15.
Investment recovered in 2015-16 which may have a positive impact on
turnover, value-add and productivity in years to come.
1 The export price index measures changes in prices of exports of merchandise from Australia. The index is used to adjust
figures to real terms i.e. adjust for changes in prices. High indexation in 2015-16 increased the real value of exports significantly
resulting in a decline in value in 2016-17.
Australian Food and Grocery Council: State of the Industry Report 2017 | Page 11 of 48
The sector’s trade surplus (in real terms) declined in 2016-17, driven primarily
by lower exports and flat imports. Exports to all major trading partners (China,
the US and Japan) have declined in real terms (noting the impact of the export
price index).
Grocery sector
The grocery sector’s turnover, which represents approximately 13.2 per cent of
industry sales, decreased 1.8 per cent in 2015-16.
The grocery sector’s exports (which are approximately 26 per cent of imports)
declined by 5.2 per cent in 2016-17, with a strong increase in exports to China
and the US offset by declines in most of the other top export markets.
Meanwhile, imports remain relatively flat, with a mix of small increases and
decreases in the top import markets.
Fresh produce sector
The fresh produce sector’s turnover (5.0 per cent of industry sales) increased
by 14.7 per cent in 2015-16 driven primarily by vegetable and nut sales. This
increase has resulted from increased health awareness, strong output volumes
and high exports in 2015-16 underpinned by quality reputation and counter-
seasonal harvesting volumes.1
The sector’s exports (which are about two times greater than imports) declined
15.3 per cent, with a drop in exports to most major countries excluding China in
2016-17 (again noting the impact of the export price index). Meanwhile, imports
remain relatively flat, with increased imports in fresh products from New
Zealand.
Outlook
The Australian economy is forecast to continue to grow at a relatively subdued
pace over the next few years on the back of a slowdown in residential
construction and weak consumer spending.2 Soft local demand is expected to
put pressure on industry performance.3 China is expected to shift to a more
balanced growth, while the AUD exchange rate will remain vulnerable to
commodity price movements,4 potentially impacting the attractiveness of global
trade of Australian products.
Industry sub-sectors such as soft drinks and alcoholic beverages are expected
to continue experiencing low turnover growth (on a nominal basis) due to a
variety of factors including lower consumption per capita (beer), highly
competitive export global markets (wine) and increased growth in private labels
(soft drinks).5
However the industry continues to present significant opportunities to
outperform total household spending growth, in particular in the food segment,
as consumers move towards healthier lifestyles and increase spending on
premium quality products. Continued growth in some sub-segments
(particularly in fresh produce) is anticipated to be underpinned by export
demand (beef), free trade agreements with Japan, China and Korea (dairy),
rising consumer awareness (poultry and high protein products)6 and higher
disposable incomes (fruit and vegetables).7
In addition, new international retail companies have announced their expected
entry to the Australian market.8 Their presence has the potential to disrupt the
way in which businesses in the industry operate and present opportunities for
improving efficiency and competitiveness. In particular, it is expected that
companies in the mass grocery retail sector in Australia will need to adjust their
strategies to reflect this competition.
Introduction 6 Capital Investment
1 Summary: the essentials
2 Industry Turnover
3 Industry value-add
4 International Trade
5 Employment
1 Summary: the essentials
What does this mean? Analysing the data (cont.)
1 IBISWorld, Fruit and Vegetable Wholesaling; Under Cover Vegetable Growing.
2 Oxford Economics, Country Economic Forecast Australia.
3 BMI Research, Australia Food & Drink Report Q4 2017.
4 Oxford Economics, Country Economic Forecast Australia.
5 BMI Research, Australia Food & Drink Report Q4 2017.
6 IBISWorld, Meat Processing; Poultry Processing; Butter and Dairy Product
Manufacturing.
7 In particular in relation to under cover fruits and vegetables, which are cultivated
under controlled environments and typically attract higher prices. IBISWorld, Fruit and
Vegetable Wholesaling; Under Cover Vegetable Growing.
8 Including Amazon and Kaufland.
Australian Food and Grocery Council: State of the Industry Report 2017 | Page 12 of 48
1 Summary: the essentials Introduction 6 Capital Investment
1 Summary: the essentials
2 Industry Turnover
3 Industry value-add
4 International Trade
5 Employment
Overview
This AFGC State of the Industry report is the ninth in the series. It consists of an extensive set of historical and updated data which collectively describes the
broader food and beverage, grocery manufacturing and fresh produce sectors, as well as the important contribution it makes to the Australian economy.1
Throughout this report, together the food and beverage, grocery and fresh produce sectors are classified as the ‘industry’.
1. All views expressed within this Report are those of the AFGC and other named authors. The AFGC acknowledges the
assistance of EY in compiling and analysing the statistical data contained within this Report.
2. ABS Cat. No. 5206.006.
3. ABS Cat. No. 6523.0.
► Low homeownership growth - annualised at 1.1 per cent over the past five
years, compared to long-run annual growth of 6.5 per cent
► Average household debt (adjusted for inflation) expanded 5 per cent per year
from 2004 through 2016
► Property debt increased at an annualised 5.5 per cent over the same period3
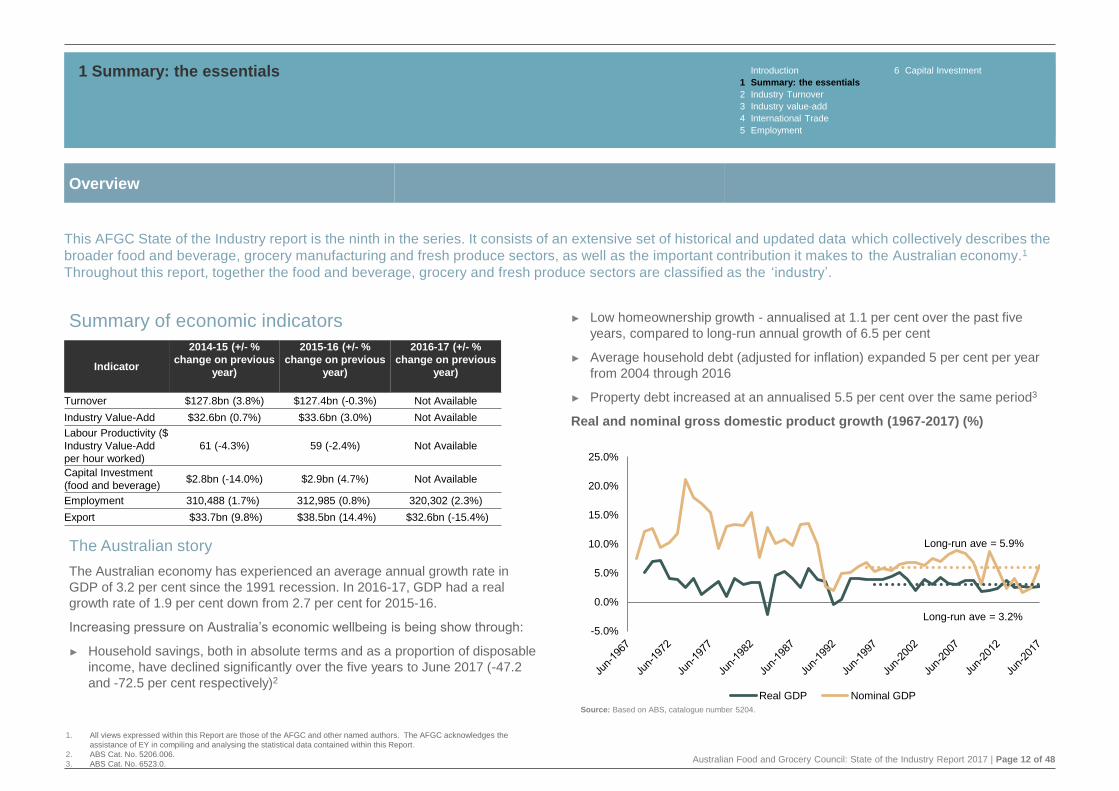
Real and nominal gross domestic product growth (1967-2017) (%)
Summary of economic indicators
The Australian story
The Australian economy has experienced an average annual growth rate in
GDP of 3.2 per cent since the 1991 recession. In 2016-17, GDP had a real
growth rate of 1.9 per cent down from 2.7 per cent for 2015-16.
Increasing pressure on Australia’s economic wellbeing is being show through:
► Household savings, both in absolute terms and as a proportion of disposable
income, have declined significantly over the five years to June 2017 (-47.2
and -72.5 per cent respectively)2
Indicator
2014-15 (+/- %
change on previous
year)
2015-16 (+/- %
change on previous
year)
2016-17 (+/- %
change on previous
year)
Turnover $127.8bn (3.8%) $127.4bn (-0.3%) Not Available
Industry Value-Add $32.6bn (0.7%) $33.6bn (3.0%) Not Available
Labour Productivity ($
Industry Value-Add
per hour worked)
61 (-4.3%) 59 (-2.4%) Not Available
Capital Investment
(food and beverage)$2.8bn (-14.0%) $2.9bn (4.7%) Not Available
Employment 310,488 (1.7%) 312,985 (0.8%) 320,302 (2.3%)
Export $33.7bn (9.8%) $38.5bn (14.4%) $32.6bn (-15.4%)
Source: Based on ABS, catalogue number 5204.
-5.0%
0.0%
5.0%
10.0%
15.0%
20.0%
25.0%
Real GDP Nominal GDP
Long-run ave = 3.2%
Long-run ave = 5.9%
Australian Food and Grocery Council: State of the Industry Report 2017 | Page 13 of 48
1 Summary: the essentials Introduction 6 Capital Investment
1 Summary: the essentials
2 Industry Turnover
3 Industry value-add
4 International Trade
5 Employment
Overview
1. ABS Cat. No. 5206.006.
2. Minutes of the Monetary Policy Meeting of the Reserve Bank Board, 1 August 2017.
3. ABS Cat. No. 5368.0.
Economic value added by selected
industries, 2016-17
24.5%
1.8%
9.2%
4.5%
-17.3%
2.3%
3.0%
-10.6%
-6.1%
-2.5%
-7.0%
-1.8%
-3.6%
6.0%
1.5%
3.5%
4.5%
3.1%
6.2%
2.1%
4.3%
2.2%
-20% -15% -10% -5% 0% 5% 10% 15% 20% 25% 30%
Agriculture
Coal
Oil & Gas
Iron ore
Mining services
Total mining
Food & beverage manufacturing
Textile & clothing manufacturing
Wood & paper manufacturing
Metal manufacturing
Machinery manufacturing
Total manufacturing
Construction
Wholesale trade
Retail trade
Telecommunications & media
Financial services
Rental & real estate
Professional & scientific services
Education & training
Healthcare & social services
Homeownership
Growth in industry value added
Source: ABS Cat. No. 5206.006
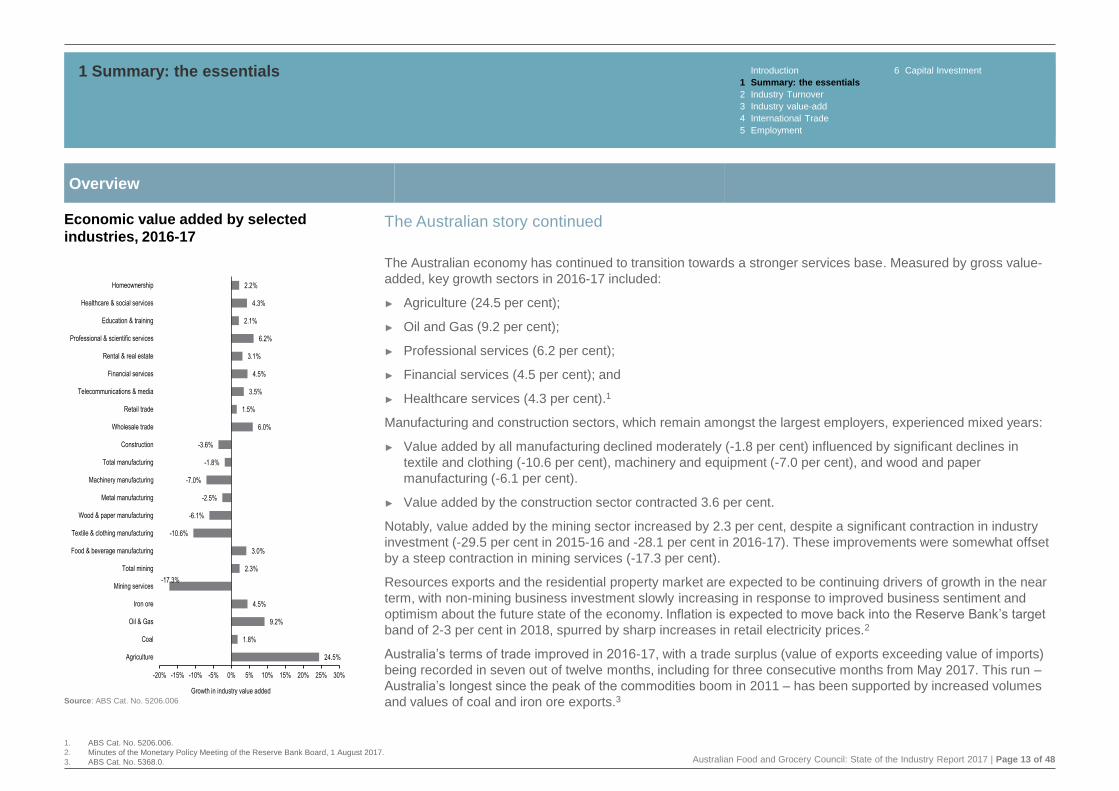
The Australian story continued
The Australian economy has continued to transition towards a stronger services base. Measured by gross value-
added, key growth sectors in 2016-17 included:
► Agriculture (24.5 per cent);
► Oil and Gas (9.2 per cent);
► Professional services (6.2 per cent);
► Financial services (4.5 per cent); and
► Healthcare services (4.3 per cent).1
Manufacturing and construction sectors, which remain amongst the largest employers, experienced mixed years:
► Value added by all manufacturing declined moderately (-1.8 per cent) influenced by significant declines in
textile and clothing (-10.6 per cent), machinery and equipment (-7.0 per cent), and wood and paper
manufacturing (-6.1 per cent).
► Value added by the construction sector contracted 3.6 per cent.
Notably, value added by the mining sector increased by 2.3 per cent, despite a significant contraction in industry
investment (-29.5 per cent in 2015-16 and -28.1 per cent in 2016-17). These improvements were somewhat offset
by a steep contraction in mining services (-17.3 per cent).
Resources exports and the residential property market are expected to be continuing drivers of growth in the near
term, with non-mining business investment slowly increasing in response to improved business sentiment and
optimism about the future state of the economy. Inflation is expected to move back into the Reserve Bank’s target
band of 2-3 per cent in 2018, spurred by sharp increases in retail electricity prices.2
Australia’s terms of trade improved in 2016-17, with a trade surplus (value of exports exceeding value of imports)
being recorded in seven out of twelve months, including for three consecutive months from May 2017. This run –
Australia’s longest since the peak of the commodities boom in 2011 – has been supported by increased volumes
and values of coal and iron ore exports.3
Australian Food and Grocery Council: State of the Industry Report 2017 | Page 14 of 48
1 Summary: the essentials Introduction 6 Capital Investment
1 Summary: the essentials
2 Industry Turnover
3 Industry value-add
4 International Trade
5 Employment
Overview
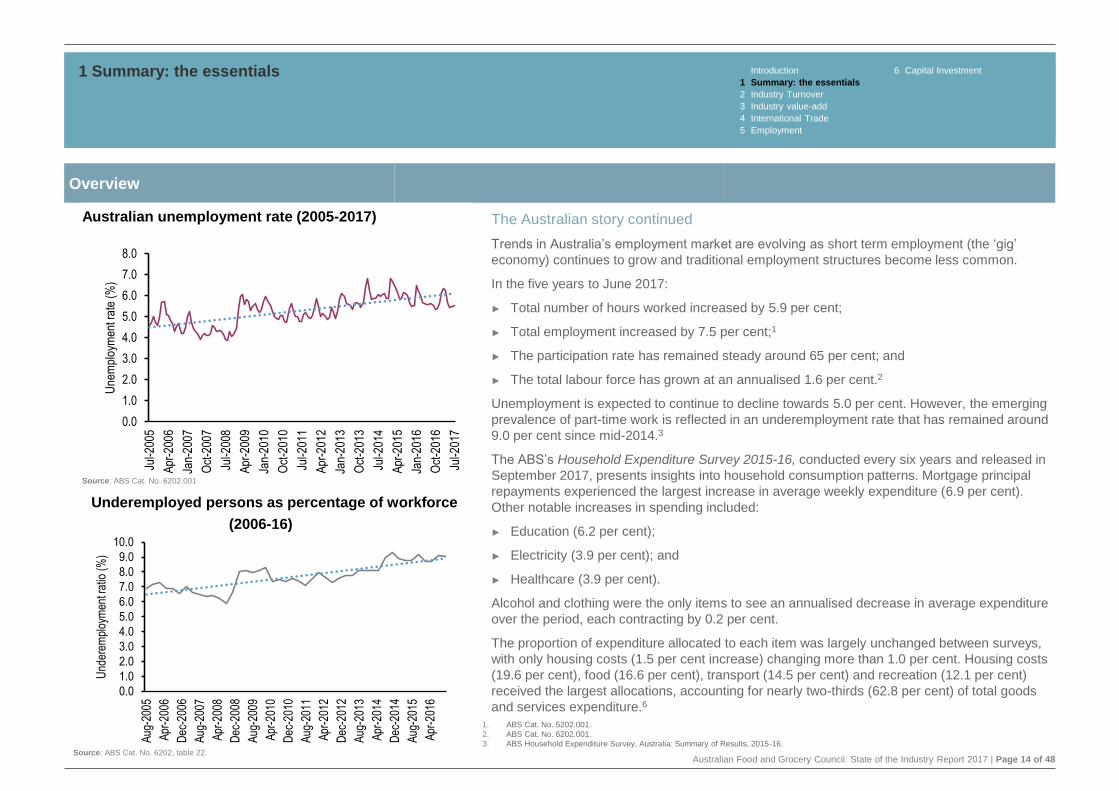
The Australian story continued
Trends in Australia’s employment market are evolving as short term employment (the ‘gig’
economy) continues to grow and traditional employment structures become less common.
In the five years to June 2017:
► Total number of hours worked increased by 5.9 per cent;
► Total employment increased by 7.5 per cent;1
► The participation rate has remained steady around 65 per cent; and
► The total labour force has grown at an annualised 1.6 per cent.2
Unemployment is expected to continue to decline towards 5.0 per cent. However, the emerging
prevalence of part-time work is reflected in an underemployment rate that has remained around
9.0 per cent since mid-2014.3
The ABS’s Household Expenditure Survey 2015-16, conducted every six years and released in
September 2017, presents insights into household consumption patterns. Mortgage principal
repayments experienced the largest increase in average weekly expenditure (6.9 per cent).
Other notable increases in spending included:
► Education (6.2 per cent);
► Electricity (3.9 per cent); and
► Healthcare (3.9 per cent).
Alcohol and clothing were the only items to see an annualised decrease in average expenditure
over the period, each contracting by 0.2 per cent.
The proportion of expenditure allocated to each item was largely unchanged between surveys,
with only housing costs (1.5 per cent increase) changing more than 1.0 per cent. Housing costs
(19.6 per cent), food (16.6 per cent), transport (14.5 per cent) and recreation (12.1 per cent)
received the largest allocations, accounting for nearly two-thirds (62.8 per cent) of total goods
and services expenditure.6
1. ABS Cat. No. 5202.001.
2. ABS Cat. No. 6202.001.
3. ABS Household Expenditure Survey, Australia: Summary of Results, 2015-16.
Underemployed persons as percentage of workforce
0.0
1.0
2.0
3.0
4.0
5.0
6.0
7.0
8.0
9.0
10.0
Aug
-200
5
Apr
-200
6
Dec
-200
6
Aug
-200
7
Apr
-200
8
Dec
-200
8
Aug
-200
9
Apr
-201
0
Dec
-201
0
Aug
-201
1
Apr
-201
2
Dec
-201
2
Aug
-201
3
Apr
-201
4
Dec
-201
4
Aug
-201
5
Apr
-201
6
Und
erem
ploy
men
t rat
io (
%)
Source: ABS Cat. No. 6202, table 22.
Australian unemployment rate (2005-2017)
0.0
1.0
2.0
3.0
4.0
5.0
6.0
7.0
8.0
Jul-2
005
Apr
-200
6
Jan-
2007
Oct
-200
7
Jul-2
008
Apr
-200
9
Jan-
2010
Oct
-201
0
Jul-2
011
Apr
-201
2
Jan-
2013
Oct
-201
3
Jul-2
014
Apr
-201
5
Jan-
2016
Oct
-201
6
Jul-2
017
Une
mpl
oym
ent r
ate
(%)
Source: ABS Cat. No. 6202.001
(2006-16)

Australian Food and Grocery Council: State of the Industry Report 2017 | Page 15 of 48
2Industry Turnover
Australian Food and Grocery Council: State of the Industry Report 2017 | Page 16 of 48
2 Industry Turnover Introduction 6 Capital Investment
1 Summary: the essentials
2 Industry Turnover
3 Industry value-add
4 International Trade
5 Employment
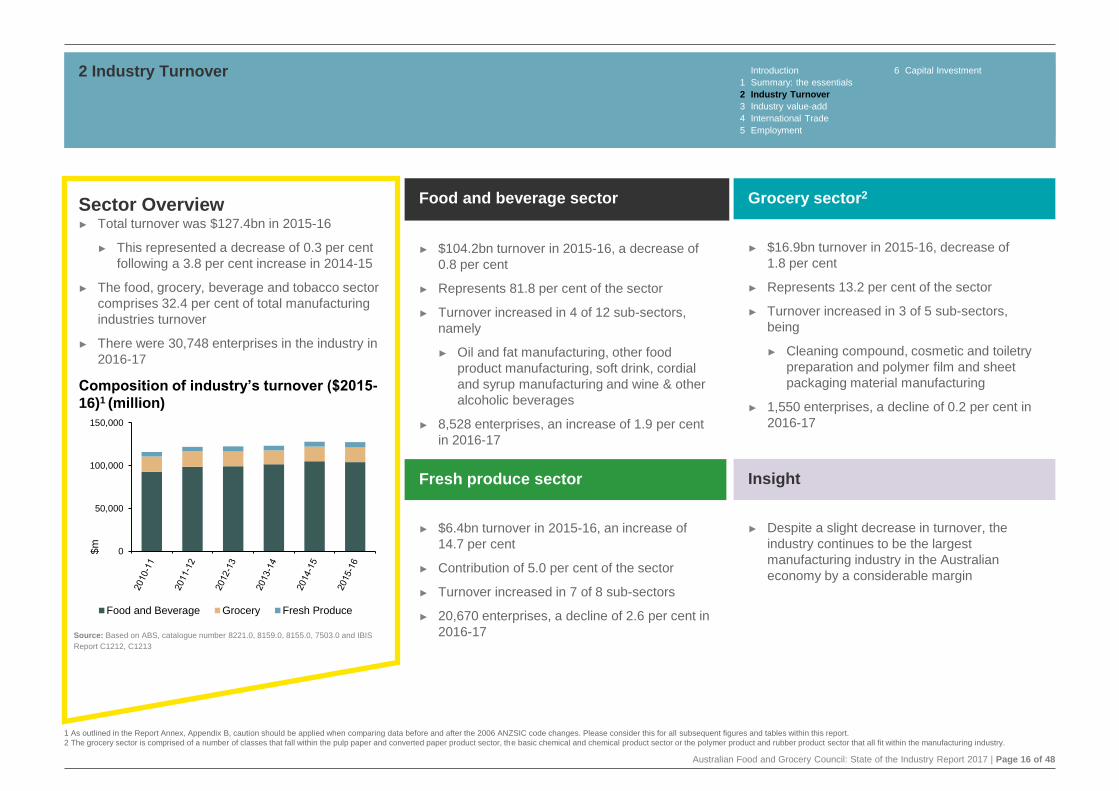
Food and beverage sector
► $104.2bn turnover in 2015-16, a decrease of
0.8 per cent
► Represents 81.8 per cent of the sector
► Turnover increased in 4 of 12 sub-sectors,
namely
► Oil and fat manufacturing, other food
product manufacturing, soft drink, cordial
and syrup manufacturing and wine & other
alcoholic beverages
► 8,528 enterprises, an increase of 1.9 per cent
in 2016-17
Grocery sector2
► $16.9bn turnover in 2015-16, decrease of
1.8 per cent
► Represents 13.2 per cent of the sector
► Turnover increased in 3 of 5 sub-sectors,
being
► Cleaning compound, cosmetic and toiletry
preparation and polymer film and sheet
packaging material manufacturing
► 1,550 enterprises, a decline of 0.2 per cent in
2016-17
Fresh produce sector
► $6.4bn turnover in 2015-16, an increase of
14.7 per cent
► Contribution of 5.0 per cent of the sector
► Turnover increased in 7 of 8 sub-sectors
► 20,670 enterprises, a decline of 2.6 per cent in
2016-17
Insight
► Despite a slight decrease in turnover, the
industry continues to be the largest
manufacturing industry in the Australian
economy by a considerable margin
Sector Overview► Total turnover was $127.4bn in 2015-16
► This represented a decrease of 0.3 per cent
following a 3.8 per cent increase in 2014-15
► The food, grocery, beverage and tobacco sector
comprises 32.4 per cent of total manufacturing
industries turnover
► There were 30,748 enterprises in the industry in
2016-17
Composition of industry’s turnover ($2015-
16)1 (million)
0
50,000
100,000
150,000
$m
Food and Beverage Grocery Fresh Produce
Source: Based on ABS, catalogue number 8221.0, 8159.0, 8155.0, 7503.0 and IBIS
Report C1212, C1213
1 As outlined in the Report Annex, Appendix B, caution should be applied when comparing data before and after the 2006 ANZSIC code changes. Please consider this for all subsequent figures and tables within this report.
2 The grocery sector is comprised of a number of classes that fall within the pulp paper and converted paper product sector, the basic chemical and chemical product sector or the polymer product and rubber product sector that all fit within the manufacturing industry.
Australian Food and Grocery Council: State of the Industry Report 2017 | Page 17 of 48
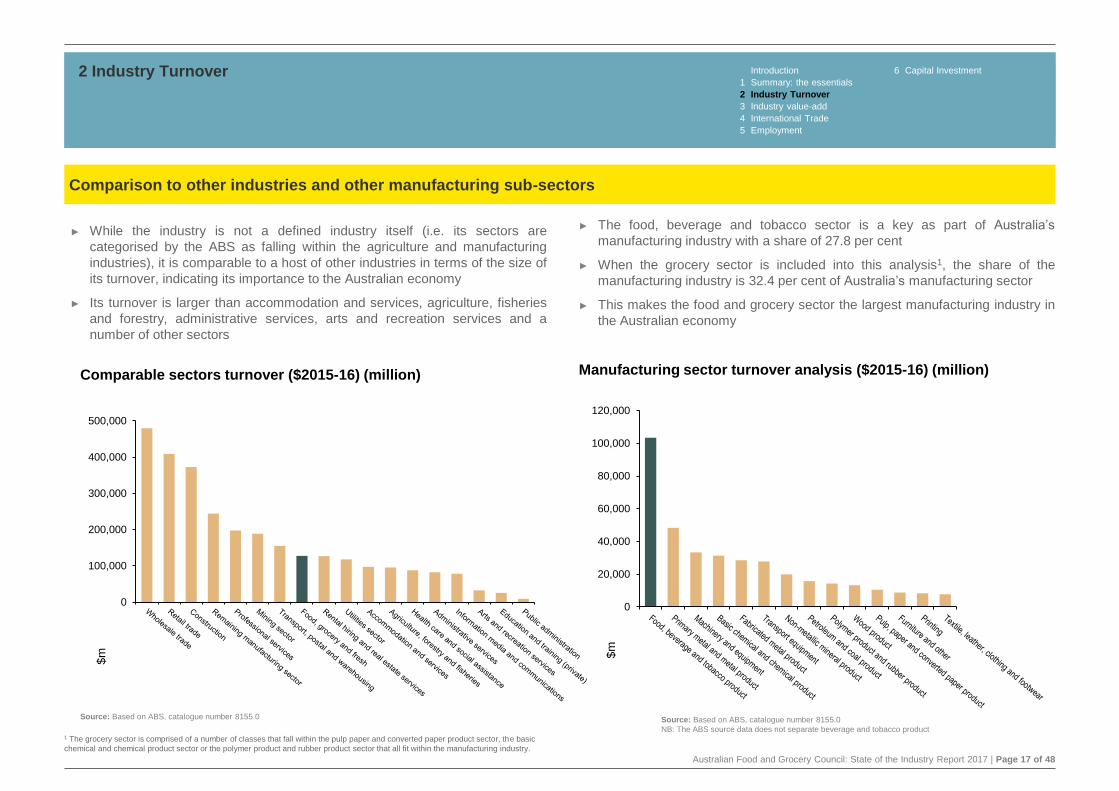
► While the industry is not a defined industry itself (i.e. its sectors are
categorised by the ABS as falling within the agriculture and manufacturing
industries), it is comparable to a host of other industries in terms of the size of
its turnover, indicating its importance to the Australian economy
► Its turnover is larger than accommodation and services, agriculture, fisheries
and forestry, administrative services, arts and recreation services and a
number of other sectors
► The food, beverage and tobacco sector is a key as part of Australia’s
manufacturing industry with a share of 27.8 per cent
► When the grocery sector is included into this analysis1, the share of the
manufacturing industry is 32.4 per cent of Australia’s manufacturing sector
► This makes the food and grocery sector the largest manufacturing industry in
the Australian economy
2 Industry Turnover Introduction 6 Capital Investment
1 Summary: the essentials
2 Industry Turnover
3 Industry value-add
4 International Trade
5 Employment
Comparison to other industries and other manufacturing sub-sectors
Manufacturing sector turnover analysis ($2015-16) (million)
Source: Based on ABS, catalogue number 8155.0
NB: The ABS source data does not separate beverage and tobacco product
0
20,000
40,000
60,000
80,000
100,000
120,000
$m
1 The grocery sector is comprised of a number of classes that fall within the pulp paper and converted paper product sector, the basic
chemical and chemical product sector or the polymer product and rubber product sector that all fit within the manufacturing industry.
Source: Based on ABS, catalogue number 8155.0
Comparable sectors turnover ($2015-16) (million)
0
100,000
200,000
300,000
400,000
500,000
$m
Australian Food and Grocery Council: State of the Industry Report 2017 | Page 18 of 48
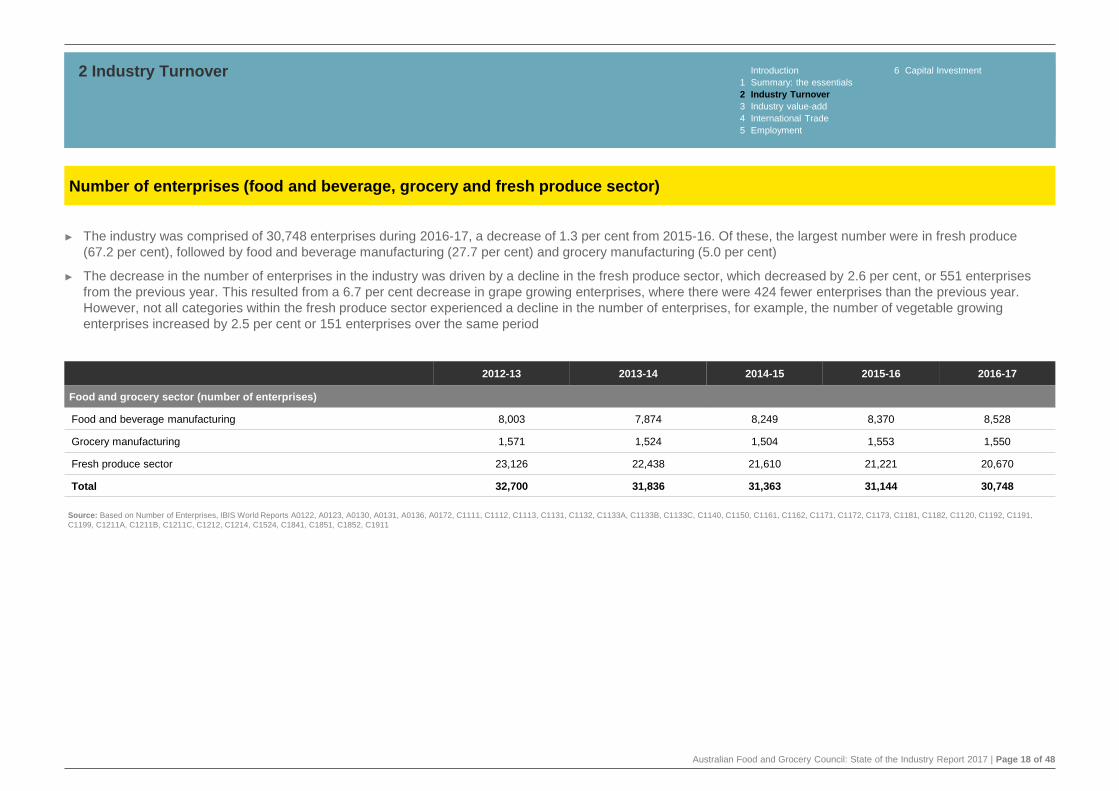
► The industry was comprised of 30,748 enterprises during 2016-17, a decrease of 1.3 per cent from 2015-16. Of these, the largest number were in fresh produce
(67.2 per cent), followed by food and beverage manufacturing (27.7 per cent) and grocery manufacturing (5.0 per cent)
► The decrease in the number of enterprises in the industry was driven by a decline in the fresh produce sector, which decreased by 2.6 per cent, or 551 enterprises
from the previous year. This resulted from a 6.7 per cent decrease in grape growing enterprises, where there were 424 fewer enterprises than the previous year.
However, not all categories within the fresh produce sector experienced a decline in the number of enterprises, for example, the number of vegetable growing
enterprises increased by 2.5 per cent or 151 enterprises over the same period
2 Industry Turnover Introduction 6 Capital Investment
1 Summary: the essentials
2 Industry Turnover
3 Industry value-add
4 International Trade
5 Employment
Number of enterprises (food and beverage, grocery and fresh produce sector)
2012-13 2013-14 2014-15 2015-16 2016-17
Food and grocery sector (number of enterprises)
Food and beverage manufacturing 8,003 7,874 8,249 8,370 8,528
Grocery manufacturing 1,571 1,524 1,504 1,553 1,550
Fresh produce sector 23,126 22,438 21,610 21,221 20,670
Total 32,700 31,836 31,363 31,144 30,748
Source: Based on Number of Enterprises, IBIS World Reports A0122, A0123, A0130, A0131, A0136, A0172, C1111, C1112, C1113, C1131, C1132, C1133A, C1133B, C1133C, C1140, C1150, C1161, C1162, C1171, C1172, C1173, C1181, C1182, C1120, C1192, C1191,
C1199, C1211A, C1211B, C1211C, C1212, C1214, C1524, C1841, C1851, C1852, C1911

Australian Food and Grocery Council: State of the Industry Report 2017 | Page 19 of 48
3Industry value-add
Australian Food and Grocery Council: State of the Industry Report 2017 | Page 20 of 48
3 Industry value-add Introduction 6 Capital Investment
1 Summary: the essentials
2 Industry Turnover
3 Industry value-add
4 International Trade
5 Employment
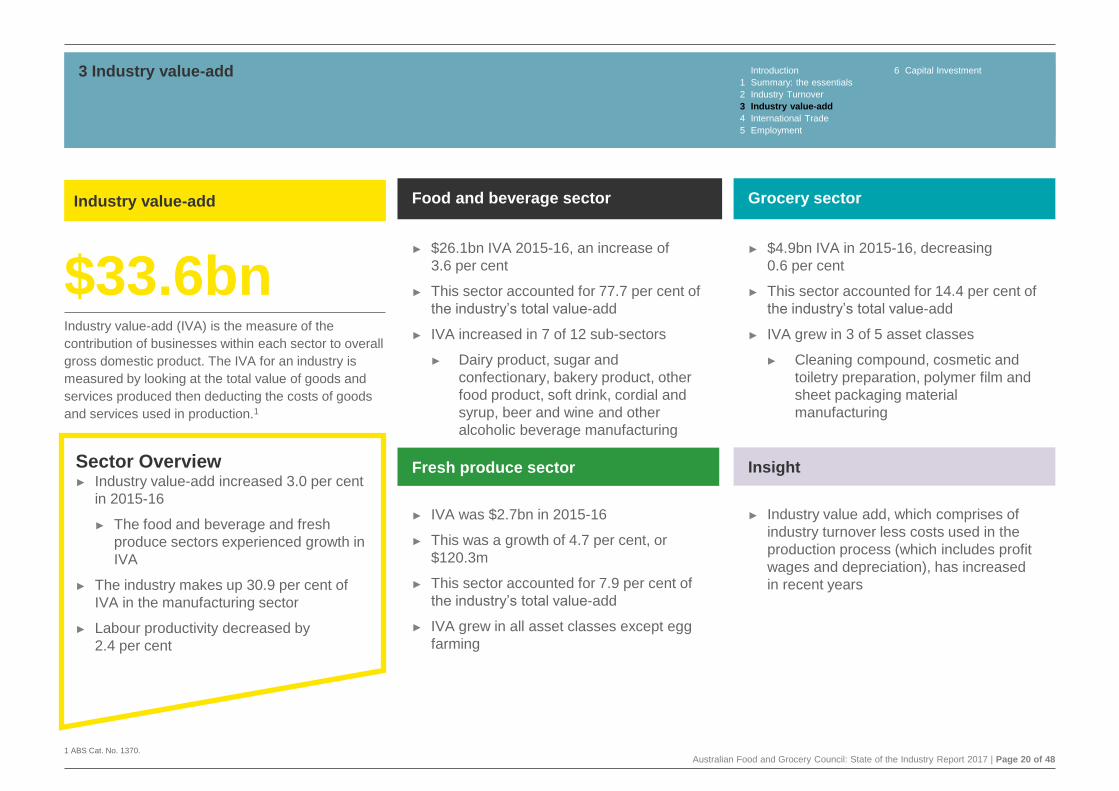
Food and beverage sector
► $26.1bn IVA 2015-16, an increase of
3.6 per cent
► This sector accounted for 77.7 per cent of
the industry’s total value-add
► IVA increased in 7 of 12 sub-sectors
► Dairy product, sugar and
confectionary, bakery product, other
food product, soft drink, cordial and
syrup, beer and wine and other
alcoholic beverage manufacturing
Grocery sector
► $4.9bn IVA in 2015-16, decreasing
0.6 per cent
► This sector accounted for 14.4 per cent of
the industry’s total value-add
► IVA grew in 3 of 5 asset classes
► Cleaning compound, cosmetic and
toiletry preparation, polymer film and
sheet packaging material
manufacturing
Fresh produce sector
► IVA was $2.7bn in 2015-16
► This was a growth of 4.7 per cent, or
$120.3m
► This sector accounted for 7.9 per cent of
the industry’s total value-add
► IVA grew in all asset classes except egg
farming
Insight
► Industry value add, which comprises of
industry turnover less costs used in the
production process (which includes profit
wages and depreciation), has increased
in recent years
Sector Overview► Industry value-add increased 3.0 per cent
in 2015-16
► The food and beverage and fresh
produce sectors experienced growth in
IVA
► The industry makes up 30.9 per cent of
IVA in the manufacturing sector
► Labour productivity decreased by
2.4 per cent
Industry value-add
$33.6bnIndustry value-add (IVA) is the measure of the
contribution of businesses within each sector to overall
gross domestic product. The IVA for an industry is
measured by looking at the total value of goods and
services produced then deducting the costs of goods
and services used in production.1
1 ABS Cat. No. 1370.
Australian Food and Grocery Council: State of the Industry Report 2017 | Page 21 of 48
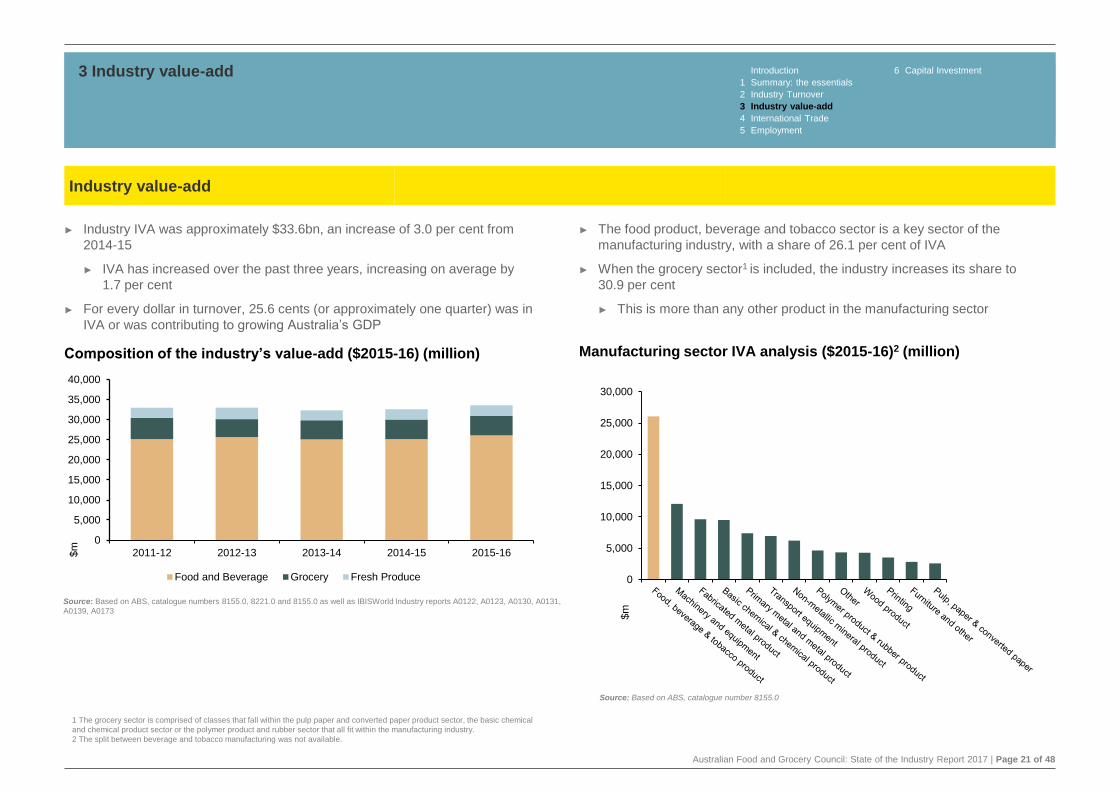
► The food product, beverage and tobacco sector is a key sector of the
manufacturing industry, with a share of 26.1 per cent of IVA
► When the grocery sector1 is included, the industry increases its share to
30.9 per cent
► This is more than any other product in the manufacturing sector
► Industry IVA was approximately $33.6bn, an increase of 3.0 per cent from
2014-15
► IVA has increased over the past three years, increasing on average by
1.7 per cent
► For every dollar in turnover, 25.6 cents (or approximately one quarter) was in
IVA or was contributing to growing Australia’s GDP
3 Industry value-add Introduction 6 Capital Investment
1 Summary: the essentials
2 Industry Turnover
3 Industry value-add
4 International Trade
5 Employment
Source: Based on ABS, catalogue number 8155.0
Manufacturing sector IVA analysis ($2015-16)2 (million)
Industry value-add
Composition of the industry’s value-add ($2015-16) (million)
Source: Based on ABS, catalogue numbers 8155.0, 8221.0 and 8155.0 as well as IBISWorld Industry reports A0122, A0123, A0130, A0131,
A0139, A0173
0
5,000
10,000
15,000
20,000
25,000
30,000
$m
1 The grocery sector is comprised of classes that fall within the pulp paper and converted paper product sector, the basic chemical
and chemical product sector or the polymer product and rubber sector that all fit within the manufacturing industry.
2 The split between beverage and tobacco manufacturing was not available.
0
5,000
10,000
15,000
20,000
25,000
30,000
35,000
40,000
2011-12 2012-13 2013-14 2014-15 2015-16$m
Food and Beverage Grocery Fresh Produce
Australian Food and Grocery Council: State of the Industry Report 2017 | Page 22 of 48
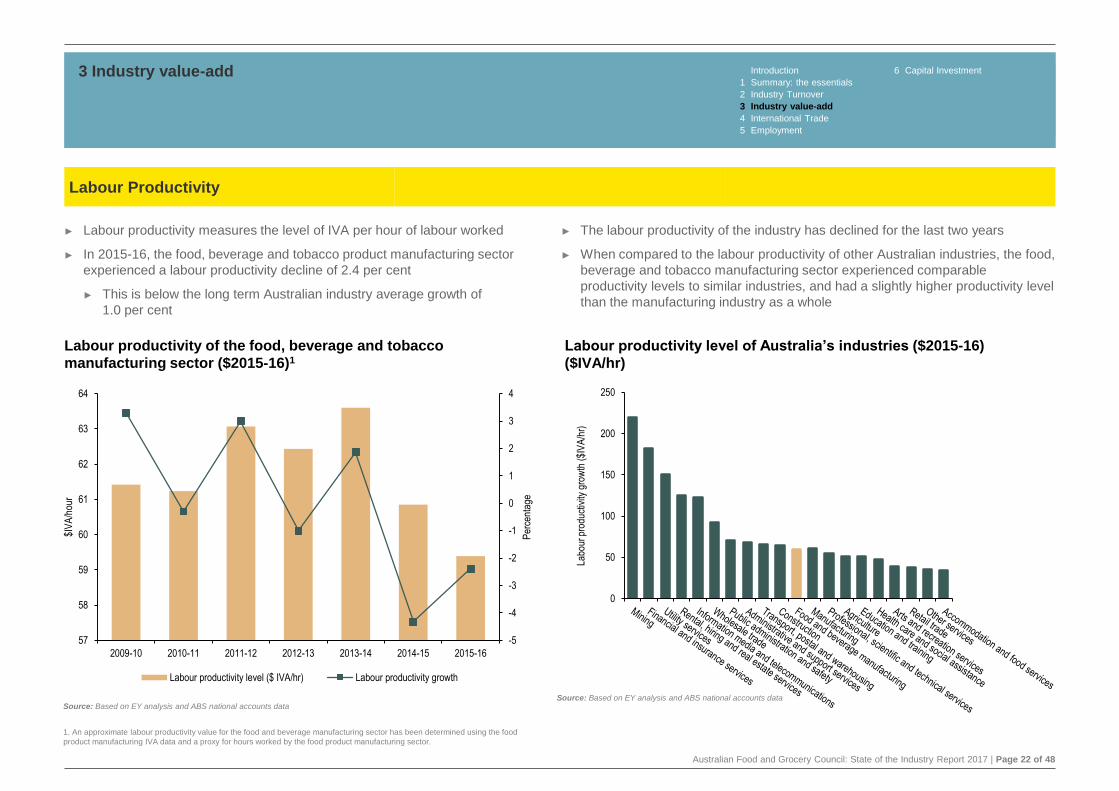
► Labour productivity measures the level of IVA per hour of labour worked
► In 2015-16, the food, beverage and tobacco product manufacturing sector
experienced a labour productivity decline of 2.4 per cent
► This is below the long term Australian industry average growth of
1.0 per cent
► The labour productivity of the industry has declined for the last two years
► When compared to the labour productivity of other Australian industries, the food,
beverage and tobacco manufacturing sector experienced comparable
productivity levels to similar industries, and had a slightly higher productivity level
than the manufacturing industry as a whole
3 Industry value-add Introduction 6 Capital Investment
1 Summary: the essentials
2 Industry Turnover
3 Industry value-add
4 International Trade
5 Employment
Labour Productivity
Labour productivity of the food, beverage and tobacco
manufacturing sector (2015-16)
Source: Based on EY analysis and ABS national accounts data
0
50
100
150
200
250
Labo
ur p
rodu
ctiv
ity g
row
th (
$IV
A/h
r)
-5
-4
-3
-2
-1
0
1
2
3
4
57
58
59
60
61
62
63
64
2009-10 2010-11 2011-12 2012-13 2013-14 2014-15 2015-16
Per
cent
age
$IV
A/h
our
Labour productivity level ($ IVA/hr) Labour productivity growth
Source: Based on EY analysis and ABS national accounts data
Labour productivity of the food, beverage and tobacco
manufacturing sector ($2015-16)1
Labour productivity level of Australia’s industries ($2015-16)
($IVA/hr)
1. An approximate labour productivity value for the food and beverage manufacturing sector has been determined using the food
product manufacturing IVA data and a proxy for hours worked by the food product manufacturing sector.
Australian Food and Grocery Council: State of the Industry Report 2017 | Page 23 of 48
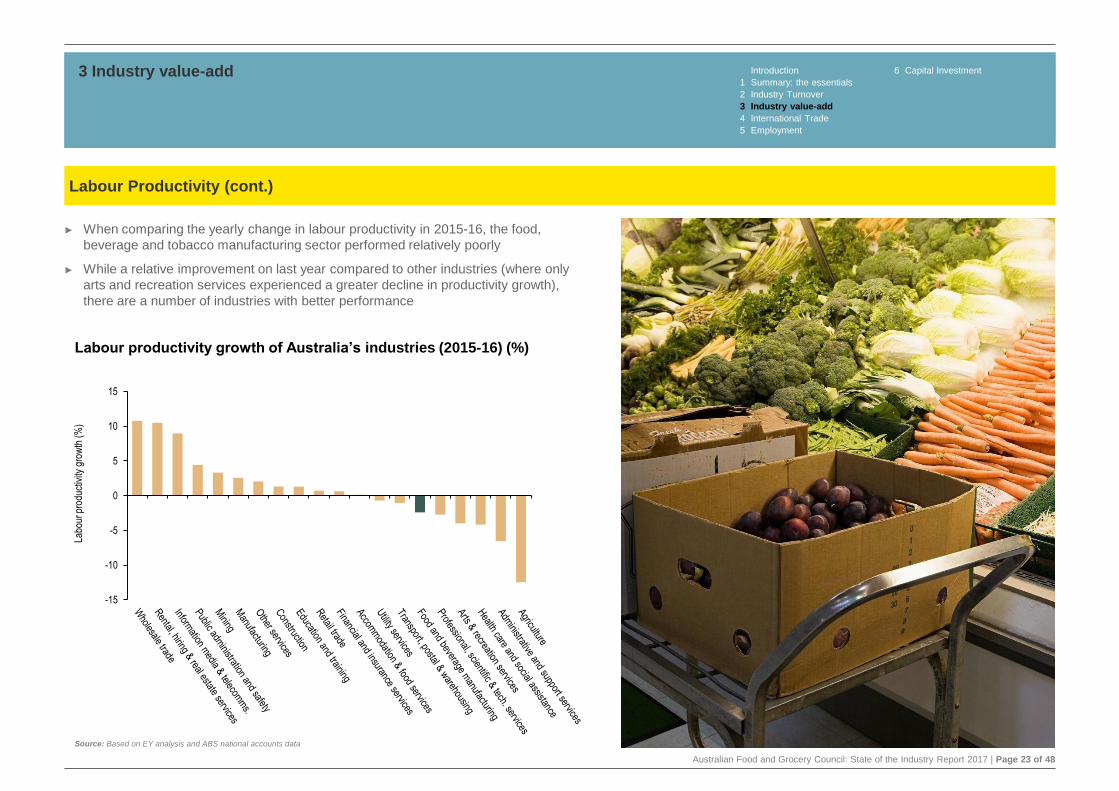
► When comparing the yearly change in labour productivity in 2015-16, the food,
beverage and tobacco manufacturing sector performed relatively poorly
► While a relative improvement on last year compared to other industries (where only
arts and recreation services experienced a greater decline in productivity growth),
there are a number of industries with better performance
3 Industry value-add Introduction 6 Capital Investment
1 Summary: the essentials
2 Industry Turnover
3 Industry value-add
4 International Trade
5 Employment
Source: Based on EY analysis and ABS national accounts data
Labour Productivity (cont.)
-15
-10
-5
0
5
10
15
Labo
ur p
rodu
ctiv
ity g
row
th (
%)
Labour productivity growth of Australia’s industries (2015-16) (%)

Australian Food and Grocery Council: State of the Industry Report 2017 | Page 24 of 48
4International Trade
Australian Food and Grocery Council: State of the Industry Report 2017 | Page 25 of 48
4 International Trade Introduction 6 Capital Investment
1 Summary: the essentials
2 Industry Turnover
3 Industry value-add
4 International Trade
5 Employment
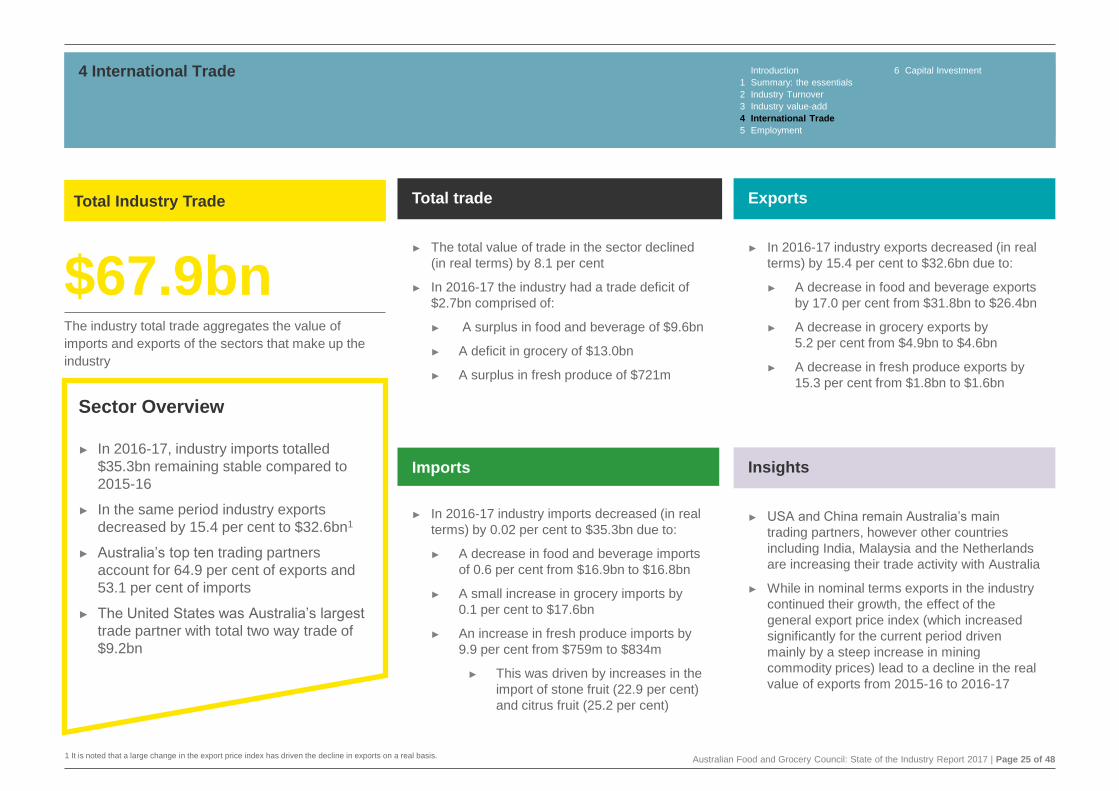
Total trade
► The total value of trade in the sector declined
(in real terms) by 8.1 per cent
► In 2016-17 the industry had a trade deficit of
$2.7bn comprised of:
► A surplus in food and beverage of $9.6bn
► A deficit in grocery of $13.0bn
► A surplus in fresh produce of $721m
Exports
► In 2016-17 industry exports decreased (in real
terms) by 15.4 per cent to $32.6bn due to:
► A decrease in food and beverage exports
by 17.0 per cent from $31.8bn to $26.4bn
► A decrease in grocery exports by
5.2 per cent from $4.9bn to $4.6bn
► A decrease in fresh produce exports by
15.3 per cent from $1.8bn to $1.6bn
Imports
► In 2016-17 industry imports decreased (in real
terms) by 0.02 per cent to $35.3bn due to:
► A decrease in food and beverage imports
of 0.6 per cent from $16.9bn to $16.8bn
► A small increase in grocery imports by
0.1 per cent to $17.6bn
► An increase in fresh produce imports by
9.9 per cent from $759m to $834m
► This was driven by increases in the
import of stone fruit (22.9 per cent)
and citrus fruit (25.2 per cent)
Insights
► USA and China remain Australia’s main
trading partners, however other countries
including India, Malaysia and the Netherlands
are increasing their trade activity with Australia
► While in nominal terms exports in the industry
continued their growth, the effect of the
general export price index (which increased
significantly for the current period driven
mainly by a steep increase in mining
commodity prices) lead to a decline in the real
value of exports from 2015-16 to 2016-17
Sector Overview
► In 2016-17, industry imports totalled
$35.3bn remaining stable compared to
2015-16
► In the same period industry exports
decreased by 15.4 per cent to $32.6bn1
► Australia’s top ten trading partners
account for 64.9 per cent of exports and
53.1 per cent of imports
► The United States was Australia’s largest
trade partner with total two way trade of
$9.2bn
Total Industry Trade
$67.9bnThe industry total trade aggregates the value of
imports and exports of the sectors that make up the
industry
1 It is noted that a large change in the export price index has driven the decline in exports on a real basis.
Australian Food and Grocery Council: State of the Industry Report 2017 | Page 26 of 48
0
5,000
10,000
15,000
20,000
25,000
30,000
Food and Beverage Grocery Fresh Produce
$m
Import
Export
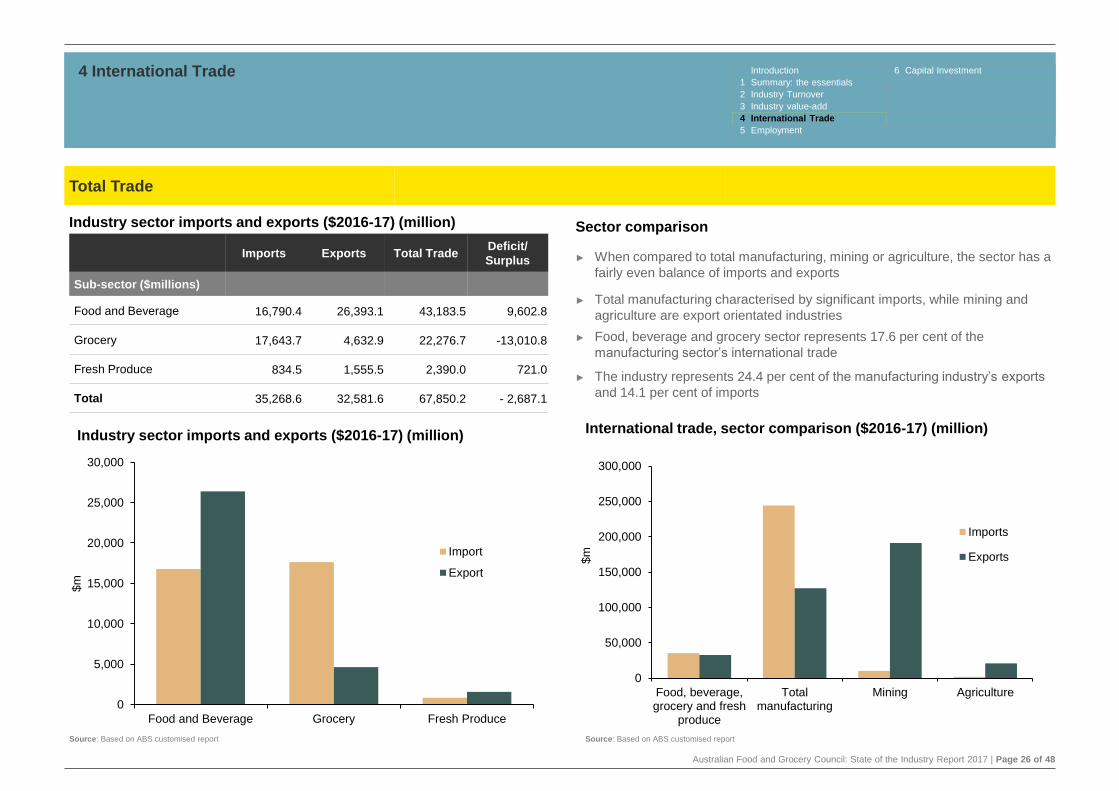
Sector comparison
► When compared to total manufacturing, mining or agriculture, the sector has a
fairly even balance of imports and exports
► Total manufacturing characterised by significant imports, while mining and
agriculture are export orientated industries
► Food, beverage and grocery sector represents 17.6 per cent of the
manufacturing sector’s international trade
► The industry represents 24.4 per cent of the manufacturing industry’s exports
and 14.1 per cent of imports
4 International Trade Dashboard 6 Capital Investment
1 Summary: the essentials
2 Industry Turnover
3 Industry value-add
4 International Trade
5 Employment
Total Trade
Industry sector imports and exports ($2016-17) (million)
Source: Based on ABS customised report
Imports Exports Total TradeDeficit/
Surplus
Sub-sector ($millions)
Food and Beverage 16,790.4 26,393.1 43,183.5 9,602.8
Grocery 17,643.7 4,632.9 22,276.7 -13,010.8
Fresh Produce 834.5 1,555.5 2,390.0 721.0
Total 35,268.6 32,581.6 67,850.2 - 2,687.1
0
50,000
100,000
150,000
200,000
250,000
300,000
Food, beverage,grocery and fresh
produce
Totalmanufacturing
Mining Agriculture
$m
Imports
Exports
International trade, sector comparison ($2016-17) (million)
Source: Based on ABS customised report
Introduction 6 Capital Investment
1 Summary: the essentials
2 Industry Turnover
3 Industry value-add
4 International Trade
5 Employment
Industry sector imports and exports ($2016-17) (million)
Australian Food and Grocery Council: State of the Industry Report 2017 | Page 27 of 48
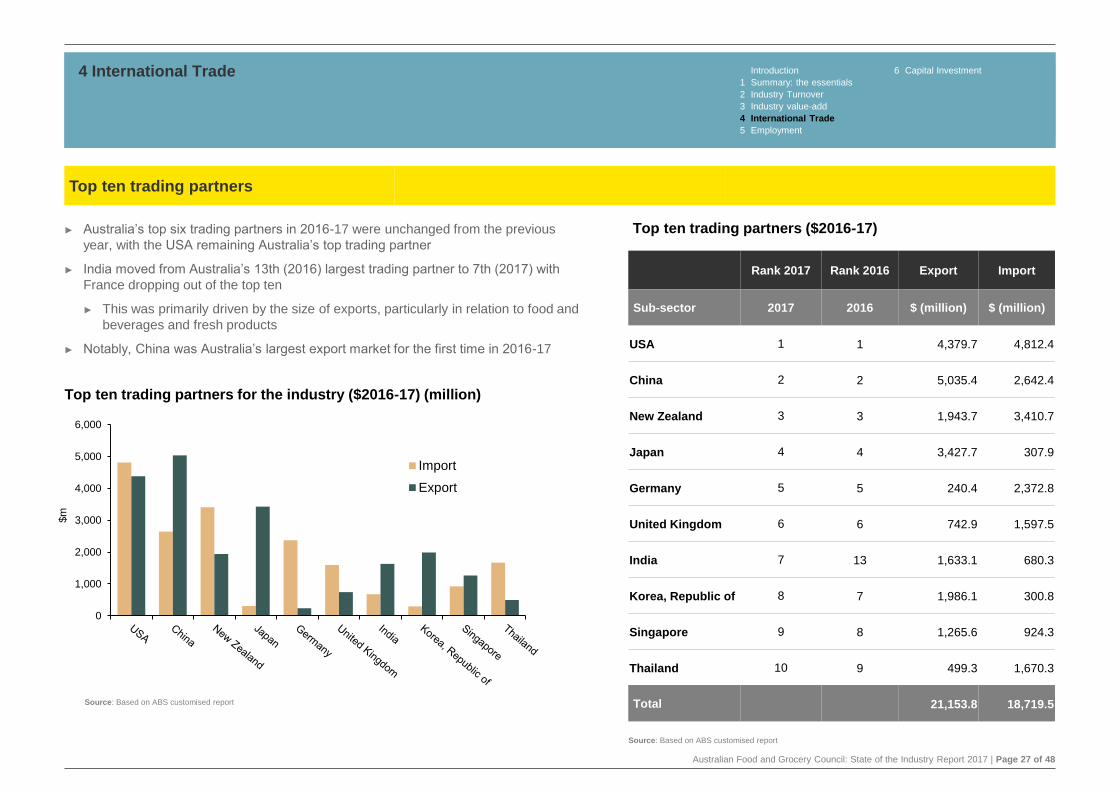
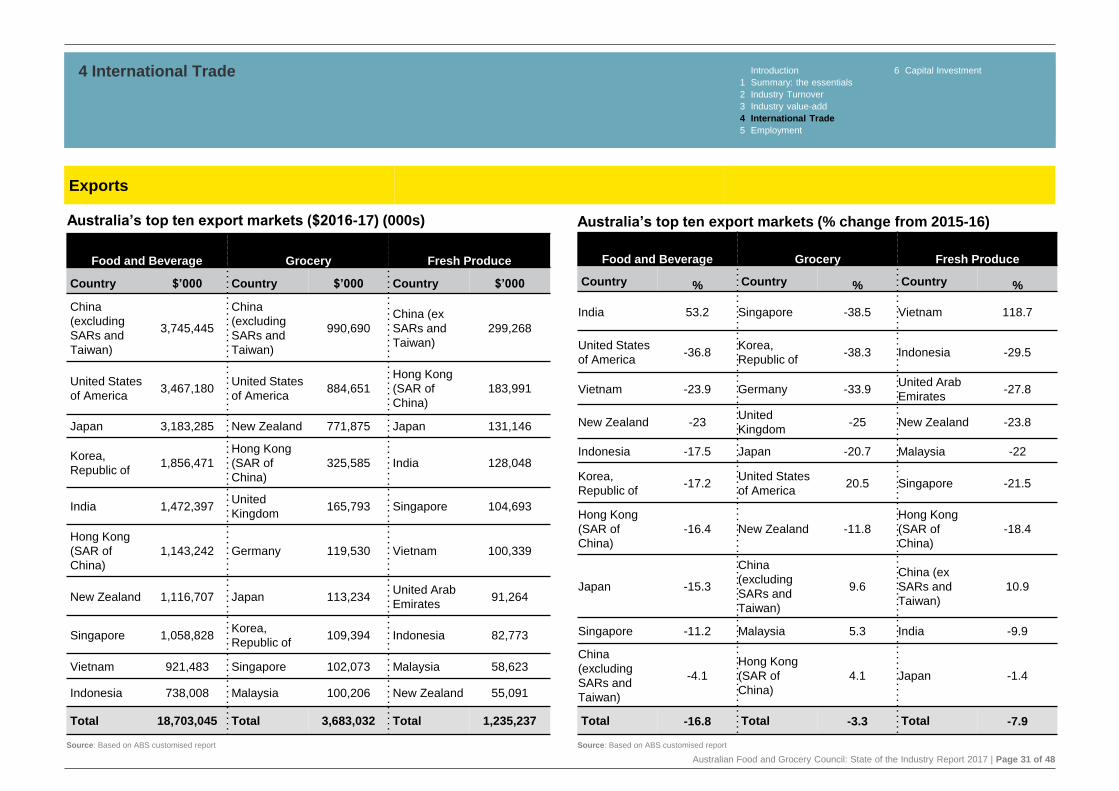
► Australia’s top six trading partners in 2016-17 were unchanged from the previous
year, with the USA remaining Australia’s top trading partner
► India moved from Australia’s 13th (2016) largest trading partner to 7th (2017) with
France dropping out of the top ten
► This was primarily driven by the size of exports, particularly in relation to food and
beverages and fresh products
► Notably, China was Australia’s largest export market for the first time in 2016-17
4 International Trade Introduction 6 Capital Investment
1 Summary: the essentials
2 Industry Turnover
3 Industry value-add
4 International Trade
5 Employment
Top ten trading partners for the industry ($2016-17) (million)
Top ten trading partners
Top ten trading partners ($2016-17)
Rank 2017 Rank 2016 Export Import
Sub-sector 2017 2016 $ (million) $ (million)
USA 1 1 4,379.7 4,812.4
China 2 2 5,035.4 2,642.4
New Zealand 3 3 1,943.7 3,410.7
Japan 4 4 3,427.7 307.9
Germany 5 5 240.4 2,372.8
United Kingdom 6 6 742.9 1,597.5
India 7 13 1,633.1 680.3
Korea, Republic of 8 7 1,986.1 300.8
Singapore 9 8 1,265.6 924.3
Thailand 10 9 499.3 1,670.3
Total 21,153.8 18,719.5
0
1,000
2,000
3,000
4,000
5,000
6,000
$m
Import
Export
Source: Based on ABS customised report
Source: Based on ABS customised report
Australian Food and Grocery Council: State of the Industry Report 2017 | Page 28 of 48
4 International Trade Introduction 6 Capital Investment
1 Summary: the essentials
2 Industry Turnover
3 Industry value-add
4 International Trade
5 Employment
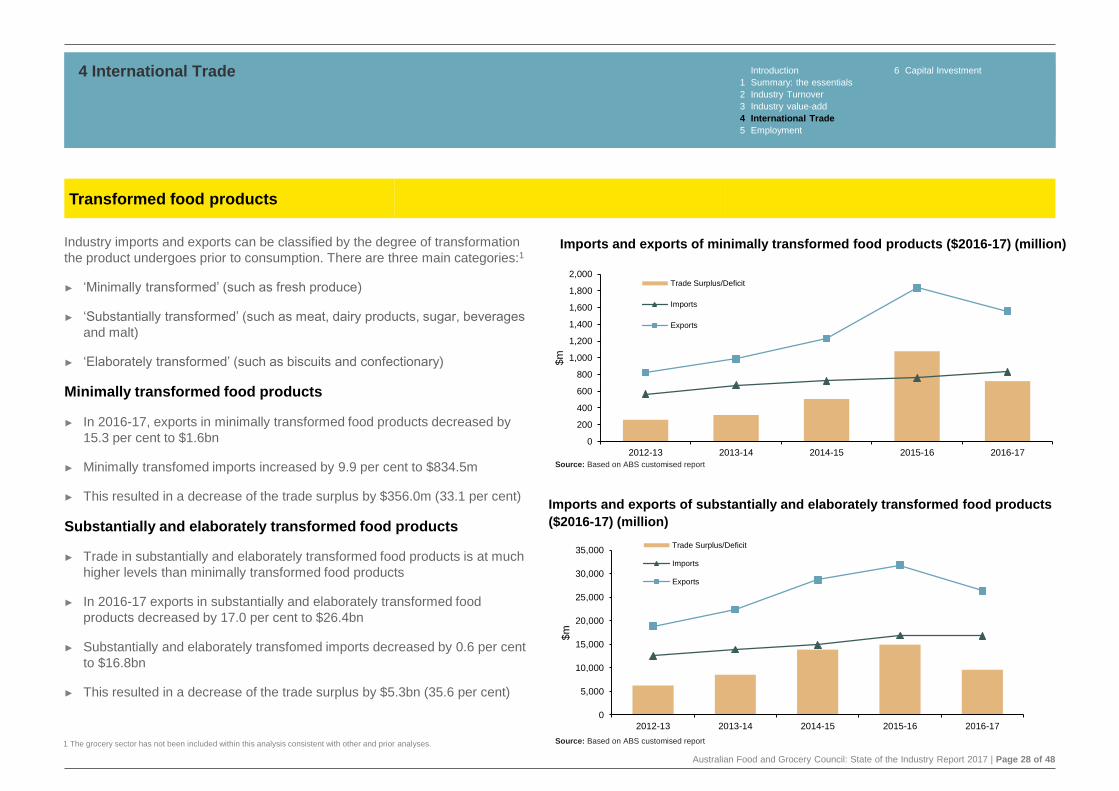
Industry imports and exports can be classified by the degree of transformation
the product undergoes prior to consumption. There are three main categories:1
► ‘Minimally transformed’ (such as fresh produce)
► ‘Substantially transformed’ (such as meat, dairy products, sugar, beverages
and malt)
► ‘Elaborately transformed’ (such as biscuits and confectionary)
Minimally transformed food products
► In 2016-17, exports in minimally transformed food products decreased by
15.3 per cent to $1.6bn
► Minimally transfomed imports increased by 9.9 per cent to $834.5m
► This resulted in a decrease of the trade surplus by $356.0m (33.1 per cent)
Substantially and elaborately transformed food products
► Trade in substantially and elaborately transformed food products is at much
higher levels than minimally transformed food products
► In 2016-17 exports in substantially and elaborately transformed food
products decreased by 17.0 per cent to $26.4bn
► Substantially and elaborately transfomed imports decreased by 0.6 per cent
to $16.8bn
► This resulted in a decrease of the trade surplus by $5.3bn (35.6 per cent)
Transformed food products
0
200
400
600
800
1,000
1,200
1,400
1,600
1,800
2,000
2012-13 2013-14 2014-15 2015-16 2016-17
$m
Trade Surplus/Deficit
Imports
Exports
Imports and exports of minimally transformed food products ($2016-17) (million)
0
5,000
10,000
15,000
20,000
25,000
30,000
35,000
2012-13 2013-14 2014-15 2015-16 2016-17
$m
Trade Surplus/Deficit
Imports
Exports
Imports and exports of substantially and elaborately transformed food products
($2016-17) (million)
Source: Based on ABS customised report
Source: Based on ABS customised report1 The grocery sector has not been included within this analysis consistent with other and prior analyses.
Australian Food and Grocery Council: State of the Industry Report 2017 | Page 29 of 48
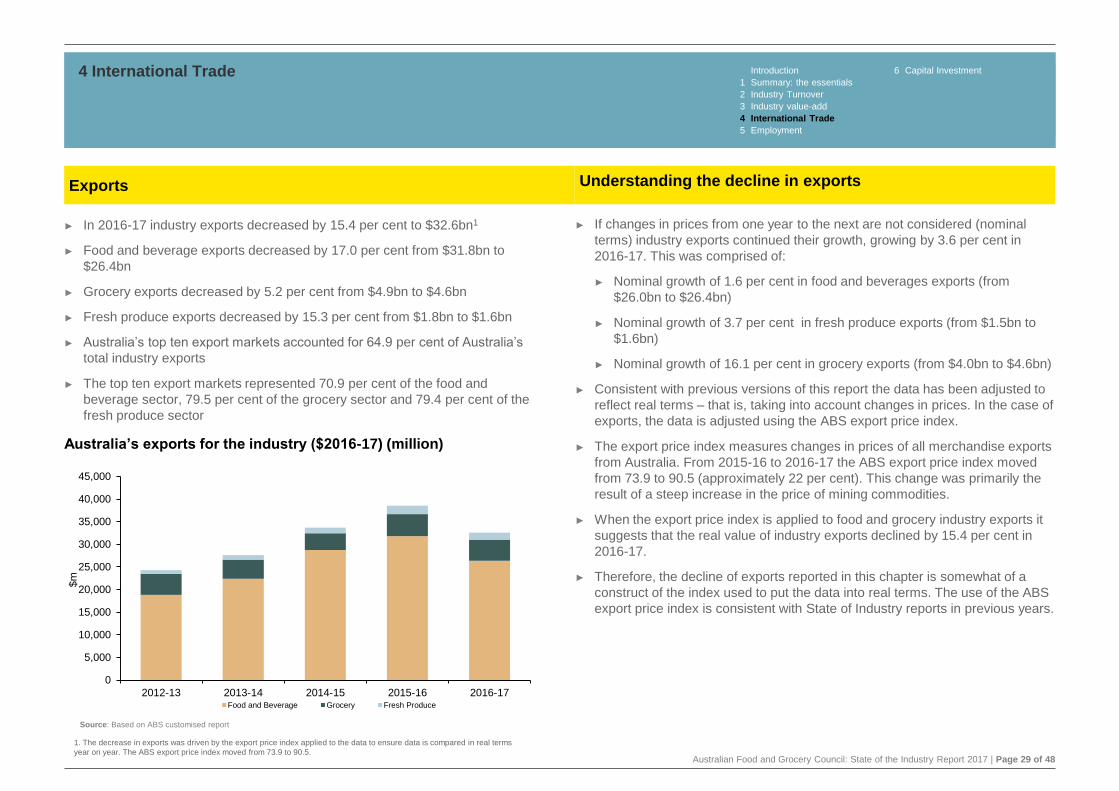
► In 2016-17 industry exports decreased by 15.4 per cent to $32.6bn1
► Food and beverage exports decreased by 17.0 per cent from $31.8bn to
$26.4bn
► Grocery exports decreased by 5.2 per cent from $4.9bn to $4.6bn
► Fresh produce exports decreased by 15.3 per cent from $1.8bn to $1.6bn
► Australia’s top ten export markets accounted for 64.9 per cent of Australia’s
total industry exports
► The top ten export markets represented 70.9 per cent of the food and
beverage sector, 79.5 per cent of the grocery sector and 79.4 per cent of the
fresh produce sector
4 International Trade Introduction 6 Capital Investment
1 Summary: the essentials
2 Industry Turnover
3 Industry value-add
4 International Trade
5 Employment
Exports Understanding the decline in exports
Source: Based on ABS customised report
Australia’s exports for the industry ($2016-17) (million)
0
5,000
10,000
15,000
20,000
25,000
30,000
35,000
40,000
45,000
2012-13 2013-14 2014-15 2015-16 2016-17
$m
Food and Beverage Grocery Fresh Produce
1. The decrease in exports was driven by the export price index applied to the data to ensure data is compared in real terms
year on year. The ABS export price index moved from 73.9 to 90.5.
► If changes in prices from one year to the next are not considered (nominal
terms) industry exports continued their growth, growing by 3.6 per cent in
2016-17. This was comprised of:
► Nominal growth of 1.6 per cent in food and beverages exports (from
$26.0bn to $26.4bn)
► Nominal growth of 3.7 per cent in fresh produce exports (from $1.5bn to
$1.6bn)
► Nominal growth of 16.1 per cent in grocery exports (from $4.0bn to $4.6bn)
► Consistent with previous versions of this report the data has been adjusted to
reflect real terms – that is, taking into account changes in prices. In the case of
exports, the data is adjusted using the ABS export price index.
► The export price index measures changes in prices of all merchandise exports
from Australia. From 2015-16 to 2016-17 the ABS export price index moved
from 73.9 to 90.5 (approximately 22 per cent). This change was primarily the
result of a steep increase in the price of mining commodities.
► When the export price index is applied to food and grocery industry exports it
suggests that the real value of industry exports declined by 15.4 per cent in
2016-17.
► Therefore, the decline of exports reported in this chapter is somewhat of a
construct of the index used to put the data into real terms. The use of the ABS
export price index is consistent with State of Industry reports in previous years.
Australian Food and Grocery Council: State of the Industry Report 2017 | Page 30 of 48
4 International Trade Introduction 6 Capital Investment
1 Summary: the essentials
2 Industry Turnover
3 Industry value-add
4 International Trade
5 Employment
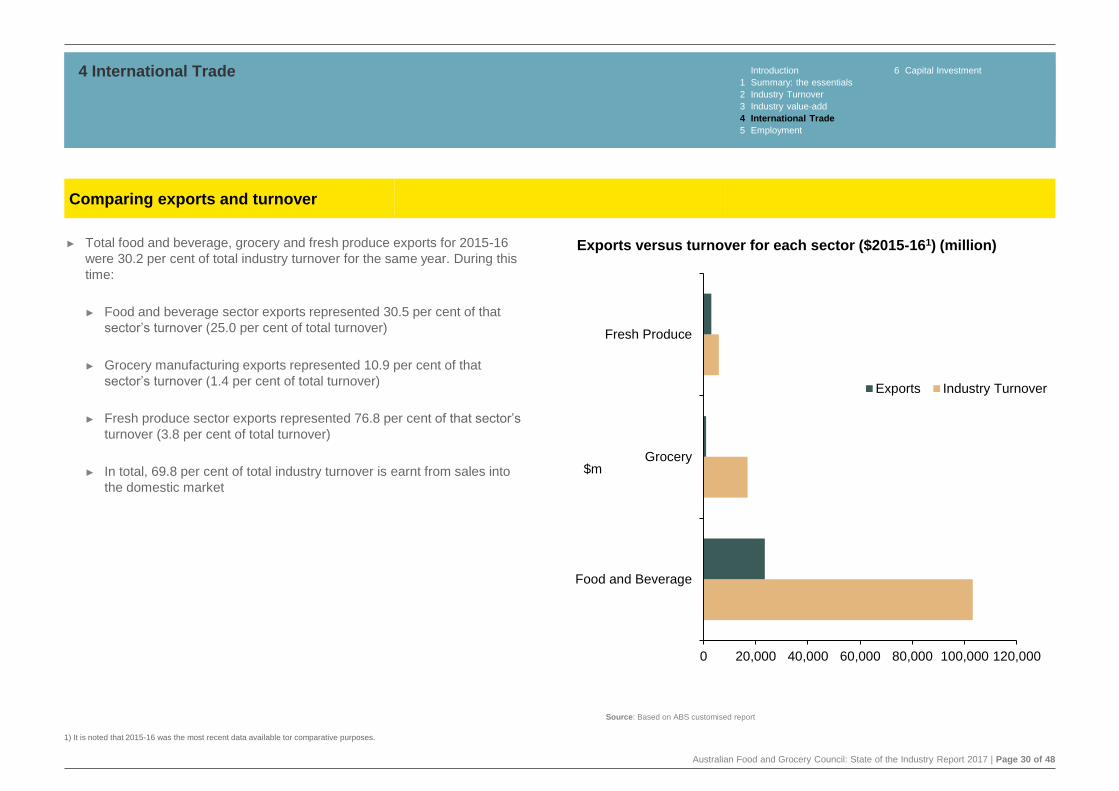
► Total food and beverage, grocery and fresh produce exports for 2015-16
were 30.2 per cent of total industry turnover for the same year. During this
time:
► Food and beverage sector exports represented 30.5 per cent of that
sector’s turnover (25.0 per cent of total turnover)
► Grocery manufacturing exports represented 10.9 per cent of that
sector’s turnover (1.4 per cent of total turnover)
► Fresh produce sector exports represented 76.8 per cent of that sector’s
turnover (3.8 per cent of total turnover)
► In total, 69.8 per cent of total industry turnover is earnt from sales into
the domestic market
Comparing exports and turnover
Exports versus turnover for each sector ($2015-161) (million)
0 20,000 40,000 60,000 80,000 100,000 120,000
Food and Beverage
Grocery
Fresh Produce
$m
Exports Industry Turnover
1) It is noted that 2015-16 was the most recent data available tor comparative purposes.
Source: Based on ABS customised report
Australian Food and Grocery Council: State of the Industry Report 2017 | Page 31 of 48
4 International Trade Introduction 6 Capital Investment
1 Summary: the essentials
2 Industry Turnover
3 Industry value-add
4 International Trade
5 Employment
Exports
Australia’s top ten export markets (% change from 2015-16)
Food and Beverage Grocery Fresh Produce
Country % Country % Country %
India 53.2 Singapore -38.5 Vietnam 118.7
United States
of America-36.8
Korea,
Republic of -38.3 Indonesia -29.5
Vietnam -23.9 Germany -33.9United Arab
Emirates -27.8
New Zealand -23United
Kingdom -25 New Zealand -23.8
Indonesia -17.5 Japan -20.7 Malaysia -22
Korea,
Republic of-17.2
United States
of America 20.5 Singapore -21.5
Hong Kong
(SAR of
China)
-16.4 New Zealand -11.8
Hong Kong
(SAR of
China)
-18.4
Japan -15.3
China
(excluding
SARs and
Taiwan)
9.6
China (ex
SARs and
Taiwan)
10.9
Singapore -11.2 Malaysia 5.3 India -9.9
China
(excluding
SARs and
Taiwan)
-4.1
Hong Kong
(SAR of
China)
4.1 Japan -1.4
Total -16.8 Total -3.3 Total -7.9
Food and Beverage Grocery Fresh Produce
Country $’000 Country $’000 Country $’000
China
(excluding
SARs and
Taiwan)
3,745,445
China
(excluding
SARs and
Taiwan)
990,690
China (ex
SARs and
Taiwan)
299,268
United States
of America3,467,180
United States
of America 884,651
Hong Kong
(SAR of
China)
183,991
Japan 3,183,285 New Zealand 771,875 Japan 131,146
Korea,
Republic of1,856,471
Hong Kong
(SAR of
China)
325,585 India 128,048
India 1,472,397 United
Kingdom 165,793 Singapore 104,693
Hong Kong
(SAR of
China)
1,143,242 Germany 119,530 Vietnam 100,339
New Zealand 1,116,707 Japan 113,234 United Arab
Emirates 91,264
Singapore 1,058,828 Korea,
Republic of 109,394 Indonesia 82,773
Vietnam 921,483 Singapore 102,073 Malaysia 58,623
Indonesia 738,008 Malaysia 100,206 New Zealand 55,091
Total 18,703,045 Total 3,683,032 Total 1,235,237
Australia’s top ten export markets ($2016-17) (000s)
Source: Based on ABS customised report Source: Based on ABS customised report
Australian Food and Grocery Council: State of the Industry Report 2017 | Page 32 of 48
4 International Trade Introduction 6 Capital Investment
1 Summary: the essentials
2 Industry Turnover
3 Industry value-add
4 International Trade
5 Employment
Exports
Source: Based on ABS customised report
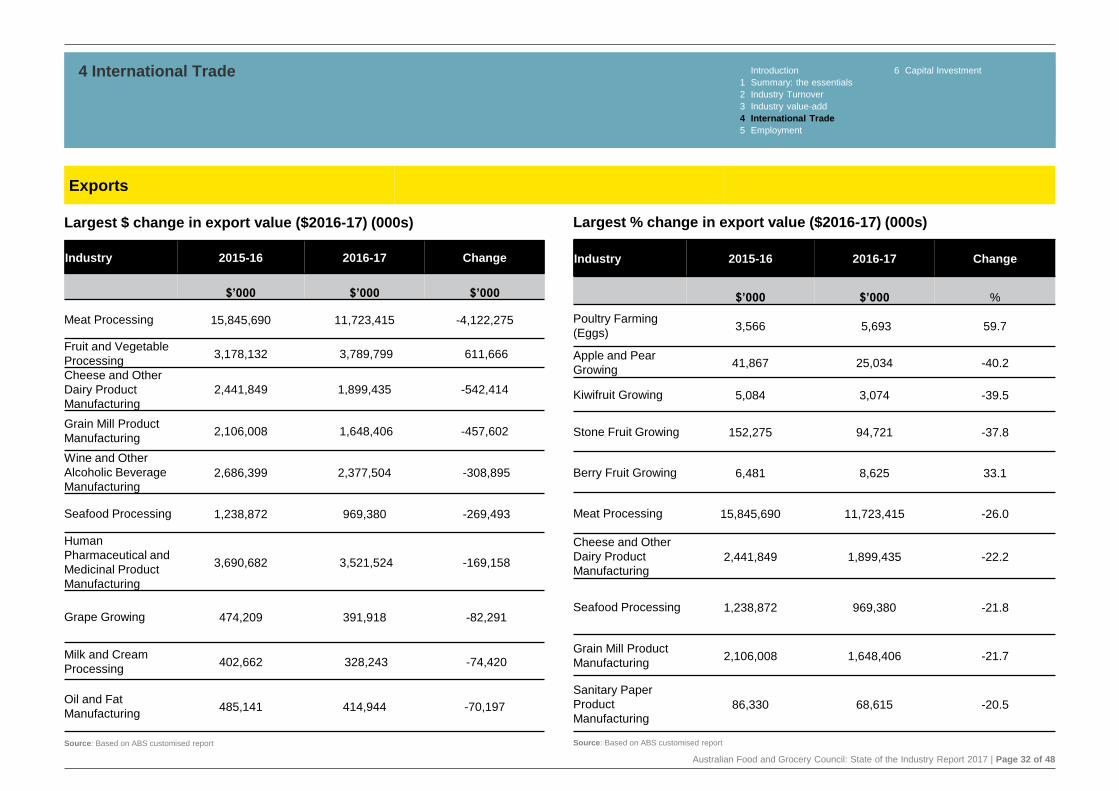
Largest $ change in export value ($2016-17) (000s)
Industry 2015-16 2016-17 Change
$’000 $’000 $’000
Meat Processing 15,845,690 11,723,415 -4,122,275
Fruit and Vegetable
Processing3,178,132 3,789,799 611,666
Cheese and Other
Dairy Product
Manufacturing
2,441,849 1,899,435 -542,414
Grain Mill Product
Manufacturing2,106,008 1,648,406 -457,602
Wine and Other
Alcoholic Beverage
Manufacturing2,686,399 2,377,504 -308,895
Seafood Processing 1,238,872 969,380 -269,493
Human
Pharmaceutical and
Medicinal Product
Manufacturing
3,690,682 3,521,524 -169,158
Grape Growing 474,209 391,918 -82,291
Milk and Cream
Processing402,662 328,243 -74,420
Oil and Fat
Manufacturing485,141 414,944 -70,197
Largest % change in export value ($2016-17) (000s)
Industry 2015-16 2016-17 Change
$’000 $’000 %
Poultry Farming
(Eggs)3,566 5,693 59.7
Apple and Pear
Growing41,867 25,034 -40.2
Kiwifruit Growing 5,084 3,074 -39.5
Stone Fruit Growing 152,275 94,721 -37.8
Berry Fruit Growing 6,481 8,625 33.1
Meat Processing 15,845,690 11,723,415 -26.0
Cheese and Other
Dairy Product
Manufacturing2,441,849 1,899,435 -22.2
Seafood Processing 1,238,872 969,380 -21.8
Grain Mill Product
Manufacturing2,106,008 1,648,406 -21.7
Sanitary Paper
Product
Manufacturing86,330 68,615 -20.5
Source: Based on ABS customised report

Australian Food and Grocery Council: State of the Industry Report 2017 | Page 33 of 48
49%
18%
12%
8%
7%
3%
1%2%
0%
Victoria; $764m
Queensland; $279m
New South Wales; $189m
South Australia; $131m
Western Australia; $105m
Tasmania; $51m
Northern Territory; $7.9m
Re-exports; $28m
No state details (a); $00m
State of origin of exports
► Victoria and Queensland are the industry’s top two exporting states
► Queensland is the largest exporter in the food and beverage sector with
28 per cent ($7.3bn), followed by Victoria 27 per cent ($7.1bn) and NSW with
20 per cent ($5.4bn)
► NSW is the largest exporter of grocery produce with 40 per cent ($1.9bn) of the
industry’s total grocery sector export. Victoria exports 39 per cent ($1.8bn)
► Victoria is the dominant exporter of fresh produce with 49 per cent ($763.8m) of
the industry’s fresh produce exports. Queensland is the second largest exporter
of fresh produce with 18 per cent ($279.0m), followed by NSW 12 per cent
($188.7m).
4 International Trade Introduction 6 Capital Investment
1 Summary: the essentials
2 Industry Turnover
3 Industry value-add
4 International Trade
5 Employment
27%
28%
20%
14%
6%
2%0%
2%1%
Victoria; $7,138m
Queensland; $7,324m
New South Wales; $5,356m
South Australia; $3,680m
Western Australia; $1,595m
Tasmania; $433m
Northern Territory; $65m
Re-exports; $474m
No state details (a); $328m
Exports
Grocery sector exports by state of origin ($2016-17) (million)
Fresh Produce sector exports by state of origin ($2016-17)
(million)
Source: Based on ABS customised report
39%
4%
40%
3%
3%0%
0%
11%
0%
Victoria; $1,785m
Queensland; $195m
New South Wales; $1,862m
South Australia; $149m
Western Australia; $118m
Tasmania; $7.2m
Northern Territory; $0.9m
Re-exports; $515m
No state details (a); $1.9m
Food and beverage sector exports by state of origin ($2016-
17) (million)
Source: Based on ABS customised report
Source: Based on ABS customised report
Australian Food and Grocery Council: State of the Industry Report 2017 | Page 34 of 48
0 20,000 40,000 60,000 80,000 100,000
Food and Beverage
Grocery
Fresh Produce
$m
Imports Industry Turnover
Introduction 6 Capital Investment
1 Summary: the essentials
2 Industry Turnover
3 Industry value-add
4 International Trade
5 Employment
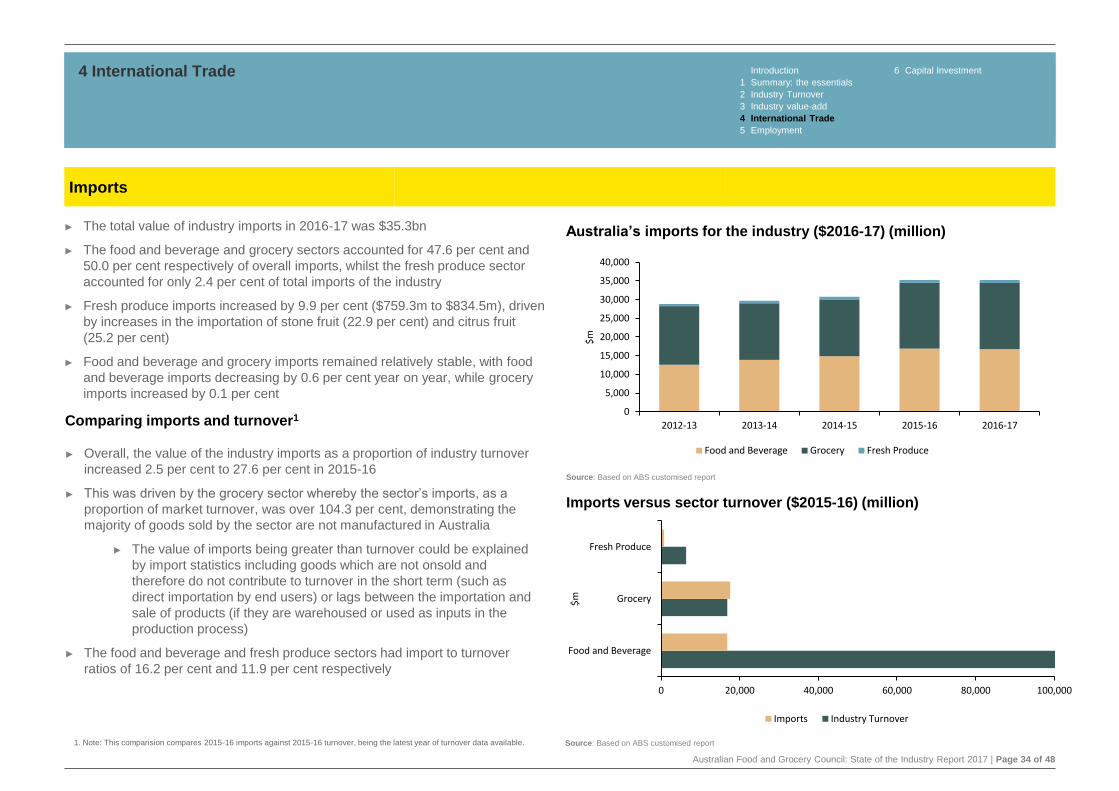
► The total value of industry imports in 2016-17 was $35.3bn
► The food and beverage and grocery sectors accounted for 47.6 per cent and
50.0 per cent respectively of overall imports, whilst the fresh produce sector
accounted for only 2.4 per cent of total imports of the industry
► Fresh produce imports increased by 9.9 per cent ($759.3m to $834.5m), driven
by increases in the importation of stone fruit (22.9 per cent) and citrus fruit
(25.2 per cent)
► Food and beverage and grocery imports remained relatively stable, with food
and beverage imports decreasing by 0.6 per cent year on year, while grocery
imports increased by 0.1 per cent
4 International Trade
Imports
Australia’s imports for the industry ($2016-17) (million)
Source: Based on ABS customised report
Imports versus sector turnover ($2015-16) (million)
Source: Based on ABS customised report
0
5,000
10,000
15,000
20,000
25,000
30,000
35,000
40,000
2012-13 2013-14 2014-15 2015-16 2016-17
$m
Food and Beverage Grocery Fresh Produce
Comparing imports and turnover1
► Overall, the value of the industry imports as a proportion of industry turnover
increased 2.5 per cent to 27.6 per cent in 2015-16
► This was driven by the grocery sector whereby the sector’s imports, as a
proportion of market turnover, was over 104.3 per cent, demonstrating the
majority of goods sold by the sector are not manufactured in Australia
► The value of imports being greater than turnover could be explained
by import statistics including goods which are not onsold and
therefore do not contribute to turnover in the short term (such as
direct importation by end users) or lags between the importation and
sale of products (if they are warehoused or used as inputs in the
production process)
► The food and beverage and fresh produce sectors had import to turnover
ratios of 16.2 per cent and 11.9 per cent respectively
1. Note: This comparision compares 2015-16 imports against 2015-16 turnover, being the latest year of turnover data available.
Australian Food and Grocery Council: State of the Industry Report 2017 | Page 35 of 48
Introduction 6 Capital Investment
1 Summary: the essentials
2 Industry Turnover
3 Industry value-add
4 International Trade
5 Employment
Australia’s top import markets
► In 2016-17, the top ten import markets accounted for a combined 53.1 per cent
of Australia’s total industry imports
► The fresh produce and grocery sectors imported 82.9 per cent and
72.1 per cent of goods from the top ten markets respectively suggesting a
narrow range of international supply markets
► The USA, China and New Zealand continue to dominate as the main supplier
countries for imports accounting for 36.1 per cent of all imports within the
industry
► The USA contributed 19.9 per cent of all industry imports, providing an overall
total of $4.8bn
► The USA and New Zealand continued to be Australia’s top import suppliers for
fresh produce and food and beverage sector
► The value of New Zealand and Netherland’s imports of fresh produce grew by
32.6 per cent and 38.8 per cent respectively
4 International Trade
Imports
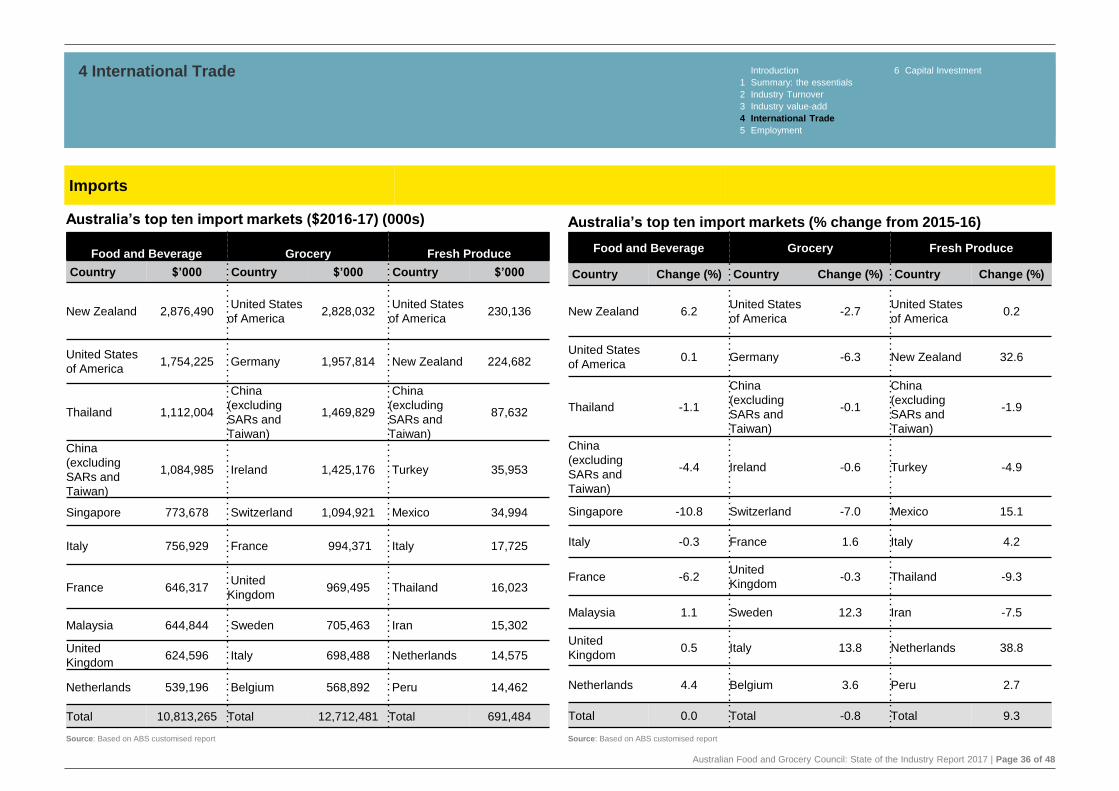
Australian Food and Grocery Council: State of the Industry Report 2017 | Page 36 of 48
4 International Trade Introduction 6 Capital Investment
1 Summary: the essentials
2 Industry Turnover
3 Industry value-add
4 International Trade
5 Employment
Imports
Food and Beverage Grocery Fresh Produce
Country Change (%) Country Change (%) Country Change (%)
New Zealand 6.2United States
of America-2.7
United States
of America0.2
United States
of America0.1 Germany -6.3 New Zealand 32.6
Thailand -1.1
China
(excluding
SARs and
Taiwan)
-0.1
China
(excluding
SARs and
Taiwan)
-1.9
China
(excluding
SARs and
Taiwan)
-4.4 Ireland -0.6 Turkey -4.9
Singapore -10.8 Switzerland -7.0 Mexico 15.1
Italy -0.3 France 1.6 Italy 4.2
France -6.2United
Kingdom-0.3 Thailand -9.3
Malaysia 1.1 Sweden 12.3 Iran -7.5
United
Kingdom0.5 Italy 13.8 Netherlands 38.8
Netherlands 4.4 Belgium 3.6 Peru 2.7
Total 0.0 Total -0.8 Total 9.3
Australia’s top ten import markets (% change from 2015-16)
Food and Beverage Grocery Fresh Produce
Country $’000 Country $’000 Country $’000
New Zealand 2,876,490 United States
of America 2,828,032
United States
of America 230,136
United States
of America1,754,225 Germany 1,957,814 New Zealand 224,682
Thailand 1,112,004
China
(excluding
SARs and
Taiwan)
1,469,829
China
(excluding
SARs and
Taiwan)
87,632
China
(excluding
SARs and
Taiwan)
1,084,985 Ireland 1,425,176 Turkey 35,953
Singapore 773,678 Switzerland 1,094,921 Mexico 34,994
Italy 756,929 France 994,371 Italy 17,725
France 646,317 United
Kingdom 969,495 Thailand 16,023
Malaysia 644,844 Sweden 705,463 Iran 15,302
United
Kingdom624,596 Italy 698,488 Netherlands 14,575
Netherlands 539,196 Belgium 568,892 Peru 14,462
Total 10,813,265 Total 12,712,481 Total 691,484
Australia’s top ten import markets ($2016-17) (000s)
Source: Based on ABS customised report Source: Based on ABS customised report
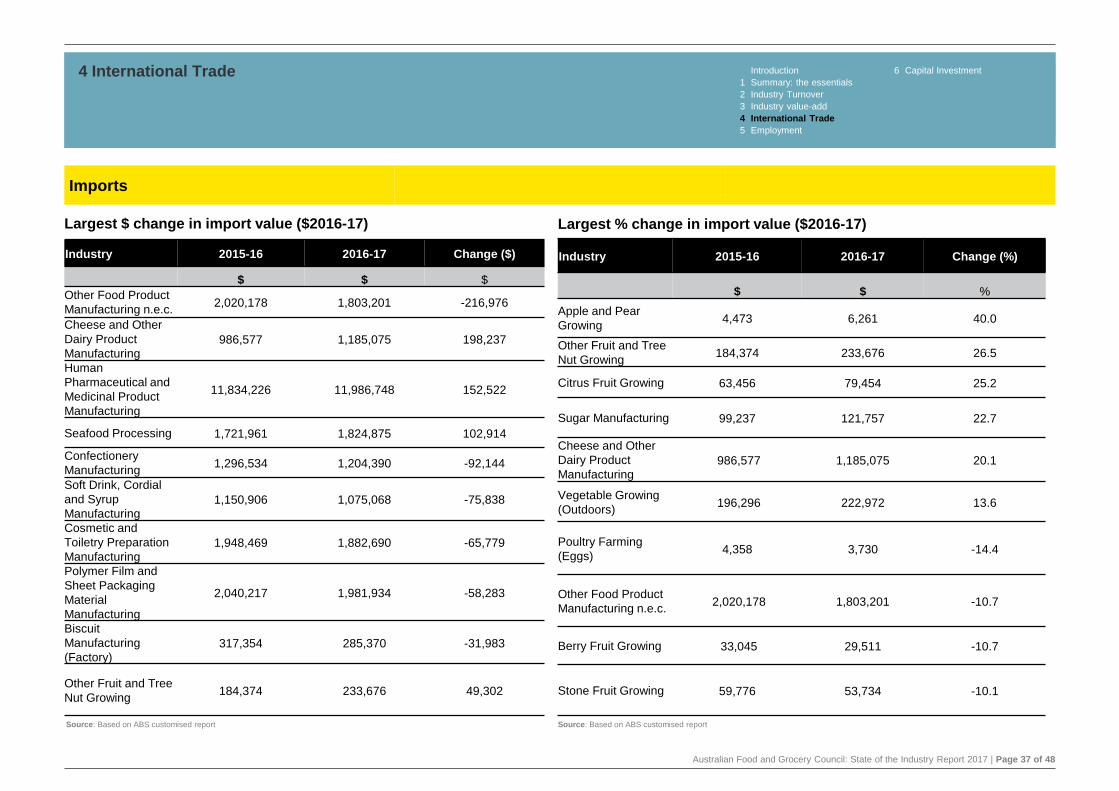
Australian Food and Grocery Council: State of the Industry Report 2017 | Page 37 of 48
4 International Trade Introduction 6 Capital Investment
1 Summary: the essentials
2 Industry Turnover
3 Industry value-add
4 International Trade
5 Employment
Imports
Largest % change in import value ($2016-17)
Industry 2015-16 2016-17 Change (%)
$ $ %
Apple and Pear
Growing4,473 6,261 40.0
Other Fruit and Tree
Nut Growing184,374 233,676 26.5
Citrus Fruit Growing 63,456 79,454 25.2
Sugar Manufacturing 99,237 121,757 22.7
Cheese and Other
Dairy Product
Manufacturing986,577 1,185,075 20.1
Vegetable Growing
(Outdoors)196,296 222,972 13.6
Poultry Farming
(Eggs)4,358 3,730 -14.4
Other Food Product
Manufacturing n.e.c.2,020,178 1,803,201 -10.7
Berry Fruit Growing 33,045 29,511 -10.7
Stone Fruit Growing 59,776 53,734 -10.1
Largest $ change in import value ($2016-17)
Industry 2015-16 2016-17 Change ($)
$ $ $
Other Food Product
Manufacturing n.e.c.2,020,178 1,803,201 -216,976
Cheese and Other
Dairy Product
Manufacturing986,577 1,185,075 198,237
Human
Pharmaceutical and
Medicinal Product
Manufacturing
11,834,226 11,986,748 152,522
Seafood Processing 1,721,961 1,824,875 102,914
Confectionery
Manufacturing1,296,534 1,204,390 -92,144
Soft Drink, Cordial
and Syrup
Manufacturing1,150,906 1,075,068 -75,838
Cosmetic and
Toiletry Preparation
Manufacturing1,948,469 1,882,690 -65,779
Polymer Film and
Sheet Packaging
Material
Manufacturing
2,040,217 1,981,934 -58,283
Biscuit
Manufacturing
(Factory)317,354 285,370 -31,983
Other Fruit and Tree
Nut Growing184,374 233,676 49,302
Source: Based on ABS customised report Source: Based on ABS customised report

Australian Food and Grocery Council: State of the Industry Report 2017 | Page 38 of 48
5Employment
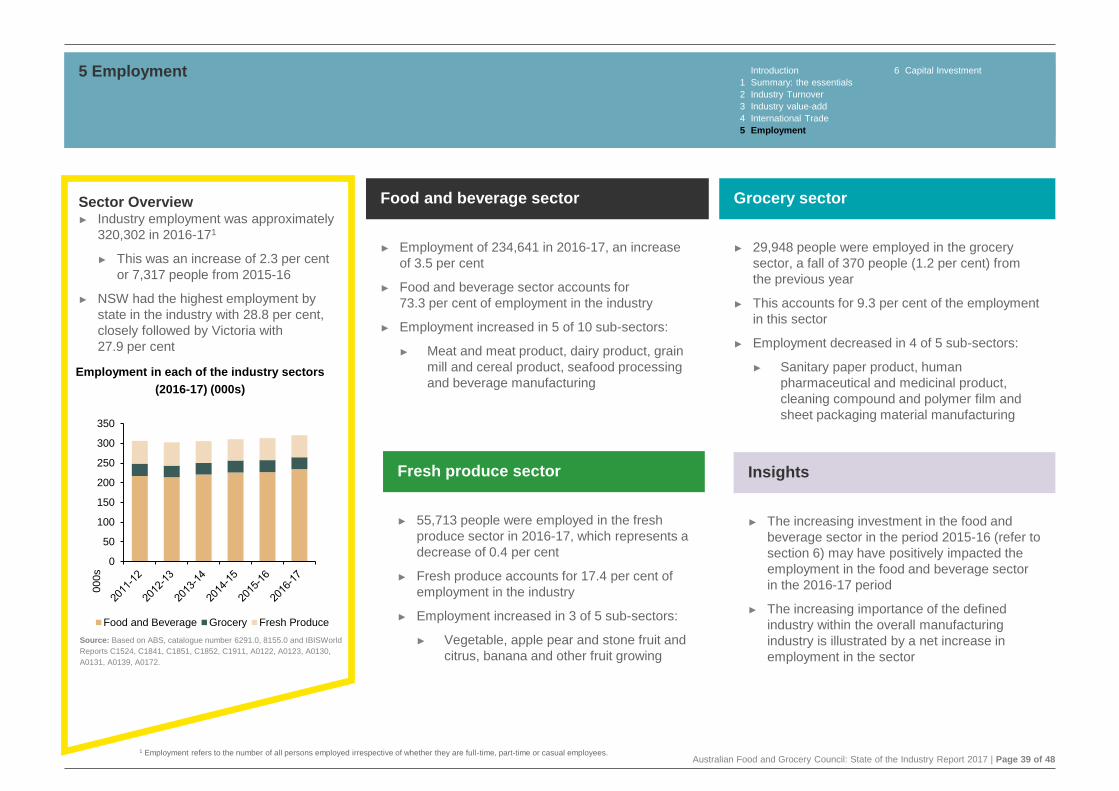
Australian Food and Grocery Council: State of the Industry Report 2017 | Page 39 of 48
5 Employment Introduction 6 Capital Investment
1 Summary: the essentials
2 Industry Turnover
3 Industry value-add
4 International Trade
5 Employment
Food and beverage sector
► Employment of 234,641 in 2016-17, an increase
of 3.5 per cent
► Food and beverage sector accounts for
73.3 per cent of employment in the industry
► Employment increased in 5 of 10 sub-sectors:
► Meat and meat product, dairy product, grain
mill and cereal product, seafood processing
and beverage manufacturing
Grocery sector
► 29,948 people were employed in the grocery
sector, a fall of 370 people (1.2 per cent) from
the previous year
► This accounts for 9.3 per cent of the employment
in this sector
► Employment decreased in 4 of 5 sub-sectors:
► Sanitary paper product, human
pharmaceutical and medicinal product,
cleaning compound and polymer film and
sheet packaging material manufacturing
Fresh produce sector
► 55,713 people were employed in the fresh
produce sector in 2016-17, which represents a
decrease of 0.4 per cent
► Fresh produce accounts for 17.4 per cent of
employment in the industry
► Employment increased in 3 of 5 sub-sectors:
► Vegetable, apple pear and stone fruit and
citrus, banana and other fruit growing
Sector Overview► Industry employment was approximately
320,302 in 2016-171
► This was an increase of 2.3 per cent
or 7,317 people from 2015-16
► NSW had the highest employment by
state in the industry with 28.8 per cent,
closely followed by Victoria with
27.9 per cent
0
50
100
150
200
250
300
350
000s
Food and Beverage Grocery Fresh Produce
Employment in each of the industry sectors
(2016-17) (000s)
Source: Based on ABS, catalogue number 6291.0, 8155.0 and IBISWorld
Reports C1524, C1841, C1851, C1852, C1911, A0122, A0123, A0130,
A0131, A0139, A0172.
1 Employment refers to the number of all persons employed irrespective of whether they are full-time, part-time or casual employees.
Insights
► The increasing investment in the food and
beverage sector in the period 2015-16 (refer to
section 6) may have positively impacted the
employment in the food and beverage sector
in the 2016-17 period
► The increasing importance of the defined
industry within the overall manufacturing
industry is illustrated by a net increase in
employment in the sector
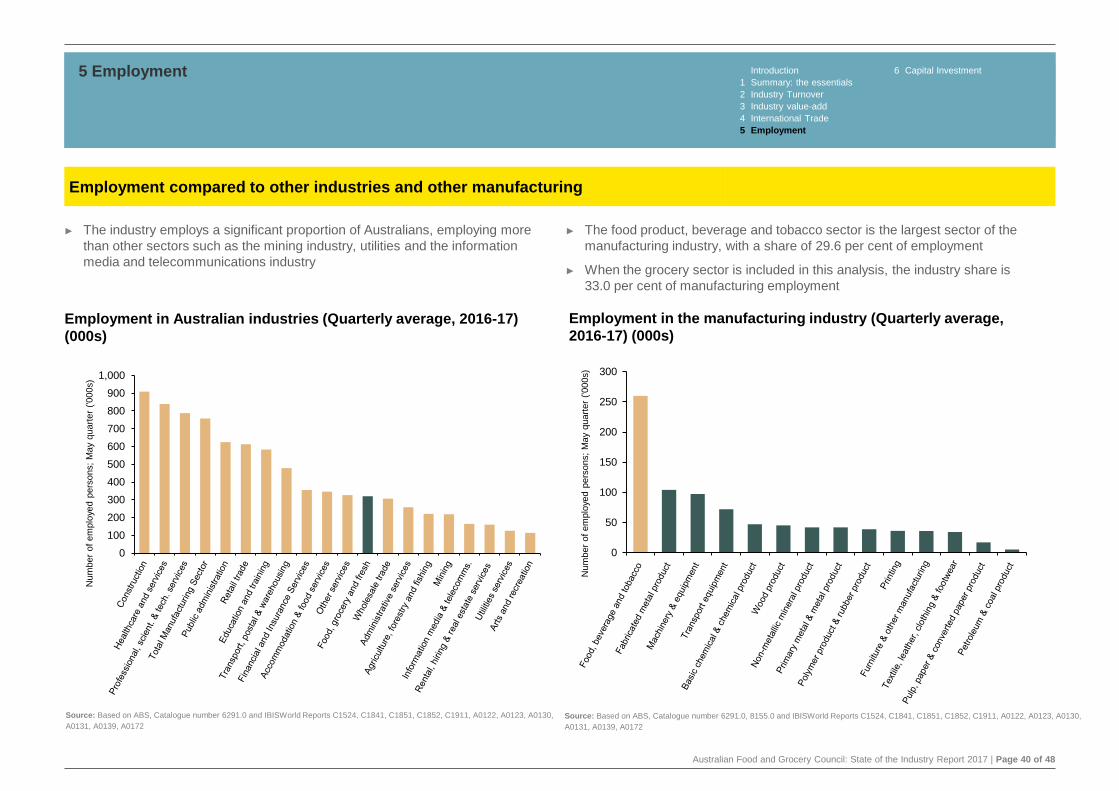
Australian Food and Grocery Council: State of the Industry Report 2017 | Page 40 of 48
► The industry employs a significant proportion of Australians, employing more
than other sectors such as the mining industry, utilities and the information
media and telecommunications industry
► The food product, beverage and tobacco sector is the largest sector of the
manufacturing industry, with a share of 29.6 per cent of employment
► When the grocery sector is included in this analysis, the industry share is
33.0 per cent of manufacturing employment
5 Employment Introduction 6 Capital Investment
1 Summary: the essentials
2 Industry Turnover
3 Industry value-add
4 International Trade
5 Employment
Employment compared to other industries and other manufacturing
Employment in the manufacturing industry (Quarterly average,
2016-17) (000s)
0
100
200
300
400
500
600
700
800
900
1,000
Num
ber
of
em
plo
yed p
ers
ons;
May
quart
er
('000s)
0
50
100
150
200
250
300
Num
ber
of
em
plo
yed p
ers
ons;
May
quart
er
('000s)
Employment in Australian industries (Quarterly average, 2016-17)
(000s)
Source: Based on ABS, Catalogue number 6291.0, 8155.0 and IBISWorld Reports C1524, C1841, C1851, C1852, C1911, A0122, A0123, A0130,
A0131, A0139, A0172
Source: Based on ABS, Catalogue number 6291.0 and IBISWorld Reports C1524, C1841, C1851, C1852, C1911, A0122, A0123, A0130,
A0131, A0139, A0172
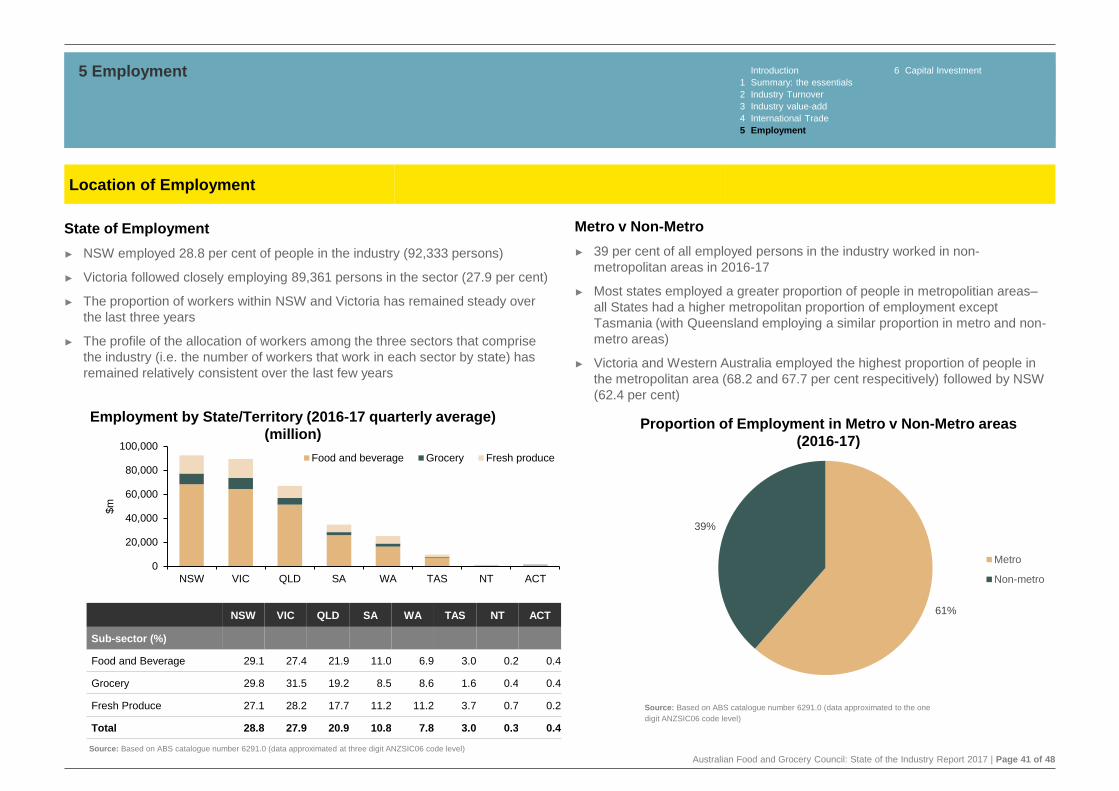
Australian Food and Grocery Council: State of the Industry Report 2017 | Page 41 of 48
Metro v Non-Metro
► 39 per cent of all employed persons in the industry worked in non-
metropolitan areas in 2016-17
► Most states employed a greater proportion of people in metropolitian areas–
all States had a higher metropolitan proportion of employment except
Tasmania (with Queensland employing a similar proportion in metro and non-
metro areas)
► Victoria and Western Australia employed the highest proportion of people in
the metropolitan area (68.2 and 67.7 per cent respecitively) followed by NSW
(62.4 per cent)
State of Employment
► NSW employed 28.8 per cent of people in the industry (92,333 persons)
► Victoria followed closely employing 89,361 persons in the sector (27.9 per cent)
► The proportion of workers within NSW and Victoria has remained steady over
the last three years
► The profile of the allocation of workers among the three sectors that comprise
the industry (i.e. the number of workers that work in each sector by state) has
remained relatively consistent over the last few years
5 Employment Introduction 6 Capital Investment
1 Summary: the essentials
2 Industry Turnover
3 Industry value-add
4 International Trade
5 Employment
Employment by State/Territory (2016-17 quarterly average)
(million)
NSW VIC QLD SA WA TAS NT ACT
Sub-sector (%)
Food and Beverage 29.1 27.4 21.9 11.0 6.9 3.0 0.2 0.4
Grocery 29.8 31.5 19.2 8.5 8.6 1.6 0.4 0.4
Fresh Produce 27.1 28.2 17.7 11.2 11.2 3.7 0.7 0.2
Total 28.8 27.9 20.9 10.8 7.8 3.0 0.3 0.4
Location of Employment
61%
39%
Metro
Non-metro
Proportion of Employment in Metro v Non-Metro areas
(2016-17)
0
20,000
40,000
60,000
80,000
100,000
NSW VIC QLD SA WA TAS NT ACT
$m
Food and beverage Grocery Fresh produce
Source: Based on ABS catalogue number 6291.0 (data approximated to the one
digit ANZSIC06 code level)
Source: Based on ABS catalogue number 6291.0 (data approximated at three digit ANZSIC06 code level)

Australian Food and Grocery Council: State of the Industry Report 2017 | Page 42 of 48
6Capital Investment
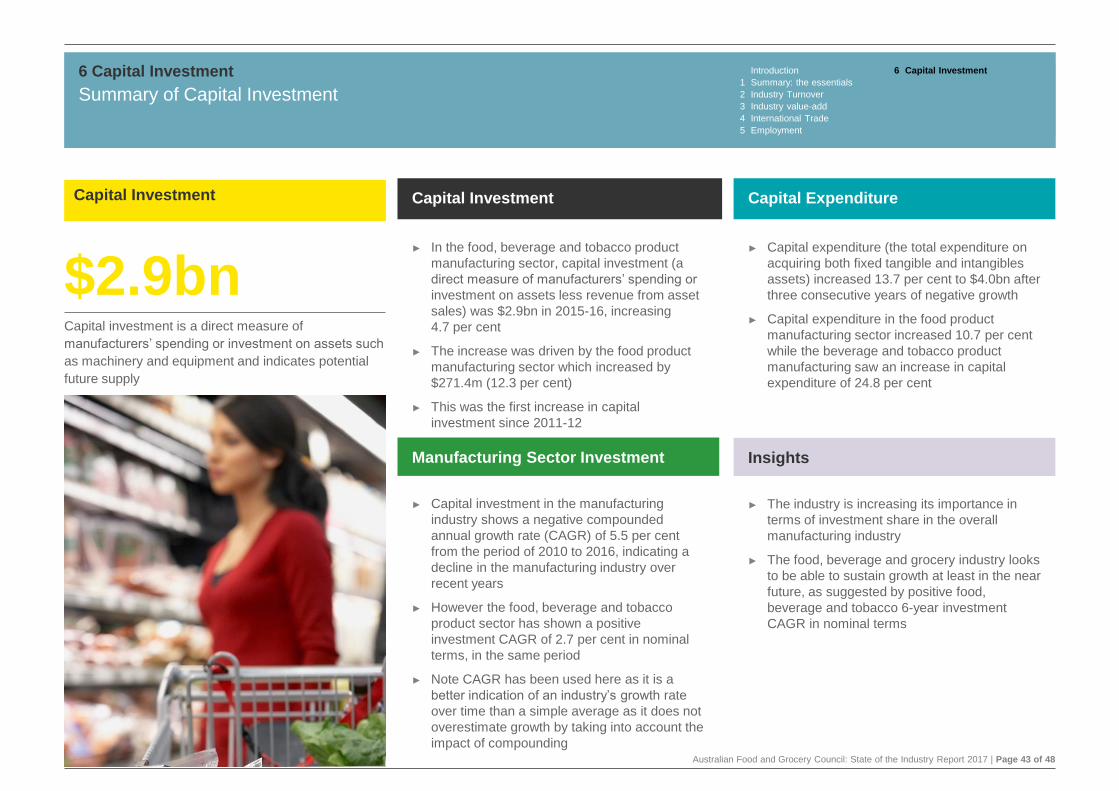
Australian Food and Grocery Council: State of the Industry Report 2017 | Page 43 of 48
Summary of Capital Investment
6 Capital Investment Introduction 6 Capital Investment
1 Summary: the essentials
2 Industry Turnover
3 Industry value-add
4 International Trade
5 Employment
Capital Investment
► In the food, beverage and tobacco product
manufacturing sector, capital investment (a
direct measure of manufacturers’ spending or
investment on assets less revenue from asset
sales) was $2.9bn in 2015-16, increasing
4.7 per cent
► The increase was driven by the food product
manufacturing sector which increased by
$271.4m (12.3 per cent)
► This was the first increase in capital
investment since 2011-12
Capital Expenditure
► Capital expenditure (the total expenditure on
acquiring both fixed tangible and intangibles
assets) increased 13.7 per cent to $4.0bn after
three consecutive years of negative growth
► Capital expenditure in the food product
manufacturing sector increased 10.7 per cent
while the beverage and tobacco product
manufacturing saw an increase in capital
expenditure of 24.8 per cent
Manufacturing Sector Investment
► Capital investment in the manufacturing
industry shows a negative compounded
annual growth rate (CAGR) of 5.5 per cent
from the period of 2010 to 2016, indicating a
decline in the manufacturing industry over
recent years
► However the food, beverage and tobacco
product sector has shown a positive
investment CAGR of 2.7 per cent in nominal
terms, in the same period
► Note CAGR has been used here as it is a
better indication of an industry’s growth rate
over time than a simple average as it does not
overestimate growth by taking into account the
impact of compounding
Insights
► The industry is increasing its importance in
terms of investment share in the overall
manufacturing industry
► The food, beverage and grocery industry looks
to be able to sustain growth at least in the near
future, as suggested by positive food,
beverage and tobacco 6-year investment
CAGR in nominal terms
Capital Investment
$2.9bnCapital investment is a direct measure of
manufacturers’ spending or investment on assets such
as machinery and equipment and indicates potential
future supply
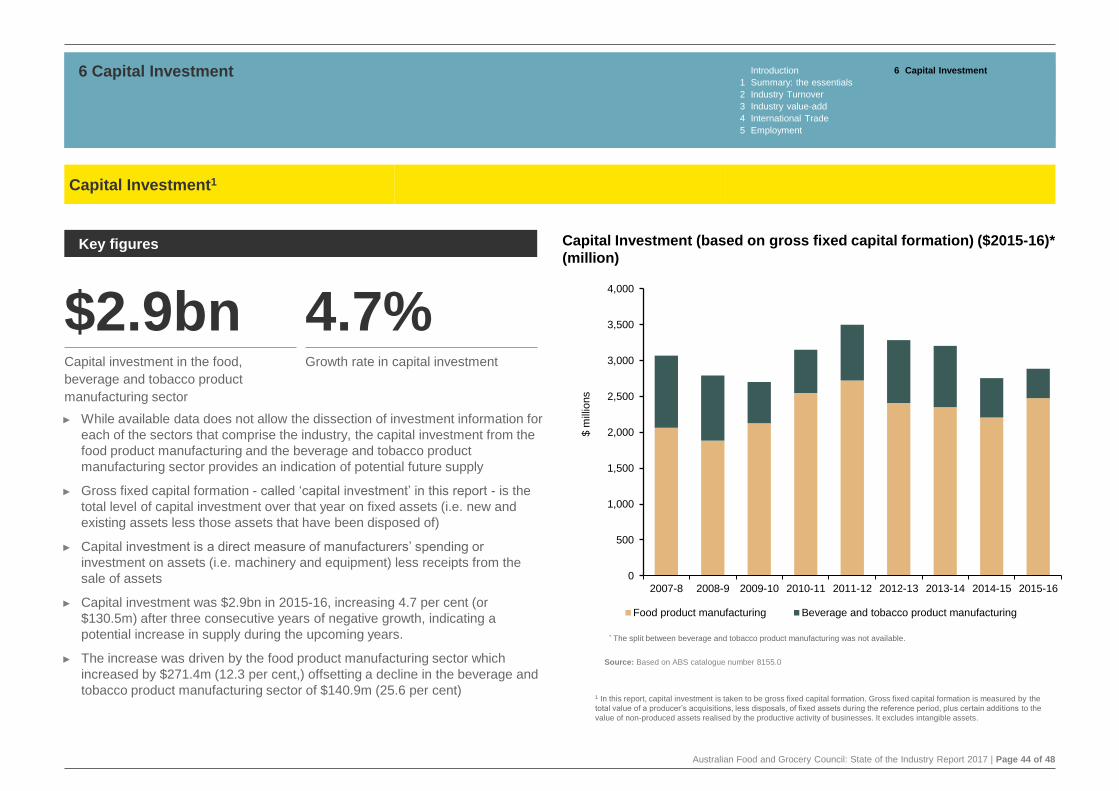
Australian Food and Grocery Council: State of the Industry Report 2017 | Page 44 of 48
► While available data does not allow the dissection of investment information for
each of the sectors that comprise the industry, the capital investment from the
food product manufacturing and the beverage and tobacco product
manufacturing sector provides an indication of potential future supply
► Gross fixed capital formation - called ‘capital investment’ in this report - is the
total level of capital investment over that year on fixed assets (i.e. new and
existing assets less those assets that have been disposed of)
► Capital investment is a direct measure of manufacturers’ spending or
investment on assets (i.e. machinery and equipment) less receipts from the
sale of assets
► Capital investment was $2.9bn in 2015-16, increasing 4.7 per cent (or
$130.5m) after three consecutive years of negative growth, indicating a
potential increase in supply during the upcoming years.
► The increase was driven by the food product manufacturing sector which
increased by $271.4m (12.3 per cent,) offsetting a decline in the beverage and
tobacco product manufacturing sector of $140.9m (25.6 per cent)
6 Capital Investment Introduction 6 Capital Investment
1 Summary: the essentials
2 Industry Turnover
3 Industry value-add
4 International Trade
5 Employment
Capital Investment1
Capital Investment (based on gross fixed capital formation) ($2015-16)*
(million)
* The split between beverage and tobacco product manufacturing was not available.
Source: Based on ABS catalogue number 8155.0
Key figures
$2.9bn 4.7%Capital investment in the food,
beverage and tobacco product
manufacturing sector
Growth rate in capital investment
1 In this report, capital investment is taken to be gross fixed capital formation. Gross fixed capital formation is measured by the
total value of a producer’s acquisitions, less disposals, of fixed assets during the reference period, plus certain additions to the
value of non-produced assets realised by the productive activity of businesses. It excludes intangible assets.
0
500
1,000
1,500
2,000
2,500
3,000
3,500
4,000
2007-8 2008-9 2009-10 2010-11 2011-12 2012-13 2013-14 2014-15 2015-16$ m
illio
ns
Food product manufacturing Beverage and tobacco product manufacturing
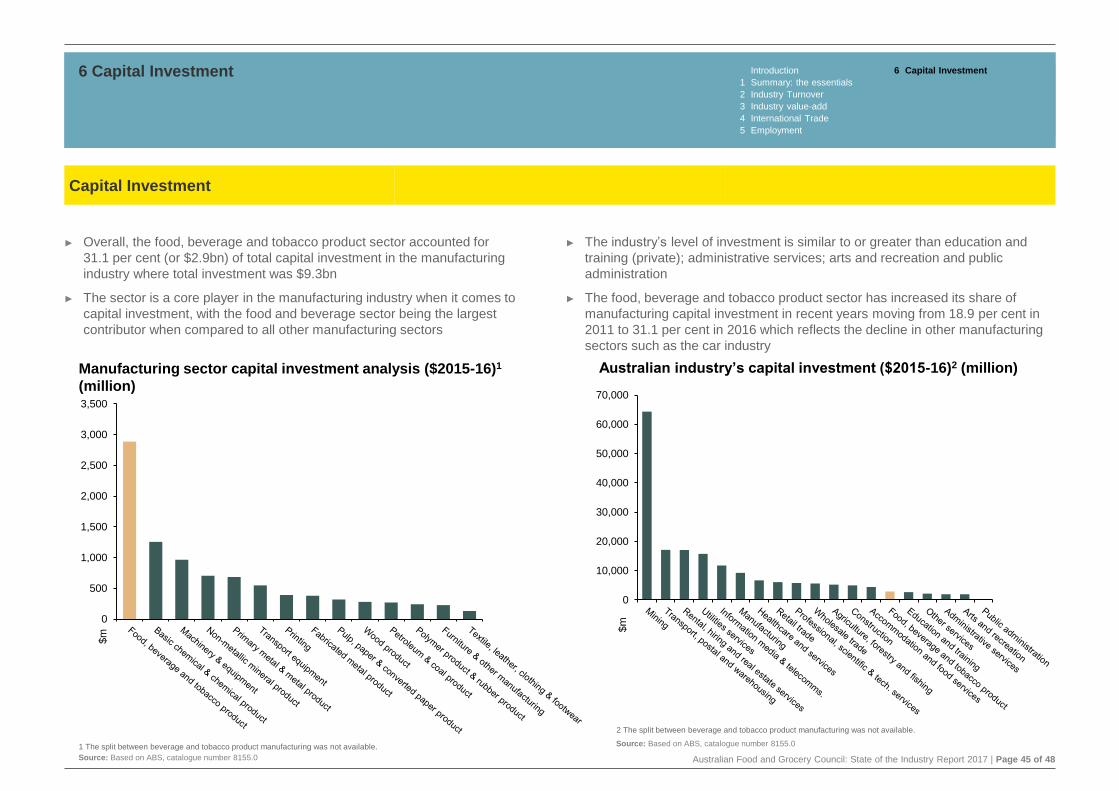
Australian Food and Grocery Council: State of the Industry Report 2017 | Page 45 of 48
► Overall, the food, beverage and tobacco product sector accounted for
31.1 per cent (or $2.9bn) of total capital investment in the manufacturing
industry where total investment was $9.3bn
► The sector is a core player in the manufacturing industry when it comes to
capital investment, with the food and beverage sector being the largest
contributor when compared to all other manufacturing sectors
► The industry’s level of investment is similar to or greater than education and
training (private); administrative services; arts and recreation and public
administration
► The food, beverage and tobacco product sector has increased its share of
manufacturing capital investment in recent years moving from 18.9 per cent in
2011 to 31.1 per cent in 2016 which reflects the decline in other manufacturing
sectors such as the car industry
6 Capital Investment Introduction 6 Capital Investment
1 Summary: the essentials
2 Industry Turnover
3 Industry value-add
4 International Trade
5 Employment
Capital Investment
Australian industry’s capital investment ($2015-16)2 (million)
0
10,000
20,000
30,000
40,000
50,000
60,000
70,000
$m0
500
1,000
1,500
2,000
2,500
3,000
3,500
$m
Manufacturing sector capital investment analysis ($2015-16)1
(million)
Source: Based on ABS, catalogue number 8155.0
Source: Based on ABS, catalogue number 8155.01 The split between beverage and tobacco product manufacturing was not available.
2 The split between beverage and tobacco product manufacturing was not available.
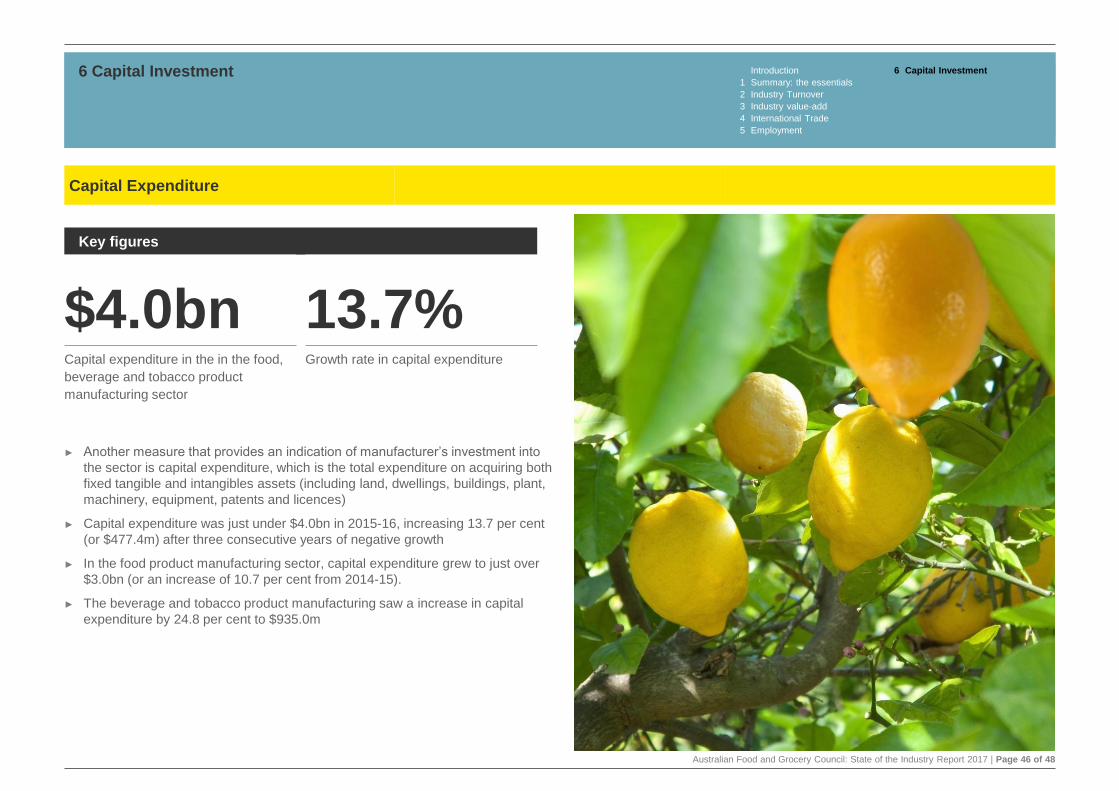
Australian Food and Grocery Council: State of the Industry Report 2017 | Page 46 of 48
► Another measure that provides an indication of manufacturer’s investment into
the sector is capital expenditure, which is the total expenditure on acquiring both
fixed tangible and intangibles assets (including land, dwellings, buildings, plant,
machinery, equipment, patents and licences)
► Capital expenditure was just under $4.0bn in 2015-16, increasing 13.7 per cent
(or $477.4m) after three consecutive years of negative growth
► In the food product manufacturing sector, capital expenditure grew to just over
$3.0bn (or an increase of 10.7 per cent from 2014-15).
► The beverage and tobacco product manufacturing saw a increase in capital
expenditure by 24.8 per cent to $935.0m
6 Capital Investment Introduction 6 Capital Investment
1 Summary: the essentials
2 Industry Turnover
3 Industry value-add
4 International Trade
5 Employment
Capital Expenditure
Key figures
$4.0bn 13.7%Capital expenditure in the in the food,
beverage and tobacco product
manufacturing sector
Growth rate in capital expenditure

Key contacts
AFGC
James Mathews
Communications Director
Telephone: 02 6273 1466
Email: [email protected]
Website: www.afgc.org.au
© 2017 Australian Food and Grocery Council
This work is copyright. Apart from any use permitted under the Copyright Act 1968, no part may be reproduced by any process without prior written permission from
the Australian Food and Grocery Council. Requests and enquiries concerning reproduction and rights should be addressed to the Australian Food and Grocery
Council at:
AFGC
Locked Bag 1
Kingston ACT 2604
Australian Food and Grocery Council
Level 2
2-4 Brisbane Avenue
BARTON ACT 2600
P: +61 2 6273 1466
F: +61 2 6273 1477
www.afgc.org.au