Embed Size (px)
Citation preview

State of Rhode Island and Providence Plantations
Budget as Enacted
Fiscal Year 2014 Lincoln D. Chafee, Governor


FY 2014 Budget as Enacted Table of Contents
Page Overview Enacted Appropriations ............................................................................................................................... 1 Enacted General Revenue Receipt Estimates ............................................................................................. 3 General Revenue Expenditure Changes from Governor’s Recommended Budget ................................... 9
General Government Administration ............................................................................................................................... 10 Business Regulation ...................................................................................................................... 13
Labor and Training ........................................................................................................................ 14 Revenue ......................................................................................................................................... 15 Legislature ..................................................................................................................................... 17 Lieutenant Governor ...................................................................................................................... 18 Secretary of State ........................................................................................................................... 18 General Treasurer .......................................................................................................................... 19
Board of Elections ......................................................................................................................... 19 Ethics Commission ........................................................................................................................ 20 Governor’s Office .......................................................................................................................... 20
Commission for Human Rights ..................................................................................................... 21 Public Utilities Commission .......................................................................................................... 21
Human Services Executive Office of Health and Human Services ......................................................................... 21 Children, Youth and Families ....................................................................................................... 24
Health ............................................................................................................................................. 25 Human Services ............................................................................................................................. 27
Behavioral Healthcare, Developmental Disabilities and Hospitals .............................................. 30 Commission on Disabilities ........................................................................................................... 32 Commission on the Deaf and Hard of Hearing ............................................................................. 32
Child Advocate .............................................................................................................................. 33 Mental Health Advocate ................................................................................................................ 33
Education Elementary and Secondary Education .......................................................................................... 33 Public Higher Education ............................................................................................................... 37 State Council on the Arts ............................................................................................................... 38 Atomic Energy Commission ......................................................................................................... 39 Higher Education Assistance Authority ........................................................................................ 39 Historical Preservation and Heritage Commission ....................................................................... 39 Public Telecommunications Authority ......................................................................................... 40
Public Safety Attorney General ........................................................................................................................... 40 Corrections ..................................................................................................................................... 41 Judiciary ......................................................................................................................................... 43 Military Staff ................................................................................................................................. 44

Public Safety .................................................................................................................................. 45 Public Defender ............................................................................................................................. 47
Natural Resources Environmental Management ......................................................................................................... 47 Coastal Resources Management Council ...................................................................................... 48
Transportation Transportation ................................................................................................................................ 49 All Sources .................................................................................................................................................. 53 All Expenditures .......................................................................................................................................... 54 General Revenues ........................................................................................................................................ 55 General Revenue Expenditures ................................................................................................................... 56 Full-Time Equivalents ................................................................................................................................. 57 Schedules General Revenues as Enacted ..................................................................................................................... 59 General Revenue Changes to Enacted/Estimated ....................................................................................... 60 General Revenue Changes to Adopted Estimates ...................................................................................... 62 Other Revenue Enhancements .................................................................................................................... 65 Expenditures from All Funds ...................................................................................................................... 66 Expenditures from General Revenue .......................................................................................................... 68 Expenditures from Federal Funds ............................................................................................................... 70 Expenditures from Restricted Receipts ....................................................................................................... 72 Expenditures from Other Funds .................................................................................................................. 74 Full-Time Equivalent Positions .................................................................................................................. 76 Total Statewide Expenditures ..................................................................................................................... 78 General Revenue Budget Surplus ............................................................................................................... 79 FY 2013 Budget Change to FY 2013 General Revenue Budget Surplus .............................................................................. 80 Final Changes to FY 2013 Enacted General Revenue Expenditures ......................................................... 81 Aid to Cities & Towns/Schools Formula Aid to Cities and Towns ............................................................................................................... 98 Fiscal Year 2013 Revised State Aid to Cities and Towns .......................................................................... 100 Fiscal Year 2013 Revised Pass-through Aid to Cities and Towns ............................................................ 101 Fiscal Year 2014 State Aid to Cities and Towns ........................................................................................ 102 Fiscal Year 2014 Pass-through Aid to Cities & Towns ............................................................................. 103 Changes in Formula Aid – FY 2014 vs. FY 2013 Revised ........................................................................ 104 Changes in Pass-through and All Aid – FY 2014 vs. FY 2013 Revised ................................................... 105 Education Aid .............................................................................................................................................. 106 Education Aid by Category of Aid ............................................................................................................. 107 Education Aid to Local Units of Government ............................................................................................ 108

Capital Budget RI Capital Plan Fund ................................................................................................................................... 111 RI Capital Plan Fund – Five Year Capital Plan as Enacted ....................................................................... 112 Five-Year Forecast FY 2014 – FY 2018 Overview ................................................................................................................... 113 General Revenue Outyear Estimates FY 2014 – FY 2018 ........................................................................ 115 General Revenue Outyear Estimates .......................................................................................................... 116 General Revenue Outyear Estimates – Percentage Changes ..................................................................... 117 General Revenue Outyear Expenditure Estimates ..................................................................................... 118 General Revenue Outyear Planning Values ............................................................................................... 119


Budget as Enacted


Overview
The FY 2014 Budget was passed by the General Assembly under 13-H-5127 Substitute A, as amended on June 26, 2013 (House of Representatives) and June 27, 2013 (Senate). The budget became law on July 3, 2013 with Governor Chafee’s signature, and is filed in Chapter 144 of the Public Laws of 2013.
The final enacted budget is lower than the Governor’s recommended budget for FY 2014 by $39.4 million, or less than 1.2 percent. Given the revised revenue picture adopted by the May Revenue Estimating Conference, the General Assembly had $52.4 million net general revenues less than what was adopted in November; however, it did manage to preserve some key elements of Governor Chafee’s recommended budget that invest in key priorities and keep Rhode Island on a path towards economic recovery.
As with the Governor’s recommended budget, the final enacted budget includes no net increase in taxes or fees to support the FY 2014 spending plan. Although the proposal to phase down the corporate income tax from nine percent (9.0%) to seven percent (7.0%) was not approved, the General Assembly did enact a number of initiatives to help Rhode Island become more business friendly, such as:
Reinstating the historic structures tax credit program through the use of abandoned credits; Removing the nuisance fee on businesses for submitting hazardous substances paperwork; Investing $500,000 for the I-195 Redevelopment Commission to develop the Knowledge District
in Providence; Investing $150,000 for the Colleges and Universities to provide ongoing economic analysis for
Rhode Island; Investing $1.25 million for a new workforce development initiative; Changing the Rhode Island tax structure to allow accelerated depreciation for major equipment
purchases in the same manner as federal tax law.
While the Governor proposed $20.0 million in new direct resources to municipalities through increased aid to distressed municipalities and a new municipal incentive aid program, the enacted budget includes $9.0 million, $11.0 million less than proposed by the Governor, $4.0 million more for the Payment-in-lieu-of-Taxes (PILOT) program ($2.0 million each in FY 2013 and FY 2014), as well as $5.0 million for the municipal incentive aid program. The aid to distressed communities program was level funded at $10.4 million, as opposed to the $15.4 million recommended by the Governor. The General Assembly also did not authorize the Governor’s initiative to provide $10.0 million in funding for local road construction, but instead followed a similar path by providing $7.0 million to seed a local road revolving loan fund.
In Human Services, the enacted budget includes $85.2 million in new federal spending to expand Medicaid eligibility under the Affordable Care Act for non-pregnant, childless adults up to 138 percent of the federal poverty level. The budget also includes $17.0 million for increases in payment rates for primary care physicians to align with those of the federal Medicare program. These additional funds will not only provide a financial inflow to our local economy, they will result in better health coverage for some of Rhode Island’s most vulnerable populations.
The FY 2014 enacted budget also helps working families by including the Governor’s proposal to provide an enhanced child-care subsidy with a subsidized job training program using TANF Block Grant funds to help low income Rhode Islanders get back to work. The budget also includes $1.25 million for the Governor’s proposed work immersion and non-trade apprenticeship program.
Enacted Appropriations
1
Overview
The enacted budget also includes some key capital investments as proposed by Governor Chafee using the pay-as-you-go Rhode Island Capital Plan Fund. Some of these investments include:
Improvements to the Eisenhower House at Fort Adams in Newport; Renovating the Harrington Hall homeless shelter on the Pastore Center campus; Maintaining the Dunkin Donuts Center and the Convention Center; Replacing much needed heavy equipment for the Department of Transportation to address
infrastructure needs throughout the state.
Fiscal Year 2014 appropriations from all funds total $8,213.1 million. In relation to the FY 2013 revised budget of $8,101.6 million, the FY 2014 enacted appropriations increase by $111.5 million or 1.4 percent from all fund sources. General revenue appropriations total $3,359.8 million; an increase of $125.9 million, or 3.9 percent, from the final FY 2013 revised general revenue appropriation of $3,233.8 million. Within FY 2013 general revenue appropriations, General Government expenditures increase by $1.9 million or 0.4 percent; Human Services expenditures increase by $72.2 million or 5.8 percent; Education expenditures increase by $40.8 million or 3.7 percent; Public Safety expenditures increase by $10.6 million or 2.6 percent; and Natural Resources expenditures increase by $484,031 or 1.3 percent. Significant general revenue increases include $5.0 million for a new Municipal Incentive Aid program in the Department of Revenue, $33.7 million more for education aid in the Department of Education, $59.8 million more for managed care and associated services in the Office of Health and Human Services, and $6.0 million for Higher Education to assure no tuition increase in the 2013-2014 academic year at any of the three state institutions of higher learning. Federal funds total $2,717.7 million in the FY 2014 enacted budget, reflecting a decrease of 0.2 percent or $5.5 million from the final FY 2013 federal funds appropriation of $2,723.2 million. Areas of federal expenditure reduction include General Government by $77.0 million or 31.8 percent; Education by $12.1 million or 4.7 percent; Public Safety by $28.1 million or 37.3 percent and Transportation by $5.2 million or 1.6 percent. Federal financing increases occur in Human Services agencies, which are $115.7 million or 6.5 percent greater than the FY 2013 final enacted level and Natural Resources, which increases by $1.1 million or 2.9 percent. The large decline in expenditures within the General Government function is primarily due to the end of stimulus funding for extended unemployment compensation. Within Human Services, the expenditure growth is in medical and cash assistance programs. Projected costs of $85.2 million associated with the Affordable Care Act implementation in January 2014, are also funded in FY 2014. Restricted receipts total $255.0 million in the FY 2014 enacted budget, a decrease of $14.3 million or 5.3 percent from the final FY 2013 revised budget of $269.3 million. By functional area, General Government restricted receipts decline by $25.8 million or 19.8 percent and Human Services receipts decline by $2.0 million or 3.1 percent. Education receipts increase by $1.0 million or 3.7 percent; Public Safety receipts increase by $2.6 million or 9.4 percent; Natural Resources receipts increase by $2.8 million or 18.2 percent; and Transportation receipts increase by $7.0 million or 692.9 percent. The significant decline within the General Government function is attributable to a reduction in projected disbursements from the unclaimed property program and a reduction in the anticipated disbursements from the Job Development Fund. The increase in the Transportation function is from the new fees on vehicle registrations and licenses that will be deposited to the RI Highway Maintenance Trust Fund, which is part of the Governor’s commitment to eliminate bonding for the state’s match for Federal Transportation funding.
2
Overview
FY 2013 Final Enacted
Revenues
FY 2013 Final Enacted Revenues vs. FY 2012 Final Audited Revenues
Other funds, including transfers from the Rhode Island Capital Plan Fund, total $1,880.6 million in the FY 2014 enacted budget, an increase of $5.3 million or 0.3 percent from the final FY 2013 revised budget of $1,875.3 million. By function, other funds decrease by $21.2 million or 2.7 percent in General Government and by $7.4 million or 5.0 percent in Transportation. These declines are offset by increases of $5.4 million or 44.3 percent in Human Services: $9.9 million or 1.1 percent in Education; $5.4 million or 21.4 percent in Public Safety; and $13.1 million or 111.1 percent in Natural Resources. The decline within the General Government function is due to a reduction in projected disbursements from the Employment Security Trust Fund for unemployment benefits. The increase within the Natural Resources function is due to additional funding from the RI Capital Plan Fund for various projects, such as renovations to Rocky Point Park in Warwick and additional investments relating to sailing events at Fort Adams State Park in Newport.
The principals of the May 2013 Revenue Estimating Conference adopted revenue estimates that were $4.9 million less than the FY 2013 revenue estimates adopted at the November 2012 Revenue Estimating Conference, a decrease of 0.1 percent. Relative to the Governor’s recommended FY 2013 supplemental budget, the differences from the May 2013 REC adopted
estimates were a decrease of $7.7 million or -0.2 percent. The final enacted FY 2013 budget reflects estimated general revenues that are $300,000 more than the May 2013 REC adopted estimates for FY 2013. Details of the Governor’s recommended changes to the FY 2013 estimates adopted at the November 2012 REC and the General Assembly’s enacted changes to the FY 2013 estimates adopted at the May 2013 REC are displayed in the table General Revenue Changes to Adopted Estimates FY 2013 in Appendix A of this document. The enacted change to the FY 2013 adopted estimates approved by the General Assembly with the concurrence of the Governor is the result of an audit finding issued by the Office of the Auditor General recommending that bank fees associated with the State’s investment earnings be expensed separately rather than being deducted from the State’s investment earnings prior to the posting of these earnings as revenue.
Final enacted revenues for FY 2013 are based upon a $53.1 million increase in total general revenues over final audited FY 2012, or growth of 1.6 percent. Much of this increase can be found in personal income taxes, $14.8 million; business corporations and franchise taxes, $13.9 million; and sales and use taxes, $21.4 million. These increases are partially offset by estimated decreases in inheritance and gift taxes, $(16.2 million); other
miscellaneous revenues, $(14.4 million) and the unclaimed property transfer, $(7.6 million). Personal income tax collections continue to be the single largest source of state general revenues in FY 2013 at 32.4 percent. Personal income tax collections are estimated to expand at an annual rate of 1.4 percent or $14.8 million for FY 2013. Much of this increase is due to increased final income tax payments of $25.4 million and increased withholding tax payments of $5.0 million. The overall increase, however, is offset by an increase in estimated refund payments by $16.9 million. General business tax collections are projected to increase by $24.9 million or 6.9 percent, due primarily to an estimated increase in business corporations taxes of $13.9 million and an increase in financial institutions taxes and public utilities gross premiums taxes of $9.2 million and $4.1 million, respectively. The overall increase, however, is offset by a decrease of $2.9 million in public utilities gross earnings taxes and the health care provider assessment. Sales and use tax collections are projected to increase by $21.4 million or 2.5 percent, over final audited FY 2012 collections. The anticipated increase in sales and use tax revenues is partially attributable to the passage of a sales tax base expansion on three items effective October 1, 2012 in the enacted FY 2013
3

Overview
FY 2014 Proposed Revenues
budget signed into law on June 15, 2012. Sales and use taxes represent 26.2 percent of total general revenues in the final enacted FY 2013 budget. For FY 2013, sales and use tax collections are projected to be $872.5 million. Excise taxes other than the sales and use tax are expected to increase by $3.6 million or 1.9 percent in FY 2013 over final audited FY 2012 collections due primarily to a projected increase in motor vehicle licenses and registration fees of $2.7 million. Motor carrier fuel use tax, cigarettes and other tobacco tax and alcohol excise tax revenues are estimated to increase by $67,328, $714,088 and $126,354, respectively, in the final enacted FY 2013 budget. Other taxes are projected to decrease by $15.7 million, or -28.9 percent in FY 2013 relative to final audited FY 2012 other tax revenues. Of the total decrease in other taxes, inheritance and gift tax revenues are expected to decrease by $16.2 million, or 34.9 percent. The expected decrease in inheritance and gift tax collections is attributable in part to approximately $10.0 million in infrequently occurring payments received in FY 2012. Realty transfer taxes are anticipated to increase by $665,335 and racing and athletics tax collections are projected to decline by $127,003. Racing and athletic taxes’ downward trend is expected to continue as these revenues are now solely based on pari-mutuel wagering on simulcast races. Racing and athletics taxes are expected to total $1.2 million in the final enacted FY 2013 budget, a decrease of 9.6 percent from final FY 2012 collections. Realty transfer taxes are expected to total $7.1 million in FY 2013, an increase of 10.3 percent from final audited FY 2012 collections. In the FY 2013 final enacted budget, departmental receipts are projected at $363.4 million, an increase of $23.5 million, or 6.9 percent, from final audited FY 2012 revenues. The increase in the departmental receipts is attributable in part to anticipated receipt of overdue payments for the FY 2012 Hospital Licensing Fee of $10.0 million which was included in the departmental receipts estimate adopted at the May 2013 Revenue Estimating Conference. In addition to the above general revenue components, an increase is expected in final enacted FY 2013 revenues for the lottery transfer to the general fund of $2.5 million, or 0.6 percent from the final audited FY 2012 lottery transfer. The increased lottery transfer in FY 2013 is dampened as a result of the renovations that Twin River undertook to prepare for the opening of table games, the operations of which were approved by voters in statewide and local referendums in November 2012. These renovations necessitated the idling of numerous video lottery terminals (VLTs) and the permanent removal of 214 VLTs during the period between March and June 2013. Table gaming at Twin River commenced on June 19, 2013. In addition, the net terminal income (NTI) generated by the VLTs installed at Newport Grand was revised downward at the May 2013 REC further decreasing the state’s share of VLT NTI in FY 2013. The principals of the May 2013 Revenue Estimating Conference included the Division of Lottery’s cost to administer and oversee table game operations at Twin River in the adopted lottery transfer estimate. These costs are estimated at $940,000 in the final enacted FY 2013 budget. The unclaimed property transfer to the general fund is forecasted to decrease by $7.6 million in the final enacted FY 2013 budget, a decrease of 51.9 percent from final audited FY 2012 revenues. The decrease in the unclaimed property transfer is based on the testimony provided by the Office of the General Treasurer at the November 2012 and May 2013 RECs. For FY 2013, final enacted other miscellaneous general revenues are projected to decrease by $19.5 million from final audited FY 2012 revenues.
The enacted FY 2014 budget estimates general revenues of $3.381 billion, an increase of 1.7 percent from the final enacted FY 2013 level. The enacted FY 2014 budget has estimated general revenues that are $45.4 million, or 1.3 percent, less than the estimated general revenues contained in the Governor’s FY 2014 recommended budget. The General Assembly’s enacted budget is
4

Overview
comprised of $3.237 billion of revenue estimated at the May 2013 Revenue Estimating Conference and $144.1 million of changes to the May 2013 REC adopted estimates. These changes are shown in the schedule General Revenue Changes to Adopted Estimates FY 2014 located in Appendix A of this document. The largest source of FY 2014 general revenues is the personal income tax, with estimated receipts of $1.109 billion, $1.4 million more than the May 2013 REC adopted estimate for FY 2014, growth of 3.1 percent from the final enacted FY 2013 amount, and $21.6 million less than the amount included in the Governor’s FY 2013 recommended budget. The increase in enacted FY 2014 personal income tax revenue vis-à-vis the FY 2014 adopted personal income tax revenue estimate is the result of the General Assembly’s concurrence with the Governor’s recommendation to initiate a special investigative tax unit in the Division of Taxation. The Governor’s FY 2014 recommended budget projected increased revenues of $1.0 million from the more efficient and effective identification and quantification of tax fraud and related activity associated with compliance with the personal income tax. The General Assembly also concurred with the Governor’s proposal to allow the Division of Taxation to hire out of state collection agencies to enhance the collection of tax debts from non-resident individuals and businesses. The Governor’s FY 2014 recommended budget included increased personal income tax revenues of $750,000. Finally, the General Assembly’s enacted FY 2014 budget increased the total amount that can be awarded in a given fiscal year under the Tax Credits for Contributions to Scholarship Organizations program by $500,000 to a total of $1.5 million. The Office of Revenue Analysis estimates that this increase in allowable tax credits will reduce personal income tax revenues in FY 2014 by $395,500. General Business taxes are projected to comprise 11.4 percent of total general revenues in the FY 2014 enacted budget. Business corporations tax revenues are expected to yield $141.3 million, the same amount as was adopted at the May 2013 REC. This total is $6.2 million, or 4.6 percent, more than was included in the Governor’s FY 2014 recommended budget. The General Assembly declined to accept the corporate income tax reform proposal that was included in the Governor’s FY 2014 recommended budget. Insurance companies gross premiums taxes are estimated at $98.8 million in the FY 2014 enacted budget, an increase of $815,832 from the FY 2014 estimate adopted at the May 2013 REC and $2.0 million more than the estimate included in the Governor’s FY 2014 recommended budget. This increase is the result of a combination of rate decrease to managed care insurance premiums paid by the State estimated at ($179,668), increased insurance premiums associated with the expansion of the insured Medicaid population under the Affordable Care Act estimated at $1.1 million, and the share of the $500,000 increase in the total amount that can be awarded in a given fiscal year under the Tax Credits for Contributions to Scholarship Organizations program estimated at $(104,500). The Governor’s FY 2014 recommended budget included the managed care rate reduction initiative while the increased insurance premiums attributable to the Medicaid expansion under the ACA and the increased cap for the Tax Credits for Contributions to Scholarship Organizations were General Assembly initiatives. The recommended growth rate in the enacted FY 2014 insurance companies gross premiums tax revenues over the FY 2013 final enacted estimate is 5.6 percent. FY 2014 enacted revenues for the public utilities gross earnings tax, the financial institutions tax, and the bank deposits tax are at the same levels as were adopted at the May 2013 REC. The FY 2014 enacted public utilities gross earnings revenue estimate is $7.5 million less than the Governor’s FY 2014 recommended estimate while the enacted FY 2014 estimates for the financial institutions tax and the bank deposits tax are $1.2 million and $300,000 more, respectively, than the amounts included in the Governor’s FY 2014 recommended budget. The FY 2014 enacted growth rate for public utilities gross earnings tax revenues relative to the FY 2013 final enacted estimate is -3.5 percent. For financial institution tax revenues the enacted growth rate for FY 2014 relative to FY 2013 final enacted estimate
5

Overview
is -66.4 percent. Bank deposit tax revenues are not expected to grow in the FY 2014 enacted budget from the level estimated in the final enacted FY 2013 budget. The health care provider assessment on nursing homes is forecasted to yield $42.6 million in the FY 2014 enacted budget, a decrease of $389,456 from the estimate that was adopted at the May 2013 REC. This decrease is attributed to the General Assembly’s concurrence with the Governor’s recommendation to suspend the cost of living adjustment nursing home providers were scheduled to receive October 1, 2013. The enacted growth rate in FY 2014 health care provider assessment revenues over the FY 2013 final enacted estimate is 2.9 percent. Sales and use tax revenues are expected to yield $887.2 million in the enacted FY 2014 budget, $7.8 million less than was adopted at the May 2013 Revenue Estimating Conference and $17.1 million less than the estimate included in the Governor’s FY 2014 recommended budget. The decrease in sales and use tax revenue from the May 2013 adopted estimate is a combination of the General Assembly’s acceptance of the Governor’s recommendation for a special investigative tax unit in the Division of Taxation, and two General Assembly initiatives, the exemption of works of art, including print and photograph, produced by Rhode Island residents with a business located in Rhode Island from the sales tax effective December 1, 2013 and the repeal of the sales tax on the sale of spirits and wine by package stores also effective December 1, 2013. The FY 2014 enacted budget projects increased sales and use tax revenues of $200,000 from creating the special investigative tax unit and foregone sales and use tax revenues of $8.0 million from exempting art from the sales tax and the repeal of the sales tax on spirits and wine sold by package stores. Sales and use taxes are expected to contribute 26.2 percent to enacted total general revenues in FY 2014. The enacted growth rate for sales and use tax revenues in FY 2014 is 1.7 percent over the FY 2013 final enacted sales and use tax revenue estimate. Motor vehicle operator license and vehicle registration fees are forecasted to equal $51.8 million in the enacted FY 2014 budget, the same amount that was adopted at the May 2013 REC and $3.1 million more than the estimate included in the Governor’s FY 2014 recommended budget. Motor carrier fuel use tax revenues are projected to be $1.0 million, the same as both the estimate adopted at the May 2013 Revenue Estimating Conference and the estimated included in the Governor’s FY 2014 recommended budget. The respective FY 2014 enacted growth rates for motor vehicle fees and motor carrier fuel use tax revenues over FY 2013 final enacted amounts are 1.4 percent and 25.0 percent. Cigarettes and other tobacco products tax revenues are enacted at $130.7 million in the FY 2014 enacted budget. This is the same level as was adopted for FY 2014 at the May 2013 Revenue Estimating Conference and $6.7 million less than the estimate contained in the Governor’s FY 2014 recommended budget. The cigarettes and other tobacco products tax revenues enacted FY 2014 growth rate over the FY 2013 final enacted estimate for the same is -0.8 percent. The enacted FY 2014 estimate for alcohol tax revenues is $18.2 million an increase of $6.0 million from both the estimate adopted at the May 2013 REC and the estimate included in the Governor’s FY 2014 recommended budget. The General Assembly enacted increases in the alcohol excise taxes for beer and malt, high proof distilled spirits and still wine in the FY 2014 budget. For beer and malt, the excise tax is increased from $3.00 per barrel of beer or malt to $3.30 per barrel (31 gallons). For high proof spirits, those spirits that contain 15 percent or more alcohol, the excise tax is increased from $3.75 per gallon to $5.40 per gallon. For still wine, the excise tax is increased from $0.60 per gallon to $1.40 per gallon. The excise taxes on low proof distilled spirits and sparkling wine were unchanged by the General Assembly. The effective date of these tax increases is July 1, 2013. The estimated increase in alcohol excise tax revenues resulting from these changes is $6.0 million yielding an estimated growth rate in alcohol excise taxes in the enacted FY 2014 budget of 51.4 percent over the FY 2013 final enacted estimate of $12.0 million.
6

Overview
Enacted FY 2014 inheritance and gift tax, racing and athletics tax, and realty transfer tax revenues are all equal to the amounts adopted at the May 2013 REC. FY 2014 enacted inheritance and gift tax revenues are estimated at $31.8 million, $3.6 million less than the estimate included in the Governor’s FY 2014 recommended budget but 5.3 percent more than the final enacted FY 2013 estimate for inheritance and gift tax revenues. Racing and athletics tax revenues are enacted in FY 2014 at $1.2 million, $100,000 more than the amount recommended by the Governor for FY 2014 and equal to the amount estimated in the FY 2013 final enacted budget. FY 2014 enacted realty transfer tax revenues are estimated at $7.5 million, $800,000 more than the estimate included in the Governor’s FY 2014 recommended budget and 5.6 percent growth from the final enacted FY 2013 estimate for realty transfer tax revenues of $7.1 million. Other taxes are expected to comprise 1.2 percent of enacted total general revenues in FY 2014. Inclusive of the General Assembly’s proposed changes to departmental receipts, total departmental revenues are enacted to be $348.7 million in FY 2014, or 10.3 percent of enacted total general revenues. FY 2014 enacted departmental receipts are expected to generate $14.7 million less than the final enacted FY 2013 estimate. This decrease is due in part to the fact that $10.0 million of FY 2012 hospital licensing fee payments were received in late FY 2013. In addition, the Attorney General received $5.3 million from the settlement of lawsuits with several companies in FY 2013. Anticipated legal settlements entered into by the Attorney General are projected to be significantly less in FY 2014. The settlement payments are deposited as miscellaneous revenues within departmental receipts. The General Assembly’s FY 2014 enacted departmental receipts estimate is $4.6 million less than the estimate for FY 2014 contained in the Governor’s recommended budget but is $142.1 million more than the estimate adopted at the May 2013 Revenue Estimating Conference. In the FY 2014 enacted budget, the General Assembly accepted the Governor’s recommendation to reinstate the hospital licensing fee as it requires annual legislative approval. The General Assembly enacted a hospital licensing fee rate of 5.246 percent applied to hospital fiscal year 2012 net patient revenues. The hospital licensing fee rate of 5.246 percent is discounted by 37.0 percent “for all hospitals located in Washington County, Rhode Island” subject to the approval of the Centers for Medicare and Medicaid Services. The 37.0 percent discount yields an effective hospital licensing fee rate for Washington County hospitals of 3.305 percent. The General Assembly’s FY 2014 enacted departmental revenues figure includes the following proposals:
An increase of $141.3 million from reinstituting the hospital licensing fee as noted above;
A decrease of $363,040 from the acceptance of the Governor’s proposal to eliminate the Department of Labor and Training’s hazardous substance right to know fee;
An increase of $40,000 from concurrence with the Governor’s recommendation to realize interest paid on overdue taxes from the creation of a special investigative tax unit;
An increase of $10,000 from concurrence with the Governor’s recommendation to realize penalties paid on overdue taxes from the creation of a special investigative tax unit;
A decrease of $287,000 from the elimination of the Division of Motor Vehicles requirement of the filing of an accident report separate from that filed by law enforcement;
An increase of $300,000 from the posting of the State’s gross investment earnings rather than the net investment earnings after the deduction of bank fees associated with those earnings;
An increase of $300,000 from the mandate that all municipalities use the State approved universal summons for red light violations issued via photo enforcement; and
7

Overview
An increase of $850,000 from the application of the indirect cost recovery rate of 10.0 percent to the monies received by the Attorney General for the national mortgage settlement.
The FY 2014 enacted revenues for the other sources component of total general revenues totals $409.3 million, an increase of $16.5 million, or 4.2 percent, compared to the final enacted revenue estimate for FY 2013. The enacted FY 2014 estimate for other sources is $2.0 million more than the estimate adopted at the May 2013 Revenue Estimating Conference but $3.5 million less than the amount the Governor recommended in his FY 2014 budget. Within the gas tax transfer component, the General Assembly’s FY 2014 enacted budget shows no change from the FY 2013 final enacted estimate. Effective July 1, 2009, the state’s general fund no longer receives any of the revenues generated by the state’s $0.32 per gallon motor fuel tax. Other miscellaneous revenues are enacted at $5.5 million in FY 2014, $3.0 million more than estimate adopted at the May 2013 REC and $3.1 million more than the estimate included in the Governor’s FY 2014 recommended budget. Most of the difference between these previous estimates and the enacted FY 2014 estimate is the result of the General Assembly’s one-time transfer of $3.0 million of bond premium proceeds from the Rhode Island Capital Plan Fund to the state’s general fund. The enacted FY 2014 lottery transfer is $13.9 million more than the final enacted FY 2013 estimate, an increase of 3.7 percent. The enacted FY 2014 lottery transfer estimate is $1.0 million lower than the estimate adopted at the May 2013 Revenue Estimating conference and $6.7 million less than the amount included in the Governor’s FY 2014 recommended budget. The decrease in the enacted FY 2014 lottery transfer estimate from the estimate adopted at the May 2013 REC is due to the increase in Newport Grand’s share of the net terminal income generated by the VLTs installed there from 27.8 percent to 30.05 percent effective from July 1, 2013 through June 30, 2015. It should be noted that the Division of Lottery’s cost to administer and supervise the operation of table games at Twin River was included in the lottery transfer estimate adopted at the May 2013 REC. In FY 2014, the lottery transfer is enacted at $394.1 million with $63.0 million generated by traditional and monitor games, $324.6 million generated by the video lottery terminals installed at Newport Grand and Twin River and $6.5 million produced by the table games located at Twin River. The enacted FY 2014 lottery transfer will comprise 11.7 percent of enacted total general revenues. The final category of general revenue receipts is the unclaimed property transfer. In the FY 2014 enacted budget, this transfer is expected to increase by $2.7 million, or 38.6 percent, from the final enacted FY 2013 estimate. The unclaimed property transfer is projected to be $9.7 million in the enacted FY 2014 budget and comprise 0.3 percent of enacted total general revenues. The enacted FY 2014 unclaimed property transfer estimate is the same as the amount adopted at the May 2013 REC and is $100,000 more than the estimate included in the Governor’s recommended FY 2014 budget. The chart below shows the sources of general revenues for the period FY 2011 – FY 2014. The figures for FY 2011 and FY 2012 are final audited numbers, while those for FY 2013 and FY 2014 are the enacted estimates. The values of the two major sources of general revenues, personal income taxes and sales and use taxes, are highlighted.
8

Overview
Expenditure Changes from Governor’s
Recommended Budget
In the FY 2014 enacted budget of $8,213.1 million, the Legislature added a total of $40.6 million, or 0.5 percent to the Governor’s recommendation of $8,172.5 million comprised of reducing general revenue expenditures by $39.4 million primarily due to net resources being $52.4 million less than November, and addition of $72.6 million in federal funds, $2.3 million in
restricted receipts, and $5.1 million in other funds. The general revenue decrease from the Governor’s recommended budget is 1.2 percent, for a total of $3.399 billion. Major general revenue items in the area of general government include: removal of $2.1 million in debt service based on expected issuances; removal of $5.0 million from the Governor’s initiative to provide $10.0 million as an incentive to communities to reduce unfunded liabilities in locally administered pension plans, and; removal of $5.0 million from the $15.4 million recommended by the Governor in FY 2014 for distressed community relief. In the human services area of government, a general revenue reduction of $7.7 million is related to the results of the May 2013 Caseload Estimating Conference, which forecasted lower cash assistance and medical assistance expenditures in FY 2014. Total reduction across all fund sources as a result of the May 2013 Caseload Estimating Conference is $14.6 million in FY 2014. The federal Patient Protection and Affordable Care Act was also addressed by the Legislature by removal of $4.0 million in general revenue and $3.0 million in federal funds, to accommodate expected transition of eligible clientele in the Human Services and Behavioral Health departments to the expanded Medicaid program, or to the health benefits exchange. In the area of state personnel, the Legislature amended the Governor’s recommendation by including an additional $5.9 million in turnover savings across all state departments and identifying an additional $4.1 million in personnel savings due to delays in filling positions in several departments. The Legislature also removed a total of $2.7 million, including $1.5 million in general revenue, due to a recalculation of the retiree health benefit rate for state employees based on the most recent revaluation of the actuarial requirements of the state for this benefit. The Legislature also delayed implementation of termination of state-sponsored health coverage for divorced spouses of state employees till January 2014, requiring
1021.31060.5 1075.3
1109.2
1007.51043.1
1068.2 1088.9
0.0
200.0
400.0
600.0
800.0
1000.0
1200.0
FY 2011 FY 2012 FY 2013 FY 2014
General Revenue Sources ($ millions)
Personal Income Tax General Business Taxes Sales and Use Taxes Other Miscellaneous Revenues
Lottery Receipts Other Taxes Departmental Receipts Other Sources
9
Overview
General Government
addition of $915,200 in general revenue to the enacted level. The termination plan, once implemented, is expected to save the state $1.4 million across all fund sources in each year. Federal funds, which total $2.718 billion in the enacted budget, increase by 2.7 percent or $72.6 million from the Governor’s recommended amount of $2.645 billion. Specific additions include $54.8 million for extension of unemployment insurance, due to notification of this extension after the Governor had submitted his initial recommendation. These federal dollars will be spent in concert with $6.6 million in Employment Security financing for a total of $61.4 million. The Affordable Care Act also resulted in an additional $15.4 million to reflect updated enrollment projections for eligible participants up to 138.0 percent of the federal poverty level for medical assistance. This program is 100.0 percent financed with $85.2 million in federal funds in FY 2014, and will not require a state share until FY 2017 and beyond. The Legislature also added $4.9 million in federal stimulus financing for the state’s energy plan. In combination with $2.3 million in FY 2013, the state will begin several new initiatives, including a revolving loan program for small commercial energy efficiency projects. Restricted Receipts total $255.0 million in the FY 2014 enacted budget, an increase of $2.3 million or 0.9 percent from the Governor’s recommended budget of $252.8 million. The increase is in part attributable to the Legislature’s recommendation that $1.6 million of general revenue be replaced with restricted receipt proceeds from state-owned land sales, which is allowed under law for information technology projects that support state agencies and access to public information. The Legislature also shifts $1.8 million from general revenues to restricted receipts, requiring state agencies to maximize indirect cost recovery opportunities from federal grant agreements. These additions are offset by removing $2.5 million from the Governor’s proposal to shift the renewable energy fund to the Department of Administration, but instead the Legislature recommends the fund remain part of the Economic Development Corporation. Other funds increase by $5.1 million in the enacted budget to a total of $1.881 billion, an increase of 0.3 percent from the Governor’s recommendation. The increase includes additional financing proposed by the Governor for several projects financed from the Rhode Island Capital Plan Fund, including $1.5 million for Hurricane Sandy repairs of state-owned facilities, $4.2 million for recreational facility and commercial fishing pier improvements managed by the Department of Environmental Management, and $1.9 million for rehabilitation projects for state facilities that serve the public, specifically buildings at the Pastore Center. The Legislature also includes $1.0 million to renovate Harrington Hall at the Pastore Center, which serves as a shelter for the homeless. Because this rehabilitation will be financed with Rhode Island Capital Plan Fund resources, federal dollars that might otherwise be used for construction are now available to provide emergency winter shelter operations. These increases are offset by a reduction of $10.0 million from the Governor’s recommendation for a local roads improvement program. The Legislature recommends that the Rhode Island Clean Water Finance Agency use its bonding authority to provide a financing tool for local governments to provide transportation infrastructure improvements through the establishment of a new revolving loan fund seeded with $7.0 million of bond premium proceeds. The $3.0 million balance of the bond premium proceeds from the 2013 debt issuance have been deposited into the general fund. The Legislature also added an additional $1.4 million in Community Service Grant financing, bringing the total enacted amount $8.7 million. The new additions include $100,000 more for the Institute of Non-Violence, $300,000 for the John Hope Settlement House, $200,000 for a Justice Assistance Grant, $100,000 for the Domestic Violence Court Advocacy program in the Courts, $500,000 for Woonsocket schools and $200,000 for minor adjustments to various grants.
The FY 2014 enacted budget for the Department of Administration totals $428.7 million, including $264.8 million in general revenue, $62.2 million in federal funds, $15.9 million in restricted receipts, $78.7 million in operating transfers, and $7.1 million in other funds. The FY 2014 enacted budget is a $2.9 million increase
10

Overview
from the Governor’s recommended budget of $425.8 million, and a $15.7 million increase from the final FY 2013 revised budget. The FY 2014 enacted budget for Central Management is $3.1 million, with $2.9 million in general revenue and $194,591 in federal funds. The FY 2014 enacted budget is an increase of $50,000 from the Governor’s recommendation, which reflects an appropriation for a market analysis on the 38 Studios Debt. The FY 2014 enacted budget is a $482,683 increase from the final FY 2013 revised budget. The FY 2014 enacted budget for the Office of Accounts and Control is $4.0 million, all general revenue, and is $50,000 less than the Governor’s recommended budget, and reflects an increase of $187,633 from the final FY 2013 revised budget. The Office of Management and Budget has a FY 2014 enacted budget of $4.5 million, including $4.0 million in general revenue and $481,303 in restricted receipts. The FY 2014 enacted budget reflects a $145,000 decrease in general revenue from the Governor’s Recommendation and a $1.5 million increase from the final FY 2013 revised budget. For the Division of Purchasing, the FY 2014 enacted budget is $3.2 million, including $2.7 million in general revenue, $193,710 in federal funds, and $360,814 in operating transfers. The FY 2014 enacted budget is $182,594 less than the Governor’s recommendation. The General Assembly did not approve the new Deputy Director of Purchasing as proposed by the Governor. The FY 2014 enacted budget is a $197,364 increase from the final FY 2013 revised. The FY 2014 enacted budget for the Bureau of Audits is $1.3 million, all general revenue, and is $50,000 less than the Governor’s FY 2014 recommendation, but reflects a $207,857 increase from the final FY 2013 revised budget. The FY 2014 enacted budget for the Division of Human Resources is $11.2 million, including $8.3 million in general revenue, $808,123 in federal funds, $469,283 in restricted receipts, and $1.6 million in other funds. The FY 2014 enacted budget is $355,765 less than the Governor’s recommendation. The FY 2014 enacted budget is $236,760 more than the final FY 2013 revised budget. The General Assembly did not approve 2.0 FTE positions for State Police and DMV HR Coordinators as was proposed by the Governor. The Personnel Appeal Board has a FY 2014 enacted budget of $75,036, all general revenue, and no change from the Governor’s recommendation. The final FY 2013 revised budget was at the same level of funding. The FY 2014 enacted budget for the Division of Legal Services is $1.9 million, all general revenue, and is $150,000 less than the Governor’s recommendation. The General Assembly did not include this funding for State Employee Labor Contract Negotiations proposed by the Governor. The FY 2014 enacted budget includes a $38,449 increase from the final FY 2013 revised budget. The Division of Facilities Management has a FY 2014 enacted budget of $37.4 million, including $32.2 million in general revenue, $925,630 in federal funds, $616,083 in restricted receipts, and $3.7 million in other funds. The FY 2014 enacted budget is $100,000 less than the Governor’s recommendation. The FY 2014 enacted budget is $1.9 million more than the final FY 2013 revised budget with $1.6 million from general revenues. For the Division of Capital Projects and Property Management, the FY 2014 enacted budget is $1.2 million, all general revenue, and is $100,000 less than the Governor’s recommendation. The General
11
Overview
Assembly did not include 1.0 FTE position for a Capital Projects Manager proposed by the Governor. The FY 2014 enacted budget is $36,744 less than the final FY 2013 revised with a decrease of $100,000 in federal funds, which is offset by an increase in general revenue of $63,256. The FY 2014 enacted budget for the Division of Information Technology is $34.0 million, including $19.3 million in general revenue, $7.1 million in federal funds, $5.4 million in restricted receipts, and $2.2 million in other funds. The FY 2014 enacted budget is $830,244 less than the Governor’s recommendation and the General Assembly did not approve $75,000 for the purchase of new computers for Division staff, $150,000 for software maintenance contracts, and $455,244 for 3.0 FTE positions to maintain the state accounting system (RIFANs) which is an Oracle software platform. The FY 2014 enacted budget is $713,425 greater than the final FY 2013 revised budget. The Office of Library and Information Services has a FY 2014 enacted budget of $2.2 million, including $1.0 million in general revenue, $1.2 million in federal funds, and $1,694 in restricted receipts. The FY 2014 enacted is no change from the Governor’s recommendation and is $63,822 less than the final FY 2013 revised budget. The FY 2014 enacted budget for the Division of Planning is $20.7 million, including $4.7 million in general revenue, $11.0 million in federal funds, and $5.0 million in operating transfers. The FY 2014 enacted budget includes a $4.0 million increase in federal funds for Community Development Block Grant from the Governor’s original recommendation (the Governor requested a $2.0 million increase in a March 2013 amendment). The FY 2014 enacted budget includes an increase of $750,000 in general revenue from the Governor’s recommendation for a Housing Rental Subsidy, which is offset by a $450,000 decrease for the Water Allocation Plan, which is under the purview of the Water Resources Board. The FY 2014 enacted budget is $609,837 more than the final FY 2013 revised. The Office of Energy Resources has a FY 2014 enacted budget of $11.2 million, including $5.7 million in federal funds and $5.5 million in restricted receipts. The FY 2014 enacted budget is a $2.4 million increase from the Governor’s recommendation. This includes a $4.9 million increase in federal stimulus funds for the State Energy Plan (the Governor requested this increase in a May 2013 amendment), but is offset by a $2.5 million decrease in restricted receipt funds to reverse the Governor’s recommendation to transfer the Renewable Energy Fund from the RI Economic Development Corporation (EDC) to the Office of Energy Resources. The FY 2014 enacted budget is a $1.2 million increase from the final FY 2013 revised. The Division of Construction Permitting, Approvals, and Licensing has a FY 2014 enacted budget of $2.8 million, including $1.4 million in general revenue and $1.4 million in restricted receipts, no change from the Governor’s recommendation. The FY 2014 enacted budget is a $103,887 increase from the final FY 2013 revised. The RI Health Benefits Exchange has a FY 2014 enacted budget of $28.3 million, all federal funds, and no change from the Governor’s recommendation. The FY 2014 enacted budget decreased $480,901 in federal funds from the final FY 2013 revised budget. The FY 2014 enacted budget for the General program is $70.9 million, including $23.6 million in general revenue, $4.3 million in federal funds, $421,500 in restricted receipts, and $42.5 million in operating transfers, which is comprised of Rhode Island Capital Plan Fund (RICAP) resources for the Department. The FY 2014 enacted budget is a $1.7 million increase from the Governor’s recommendation. This includes a $700,000 reduction in EDC Operations and Tourism, but is offset by a $500,000 increase for Innovation Matching Grants and Bio Science Internships. The FY 2014 enacted budget includes an additional $1.0 million in RICAP funds for the renovation of Harrington Hall at the Pastore Complex in
12

Overview
Cranston. The FY 2014 enacted budget is a $20.3 million increase from the final FY 2013 revised budget. The FY 2014 enacted budget for the Debt Service program is $193.0 million, consisting of $157.4 million in general revenue, $2.8 million in federal funds, $2.1 million in restricted receipts, and $30.7 million in operating transfers. The FY 2014 enacted budget is $1.4 million less than the Governor’s recommendation with a $1.3 million decrease based on the actual debit service for the 2013 issuance for energy conservation projects, the integrated tax system and the Enhanced Technology in Local Education Agencies project, which were approved by the 2012 General Assembly. The FY 2014 enacted budget also includes $750,000 in savings for Department of Transportation debt service thereby reducing the Governor’s proposed shift of debt service costs to general revenue from $10.0 million to $9,250,000. The FY 2014 enacted budget includes $2.5 million in general revenue to transfer to the Capital Reserve Fund of the EDC Job Creation Guaranty Program for the failure of 38 Studios to make its debt payments. Debt Service in the FY 2014 enacted budget is $2.5 million less than the final FY 2013 revised budget. The FY 2014 budget authorizes a FTE position ceiling of 720.7, which is 7.0 FTE positions less than the level recommended by the Governor. The decrease consists of 3.0 FTE positions in the Division of Information Technology to support the state accounting system RIFANs, which is an Oracle based platform. The reduction also includes 1.0 FTE position for a Deputy Director for the Division of Purchasing, 1.0 FTE position in the Division of Capital Projects and Property Management for a Project Manager, and 2.0 FTE positions for Human Resources Coordinator positions for the State Police and the Division of Motor Vehicles. The FY 2014 FTE authorization level is 8.6 more than the revised FY 2013 authorized level. The FY 2014 enacted budget for the Department of Business Regulation totals $13.0 million, including $9.2 million in general revenue, $1.7 million in federal funds, and $2.0 million in restricted receipts. General revenue funding is $200,000 less than the Governor’s recommendation as a result of additional turnover savings taken by the General Assembly. FY 2014 enacted general revenue is $320,366, or 3.6 percent, more than the final FY 2013 revised budget primarily due to personnel adjustments for staff in FY 2014. The FY 2014 enacted budget for the Central Management program totals $1.2 million, all in general revenue, no change from the Governor’s recommendation. The FY 2014 enacted budget for the Banking program is $1.84 million in all funds, including $1.2 million in general revenue, no change from the Governor’s recommendation. In restricted receipts, the program’s enacted budget is $125,000, no change from the Governor’s recommendation. The FY 2014 enacted budget for the Securities Regulation program is $1.0 million in all funds, including $1.0 million in general revenue and $15,000 in restricted receipts, no change from the Governor’s recommendation. The FY 2014 enacted budget for the Commercial Licensing, Racing and Athletics program totals $1.2 million, no change from the Governor’s recommendation. In general revenue, Commercial Licensing, Racing and Athletics has a FY 2014 enacted budget of $707,941, no change from the Governor’s recommendation. Restricted receipt funding is $500,329, no change from the Governor’s recommendation. The FY 2014 enacted budget for the Insurance Regulation program totals $5.1 million, including $3.8 million in general revenue, a decrease of $200,000 for turnover savings as compared to the Governor’s recommendation. Restricted receipts total $1.3 million, no change from the Governor’s recommendation.
13

Overview
The FY 2014 enacted budget of the Office of Health Insurance Commissioner totals $2.3 million, including $542,180 in general revenue and $10,500 in restricted receipts, and $1.8 million in federal funds, as recommended in the Governor’s budget. The FY 2014 enacted budget for the Board of Accountancy totals $81,034, all general revenue, as in the Governor’s recommendation. The FY 2014 enacted budget for the Boards for Design Professionals totals $253,834, all general revenue, no change from the Governor’s recommendation The FY 2014 authorization of 94.0 FTE positions is the same level as in the final FY 2013 revised budget. The FY 2014 enacted budget for the Department of Labor and Training totals $592.5 million, including $9.1 million in general revenue, $95.7 million in federal funds, $43.1 million in restricted receipts, $702,000 the Rhode Island Capital Plan Fund and $443.9 million in other funds. The enacted budget reduces general revenue in the Workforce Regulation and Safety program by $25,000 for additional turnover savings. The enacted budget also reduces the Governor’s recommended Work Immersion & Non-Trade Apprenticeship Program funding in the Workforce Development Services program by $750,000, resulting in an enacted general revenue budget of $1,250,000 for this new program. The Department of Labor and Training’s FY 2014 enacted budget of $592.5 million reflects a decrease of $131.1 million, or 18.1 percent, from the FY 2013 final revised budget. General revenue increases by $1.3 million, driven by the $1.3 million appropriation for the Governor’s Workforce Development Initiative. RI Capital Plan Fund resources reflect a net decrease of $284,187, including a $760,797 decrease attributable to the anticipated completion of the Center General Roof replacement in FY 2013, offset by a $476,610 increase in asset protection funds. Federal funds decrease $70.6 million from the FY 2013 final enacted budget. The federal fund decrease is primarily driven by the cessation of federal Unemployment Insurance benefits on December 31, 2013, including Extended Unemployment Insurance benefit payments and Unemployment Insurance Administration funds, resulting in respective declines of $56.8 million and $5.0 million. Workforce Development Services federal funds also declined, including a $2.8 million decrease in Workforce Investment Act funds and a $1.6 million decrease in Trade Readjustment Act funds. The $43.9 million decrease in other funds results from the $28.3 million decrease in Unemployment Insurance benefit payments and a $15.1 million decrease in principal and interest payments on the Title XII loan, in anticipation of the loan being repaid in the beginning of calendar year 2015, whereas Temporary Disability Insurance payments increase by $861,725. Restricted receipts decrease in the $17.7 million from the FY 2013 final enacted budget, including a $15.1 million decrease in the Job Development Fund for transfer to the Employment Security Trust Fund and a $2.3 million reduction in Governor’s Workforce Board/Human Resources Investment Council grants. General revenue for Policemen’s and Firemen’s Relief benefit payments remain relatively constant, increasing only $28,473 above the FY 2013 final enacted budget. Article 14 of the FY 2014 Appropriations Act makes several changes relating to the employment security trust fund. First, the 0.3 percent assessment levied on employers to repay Rhode Island’s federal unemployment insurance loans is sunset in tax year 2015. Based on department projections, these loans will be fully repaid in that tax year and thus the additional assessment will no longer be required. Second, the article authorizes the trust fund to borrow from the State General Fund for the purpose of repaying outstanding loans from the federal government in a given fiscal year. Such loans must be repaid to the
14

Overview
general fund, with interest, within the same fiscal year. This authorization will enable the department to pay off the state’s federal loans in a time frame that will avoid over $30.0 million in additional unemployment tax assessments on employers in tax year 2015 that would otherwise be owed if the state maintained a loan balance past November 10, 2014. The Department’s FY 2013 final revised budget totals $723.6 million, an increase of $62.0 million, or 9.4 percent, from the FY 2013 enacted budget. The final revised budget includes $7.7 million in general revenue, $166.3 million in federal funds, $60.8 million in restricted receipts, $986,187 from the RI Capital Plan Fund, and $487.8 million in other funds. Compared to the FY 2013 enacted budget, general revenue decreases by $130,269, federal funds increase by $54.5 million, restricted receipts increase $24.6 million, RI Capital Plan Fund resources decrease by $77,963 and other funds decrease by $16.9 million. The final enacted budget does not include the Governor’s recommended $1.0 million general revenue appropriation to provide funding for the Work Immersion & Non-Trade Apprenticeship initiative in the Workforce Development Services program. General revenue for Policemen’s and Firemen’s Relief benefit payments reflect a $100,000 decrease from the Governor’s recommendation. An additional reduction was made to RI Capital Plan Fund appropriations, which reflects a $475,000 decrease from the Governor’s recommendation based on updated project costs. The increase in the FY 2013 final revised federal funds budget is primarily attributable to federal Unemployment Insurance benefits being extended through the end of CY 2013. This results in a $44.5 million increase in federal Unemployment Compensation benefits, including $39.4 million for extended benefits and $5.1 million for short-time benefits, and a $5.1 million increase in Unemployment Insurance (UI) Administration funds. Additional federal funds were appropriated for UI Administration information technology, including $1.5 million in UI Administration funds, which constitutes a portion of the aforementioned $5.1 million UI Administration increase, and $1.4 million in federal UI Supplement Budget Request funds. In the Workforce Development Services program, federal grants were obtained for a number of new programs including $1.4 million for the Hurricane Sandy National Emergency Grant, $1.0 million for the DLT TANF Summer Youth program, $439,659 for the Disability Employment Initiative and $335,571 for the Data Quality Initiative. In existing Workforce Development programs, Workforce Investment Act funds increase by $2.5 million and Trade Readjustment Act funds decrease by $1.4 million. In the FY 2013 final revised budget, the increase in restricted receipts is attributable to a $19.0 million increase in the Job Development Fund for operating transfers to the Employment Security Trust Fund and a $4.4 million increase in Governor’s Workforce Board/Human Resources Investment Council grants. An other funds decrease of $16.9 million results from decreases of $23.3 million in Unemployment Insurance Benefits, $11.0 million in Temporary Disability Insurance benefits, and $2.0 million for Unemployment Insurance benefit payments to other states, which are partially offset by a $19.0 million increase in payments to the federal government for Title XII advances. RI Capital Plan Fund resources for asset protection decrease by $85,110 from the enacted amount, which is slightly offset by a $7,147 increase in financing for the Center General building’s roof replacement. The decrease in general revenue is driven by a $102,421 reduction in Policemen’s and Firemen’s Relief benefit payments and a $31,960 decrease in general revenue for the Workforce Regulation and Safety program. The Department’s authorized FTE position level in FY 2014 totals 392.0, a reduction of 31.0 FTE positions compared to the final FY 2013 revised authorization of 423.0, resulting from decreased federal funds in the Income Support and Workforce Development Services programs due to the decreased UI Administration funds at the end of CY 2013.
The FY 2014 enacted budget for the Department of Revenue totals $353.4 million in all funds, including $102.0 million in general revenue, $3.0 million in federal funds, $1.8 million in restricted receipts,
15

Overview
$150,000 in operating transfers, and $246.4 million in other funds. The 2014 enacted budget is a decrease of $8.0 million in general revenue from the Governor’s recommended budget. The Governor recommended $110.0 million in general revenue.
The majority of the decrease in general revenue from the Governor’s recommended budget is in State Aid to municipalities. The Governor’s FY 2014 budget proposed $69.9 million in general revenue appropriated State Aid and the enacted budget provides $61.9 million. See below table for a breakdown of the changes made by the General Assembly by State Aid category:
General Revenue Appropriated State Aid to Municipalities: FY 2014 Governor’s Recommended vs. FY 2014 Enacted
General Revenue Appropriated State Aid FY 2014
Governor's Recommended
FY 2014 Enacted
Variance from
Governor's
PILOT (Payment in Lieu of Tax) $33,080,409 $35,080,409 $2,000,000
Distressed Community Relief Fund $15,384,458 $10,384,458 ($5,000,000)
Property Revaluation Program $516,615 $516,615 $0
Municipal Incentive Aid (New FY 2014) $10,000,000 $5,000,000 ($5,000,000)
Motor Vehicle Excise Tax Reimbursement $10,000,000 $10,000,000 $0
Totals $68,981,482 $60,981,482 ($8,000,000) * The Public Service Corporation Tax, Hotel Tax, and Meals and Beverage Tax are considered aid to municipalities, but are "Pass Through" revenues and are not appropriated. State Library Aid is also general revenue appropriated State Aid (FY 2014 enacted $11.3 million), but is allocated in the Department of Administration budget.
Beginning in FY 2014 and continuing through FY 2016, Municipal Incentive Aid will provide a new category of state assistance with the purpose of encouraging municipalities to improve the sustainability of their retirement plans and to reduce unfunded liabilities. The aid for FY 2014 provides $5.0 million, which is a decrease of $5.0 million from the Governor’s recommendation. The aid to Distressed Community Relief Fund is provided at $10.4 million, which is a decrease of $5.0 million from the Governor’s recommendation. The combined $10.0 million decrease is offset by a $2.0 million increase in the PILOT (Payment in Lieu of Tax Exempt Property) Program which provides $35.1 million for FY 2014. The FY 2014 enacted budget also provides $957,497 in restricted receipts from the Car Rental Surcharge for the City of Warwick. The total amount of appropriated State Aid to municipalities (including State Library Aid appropriated in the Department of Administration budget) and “Pass Through” revenue State Aid is $113.2 million for FY 2014. This is an increase of $5.9 million from the final FY 2013 revised budget, which is provided at $107.2 million. The FY 2014 enacted budget of $353.4 million in all funds for the Department of Revenue reflects an increase of $12.8 million from the final FY 2013 revised budget of $340.6 million. The primary driver of the increase is with the Lottery Division’s casino operations at Twin River and an overall division increase of $7.3 million. Appropriated State Aid increased by $3.9 million with the new Municipal
16
Overview
Incentive Aid beginning in FY 2014. The Division of Motor Vehicles increased by $1.0 million primarily in general revenue personnel and operating costs. The FY 2014 enacted budget for the Office of the Director of Revenue totals $1.2 million, all in general revenue, and no change from the Governor’s recommendation. Budgeted expenses for FY 2014 increase $331,730 from the final FY 2013 revised budget. The primary driver of the increase is to establish a 1.0 FTE position for a new Chief Financial Officer of the Department. The FY 2014 enacted budget for the Office of Revenue Analysis totals $528,721, all in general revenue, and no change from the Governor’s recommendation. Budgeted expenses increased from the final FY 2013 revised budget to the FY 2014 enacted budget by $51,256. The Division of Lottery has a FY 2014 enacted budget of $245.5 million, all other funds, and no change from the Governor’s recommendation. The Lottery Division began overseeing casino operations at Twin River with table games opening in June 2013. The final FY 2013 revised budget provides $940,000 for casino operations oversight and the FY 2014 enacted budget provides $4.3 million. This is the largest driver of the $7.3 million increase in expenditures for the Lottery from the final FY 2013 revised budget of $238.2 million to the FY 2014 enacted budget of $245.5 million. The estimated lottery transfer in FY 2014 to the general fund is $395.1 million, with $325.6 million from VLTs (Video Lottery Terminals), $63.0 million from traditional games, and $6.5 million in net revenues from the operation of table games at Twin River (figures as of the May 2013 Revenue Estimating Conference). This is projected to be an increase of $14.9 million from FY 2013 (projected at $380.2 million). The Division of Taxation has a FY 2014 enacted budget of $21.1 million with $18.0 million in general revenue, $1.3 million in federal funds, $849,626 in restricted receipts, and $959,849 in other funds. The General Assembly reduced Taxation’s budget by $100,000 in general revenue for additional turnover savings. There is an increase of $306,582 from the final FY 2013 revised budget to the FY 2014 enacted. The enacted budget includes 2.0 additional FTE positions for a Chief, Special Investigations and a Revenue Agent I for a new Special Investigations Unit. The FY 2014 enacted budget for the Division of Motor Vehicles is $20.8 million with $18.9 million in general revenue, $1.8 million in federal funds, $14,763 in restricted receipts, and $150,000 in operating transfers. There is an increase of $280,500 in FY 2014 general revenue to restore the Governor’s recommendation to eliminate the requirement for the issuance of validation stickers on license plates. This is offset by $150,000 in additional turnover savings. The FY 2014 enacted budget provides a $1.0 million increase in expenditures from the final FY 2013 revised budget. This is primarily due to an increase in general revenue funded personnel and operating costs. For FY 2014, the Department of Revenue’s authorized FTE level is 492.0 FTE positions, an increase of 3.0 FTE positions from the final FY 2013 revised level of 489.0 FTE positions. The 3.0 new FTE positions include a CFO for the Department in the Office of the Director, a Chief, Special Investigations position and Revenue Agent I position for a new Special Investigations Unit in the Division of Taxation. The FY 2014 enacted budget for the Legislature totals $37.8 million, including $36.2 million in general revenue and $1.6 million in restricted receipts. The Legislature’s budget of $37.8 million reflects a net decrease of 9.8 percent, or $4.1 million, from the FY 2013 revised budget of $41.9 million. In FY 2014, compared to the FY 2013 revised budget, personnel financing increases by $478,063, attributable to increases in statewide benefit calculations. Consultant and operating expense decline by a total of $1.5 million, or 31.5 percent, largely attributable to the end of the redistricting project in early FY 2013. Capital financing decreases by $3.1 million, from $4.4 million to $269,500, reflecting the Legislature’s
17
Overview
efforts to more closely align its budget with anticipated expenditures. Grants are financed at a total of $2.3 million, corresponding to historical expectations of legislative grant awards. In relation to the Governor’s FY 2014 recommendation of $38.6 million, the reduction of $800,000 in the enacted budget reflects removal of $700,000 in personnel turnover savings and $100,000 in operating expense across all programs throughout the General Assembly. The FY 2013 revised budget is $3.1 million greater than the original enacted amount, reflecting a portion of the reappropriation from FY 2012 which was originally $6.3 million. The FY 2013 revised budget corresponds to the Governor’s recommendation for the Legislature. The Legislature’s FY 2014 FTE authorization of 298.5 FTE positions is the same as the revised FY 2013 FTE authorization. The FY 2014 enacted budget for the Office of the Lieutenant Governor totals $2.1 million, including $986,890 in general revenue and $1.1 million in federal funds. The FY 2014 enacted federal funds budget reflects a $315,383, or 39.8 percent, increase above the FY 2013 final revised budget, attributable to the Center for Medicare & Medicaid Innovation (CMMI) State Innovation Model federal grant. This grant totals $969,380 in FY 2014, awarded to support the development and testing of state-based models for multi-payer payment and healthcare delivery system transformation. Federal funds obtained from the Office of the Health Insurance Commissioner’s Exchange Establishment One Grant also increase by $7,669; Exchange Establishment One Grant federal funds were obtained for assistance in health reform and are used to finance personnel costs associated with its administration. General revenue expenditures reflect an increase of $41,579, or 4.4 percent, over the final FY 2013 revised budget. The general revenue increase is driven by a $43,638 increase in personnel costs, resulting from the restoration of $13,000 in turnover savings taken in the final revised FY 2013 budget, in addition to salary step increases and benefit increases. The FY 2013 final revised budget totals $1.7 million, consisting of $945,311 in general revenue and $793,105 in federal funds. The FY 2013 final revised budget reflects a $663,368 increase in federal funds. This increase is primarily driven by the receipt of the CMMI State Innovation Model federal grant, resulting in a $661,666 federal funds increase. General revenue decreases by $17,644 from the FY 2013 enacted level, primarily resulting from $13,000 taken in turnover savings that was not included in the Governor’s recommendation, in addition to a $4,256 decrease resulting from allocating personnel costs to Exchange Establishment One Grant federal funds. The Office of the Lieutenant Governor’s FY 2014 FTE authorization is 8.0 FTE positions, reflecting no change from the FY 2013 final revised FTE authorization. The FY 2014 enacted budget for the Secretary of State totals $7.0 million from all funds, including $6.5 million in general revenue and $454,931 in restricted receipts. The enacted budget reflects a decrease of $95,000, or 1.3 percent, from the Governor’s recommendation, consisting of a $100,000 reduction in general revenue and a $5,000 increase in restricted receipts. The variance between the enacted budget and the Governor’s recommendation is primarily attributable to a reduction of $100,000 in general revenue for additional turnover savings. Separate legislation was previously approved by the General Assembly authorizing the creation of the Visitors Center/Gift Shop and an associated restricted receipt account with $5,000 of funding was authorized in the enacted budget. Compared to the FY 2013 final revised budget, the FY 2014 enacted budget reflects a decrease of $364,724, or 5.0 percent, consisting of a $335,492 decrease in general revenue, a $2,566 reduction in federal funds under the Help America Vote Act for election reform and mock elections, and a $26,666 decrease in Historical Records Trust restricted receipts. The decrease in the enacted budget is primarily
18

Overview
attributable to expenses related to the General Election held in November 2012, including $541,500 for printing of ballots and for referenda printing, $95,100 for mailing expenses, $50,000 in special legal expenses related to anticipated referenda challenges and $5,000 for interpreters for the translation of election materials. Statewide decreases total $36,660 for medical benefits and retiree health insurance rates savings and state fleet insurance rebates. The personnel and operating increases include a net of $155,718 mostly from restoration of turnover savings. The FY 2013 final revised budget totals $7.3 million, reflecting a decrease of $100,619, or 1.4 percent, from the FY 2013 enacted budget. The final revised budget consists of $6.8 million in general revenue, $2,566 in HAVA federal funds for election reform and mock elections, and $481,597 in Historical Records Trust restricted receipts. The $79,713 general revenue decrease in the FY 2013 final revised budget is primarily attributable to a $60,000 reduction in the budget for personnel and a $19,713 reduction for medical holiday savings. Likewise, the federal funds increase $2,566 for expenditures of the remaining funds in the Help America Vote Act (HAVA) for election reform and mock elections, and the Historic Records Trust restricted receipts decrease $23,472. The Secretary of State’s FTE authorization is 57.0 FTE positions, reflecting no change from the FY 2013 final revised FTE authorization. The FY 2014 enacted budget for the Office of General Treasurer totals $35.4 million, including $2.7 million in general revenue, $1.1 million in federal funds, $31.4 million in restricted receipts, and $228,923 in other funds. The Treasury’s FY 2014 enacted budget is $346,976, or 1.0 percent more than the Governor’s recommendation for the Office. The increase is comprised of $300,000 more in general revenue included in a Governor’s amendment to pay bank fees associated with investment of state funds from the Agency’s operating budget, which were previously paid from investment revenues. Restricted receipts increase by $46,976 over the Governor’s recommendation, comprised of $40,000 for research fellowship funds currently available from a private source, and $6,976 in the Unclaimed Property program’s transfer of net revenue, based on the May 2013 Revenue Estimating Conference. In relation to the FY 2013 final revised budget of $45.7 million, the FY 2014 enacted amount is less by $10.3 million or 22.6 percent. General revenue decreases by $171,809, comprised of the removal of $229,457 for administrative expense associated with the Defined Contribution program, which was financed with general revenue during the initial implementation phase, until employee fees were available for administration expenses. Capital expense decreases by $30,300 from FY 2013 revised to FY 2014 enacted to reflect completion of the Treasury’s move and build-out of its new 50 Service Avenue facility in the early part of FY 2013. These general revenue decreases are offset by an increase of $103,529 in personnel financing, most notably for health, retirement and retiree health benefit increases throughout the Agency. In federal funds, the FY 2014 enacted amount is $30,925 more than the FY 2013 revised budget, reflecting benefit adjustments for federally-financed personnel specifically in the DET Administration and Crime Victims Assistance units. Restricted receipt financing decreases by $10.2 million in FY 2014, most notably in the Unclaimed Property program to reflect the results of the May 2013 Revenue Estimating Conference which estimated a lower payout to unclaimed property owners in comparison to FY 2013, which was uniquely higher than previous years. In the Retirement Program, an additional FTE for a new Operations Manager position is provided, financed with restricted receipts. The FY 2014 FTE position authorization for the Office of the General Treasurer is 83.0 FTE positions, an increase of 1.0 FTE position from the FY 2013 FTE position level of 82.0 FTE positions. The FY 2014 enacted budget for the Board of Elections is $1.7 million, financed entirely from general revenue and the same as the Governor’s recommendation, and is a decrease of $147,462, or 7.8 percent, from the FY 2013 final revised budget. The FY 2014 recommendation reflects a $297,462 decrease
19

Overview
attributable mostly to removing expenses for the 2012 General Election, which will not be required in FY 2014. The FY 2014 budget also includes a $150,000 increase in the Board’s IT programming budget to implement an electronic filing system for independent advocates, required pursuant to House Bill H-7859 of 2012. Consistent with the Governor’s revised FY 2013 recommendation, an additional $6,750 is added in software maintenance agreements for ERTS hosting. The FY 2013 final revised budget totals $1.9 million, financed entirely of general revenue. The FY 2013 final revised budget reflects a $35,000 general revenue decrease from the Governor’s supplemental budget recommendation, primarily resulting from lower than anticipated purchased services of $38,000 and printing and operating costs of $37,000 offset by increases in postage and other operating of $27,054 and seasonal employment of $12,946 due to election mailings and staff support. The Board’s FTE authorization is 11.0 FTE positions in FY 2013 and FY 2014, consistent with the enacted FY 2013 authorization. The FY 2014 enacted budget for the Rhode Island Ethics Commission totals $1.6 million, all of which is from general revenue, and representing no change from the Governor’s recommended budget. Of this amount, $1.4 million is for payroll costs, $31,500 is for contract professional services, $162,305 is for operating costs, and $6,118 is for capital purchases and equipment. The final revised FY 2013 budget for the Commission totals $1.5 million from general revenue. This amount is $20,000 less than the Governor’s original budget recommendation. The $20,000 reduction in appropriations is due to additional turnover savings in the agency’s budget based on projected expenditures through the third quarter of FY 2013. The FY 2014 and FY 2013 FTE position authorization of 12.0 FTE positions is the same number of positions recommended by the Governor. The FY 2014 enacted budget for the Office of the Governor totals $4.4 million, all general revenue. Compared to the final revised FY 2013 budget, general revenue expenditures increase by $118,503. The FY 2014 enacted budget is $50,000 less than the Governor’s initial recommendation, which reflects additional turnover savings taken by the General Assembly. In relation to the FY 2013 final revised budget of $4.3 million, the FY 2013 enacted budget was $26.6 million; the decrease is the result of the Rhode Island Health Benefit Exchange being transferred to the Department of Administration in the Governor’s recommended supplemental budget. The FY 2013 final revised budget is $75,897 less than the Governor’s recommendation for the Office, as a result of additional turnover and operating savings taken by the General Assembly based on projected year-end expenditures. The Governor’s Office’s FTE authorization for both the FY 2013 revised and FY 2014 enacted budgets remains at 45.0 FTE positions. In the FY 2013 enacted budget there were 39.0 FTE positions authorized in the Governor’s Office and 6.0 FTE positions authorized in the Health Benefits Exchange. These Health Benefits Exchange positions were part of the Governor’s Office authorization initially. However, when the Health Benefits Exchange was created in the Governor’s Office, 6.0 existing, vacant FTE positions were used to allow the Exchange’s work to commence. Upon the transfer of the Health Benefits Exchange to the Department of Administration, new FTE positions were requested and the Governor’s Office maintained the 6.0 FTE positions as originally authorized for the Office.
20

Overview
Human Services
The FY 2014 enacted budget for the Rhode Island Commission for Human Rights totals $1.5 million, including $1.2 million in general revenue and $308,638 in federal funds. There was no change from the Governor’s original recommended budget in either source of funds. General revenue funding reflects a net increase of $17,656 or 1.6 percent from the final FY 2013 revised budget of $1.1 million. Federal funds reflect a net increase of $1,950 or 0.6 percent from the final FY 2013 revised budget of $306,688. The final revised FY 2013 budget totals $1.4 million, comprised of $1.1 million in general revenue and $306,688 in federal funds. Similar to FY 2014, there was no change to the Governor’s supplemental recommendation in either source of funds. The Commission for Human Rights enacted budget includes 14.5 FTE positions, which is unchanged from the final FY 2013 revised budget authorization. The FY 2014 enacted budget for the Public Utilities Commission totals $8.4 million, including $166,818 in federal funds and $8.3 million in restricted receipts. This is $149,090 less than the level recommended by the Governor and reflects the elimination of restricted receipt funds for two FTE positions that were formerly funded from American Recovery and Reinvestment Act (ARRA) federal funds. Compared to the final FY 2013 enacted budget of $8.5 million, the FY 2014 enacted budget is $69,647 less. Federal funds (primarily ARRA) decrease by $181,603 and restricted receipts increase by $111,956. The FY 2014 FTE positions authorization of 49.0 is 1.0 FTE position more than the final level of 48.0 authorized for FY 2013, which in turn is 1.0 FTE position more than the original FY 2013 enacted level of 47.0 FTE positions. These positions are an additional investigative auditor and an additional consumer agent position to address backlogs in audits, consumer related billing issues, service quality concerns and termination proceedings. The FTE authorization associated with the two positions formerly funded with federal ARRA dollars is maintained in the enacted budget and the Commission is authorized to fill these positions and finance them with restricted receipts funds.
The FY 2014 enacted budget for the Executive Office of Health and Human Services (EOHHS) totals $1.868 billion, including $843.2 million in general revenue, $1.015 billion in federal funds, and $10.0 million in restricted receipts. General revenue funding reflects a net increase of 8.3 percent, or $64.3 million from the final FY 2013 revised budget of $778.9 million, and corresponds to a
0.9 percent, or $7.8 million decrease to the Governor’s original FY 2014 recommendation. Federal funding reflects a net increase of 14.2 percent, or $126.4 million from the final FY 2013 revised budget of $888.3 million, and corresponds to a 1.5 percent, or $15.4 million increase to the Governor’s original FY 2014 recommendation. Restricted receipt funding reflects a net decrease of $3.2 million from the final FY 2013 revised budget of $13.2 million, and is equivalent to the Governor’s original FY 2014 recommendation. The Central Management program includes all financing for the administrative and operational activities of the Executive Office, and includes the Offices of the Secretary, Budget, Policy, Legal Services, Program Oversight, and Medical Assistance Administration. The FY 2013 final enacted general revenue budget for Central Management totals $23.2 million, a decrease of $3.1 million relative to the Governor’s recommendation. The legislative revision to the Governor’s supplemental budget consists of: (1) turnover savings of $816,572, as identified in the Executive Office’s third quarter report; (2) a substitution of $360,000 in federal funds for general revenue to adjust for an updated matching rate applied to the $1.00 per member per month charge for Medicaid beneficiaries under Rhode Island’s Statewide Health Information Exchange (HIE), known as “Currentcare”; and (3) a decrease of $1.9 million, reflecting the
21
Overview
full reallocation of matching funds for the HIV Treatment CNOM from general revenue to available balances of AIDS Drug Assistance Program (ADAP) rebate funds. The FY 2014 enacted general revenue budget for Central Management totals $27.7 million, a decrease of $2.4 million relative to the Governor’s recommendation of $30.1 million. The legislative revisions to the Governor’s original recommendation are: (1) a reduction of $584,294 due to the General Assembly’s withdrawal of 10.0 FTE positions from the Governor’s proposed FY 2014 staff augmentation of 21.0 FTE positions; (2) managed turnover savings of $250,000; (3) an increase of $150,000 for the continued support of contracted professional services for the Coordinated Health Planning Project; (4) a decrease of $320,584 in general revenue dedicated to the $1.00 per member per month charge for Medicaid beneficiaries under Rhode Island’s Statewide Health Information Exchange (HIE), known as “Currentcare” (again in recognition of an updated federal matching rate); and (5) reductions totaling $1.4 million to the HIV Treatment CNOM, reflecting both the reallocation of state matching funds to available ADAP rebate reserves and more aggressive transitioning of current beneficiaries to the ACA-expanded Medical Assistance program in CY 2014. FY 2014 appropriations for the Central Management program reflect the General Assembly’s concurrence with several budgetary initiatives set forth by the Governor. These include all-funds financing of $20.3 million, consisting of $3.6 million in general revenue, to support the Unified Health Infrastructure Project (UHIP), a fully integrated and interoperable system of eligibility determination spanning multiple programs of public assistance and the Health Benefits Exchange. Secondly, the General Assembly accepted the Governor’s recommendation providing $2.0 million, or $200,000 in general revenue, to develop enhancements to the Medicaid Management Information System (MMIS) that incorporate the use of real-time “predictive modeling” in the analyses of Medical Assistance claims. The General Assembly likewise approved the Governor’s proposed appropriation of $200,000, of which $100,000 is from general revenue, to create an EOHHS strategic plan. This plan will clarify the future goals and objectives of the Executive Office in its role as the Single State Agency for Medicaid Administration and the coordinating authority for all major human services agencies within state government. Enacted staffing authorizations total 184.0 FTE positions in FY 2014, an increase of 15.0 FTE positions relative to the FY 2013 final revised level of 169.0 FTE positions, and 10.0 FTE positions below the Governor’s FY 2014 recommendation of 194.0 FTE positions. The year-over-year increase in authorized staff reflects both the transfer-in of 4.0 chief financial officer positions from the departments currently under EOHHS auspices, as well as the augmentation of the EOHHS administrative staff by 11.0 FTE positions. The FY 2013 final enacted budget for the Medical Assistance (Medicaid) program totals $1.575 billion, including $755.7 million in general revenue. In comparison to the Governor’s original FY 2013 recommendation, which was predicated on the results of the November 2012 Consensus Caseload Estimating Conference (CEC), final revised appropriations reflect a net decrease of $40.6 million in total funding, and a $19.3 million net decrease in general revenue. Final FY 2013 appropriations fully comport with the Governor’s recommendation as amended following the May 2013 CEC, with no deviation from consensus estimates. The FY 2014 enacted budget for the Medical Assistance (Medicaid) program totals $1.751 billion, including $815.5 million in general revenue. In comparison to the Governor’s original FY 2013 recommendation, which was predicated on the results of the November 2012 Consensus Caseload Estimating Conference (CEC), final enacted appropriations reflect a net increase of $8.0 million in total funding, and a $5.4 million net decrease in general revenue. In contrast to the Governor’s recommendation as amended following the May 2013 CEC, enacted appropriations reflect a decrease of $7.5 million in total funding, and a $4.0 million decrease in general revenue. Relative to the FY 2013
22
Overview
final revised budget, total financing increases by $175.7 million, or $59.8 million in general revenue. Enacted appropriations also incorporate a Governor’s budget amendment transferring $11.1 million, or $5.5 million in general revenue, from the Department of Human Services, Division of Elderly Affairs’ Home and Community Care Medicaid Waiver program to the EOHHS Medical Assistance program. Funding for the Medical Assistance program reflects caseload levels as adopted by the May 2013 Consensus Caseload Estimating Conference (CEC), modified by both legislative items as well as various initiatives that were originally proposed by the Governor. Those initiatives set forth in the FY 2014 Governor’s Budget, and accepted by the General Assembly as part of the FY 2014 enacted budget include: (1) trend-based reductions to managed care capitation (i.e. monthly cost per member) rates, effective July 1, 2013; (2) a one-year freeze of FY 2013 payment rates for inpatient and outpatient hospital services within both the fee-for-service and the managed care segments of the Medical Assistance program; (3) suspension of the rate increase to nursing care and hospice facilities scheduled for October 1, 2013; and (4) savings stemming from the aggressive recoupment of fraudulent or otherwise inappropriate Medicaid payments uncovered by the newly established Office of Program Oversight. Combined, these policies generate savings totaling $26.9 million to the Medical Assistance program, of which $13.4 million represents general revenue. All statutory provisions required to actualize these measures were submitted by the Governor and enacted within Article 19 of the FY 2014 Appropriations Act, Relating to Medical Assistance. In concert with a key provision of the Patient Protection and Affordable Care Act (ACA), the Governor’s FY 2014 Budget proposed the expansion of Medical Assistance coverage to non-pregnant, childless adults up to 138 percent of the Federal Poverty Level, commencing on January 1, 2014. In passing Section 2 of Article 19, the General Assembly adopted this proposal, and FY 2014 appropriations for Medical Assistance include $85.2 million in federal-only funding to meet the attendant cost of the ACA-based Medicaid expansion. Under ACA, full federal financing of Medicaid services for the expanded eligibility population elapses in January 2017, after which the federal matching rates decline incrementally until reaching 90 percent for 2020 and thereafter. As such, the state’s share in support of medical services for the newly eligible population will not be required until FY 2017. Both caseload expenditures adopted by the May 2013 CEC and the FY 2013 final and FY 2014 enacted budgets include the Governor’s recommendation to increase both fee-for-service and managed care Medicaid payment rates for primary care physicians (offering certain specified services) to align with those of the federal Medicare program, commencing January 2013. Mandated by ACA, this provision is entirely federally financed in CY 2013 and CY 2014. After December 31, 2014, states retain the option to continue primary care reimbursement at these enhanced rates, although federal financial participation (with respect to the rate differential) will decrease from 100 percent to the prevailing Federal Medical Assistance Percentage (FMAP), or approximately 50 percent. The FY 2014 enacted budget for Medical Assistance also contains several significant measures that were initiated by the 2013 General Assembly, most of which involve program changes and/or restructuring arising from the ACA-based Medicaid expansion and the establishment of the Rhode Island Health Benefits Exchange in 2014. First, the General Assembly has set forth the “ACA First” principle, whereby certain individuals who are currently enrolled in the Medical Assistance program through the “Medically Needy” (flexible income test or “spend-down”) eligibility option will be shifted from traditional Medical Assistance to either the Health Benefits Exchange or the expanded Medicaid program, commencing in January 2014. To ease this transition, the enacted budget contains general revenue of $2.0 million for an “ACA Transition Program”, designed to ensure that this population (or a portion thereof) is successfully relocated to the Exchange with no interruption of medical services. Net of planned expenditures for the ACA Transition Program (also referred to as the ACA Transition Fund), savings for “ACA First” total $2.0 million, consisting of $1.0 million in general revenue.
23

Overview
Effective January 1, 2014, Section 4 of Article 19 reduces the Rite Care income eligibility threshold for parents from 175 percent of the Federal Poverty Level (FPL) to 133 percent of the FPL, thereby transitioning all current Rite Care parents above 133 percent of FPL out of the Medical Assistance program and into commercial coverage obtained via the Health Benefits Exchange. To aid these individuals in meeting the cost of coverage, the General Assembly created a new program of premium assistance (Article 19, Section 2) for Exchange-enrolled adults with dependent children at or below 175 percent of FPL. Specifically, after deductions of the former Rite Care co-share amount as well as the value of any federal tax credits received, this program will subsidize 50 percent of the commercial plan’s cost. The anticipated cost of premium assistance for the third and fourth quarters of FY 2014 totals $1.4 million in general revenue. Net of these expenditures, the General Assembly enacted savings of $8.4 million, consisting of $4.2 million in general revenue, for the reduction in parental Rite Care eligibility. Designed to further ease the financial burden on former Rite Care parents transitioning to commercial insurance, Article 19, Section 4, also eliminates monthly co-sharing requirements under the Rite Care program, effective January 1, 2014. Under current statute and regulation, families with at least one Rite Care enrollee and monthly income ranging between 150 percent and 250 percent of the FPL are charged a graduated monthly premium of either $61, $77, or $92. To compensate for the foregone program revenue during the second half of FY 2014, the General Assembly provided additional appropriations of $2.8 million, consisting of $1.2 million in general revenue. The FY 2014 enacted budget for the Department of Children, Youth & Families totals $213.9 million, including $153.0 million in general revenue, $56.7 million in federal funds, $2.6 million in restricted receipts, and $1.6 million in other funds. This budget is $236,982 less than the final FY 2013 revised budget of $214.1 million. This includes a net general revenue increase of 0.7 percent, or $1.1 million, from the final FY 2013 revised budget of $151.8 million. The final FY 2013 budget also includes a decrease of $313,492 in federal funds and $1.1 million in other funds. The FY 2014 enacted budget includes an additional $2.6 million as compared to the Governor’s FY 2014 recommendation and the final FY 2013 revised budget was $1.0 more the Governor’s FY 2013 revised recommendation. For FY 2014, the budget for the Central Management program totals $7.1 million, including $4.9 million in general revenue, $2.2 million in federal funds, and $34,991 in restricted receipts. This reflects a net increase of 1.7 percent, or $125,224, which is attributed to changes in purchased services and personnel expenditures, as compared to the final FY 2013 revised budget of $7.2 million. There are no changes to the Governor’s recommendation in the Central Management program. The FY 2014 budget for the Children’s Behavioral Health program totals $10.6 million, including $4.5 million is general revenue, $5.6 million federal funds, and $555,000 from the Rhode Island Capital Plan Fund. This reflects a net decrease of $1.9 million, including decreases of $375,823 in general revenue, $417,210 in federal funds, and $1.1 million in other funds from the final FY 2013 revised budget of $12.5 million. The majority of the reductions in this program are in grants and benefits, which is due to funds being shifted to the Child Welfare program, and the Rhode Island Capital Plan Fund for repairs at the Rhode Island Training School and NAFI Center. There were no changes to the Governor’s recommendation for FY 2014. The revised budget for FY 2013 reduced the Governor’s recommendation for FY 2013 by approximately $300,000 and reflects anticipated expenditures for various capital projects. The Juvenile Corrections program is authorized $27.7 million from all sources in FY 2014, including $26.9 million from general revenue, $334,915 from federal funds, and $535,000 from the Rhode Island Capital Plan Fund for improvements to the Rhode Island Training School for Youth. This authorization represents a decrease of $426,874, including an increase of $67,491 from general revenue, from the final
24

Overview
FY 2013 revised budget of $28.2 million. There is a reduction of $171,900 from other funds and $322,465 in federal funds. The majority of the reductions in this program are related to capital projects. For FY 2014, the enacted budget for Juvenile Corrections did not include any changes to the Governor’s recommendation. The final revised budget for FY 2013 as compared to the Governor’s recommendation included additional turnover savings of $95,947. The FY 2014 enacted budget for the Child Welfare program totals $168.2 million, including $116.5 million in general revenue, $48.6 in federal funds, $2.6 million in restricted receipts, and $500,000 in other funds. This reflects a net increase of $2.2 million from all funds, or 1.3 percent, from the final FY 2013 revised budget of $166.0 million. General revenue increased by $1.5 million. The majority of the increase in this program is related to personnel expenditures. Compared to the Governor’s FY 2014 budget recommendation, the enacted budget contains a general revenue increase of $50,000 for a Community Service Grant for Youth Pride Incorporated. Turnover savings is increased by $500,000. There is also an additional $500,000 from general revenue to support the two lead networks in the System of Care. A major component of the Child Welfare program encompasses the full implementation of System of Care Transformation. Phase I of the System of Care began in 2009 and established the Family Care Community Partnerships for youth that are at risk for Department involvement due to abuse and neglect or serious emotional disturbance (SED) and youth who are returning to the community following a Rhode Island Training School sentence. Phase II instituted a network of community-based wraparound services that serve as a system of support for those families who are in need of, or at risk for, out of home placement with a goal of facilitating permanency plans, decreasing the need for hospitalizations and residential placements, and increasing access to home and community-based services and supports. Full implementation of the System of Care took place on July 1, 2012. The final budgets included an additional $2.4 million, $500,000 general revenue and $1.9 million federal funds, in FY 2013 revised and $3.0 million, $500,000 general revenue and $2.5 million federal funds, in the FY 2014 enacted budget, as compared to the Governor’s recommendation, to support the two lead networks in the System of Care. The additional federal funds in both years include an allocation from available social services block grant funding under the Department of Human Services. Total costs for the System of Care are $73.8 million in FY 2013 and $74.2 million in FY 2014. The Department of Children, Youth & Families’ authorized FTE level for the FY 2013 budget is 671.5 FTE positions and for the FY 2014 budget is 670.5 FTE positions. The FY 2014 enacted budget for the Department of Health totals $121.0 million, including $24.3 million from general revenue, $62.0 million from federal funds, $34.6 million from restricted receipts, and $35,310 from other funds. Across all fund sources, appropriations decreased by 4.5 percent or $5.8 million from the FY 2013 revised budget of $126.7 million. General revenue funding decreased by $138,721 from the FY 2013 revised budget of $24.4 million. Federal funding decreased by 12.2 percent or $8.7 million from the FY 2013 revised budget of $70.7 million. Restricted receipt funding decreased by 9.9 percent or $3.1 million from the FY 2013 revised budget of $31.5 million. Other funds funding decreased by 72.0 percent or $91,001 from the FY 2013 revised budget of $126,311. Compared to the FY 2014 Governor’s recommendation of $121.1 million, the FY 2014 enacted budget for the Department of Health decreased by $92,290. Within separate funding categories, general revenue funding decreased by 2.4 percent or $592,290 from the recommended total of $24.9 million; federal
25

Overview
funding did not change; restricted receipt funding was increased by 1.5 percent or $500,000 from the recommended total of $34.1 million; and other funds funding did not change. The source of the change between the Governor’s recommended budget and the enacted budget for FY 2014 is in two areas. First, the General Assembly added $157,710 to further support the financial demands of the State’s Blood Lead Poisoning Prevention initiative. The Governor recommended financing of $442,290 in support of this program. The additional funding will bring this initiative up to $600,000, which will allow the department to maintain the scope of this initiative rather than scaling back activities. Secondly, the General Assembly decreased general revenue funding by $750,000, partially offset with a $500,000 increase in restricted receipt funding. Within the general revenue decrease, $250,000 is comprised of additional turnover savings in the Environmental and Health Services Regulation and Health Laboratories programs. The remaining $500,000 of savings is due to a shift of general revenue expenditures to the Indirect Cost Recovery restricted receipt account. This account typically has a carryover balance from year to year, and the enacted budget recognizes the availability of these residual balances. The enacted budget for FY 2014 includes $13.4 million for the Central Management program, which coincides with the Governor’s recommendation. Though there is a zero dollar change to all funds, general revenue decreased by 47.8 percent or $500,000 from the Governor’s recommendation of $1.0 million to $544,959. This change is offset in the restricted receipt category of spending with a 13.4 percent or $500,000 increase from the Governor’s recommendation of $3.7 million to $4.2 million. Federal funds did not change from the Governor’s recommended total of $8.6 million. The budget for the State Medical Examiner program in FY 2014 includes $2.5 million, which coincides with the Governor’s recommendation. General revenue financing remains at $2.4 million. Federal funding also remains unchanged at $163,940. The budget for the Environmental and Health Services Regulation program in FY 2014 includes $19.5 million, a $125,000 decrease from the Governor’s recommended budget of $19.7 million. General revenue expenditures decreased 1.3 percent, or $125,000 from the Governor’s recommended total of $9.6 million to $9.5 million to accommodate the aforementioned turnover savings. Federal funding and restricted receipt funding remained unchanged at $5.9 million and $4.2 million, respectively. The budget for the Health Laboratories program in FY 2014 includes $7.7 million, a 1.6 percent or $125,000 decrease from the Governor’s recommended budget of $7.8 million. General revenue decreased 2.0 percent, or $125,000 from the Governor’s recommended total of $6.3 million to $6.2 million, due to the aforementioned turnover savings. Enacted federal funding is unchanged from the Governor’s budget at $1.5 million. The budget for the Public Health Information program in FY 2014 includes $2.5 million across all funds, a number reflected in both the Governor’s recommended budget and the enacted budget. General revenue is unchanged at $1.5 million and federal funding is unchanged at $945,533. The FY 2014 budget for the Community and Family Health and Equity program in FY 2014 totals $70.5 million, an increase of $157,710 from the Governor’s recommended budget of $70.3 million. General revenue funding is $2.4 million, which reflects the entirety of the change within this program with the addition of $157,710 to the Governor’s recommended budget. Federal funding of $41.8 million is unchanged from the Governor’s recommendation. Restricted receipt and other funding remain unchanged at $26.2 million and $35,310 respectively.
26
Overview
The Governor’s recommended budget for the Infectious Disease and Epidemiology program in FY 2014 remains unchanged at $4.8 million in the enacted budget. General revenue funding remains at $1.7 million. Federal funding remains at $3.1 million. FY 2014 staffing authorizations for the Department total 494.1 FTE positions, a decrease of 3.9 from the FY 2013 enacted level of 498.0, consistent with the Governor’s Budget. The FY 2014 enacted budget for the Department of Human Services (DHS) totals $662.1 million, including $93.5 million in general revenue, $554.4 million in federal funds, $9.8 million in restricted receipts, and $4.5 million in other funds. General revenue funding reflects a net decrease of 2.3 percent, or $2.2 million from the final FY 2013 revised budget of $95.7 million, and corresponds to a 6.1 percent, or $6.0 million reduction to the Governor’s original FY 2014 recommendation. Federal funding reflects a net increase of 0.8 percent, or $4.4 million from the final FY 2013 revised budget of $550.0 million, and corresponds to a 1.5 percent, or $8.4 million reduction to the Governor’s original FY 2014 recommendation. Restricted receipt funding reflects a net decrease of 19.0 percent, or $2.3 million from the final FY 2013 revised budget of $12.1 million, and constitutes a $163,724 increase to the Governor’s original FY 2014 recommendation. Other funding reflects a net decrease of 1.8 percent, or $83,661 from the final FY 2013 revised budget of $4.6 million, but no deviation from the Governor’s FY 2014 recommendation. The FY 2014 enacted general revenue budget for the Central Management program totals $5.5 million, an increase of $548,311 relative to the Governor’s recommendation. This revision is attributable to the following: (1) an apportionment of the General Assembly’s removal of 15.5 vacant FTE positions throughout the Department (excluding positions related to the Unified Health Infrastructure Project (UHIP) and the Work Support Strategies Grant) totaling $18,078; and (2) additional community services grants of $566,389, consisting of two new grants for community agencies in the amounts of $300,000 and $150,000, a $120,000 upward correction for pre-existing grants to various community action programs (“CAPs”), and a downward revision of $3,611 for the removal a single grant due to closure of the intended grantee’s facility. All community service grants budgeted in Human Services, other than those administered by the Division of Elderly Affairs, are housed within the Central Management program. The FY 2013 final enacted general revenue budget for Central Management totals $5.2 million, a reduction of $7.00 relative to the Governor’s recommendation, reflecting the sum of: (1) $116,396 in personnel savings due to turnover savings identified in the third quarter report coupled with this program’s share of a department-wide 11.5 FTE position reduction; and (2) $116,389 for additional community service grants. The FY 2014 enacted general revenue budget for the Office of Child Support Services (OCSS) totals $2.4 million, fully consistent with the Governor’s recommendation. The FY 2013 final enacted general revenue budget for OCSS totals $2.4 million, an increase of $74,368 relative to the Governor’s recommendation to remedy anticipated deficits in various areas of the Office’s operations, as detailed in the Department’s third quarter report. The FY 2014 enacted general revenue budget for the Individual and Family Support (IFS) program totals $20.9 million, a decrease of $461,627 relative to the Governor’s recommendation of $21.4 million. The legislative revision to the Governor’s Budget consists of: (1) an apportionment of the General Assembly’s removal of 15.5 vacant FTE positions throughout the Department (excluding positions related to the Unified Health Infrastructure Project (UHIP) and the Work Support Strategies Grant) totaling $390,812; (2) managed turnover savings of $225,000; and (3) an upward revision of $154,185, reflecting the acceptance of a Governor’s budget amendment restoring general revenue matching funds for certain
27
Overview
“Costs Not Otherwise Matchable” (CNOM) programs that were erroneously reduced in the Governor’s original budget proposal. The FY 2013 final enacted general revenue budget for Individual and Family Support totals $20.2 million, a reduction of $855,757 relative to the Governor’s recommendation of $21.1 million. The legislative revisions in FY 2013 consist of $602,297 in personnel savings stemming from turnover savings identified in the third quarter report coupled with this program’s share of a department-wide 11.5 FTE position reduction, the removal of $336,460 in unexpended general revenue for the Work Support Strategies project, and the addition of $83,000 to accommodate a deficit within the monthly stipend program for SSI-eligible individuals who reside in non-Medicaid assisted living facilities. With the passage of Article 18 of the FY 2014 Appropriations Act, Relating to Human Services- Temporary Assistance for Needy Families and Child Care, the General Assembly enacted a signature policy goal of the Governor’s FY 2014 budget proposal: the creation of new, innovative approaches to job preparation for TANF (RI Works) recipients and the enhancement of coverage under Rhode Island’s program of subsidized child care. Designed in part to increase Rhode Island’s TANF work participation rates, this pilot initiative is financed through new allocations of federal TANF State Family Assistance Grant (block grant) funds, and will effectively incorporate employment support strategies and transitional child care to facilitate the movement of families out of the Rhode Island Works Program and into permanent, gainful employment. In accordance with these policy objectives, Article 18 specifically authorizes the Department to create an innovative job development proposal and to competitively select a qualified vendor to implement and test the new approaches set forth therein. Article 18 also establishes the Child Care Subsidy Transition Program, temporarily increasing the continuing eligibility threshold for the low-income segment of the Child Care Assistance Program (CCAP) from 180 percent of the Federal Poverty Level (FPL) to 225 percent of the FPL. From October 1, 2013 through September 30, 2014, families currently receiving subsidized child care through CCAP (under original income guidelines) will remain eligible for CCAP services until their family income exceeds 225 percent of the FPL. However, these families will still be liable for co-payments as stipulated in departmental rules and regulations. As recommended by the Governor, federal financing of $3.0 million was enacted in support of this pilot initiative, $1.5 million of which is contained within the IFS budget to support expenses related to the job development contract. The FY 2014 enacted general revenue budget for the Division of Veterans’ Affairs totals $21.0 million, $175,000 below the Governor’s recommendation of $21.2 million. This revision is comprised solely of a reduction of $175,000 for managed turnover savings at the Veterans’ Home. The FY 2013 final enacted general revenue budget for the Division of Veterans’ Affairs totals $19.6 million, equivalent to the Governor’s recommendation. The Division’s FY 2013 final and FY 2014 enacted budgets include the Governor’s proposal for grounds improvements, maintenance, and capital projects at both the Rhode Island Veterans’ Memorial Cemetery and the Rhode Island Veterans’ Home. Also proposed by the Governor and maintained by the General Assembly were heightened allocations of general revenue for overtime expenditures at the Veterans’ Home. The FY 2014 enacted general revenue budget for the Health Care Eligibility (HCE) program totals $8.1 million, $184,794 below the Governor’s recommendation. The legislative revision is comprised solely of this program’s apportionment of the General Assembly’s removal of 15.5 vacant FTE positions throughout the Department (excluding positions related to the Unified Health Infrastructure Project (UHIP) and the Work Support Strategies Grant). The FY 2013 final enacted general revenue budget for HCE totals $7.4 million, a reduction of $192,055 relative to the Governor’s recommendation, reflecting turnover savings identified in the third quarter report coupled with this program’s share of a department-wide 11.5 FTE position reduction.
28
Overview
The FY 2014 enacted general revenue budget for the Division of Elderly Affairs (DEA) totals $5.7 million, $5.0 million below the Governor’s original recommendation of $10.7 million. The legislative revision reflects the sum of four distinct changes: (1) the acceptance of a Governor’s amendment requesting the transfer of the DEA Home and Community Care Medicaid Waiver program to the Medical Assistance program of the Executive Office of Health and Human Services (EOHHS), thus shifting $5,493,073 in general revenue from DEA to EOHHS; (2) an upward revision of $920,856, reflecting the acceptance of a Governor’s budget amendment restoring general revenue matching funds for certain “Costs Not Otherwise Matchable” (CNOM) programs that were erroneously reduced in the Governor’s original budget proposal; (3) a substitution of $397,491 in restricted receipts for general revenue due to (potential) future recoveries of indirect costs incurred in the administration of the Division’s federal grants; and (4) a downward adjustment to community service grants totaling $10,527. The FY 2013 final enacted general revenue budget for the Division totals $10.9 million, an increase of $422,543 relative to the Governor’s recommendation. This is comprised of a $24,236 reduction for discontinued community service grants (due to grantee agency closure) and the addition of $446,779 to accommodate third quarter deficits evidenced within both the Home and Community Care Medicaid Waiver program and the home care component of the DEA Co-Pay (CNOM) Program. Enacted staffing authorizations are 959.1 FTE positions in FY 2014, reflecting the General Assembly’s removal of 15.5 vacant FTE positions contained within the Governor’s recommendation of 974.6 FTE positions. The FY 2014 enacted budget for programs of cash assistance administered by the Department of Human Services are as follows: Rhode Island Works (formerly the Family Independence Program) and the Child Care Assistance Program: Total financing of $90.0 million, consisting of $9.7 million in general revenue, reflecting caseloads as adopted by the May 2013 Consensus Caseload Estimating Conference (CEC) and a new $1.5 million allocation of the TANF block grant for the inception of the Child Care Subsidy Transition Program. As in recent fiscal years, all general revenue is appropriated in support of the Child Care Assistance Program (primarily in satisfaction of federal maintenance of effort (MOE) requirements for state-subsidized child care), whereas Rhode Island Works is fully financed through the federal TANF block grant. Budgeted expenditures for these programs in FY 2014 are $2.1 million above the FY 2013 final enacted level of $87.9 million, with the entirety of the increase accommodated by available federal resources. Supplemental Security Income Program (SSI): Total financing of $18.2 million in general revenue, reflecting caseloads as adopted by the May 2013 Consensus Caseload Estimating Conference and the Governor’s recommendation as amended. Budgeted expenditures for this program in FY 2014 are $32,834 above the FY 2013 final enacted level. The FY 2014 enacted budget maintains the provision of Article 23 of Chapter 151 of the Public Laws of 2011, which reduced the State Supplemental Payment (SSP) from $538 per month to the federally-mandated floor of $332 per month for SSI recipients residing in assisted living facilities. Note, however, that for FY 2014 the General Assembly again appropriated $250,000 in support of a $206 per month (non-SSP) stipend to the subset of these individuals who reside in non-Medicaid assisted living facilities. Financing for these payments is included within the Department’s Individual and Family Support (IFS) program, and is therefore not subject to estimation at the CEC. General Public Assistance (GPA): Bridge Program: $693,000 in general revenue, consistent with adopted caseload levels and the Governor’s recommendation as amended. Burials: $700,000 in general
29

Overview
revenue, consistent with adopted caseload levels and the Governor’s recommendation as amended. GPA Medical (GMED), designated as a “Cost Not Otherwise Matchable” (CNOM): $612,500, comprised of $303,800 in general revenue, and consistent with adopted caseload levels coupled with the Governor’s recommendation to transfer qualifying GMED beneficiaries to the expanded Medicaid program of EOHHS, commencing on January 1, 2014. GPA Hardship Contingency Fund: $210,000 in general revenue, consistent with Article 1 of the FY 2014 Appropriations Act. Supplemental Nutrition Assistance Program (SNAP) and the Special Supplemental Nutrition Program for Women, Infants, and Children (WIC): Federal funding for benefits provided under the Supplemental Nutrition Assistance Program (SNAP), which are not determined at the CEC, totals $298.2 million in both the FY 2013 final enacted and FY 2014 budgets. Financing for benefits provided under the Special Supplemental Nutrition Program for Women, Infants, and Children (WIC), also not determined at the CEC, totals $19.4 million in both the FY 2013 final enacted and FY 2014 budgets. These allocations are consistent with the Governor’s original recommendations. The FY 2014 enacted budget for the Department of Behavioral Healthcare, Developmental Disabilities, and Hospitals totals $437.8 million, including $202.1 million in general revenue, $217.8 million in federal funds, $7.4 million in restricted receipts, and $10.6 million in other funds. The Department’s total FY 2014 budget of $437.8 million is $6.7 million less than the Governor’s FY 2014 recommendation and $8.8 million more than the FY 2013 final revised budget of $429.0 million. Compared to the FY 2013 final revised budget, general revenue increased by $8.9 million, other funds by $5.8 million, and restricted receipts by $219,506. There is $6.1 million less in federal funds. FY 2014 general revenue funding of $202.1 million reflects a net increase of 4.6 percent from the FY 2013 revised budget of $193.2 million and $4.6 million less than the Governor’s FY 2014 recommendation of $206.6 million. General revenue reductions from the Governor’s recommendation include $3.0 million to support savings associated with the Affordable Care Act and $1.9 million for a statewide benefit adjustment for 24 hour facilities that was requested as a Governor’s Amendment to adjust for personnel savings related to retiree health and dental benefits costs, a reduction in municipal substance abuse task forces and hospital licensing fees, and an increase in indirect cost recovery. The General Assembly included an additional $1.0 million in turnover savings compared to the Governor’s recommendation. There is also an addition of $1.0 million in the developmentally disabled program for private providers. The largest increase in general revenue in the FY 2014 budget from the FY 2013 revised budget is $10.9 million and falls within the grants and benefits category. This increase is slightly offset by a reduction of $2.0 million for personnel expenditures. The final revised general revenue budget for FY 2013 concurs with the Governor’s FY 2013 supplemental recommendation. The decrease of $6.1 million in federal funds in FY 2014 reflects a reduction of 2.7 percent from the FY 2013 revised budget of $223.8 million and $2.4 million from the Governor’s FY 2014 recommendation. Federal reductions from the Governor’s recommendation include $2.0 million to support savings associated with the Affordable Care Act and $1.3 million for a statewide benefit adjustment for 24 hour facilities, hospital licensing fees, and an increase in indirect cost recovery. There is also an addition of $1.0 million in the private provider developmentally disabled program. The federal funds budget for FY 2013 reflects an increase of $346,350 from the Governor’s FY 2013 supplemental recommendation. This increase includes an additional $950,000 requested in a Governor’s budget amendment to adjust for overtime expenditures at the hospital, which is offset by a $603,650 reduction in the federal Medicaid match for fire code upgrades in the developmentally disabled program to reflect actual spending. Other funds increased by $5.8 million from FY 2013 to FY 2014 entirely from the Rhode Island Capital Plan Fund. Significant increases in funding provide $2.7 million for the hospital consolidation project and $2.9 million for Eleanor Slater HVAC. The Governor’s recommendation is reduced by $2.9 million
30

Overview
in the Rhode Island Capital Plan Fund in the FY 2013 final revised budget based on updated year end project expenditure estimates. On an all funds basis, grants and assistance payments to providers totaling $290.0 million comprise the largest portion of the Department’s budget in FY 2014, followed by $122.8 million for salary and benefits expenses, $12.7 million for operating expenses, $11.1 million for capital purchases and equipment, and $1.3 million for contract professional services. Major net changes from the FY 2013 revised budget consist of an increase in grants and assistance payments of $7.1 million and $5.9 million for capital purchases and equipment, which is slightly offset by a reduction of $3.6 million for personnel expenditures. Key changes to the Governor’s FY 2014 recommended budget include reductions of $5.0 million for additional Affordable Care Act savings, $401,157 for the Eleanor Slater Hospital licensing fee, $1.2 million for indirect cost, $500,000 for municipal substance abuse task forces, and $1.0 million in additional turnover savings. The enacted budget included an additional $2.0 million for the private provider developmentally disabled program. Other funds decrease by $3.5 million in the FY 2013 revised budget from the Governor’s FY 2013 recommendation. For the Central Management program, the FY 2014 enacted budget is $1.2 million, including $816,045 in general revenue and $429,446 in federal funds. The enacted budget is 5.1 percent, or $59,890, more than the FY 2013 revised budget of $1.2 million. For the Hospital and Community Support System program, the FY 2014 enacted budget is $3.6 million, including $1.6 million in general revenue, $734,152 in restricted receipts, and $1.3 million from the Rhode Island Capital Plan Fund. The enacted budget is $33,909 more than the FY 2013 revised budget. The only major change from the Governor’s recommendation in FY 2014 is a net reduction of $475,870 for indirect cost recovery. For the Services for the Developmentally Disabled program, the FY 2014 enacted budget is $224.3 million, including $109.5 million in general revenue, $112.1 million in federal funds, $1.7 million in restricted receipts, and $1.1 million from the Rhode Island Capital Plan Fund. The FY 2014 enacted budget is 6.7 percent, or $1.5 million, more than the FY 2013 revised budget of $222.9 million and $3.2 million more than the Governor’s FY 2014 recommendation. This increase reflects additional funding for the private providers to provide services to the developmentally disabled population. The Department continues to implement Project Sustainability, which redesigned the developmentally disabled service system. The redesign included the development and implementation of a new rate and payment methodology applied to all service providers that would increase transparency and consistency across the system. The restructuring of the network of service providers is intended to maximize services and operational efficiencies and assure beneficiaries’ needs are met with the most appropriate services in the most appropriate setting. For the Behavioral Healthcare Services program, the FY 2014 enacted budget is $94.3 million, including $39.7 million in general revenue, $53.3 million in federal funds, $125,000 in restricted receipts, and $1.2 million from the Rhode Island Capital Plan Fund. The enacted budget is 0.8 percent, or $823,935, less than the FY 2013 revised budget of $95.1 million. In comparison to the Governor’s FY 2014 recommendation, the enacted budget contains a total of $6.2 million in adjustments to the Affordable Care Act initiative, which mandated an optional expansion of Medicaid coverage to a states’ population of non-disabled, childless adults up to 138 percent of the Federal Poverty Level (FPL) in January 2014. It is anticipated that there will be migration of current beneficiaries receiving services through current programs into the Medical Assistance program within the Executive Office of Health and Human Services. For the Hospital and Community Rehabilitative Services program, the FY 2014 enacted budget is $114.4 million. Of this amount, $50.5 million is general revenue, $51.9 million is federal funds, $4.9 million is
31

Overview
restricted receipts, and $7.1 million is from the Rhode Island Capital Plan Fund. The enacted budget is 7.6 percent, or $8.1 million, more than the FY 2013 revised budget of $106.3 million, the majority being in the Rhode Island Capital Plan Fund. Major changes to the Governor’s FY 2014 recommendation include reductions of $2.1 million from all funds to reflect additional turnover savings, a statewide benefit adjustment for the 24 hour facilities, and a reduction in the Eleanor Slater Hospital licensing fee. The final enacted FY 2013 budget contains a reduction of $1.7 million from the Governor’s FY 2013 recommendation in other funds. The Department’s FTE authorization in the enacted budget is 1,424.4 for FY 2013 and 1,423.4 for FY 2014. The FY 2014 enacted budget for the Governor’s Commission on Disabilities totals $1.5 million, including $357,711 in general revenue, $129,989 in federal funds, $10,365 in restricted receipts, and $957,271 in other funds. Across all sources, appropriations increased by 143 percent or $856,333 from the FY 2013 revised budget of $599,003. General revenue appropriations increase by 10.3 percent or $33,290 from the FY 2013 revised budget of $324,421. Federal funds decrease by 39.6 percent or $85,379 from the FY 2013 revised budget of $215,368. Restricted receipts increase by 12.5 percent or $1,151 from the FY 2013 revised budget of $9,214. Other funds increase by $907,271 from the FY 2013 revised budget of $50,000. Compared to the FY 2014 Governor’s recommendation, the FY 2014 enacted budget for the Governor’s Commission on Disabilities is unchanged across all funds. The large increase in funding for the FY 2014 enacted budget, as compared to the FY 2013 revised budget, is due to an increase in resources from the Rhode Island Capital Plan fund for the Commission. Funding is included in the enacted budget for Accessibility to Disability Service Providers, Accessibility Fire Safety Renovations, and Accessibility to Higher Education Facilities. Staffing authorizations for the Commission remain unchanged from FY 2013 at 4.0 FTE positions, consistent with the Governor’s proposal for FY 2014. The FY 2014 enacted budget for the Commission on the Deaf & Hard of Hearing totals $471,609, including $391,609 in general revenue and $80,000 in restricted receipts. On an all funds basis, funding increased by 23.6 percent or $89,908 from the FY 2013 revised budget of $381,701. General revenue funding increased 2.6 percent or $9,908 from the FY 2013 revised budget of $381,701. Restricted receipt funding was not appropriated in FY 2013 but will total $80,000 for FY 2014. Compared to the FY 2014 Governor’s recommendation, the FY 2014 enacted budget for the Commission on the Deaf & Hard of Hearing is unchanged across all funds. The FY 2014 budget includes passage of Article 17, Relating to Emergency and Public Communication Access Fund. This article, which was included in the Governor’s recommended budget, creates the Emergency and Public Communication Access program, which requires an annual remittance of $80,000 from the surcharge collected by the Public Utilities Commission on telecommunications service providers. This article also establishes a new restricted receipt account for the Commission on the Deaf & Hard of Hearing in FY 2014. The purpose of this fund is to enhance emergency and public communication for the deaf and hard of hearing population by including training for first responders and emergency personnel, providing for further outreach to the public, and for the purchase of equipment to increase communication access. Staffing authorizations for the Commission remain unchanged from FY 2013 at 3.0 FTE positions, consistent with the Governor’s proposal for FY 2014.
32

Overview
The FY 2014 enacted budget for the Office of the Child Advocate totals $648,648, including $608,651 in general revenue and $39,997 in federal funds. Across all funds, appropriations increased by 1.9 percent or $11,916 from the FY 2013 revised budget of $636,732. General revenue increases by 3.0 percent or $17,987 from the FY 2013 revised budget of $590,664. Federal funds, consisting of the Child Victims Services grant, decreased by 13.2 percent or $6,071 from the FY 2013 revised budget of $46,068. Compared to the FY 2014 Governor’s budget proposal, the FY 2014 enacted budget for the Office of the Child Advocate decreased by 1.0 percent or $6,500. General revenue decreases by 1.1 percent or $6,500 compared to the Governor’s recommended budget of $615,151 for FY 2014, while federal funds remain unchanged. The modest change in the Office of the Child Advocate’s budget is due to a change in classification for one of the Office’s positions. The Office was given the authorization to change a vacant 0.8 FTE Staff Attorney III position to a 1.0 FTE Legal Counsel position. This change in classification yielded personnel savings despite the increase in full-time equivalency. Staffing authorizations for the Office increase from 5.8 FTE positions in FY 2013 to 6.0 FTE positions in FY 2014. The FY 2014 enacted budget for the Office of the Mental Health Advocate totals $486,144 within its sole funding source of general revenue. General revenue appropriations increased 50.4 percent or $162,837 from the final FY 2013 budget of $323,307. The change in funding is due to substantial turnover savings taken in the FY 2013 revised budget due to a vacancy in the Mental Health Advocate position for part of the fiscal year. Compared to the FY 2014 Governor’s recommendation, the FY 2014 enacted budget for the Office of the Mental Health Advocate is unchanged and totals $486,144. Staffing authorizations for the Office remain unchanged from FY 2013 at 3.7 FTE positions, consistent with the Governor’s proposal for FY 2014.
The FY 2014 enacted budget for the Department of Elementary and Secondary Education totals $1.226 billion, including $964.7 million in general revenue, $225.7 million in federal funds, $27.7 million in restricted receipts, and $7.9 million in other funds. The Department’s FY 2014 enacted budget overall is mostly consistent with the Governor’s recommendation, with
the exception of $66,939 more in general revenue offset by a decrease of $54,212 in other funds. There was no change in federal funds and restricted receipts as compared to the Governor’s recommendation. General revenue funding reflects a net increase of $35.8 million or 3.9 percent from the final FY 2013 revised budget of $928.9 million. Federal funds reflect a net decrease of $12.4 million or 5.2 percent from the final FY 2013 revised budget of $238.1 million. Restricted receipts reflect a net increase of $1.0 million or 3.9 percent from the final FY 2013 revised budget of $26.6 million. Other funds reflect a net decrease of $3.9 million or 33.4 percent from the final FY 2013 revised budget of $11.8 million. The FY 2014 enacted budget for the Administration of the Comprehensive Education Strategy (ACES) program totals $252.0 million, including $19.8 million in general revenue, $223.8 million in federal funds, $5.2 million in restricted receipts, and $3.1 million in other funds. The program’s FY 2014 enacted budget is $133,788 more than the Governor’s recommendation, comprised of $388,000 more in general revenue, offset by a $254,212 decrease in other funds. Federal funds and restricted receipts are equal to the Governor’s recommendation. The increase in general revenue from the Governor’s recommendation is a result of an increase of $588,000 for community service grants, which are offset by a decrease of $100,000 each in turnover savings and the Channel 36 Transition Grant. General revenue funding reflects a net increase of $1.1 million, or 5.7 percent, from the final FY 2013 revised budget of $18.8 million. Other funds reflect a net increase of $846,538 or 37.2 percent from the final FY 2013
Education
33
Overview
revised budget of $2.3 million attributed to adjustments to various projects financed from the Rhode Island Capital Plan Fund. The final revised FY 2013 budget for the ACES program totals $261.6 million, comprised of $18.8 million in general revenue, $235.9 million in federal funds, $4.7 million in restricted receipts, and $2.3 million in other funds. In comparison to the Governor’s supplemental recommendation, the final revised FY 2013 budget for ACES is $1.5 million less than the Governor’s recommendation, including $65,126 less in general revenue and $1.5 million less in other funds offset by $100,292 more in federal funds. The decrease in general revenue financing is attributed to turnover savings achieved through a delay in hiring a high-level position. Federal funds are adjusted to reflect available carry forward funds and actual grant rewards. In other funds, the $1.5 million is shifted from FY 2013 to later years to better reflect projected spending for two capital projects; total funding for each project remains as recommended by the Governor. As a winner in the Race to the Top competition, Rhode Island was awarded $75.0 million in federal funds that will be used over a four-year period, from 2010 through 2014. As described by the Department, Rhode Island will use Race to the Top funding to realize a single powerful vision: an educational system that prepares all Rhode Island students for success in college, careers and life. Over the term of this grant, Rhode Island will realize this vision through five important support systems: Standards and Curriculum, Instructional Improvement Systems, Educator Effectiveness, Human Capital Development, and School Transformation and Innovation. The final FY 2013 revised budget contains $29.7 million, while the FY 2014 enacted budget allocates $25.5 million from this grant. In December 2011, Rhode Island was awarded an additional $50.0 million through the latest round of the Race to the Top program. Under the title Race to the Top – Early Learning Challenge Grant, funding will be used to improve education for pre-school students. This program will involve multiple human service state agencies, such as the state’s Department of Health, Department of Human Services, and the Department of Children, Youth, and Families, with funding allocated over the four-year span of January 2012 to December 2015, similar to the previous Race to the Top program. Within the Department’s budget, $4.2 million has been allocated for year two of the program in the final FY 2013 revised budget and $4.1 million in year three, which encompasses FY 2014. The FY 2014 enacted budget for the William M. Davies Career and Technical School totals $17.8 million, including $12.8 million in general revenue, $1.5 million in federal funds, $2.6 million in restricted receipts, and $925,271 in other funds. Davies’ FY 2014 enacted budget is $275,140 more than the Governor’s recommendation, comprised of $75,140 and $200,000 more in general revenue and other funds, respectively. There was no change to the Governor’s recommendation for federal funds and restricted receipts. The increase in general revenue is for an adjustment to the education aid funding formula based on March 2013 updated student enrollment numbers along with free and reduced price lunch data and the restoration of statewide medical savings mistakenly removed from Davies’ aid distribution as calculated by the funding formula. The Governor proposed both changes within an amendment, which the General Assembly accepted. General revenue financing reflects a net decrease of $589,491 or 4.4 percent from the final FY 2013 revised budget of $13.4 million. Federal funds reflect a net decrease of $236,976 or 13.6 percent from the final FY 2013 revised budget of $1.7 million. Restricted receipts also reflect a net decrease of $83,452 or 3.4 percent from the final FY 2013 revised budget of $2.5 million. Other funds reflect a net decrease of $1.7 million or 64.7 percent from the final FY 2013 revised budget of $2.6 million. The final revised FY 2013 budget for Davies totals $20.2 million, including $13.4 million in general revenue, $1.7 million in federal funds, $2.5 million in restricted receipts, and $2.6 million in other funds. In comparison to the Governor’s supplemental recommendation, the final revised FY 2013 budget for
34
Overview
Davies is $53,246 more than the Governor’s recommendation, entirely comprised of restoring statewide medical savings taken from Davies in error. The FY 2014 enacted budget for the R.I. School for the Deaf totals $6.8 million, including $6.1 million in general revenue, $402,679 in federal funds and $300,000 in restricted receipts. The School for the Deaf’s FY 2014 enacted budget is $67,500 less than the Governor’s recommendation all comprised of general revenue. The General Assembly instructs the School to use an equal amount in rental income to offset the general revenue decrease. General revenue financing reflects a net increase of $92,756 or 1.5 percent from the final FY 2013 revised budget of $6.2 million. Federal funds reflect a net decrease of $106,212 or 20.9 percent from the final FY 2013 revised budget of $508,891. Restricted receipts reflect a net decrease of $50,000 or 14.3 percent from the final FY 2013 revised budget of $350,000. The final revised FY 2013 budget for the School for the Deaf totals $7.0 million, including $6.2 million in general revenue, $508,891 in federal funds, and $350,000 in restricted receipts. In comparison to the Governor’s supplemental recommendation, the final revised FY 2013 budget for the School for the Deaf is $39,786 more than the Governor’s recommendation, including $13,660 and $50,000 more in federal funds and restricted receipts, respectively, offset by a decrease of $23,874 in general revenue credited to additional turnover savings. The change in federal funds is attributed to an increase in Title I grants to make a one-time payment for a substitute teacher. In restricted receipts, the $50,000 increase is for expenses relating to the settlement of a legal case against the State for activity pertaining to prior years. These expenses were not previously budgeted, but must be paid for before the close of FY 2013. The FY 2014 enacted budget for the Metropolitan Career and Technical School (The MET) totals $14.6 million, including $11.1 million in general revenue and $3.5 million in other funds. The MET’s FY 2014 enacted budget is $3,195 less than the Governor’s recommendation, comprised of a decrease in general revenue financing done through an adjustment to the education aid funding formula based on March 2013 updated student enrollment numbers along with free and reduced price lunch data. The Governor proposed this change within an amendment, which the General Assembly accepted. There was no change to the Governor’s recommendation for other funds. General revenue financing reflects a net decrease of $563,207 or 4.8 percent from the final FY 2013 revised budget of $11.6 million. Other funds reflect a net decrease of $3.1 million or 46.8 percent from the final FY 2013 revised budget of $6.6 million. The final revised FY 2013 budget for the MET totals $18.3 million, including $11.6 million in general revenue and $6.6 million in other funds. The final revised FY 2013 budget for the MET is consistent with the Governor’s recommendation in all fund sources. The FY 2014 enacted budget for Education Aid totals $744.8 million, including $724.9 million in general revenue, $19.6 million in restricted receipts, and $300,000 in other funds. Education Aid’s FY 2014 enacted budget is $1.5 million more than the Governor’s recommendation, comprised entirely of general revenue. There were no changes to the Governor’s recommendation for other funds. The $1.5 million adjustment is mostly attributed to a $2.4 million increase for the education aid funding formula, a technical change based on updated data as requested by the Governor in a March 2013 amendment, and $250,000 for a Full-Day Kindergarten Pilot Program. These increased expenses are offset by a $1.0 million decrease in the Career and Technical Education and Early Childhood Demonstration categorical funds. General revenue financing reflects a net increase of $33.7 million or 4.9 percent from the final FY 2013 revised budget of $691.5 million. Restricted receipts reflect a net decrease of $497,736 or 2.6 percent from the final FY 2013 revised budget of $19.1 million. Other funds are equal to the final FY 2013 revised budget of $300,000. The Governor proposed, and the General Assembly enacted, full funding for year three of the education aid funding formula for LEAs in the FY 2014 enacted budget. The $2.4 million increase in general
35

Overview
revenue is a result of an adjustment to the education aid funding formula based on March 2013 updated student enrollment numbers along with free and reduced price lunch data. The General Assembly also accepted the Governor’s proposal to fund the five education aid categorical funds that were included in the funding formula legislation passed in 2010 and will be distributed to LEAs according to their own individual set of rules. These funds consist of a Regionalization Bonus, a Transportation categorical fund, a High Cost Special Education categorical fund, a Career and Technical Education categorical fund, and an Early Childhood Demonstration program initiative. However, the Career and Technical Education categorical fund and the Early Childhood Demonstration initiative were maintained at the FY 2013 financing level, while the other categorical funds were increased according to the ten-year transition plan for full funding. The General Assembly also approved $250,000 in general revenue for the Full-Day Kindergarten Pilot program. The Governor’s FY 2014 Budget and the Department’s request did not include any financing for this purpose since there were no applicants at the time of budget preparation. The provided financing will cover a portion of reasonable one-time, start-up costs. FY 2014 will be the first year this program is implemented. The final revised FY 2013 budget for Education Aid totals $710.9 million, comprised of $691.5 million in general revenue, $19.1 million in restricted receipts, and $300,000 in other funds. In comparison to the Governor’s supplemental recommendation, the final revised FY 2013 budget for Education Aid is $400,000 less than the Governor’s recommendation entirely comprised of the removal of general revenue aid for the Rhode Island Telecommunications Education Access Fund (RI-TEAF). The Department had requested general revenue to support this program in FY 2013, but due to the availability of carryover funds from the previous fiscal year this funding was not needed. The FY 2014 enacted budget for the Central Falls School District totals $38.4 million, all from general revenue. The District’s FY 2014 enacted budget is $211,281 more than the Governor’s original recommendation, comprised of an increase in general revenue financing through an adjustment to the education aid funding formula based on March 2013 updated student enrollment numbers along with free and reduced price lunch data. The Governor proposed this change within an amendment, which the General Assembly accepted. General revenue financing reflects a net decrease of $1.3 million or 3.3 percent from the final FY 2013 revised budget of $39.7 million. The final revised FY 2013 budget for Central Falls Aid totals $39.7 million, all from general revenue and unchanged from the Governor’s supplemental recommendation. The FY 2014 enacted budget for School Construction Aid totals $69.9 million, all from general revenue. There is a decrease of $1.2 million as compared to the program’s FY 2014 Governor’s recommendation, all attributed to various projects not completing according to schedule and savings achieved during construction. General revenue financing reflects a net increase of $2.1 million or 2.9 percent from the final FY 2013 revised budget of $72.1 million. The General Assembly passed an article stating that for any refunding of bonds that occur between July 1, 2013 and December 31, 2015, a community shall receive 80.0 percent of the total savings and the State shall receive 20.0 percent. Previous to this article, any net interest savings resulting from the refunding of bonds issued by local communities in support of school housing projects was allocated between the community and the State of Rhode Island based on the School Housing Aid ratio at the time of issuance of the bonds. FY 2015 will be the earliest this new law will have an effect on school housing aid because aid is paid in the fiscal year following the completion of the project. The final revised FY 2013 budget for School Construction Aid totals $72.1 million, all from general revenue. In comparison to the Governor’s supplemental recommendation, the final revised FY 2013
36

Overview
budget for the program is $24,246 less than the Governor’s original recommendation. The Governor submitted and the General Assembly accepted an amendment to the program to adjust for the final aid number for the School Construction program based on the interest earning and unspent bond proceeds. Housing aid is paid on the net amount and as a result savings were achieved in Providence and Glocester, but were offset by an adjustment necessary for the final schedule in Woonsocket. The FY 2014 enacted budget for Teacher Retirement totals $81.7 million, all from general revenue. The Teacher Retirement program’s FY 2014 enacted budget is $822,750 less than the Governor’s recommendation all attributed to wages increasing at a slower rate than anticipated. General revenue financing reflects a net increase of $5.6 million or 7.4 percent from the final FY 2013 revised budget of $76.9 million. The increase in general revenue financing is due to an increase in the state share from 7.88 percent to 8.42 percent in FY 2014. The final revised FY 2013 budget for Teacher Retirement totals $76.9 million, all from general revenue, a decrease of $836,703 from the Governor’s recommendation. This is also attributed to wages increasing at a slower rate than anticipated. The Department’s enacted budget includes 171.4 FTE positions for the Administration of the Comprehensive Education Strategy (ACES) and Education Aid programs, which is unchanged from the final FY 2013 revised budget authorization. This is an increase of 2.0 FTE positions, from 169.4 to 171.4, as compared to budgets prior to final FY 2013 revised budget in order to comply with legislation passed in the 2012 General Assembly session that mandated the Department, in consultation with the Division of Municipal Finance, conduct periodic reviews, analyze school revenues and expenses, review compliance with the approved budget model and best practices, and identify local education agencies considered to be at risk of a year-end deficit or a structural deficit that could impact future years. Under the ACES program, the final FY 2013 revised and FY 2014 enacted budget includes thirteen (13.0) limited-term FTE positions to be financed under the Race to the Top – Early Learning Challenge Grant. Additionally, the budget includes 126.0 FTE positions for the Davies Career and Technical School, which is unchanged from the final FY 2013 revised budget authorization. Lastly, the budget includes 60.0 FTE positions for the R.I. School for the Deaf, which is unchanged from the final FY 2013 revised budget authorization. The FY 2014 enacted budget for Public Higher Education is $1.1 billion, including $180.0 million in general revenue, $6.2 million in federal funds, $702,583 in restricted receipts, and $870.6 million in other funds. The enacted general revenue budget for Public Higher Education is $879,000 less than the Governor’s recommendation, and consists of a $1.0 million decrease in the Office of Higher Education and a $121,000 increase in Rhode Island College. The $1.0 million decrease in general revenue funding for the Office of Higher Education represents a 50 percent reduction from the FY 2013 revised budget. Compared to the FY 2013 revised budget, the enacted budget provides additional general revenue of $7.3 million to Public Higher Education. On an all funds basis, the enacted budget includes $21.5 million more than the FY 2013 revised budget. The majority of the additional general revenue funding provided to Higher Education in FY 2014 is in support of the Governor’s initiative to freeze tuition for the 2013-2014 academic year at the three institutions. A provision in the FY 2014 enacted appropriations act requires the University of Rhode Island, Rhode Island College, and the Community College of Rhode: (1) to maintain tuition charges in the 2013 – 2014 academic year at the same level as the 2012 – 2013 academic year; (2) to not decrease internal student financial aid during the same period; and (3) prior to the commencement of the 2013 – 2014 academic year, to report to the Chair of the Board of Education that tuition charges have been maintained and financial aid has not been decreased.
37

Overview
The FY 2014 enacted budget includes $30.0 million from the Rhode Island Capital Plan Fund for the three institutions of higher learning, of which $12.3 million is for asset protection; $10.1 million is for fire safety and protection; $5.0 million is for Rhode Island College infrastructure modernization; and $2.3 million is for advanced planning for a combined URI/RIC Nursing Education Center. For FY 2014, the Office of Higher Education is authorized 13.8 FTE positions, of which 1.0 FTE position is to be supported with third party funds; the University of Rhode Island is authorized a total of 2,456.5 FTE positions, 593.2 of which are to be supported with third party funds; Rhode Island College is authorized a total of 923.6 FTE positions, of which 82.0 are to be supported with third party funds; and the Community College of Rhode Island is authorized a total 854.1 FTE positions, of which 100.0 are to be supported with third party funds. The total authorized FTE level of 4,248.0 is 4.0 FTE positions less than the Governor’s FTE positions authorization recommendation, but 7.0 FTE positions more than the FY 2013 revised budget. Article 4 of the FY 2013 Appropriation Act (H-7323 Sub A, as amended) created a new Rhode Island Board of Education, effective January 1, 2013, with eleven public members appointed by the Governor. By July 1, 2013, the Board was required submit to the Governor and to the Legislature a final plan for a “permanent administrative structure for higher education.” The Board of Education now expects to complete this plan by September 1, 2013. The plan may distribute functions of the Office of Higher Education to the three institutions and appropriate state agencies. Article 4 also abolishes the Office of Higher Education effective July 1, 2014. The FY 2013 revised budget for Public Higher Education is $1.0 billion, including $172.7 million in general revenue, $5.2 million in federal funds, $702,583 in restricted receipts, and $857.4 million in other funds. The revised budget is $962,379 less than the Governor’s recommendation and consists of a $1.1 million decrease in funding from the Rhode Island Capital Plan Fund for fire safety and protection projects and a $137,621 increase for Rhode Island College private research grants. The FY 2014 enacted budget for the Rhode Island State Council on the Arts totals $2.8 million, including $1.3 million in general revenue, $797,329 in federal funds, and $632,536 in other funds. There is no change between the Council’s FY 2014 enacted budget and the Governor’s recommendation. In relation to the final FY 2013 enacted budget, general revenue funding decreases by $230,183 or 14.7 percent from the final revised budget authorization of $1.6 million. Federal funds reflect a net increase of $43,138 or 5.7 percent from the final FY 2013 revised budget of $754,191. Other funds reflect a net decrease of $954,956 or 60.2 percent from the final FY 2013 revised budget of $1.6 million. In addition, the Council’s community service grant allocation was unchanged for FY 2013 and FY 2014 as compared to the Governor’s recommendation for each fiscal year. The FY 2014 enacted budget is $250,000 less than the FY 2013 revised budget for this purpose due to the removal of a one-time grant to Waterfire Providence. The final revised FY 2013 budget totals $3.9 million, comprised of $1.6 million in general revenue, $754,191 in federal funds, and $1.6 million in other funds. In comparison to the Governor’s supplemental recommendation, the final revised FY 2013 budget is consistent with the Governor’s recommendation. The Council’s enacted budget includes 6.0 FTE positions, which is consistent with the Governor’s recommendation and the FY 2013 revised budget authorization. In FY 2013, as compared to FY 2012, the Council did experience a decrease of 2.6 FTE positions attributed to the shift of the Rhode Island Film and Television Office from the Council to the Department of Administration.
38

Overview
The FY 2014 enacted budget for the Rhode Island Atomic Energy Commission totals $1.4 million from all funds, including $861,710 in general revenue, $267,044 in federal funds, and $307,977 in other funds. This is an increase of $34,295, or 2.4 percent, more than the FY 2013 revised budget due to personnel adjustments in both general revenue and in the URI radiation safety program’s other fund allocations as in the Governor’s recommendation. The final FY 2013 revised budget totals $1.4 million, including $841,750 in general revenue, a decrease of $25,000 for additional turnover savings from the Governor’s recommendation, $267,044 in federal funds and $293,642 in other funds, as in the Governor’s recommendation. The enacted budget authorizes 8.6 FTE positions, the same level as FY 2013. The FY 2014 enacted budget for the Rhode Island Higher Education Assistance Authority totals $26.8 million from all funds, including $4.3 million in general revenue, $13.3 million in federal funds, and $9.2 million in other funds. The FY 2014 enacted budget decreased general revenue funding by $1.4 million, or 25.0 percent, compared to the FY 2013 revised budget. The General Assembly reduced grants funded from general revenue by $1.0 million and increased grants funded from other funds by $550,000. The FY 2014 enacted budget also shifted $390,664 of general revenue funded administrative costs to other funds, specifically the Tuition Savings Program. The enacted budget finances $8.8 million of scholarships in the Tuition Savings Program. Scholarships from all funds are $12.9 million, a reduction of $471,277 from the FY 2013 revised budget of $13.4 million. The final FY 2013 revised budget for the Authority, as in the Governor’s recommendation, totals $28.2 million, comprised of $5.7 million in general revenue, $14.0 million in federal funds, and $8.5 million in other funds. The FY 2014 enacted budget authorizes 23.0 FTE positions, 13.0 less than the FY 2013 level of 36.0 FTE positions. The FY 2014 enacted budget for the Rhode Island Historical Preservation and Heritage Commission totals $3.5 million, including $1.4 million in general revenue, $609,949 in federal funds, $454,491 in restricted receipts, and $1.1 million in other funds. The agency’s FY 2014 enacted budget is $25,000 more than the Governor’s recommendation, comprised entirely of general revenue. There was no change to the Governor’s recommendation for federal funds and other funds. General revenue funding reflects a net increase of $92,093 or 7.3 percent from the final FY 2013 revised budget of $1.3 million. Federal funds reflect a net increase of $20,670 or 3.5 percent from the final FY 2013 revised budget of $589,279. Restricted receipts reflect a net increase of $300 or 0.1 percent from the final FY 2013 revised budget of $454,191. Other funds reflect a net increase of $943,393 or 666.2 percent from the final FY 2013 revised budget of $141,606. The General Assembly increased the Historical Preservation and Heritage Commission’s community service grants by $25,000 in FY 2014 in comparison to the Governor’s recommendation of $111,301 based on a new grant awarded to the Holocaust Memorial. The FY 2014 enacted budget includes $1.0 million from the Rhode Island Capital Plan Fund for the complete overhaul of the Eisenhower House located in Newport, RI. The final revised FY 2013 budget totals $2.5 million, comprised of $1.3 million in general revenue, $589,279 in federal funds, $454,191 in restricted receipts, and $141,606 in other funds. In comparison to the Governor’s supplemental recommendation, the final revised FY 2013 budget for the Commission is $75,000 less than the Governor’s recommendation comprised entirely of shifting Eisenhower House
39

Overview
capital funding from FY 2013 to FY 2015 to better comply with the project timeline. Total financing of $1.2 million for the Eisenhower House overhaul project remains unchanged. The Commission’s enacted budget includes 16.6 FTE positions, which is unchanged from the final FY 2013 revised budget authorization. The Commission has an agreement with the Rhode Island Department of Transportation (RIDOT) to have 1.0 FTE position be solely responsible for assisting in the development and implementation of a shared information system to streamline historic review of construction sites. Although this position is fully-funded through RIDOT with federal highway monies via fund transfers, it is counted towards the Commission’s FTE authorization. The FY 2013 revised budget includes six months or $41,606 and the FY 2014 enacted budget includes one year of financing or $84,999 for this position under other funds. No appropriation is made to the Rhode Island Public Telecommunications Authority within the FY 2014 enacted budget. As of July 1, 2013, the Authority will no longer receive state support and will have transitioned fully to the Rhode Island PBS Foundation. This is unchanged from the Governor’s recommended FY 2014 budget. The Governor did however recommend $400,000 in FY 2014 in the form of a grant to the Rhode Island PBS Foundation for transitional funding. The final enacted budget has reduced this grant by $100,000 for a total transitional grant of $300,000 in FY 2014. The grant is appropriated in the Rhode Island Department of Elementary and Secondary Education’s FY 2014 budget. A grant at a lesser amount will also be considered for FY 2015, after which time the Foundation would expect to be self-sufficient through other fundraising and revenue generating opportunities and thus no further state grants would be required. The final revised FY 2013 budget totals $799,077, comprised entirely of general revenue. In comparison to the Governor’s supplemental recommendation, the final revised FY 2013 budget for the Authority reflects an increase of $3,591. The Governor requested a budget amendment, which the General Assembly accepted, to restore financing for statewide adjustments made to medical benefits that were inadvertently removed. The Authority ceased state operations in November 2011 and based on an agreement between the State Controller’s Office and the Authority, all enacted state funds were expended at that point. The Authority’s enacted budget no longer includes an authorization for any FTE positions, which is a decrease of 14.0 FTE positions from the final FY 2013 revised authorization.
The FY 2014 enacted budget for the Attorney General totals $30.4 million, including $23.7 million in general revenue, $1.6 million in federal funds, $5.1 million in restricted receipts, and $50,000 in other funds. Across all fund sources, appropriations increase by 4.3 percent or $1.2 million from the FY 2013 revised budget of $29.1 million. General revenue increases by 4.5
percent or $1.0 million from the FY 2013 revised budget of $22.6 million. Federal funds decreases by 39.4 percent or $1.1 million from the FY 2013 revised budget of $2.7 million. Restricted receipt funding increases by 56.6 percent or $1.8 million from the FY 2013 revised budget of $3.2 million. Other funds funding decreases by 91.7 percent or $550,000 from the FY 2013 revised budget of $600,000. Compared to the FY 2014 Governor’s recommendation, the FY 2014 enacted budget for the Attorney General’s Office increases by $11,000 across all funds from $30.4 million. Federal funding increases by $11,000 from the Governor’s recommended budget of $1.6 million. General revenue, restricted receipt, and other funds funding remained unchanged. The change in federal funding was the result of an
Public Safety
40

Overview
amendment submitted after the Governor’s budget proposal to reflect changes to the availability of funds for the Victims of Crime Assistance Grant. The enacted budget for FY 2014 includes $20.5 million across all funds for the Criminal program which is an increase of $11,000 from the Governor’s recommended budget of $20.5 million. General revenue and restricted receipt funding remain unchanged at $14.4 million and $4.4 million, respectively. Federal funding constitutes the full amount of the change within this program at an increase of $11,000 from the Governor’s recommended budget of $1.6 million. The FY 2014 enacted budget includes $5.6 million for the Civil program, which is in line with the Governor’s recommended budget. General revenue funding and restricted receipt funding remains unchanged at $5.0 million and $632,970, respectively. The enacted budget for FY 2014 includes $1.5 million in general revenue for the Bureau of Criminal Identification program, which is reflective of the Governor’s recommended budget. The enacted budget for FY 2014 includes $2.8 million across all funds for the General program which is in line with the Governor’s recommended budget. Funding from general revenue and other funds remains the same at $2.7 million and $50,000, respectively. Staffing authorizations for the Office remain unchanged from FY 2013 at 233.1 FTE positions, consistent with the Governor’s proposal for FY 2014. The FY 2014 enacted budget for the Department of Corrections totals $204.7 million, comprising $185.4 million in general revenue, $1.8 million in federal funds, $64,890 in restricted receipts, and $17.5 million from the Rhode Island Capital Plan Fund. The FY 2014 enacted all funds budget increases by $6.8 million compared to the FY 2013 final revised budget of $197.9 million. General revenue decreases by $162,945, federal funds decrease by $1.3 million, while the other funds category increases by $8.3 million. The Department’s FY 2014 budget is $200,000 less than the Governor’s recommendation, comprising a $500,000 decrease in general revenue offset by an increase of $300,000 in the Rhode Island Capital Plan Fund. Programmatic changes include the General Assembly including a turnover savings adjustment of $500,000 ($150,000 in Central Management, $250,000 in Healthcare Services, and $100,000 in Community Corrections) and increasing Rhode Island Capital Plan Fund expenditures by $300,000 to reflect revised estimates in the Maximum General Renovations project. The FY 2014 budget continues to reflect a reorganization of departmental programs in order to facilitate performance tracking. The reorganization includes the transfer of the inmate accounts unit and the Central Distribution Center internal service fund to the Central Management program, the reorganization of the Institutional Corrections program into four programs: Custody and Security, Institutional Support, Institutional-based Rehabilitation, and Healthcare Services, and the transfer of the Correctional Industries internal service fund to Institutional-based Rehabilitation. In the Central Management program, the FY 2014 enacted budget is $9.1 million, virtually all of which is general revenue. The latter increases from the final FY 2013 revised budget by $512,483. This is offset by a decrease in federal funds of $876,283, for a net decrease of $363,600. The budget includes general revenue funding of $749,522 for one training class of 40 correctional officers in FY 2014, starting in the fall of 2013 with graduation in early 2014. The budget also includes $350,000 to initiate funding for the development of a Time Tracker system to replace current human resources time keeping with a fully integrated process that would include employee profiles and other data to track and report on all hours.
41

Overview
In the Parole Board program, the FY 2014 enacted budget is $1.4 million, all but $38,000 in general revenue. The general revenue increase from the final FY 2013 revised budget appropriation is $56,812. The $38,000 in federal funds is for victim’s services. In the Custody and Security program, the FY 2014 enacted budget is $116.2 million, including $115.4 million in general revenue and $761,526 in federal funds. This program primarily finances personnel costs of Correctional Officers working in the department’s six facilities, as well as security, investigative and records and ID personnel. The general revenue budget of $115.4 million is a decrease of $3.1 million from the FY 2013 final revised budget of $118.5 million. Federal funds in FY 2014 will finance $705,034 in core personnel costs through the State Criminal Alien Assistance program. In the Institutional Support program, which includes food services, maintenance, classification, and capital projects, the FY 2014 final enacted budget is $33.2 million, including $15.7 million in general revenue (an increase of $228,904 from the FY 2013 final revised budget) and $17.5 million from the Rhode Island Capital Plan Fund (an increase of $8.3 million from FY 2013). In order to provide necessary repairs and renovations to the Department’s aging facilities, the final enacted budget includes Rhode Island Capital Plan Fund resources of $3.0 million for asset protection projects, $9.8 million for various infrastructure renovation projects at the Intake Services Center, Maximum, and Medium Moran facilities, $2.5 million for the expansion of Minimum Security, and $2.2 million in renovation costs to enable the transfer of women inmates from their current facilities to the new Gloria McDonald facility. In the Institutional-based Rehabilitation program, which includes educational and vocational training, substance abuse services, correctional industries, case management, and transitional services, the FY 2014 final enacted budget is $10.0 million, including $9.1 million in general revenue (an increase of $165,789 from the FY 2013 budget), $29,758 in restricted receipts, and $859,312 in federal funds (a decrease of $339,666). Federal funds in FY 2014 will finance adult inmate education, residential drug treatment, reentry services, and federal stimulus grants from the American Recovery and Reinvestment Act (ARRA) for programs in inmate family reunification and inmate transition through access to employment. In the Healthcare program, which includes physician, pharmacy, dental, nursing and mental health services, AIDS counseling, and medical records, the FY 2014 final enacted budget is $19.6 million, all in general revenue. This amount represents an increase of $1.1 million from the FY 2013 revised budget. The FY 2014 final enacted budget reflects a revised inmate population of 3,152. This is 42 fewer inmates than the FY 2013 level of 3,194. The inmate reduction reflects the most recent inmate population, the FY 2013 year-to-date May average of 3,160. The final enacted FY 2014 per diem inmate related expenditures totals $11.8 million, in medical supplies and pharmaceuticals ($2.8 million), medical services ($2.9 million), food ($4.3 million), janitorial and kitchen supplies ($1.1 million), program supplies ($246,744), and linen, inmate clothing, and other non-medical costs ($499,392). Compared to the final FY 2013 revised budget, overtime supervisory costs decrease by $5.6 million in FY 2014 level from $18.0 million to $12.4 million, reflecting the anticipated hiring of correctional officer trainees. In the Community Corrections program, which includes probation and parole, home confinement, and victim’s services, the FY 2014 final enacted budget is $15.1 million, including $15.0 million in general revenue, $73,986 in federal funds, and $35,132 in restricted receipts. The enacted budget includes a general revenue reduction and a corresponding increase in restricted receipts to reflect the transfer of indirect administrative expenditures of 5.0 percent of applicable federal funds. The general revenue increase from the final FY 2013 revised budget is $479,619.
42

Overview
The FY 2013 revised budget totals $197.9 million, including $185.5 million in general revenue, $3.1 million in federal funds, $73,362 in restricted receipts, and $9.1 million from the Rhode Island Capital Plan Fund. The revised budget is $490,160 more than the Governor’s recommendation of $197.4 million. Programmatic changes include general revenue increases of $995,386, $400,000 for overtime costs incurred as a result of the February snowstorm, $200,000 for retaining information technology expenditures (software upgrades and licensing fees) in the department, and $395,386 for retaining facilities and maintenance expenses (municipal sewer charges, Statehouse and Waterplace park) in the department. The final revised budget also reflects federal grant adjustments of $93,680, as well as a reduction of $598,906 in Rhode Island Capital Plan Fund resources for the Maximum Security Renovations project The FY 2013 and FY 2014 authorized FTE level for the Department remains the same as the FY 2012 level of 1,419.0 FTE positions. The FY 2014 enacted budget for the Judiciary totals $107.6 million, including $91.7 million in general revenue, $2.6 million in federal funds, $11.8 million in restricted receipts, and $1.5 million in Rhode Island Capital Plan Fund financing. In relation to the Governor’s recommendation, the FY 2014 enacted budget increases by $1.4 million, or 1.3 percent. General revenue decreases by $200,000, attributable to turnover and operational savings in the amount of $800,000 throughout all courts, offset by the addition of $300,000 for staffing in the new Veteran’s Court, $200,000 for a new Justice Assistance modeling grant, and $100,000 more for the Domestic Violence Court Advocacy legislative grant. Federal funds correspond to the Governor’s recommendation of $2.6 million, mostly for child support enforcement and delinquency prevention efforts. Restricted receipts increase by $13,000 from the Governor’s recommendation, to provide expanded access to civil justice for low-income and disadvantaged persons. Rhode Island Capital Plan Fund financing is provided in the amount of $1.5 million in FY 2014, same as the Governor’s recommended amount. For the Supreme Court, the FY 2014 enacted budget totals $34.9 million, comprised of $29.8 million in general revenue, $272,163 in federal funds, $3.4 million in restricted receipts and $1.5 million in other funds. Across all fund sources, the FY 2014 enacted budget is $1.7 million less than the FY 2013 final revised budget. General revenues increase by $775,770 from FY 2013, comprised of base adjustments for statewide personnel in the Governor’s recommendation in the amount of $558,615, $300,000 more for the Domestic Violence grant, and $49,750 more for judge’s pensions, offset by removal of $138,960 in operating savings. Restricted receipts increase by $400,833 over the FY 2013 final enacted, attributable to increased availability of indirect cost recoveries for staff financing and computer system improvements, including the new case management system. Rhode Island Capital Plan fund financing decreases by $2.9 million, reflecting the completion of several HVAC and other asset protection projects in courthouses throughout the state. In the Superior Court, the FY 2014 enacted budget is $22.7 million, comprised of $22.3 million in general revenue, $94,205 in federal funds, and $306,723 in restricted receipts. The FY 2014 enacted budget is $753,385, or 3.3 percent greater than the FY 2013 final revised budget. The majority of the increase is in general revenue personnel financing, notably for statewide benefit adjustments, for judge’s pensions and to provide financing for vacant positions in the court. Family Court financing in FY 2014 totals $18.5 million, which is $216,386 or 4.1 percent greater than the FY 2013 revised budget. General revenue increases by $824,295, or 4.3 percent, from the FY 2013 revised level largely attributable to statewide benefit adjustments, and $49,250 more for judges’ pensions. Federal funds decrease by $32,699, or 1.5 percent, reflecting the completion of a federal award from the National Coalition Against Sexual Assault for victims of child abuse.
43

Overview
In FY 2014, the District Court is financed at $12.8 million, an increase of $1.2 million, or 9.6 percent from the FY 2013 revised budget. Financing in this court is comprised of $12.5 million in general revenue and $297,822 in restricted receipt recoveries from small claims mediation efforts. General revenues increase by $1.2 million from the FY 2013 revised budget all in the personnel category, attributable to salary and statewide benefit growth, financing for vacancies, and $300,000 for the new Veteran’s Court personnel. The new Veteran’s Court is established to specifically address the unique issues facing veterans including substance abuse counseling and job placement services. Traffic Tribunal financing totals $8.1 million in FY 2014, an increase of $156,767, or 1.9 percent from the FY 2013 revised budget. The court is financed entirely with general revenue. Between the two years, personnel financing increases by $66,042, security services increase by $48,756 to correspond to past expenditure levels, and judges pensions increase by $41,969. The Worker’s Compensation Court, financed entirely with restricted receipts, totals $7.8 million in FY 2014, an increase of $148,731, or 1.9 percent from the FY 2013 revised enacted level. Personnel increases by $126,073, mostly attributable to statewide growth in the benefit category. Elsewhere, minor adjustments to operating codes to correspond to historical expenditure contribute another $20,658 to the year over year increase. The Judicial Tenure and Discipline program increases by $2,300, attributable to changes in benefit calculations. The program is financed entirely with general revenue. Court-wide, the final FY 2013 revised budget of $106.3 million is $5,000 more than the Governor’s recommended amount, attributable to part year financing from the American Bar Association for access to civil justice for low-income and disadvantaged persons, which was included as a late year amendment to the Governor’s recommendation for the Courts. The authorized FTE position level for the final FY 2014 budget is 726.3 FTE, an increase of 3.0 FTE positions from the FY 2013 level of 723.3 FTE positions. The new FTE positions in FY 2014 are for the new Veteran’s Court in the District Court. The FY 2014 final enacted budget totals $43.2 million for the Military Staff, including $3.9 million in general revenue, $34.9 million in federal funds, $1.0 million in restricted receipts, and $3.4 million from the Rhode Island Capital Plan Fund. Compared to the final revised FY 2013 appropriation, general revenue expenditures increase by $221,283, federal funds decrease by $21.0 million, restricted receipts increase by $263,889, and financing from the Rhode Island Capital Plan Fund decreases by $2.3 million. The FY 2014 enacted budget is $1.7 million less than the Governor’s initial recommendation. The general revenue reduction of $766,701 from the Governors recommendation reflects removal of $289,297 for 5.0 new FTE positions, which the Military Staff now indicates can be financed entirely with federal funds, and removal of $477,404 for perceived availability of indirect cost recoveries from federal grants for personnel offsets. Restricted receipt financing is increased by a corresponding amount to reflect the indirect cost recovery shift. Federal financing is $2.8 million less than the Governor’s initial recommendation reflecting known requirements of several grant authorizations, most of which were included in an amendment to the Governor’s recommendation. Rhode Island Capital Plan Fund financing increases by $1.4 million from the Governor’s recommendation, reflecting a shift of $1.5 million from FY 2013 to FY 2014 for the state match portion of Hurricane Sandy recovery projects, to be used by various state agencies and municipalities for capital reconstruction from damage caused by the storm event. The FY 2014 enacted budget also reflects statewide target adjustments, including increases for medical benefits, the employer retirement
44

Overview
contribution and the payroll accrual, offset by reductions for medical waivers and the statewide benefit assessment. In the National Guard program, the FY 2014 enacted budget totals $19.9 million, including $1.4 million in general revenue, $14.8 million in federal funds, $300,000 in restricted receipts, and $3.4 million from the Rhode Island Capital Plan Fund. In relation to the FY 2013 revised enacted, general revenue decreases by $251,928 reflecting the proposed offset to indirect cost recoveries in Emergency Management, federal funds are $287,603 greater reflecting expected expenditure of the program’s federal share resources, restricted receipts are $220,000 reflecting known expenditures for counter-drug efforts financed with Google funds, and Rhode Island Capital Plan Fund resources decrease by $2.3 million to correspond with the Governor’s recommendation. The National Guard program budget includes $95,000 in general revenue for the Funeral Honors program to be used to compensate military retirees who wish to provide ceremonial services. The budget also continues funding of various benefits provided to National Guard personnel, including $100,000 for the Education Benefit to fund enrollment of eligible guardsmen in courses at state colleges, and the Life Insurance Benefit to reimburse federally funded life insurance for guardsmen deployed overseas. Capital project funding from the Rhode Island Capital Plan Fund includes $1.1 million for various asset protection projects, and $800,000 to begin work on the historic Benefit Street Arsenal revitalization project. In the Emergency Management program, the FY 2014 enacted budget totals $23.3 million, comprised of $2.5 million in general revenue, $20.1 million in federal funds, and $700,779 in restricted receipts. Capital projects include $1.5 million in Rhode Island Capital Plan Fund financing (budgeted in the National Guard program) for reimbursements for capital improvements required in the wake of Hurricane Sandy. Work on the Command Readiness Center Addition, financed with Rhode Island Capital Plan Fund financing is expected to be complete in FY 2013, and will provide expanded space for centralized disaster response activities. General revenue increases by $473,211 from the FY 2013 final revised budget, mostly attributable to an increase of $670,645 for the Rhode Island Statewide Communications Network to a total of $1.9 million in FY 2014. The increase will continue the Agency’s efforts to improve interoperability between the State Emergency Management Agency and local police, fire and medical personnel, including maintenance and insurance of the system. Additional resources from federal and restricted resources in the amount of $118,046 are also available for this effort in FY 2014. The enacted budget includes $4.8 million in federal financing for homeland security, port security, transit protection and urban areas security initiatives. Authorized expenditures include first responder equipment, equipment for local emergency response and urban search and rescue teams, municipal planning, exercises, and training, state homeland security equipment, training, exercise and planning activities, law enforcement terrorism protection, and volunteer training programs. The FY 2014 final enacted budget includes an authorized FTE level of 117.0 full-time equivalent positions, an increase of 5.0 FTE positions from the FY 2013 final enacted level. The authorization of five new positions in the Emergency Management Agency are for statewide coordination of planning and preparedness efforts for natural and manmade emergencies. The FY 2014 enacted budget for the Department of Public Safety totals $123.5 million, including $96.4 million in general revenue, $6.2 million in federal funds, $12.8 million in restricted receipts, and $8.2 million in other funds. The agency’s FY 2014 enacted budget is $1.8 million less than the FY 2014 Governor’s recommendation, comprised of $772,222 less in general revenue and $1.1 million less in other funds and operating transfers. The Department’s budget of $123.5 million reflects a net increase of 2.8 percent, or $3.4 million, from the final revised FY 2013 budget of $120.1 million. General revenue
45
Overview
funding reflects a net increase of 2.8 percent, or $3.4 million, federal funding reflects a net decrease of 43.0 percent, or $4.6 million, restricted receipt funding reflects a small increase of $332, and other funds and operating transfers reflect a net increase of 52.0 percent, or $2.8 million from the final revised FY 2013 budget. In the Central Management program, the FY 2014 enacted budget totals $5.3 million, including $1.2 million in general revenue, $4.1 million in federal funds, and $850 in restricted receipts. The program’s FY 2014 enacted budget is $194,955 less than the FY 2014 Governor’s recommendation, comprised entirely of a 2.0 FTE position reduction in general revenue shifted from federal funding due to the stimulus’ end. The program’s budget of $5.3 million reflects a net decrease of 11.3 percent, or $677,054, from the final revised FY 2013 budget of $6.0 million. In the E-911 program, the FY 2014 enacted budget totals $5.5 million and is solely financed from general revenue. The program’s FY 2014 enacted budget equals the FY 2014 Governor’s recommendation. The program’s budget of $5.5 million reflects a net increase of 5.3 percent, or $276,373, from the final revised FY 2013 revised budget of $5.2 million. The program’s final revised FY 2013 budget is equal to the FY 2013 Governor’s recommendation. In the State Fire Marshal program, the FY 2014 enacted budget totals $4.0 million, including $2.9 million in general revenue, $277,338 in restricted receipts, and $855,303 in other funds. The program’s FY 2014 enacted budget is $1.3 million less than the FY 2014 Governor’s recommendation due to a $1.3 million delay in the Fire Academy Building project. The program’s budget of $4.0 million reflects a net increase of 3.4 percent, or $130,406, from the final revised FY 2013 budget of $3.9 million. The final revised FY 2013 budget is $627,029 less than the FY 2013 Governor’s recommendation, which is a direct result of $700,000 in Rhode Island Capital Plan Fund financing for the State Fire Academy being delayed and an increase of $72,971 in federal funds. In the Security Services program, the FY 2014 enacted budget totals $21.8 million and is solely financed from general revenue. The program’s FY 2014 enacted budget is $200,000 less than the FY 2014 Governor’s recommendation due to additional turnover savings taken in the Sheriff’s Division. The program’s budget of $21.8 million reflects a net increase of 2.8 percent, or $596,636, from the final revised FY 2013 budget of $21.2 million. The final revised FY 2013 budget is equal to the FY 2013 Governor’s recommendation. In the Municipal Police Training Academy program, the FY 2014 enacted budget totals $562,173 and includes $293,022 in general revenue and $269,151 in federal funds. The program’s budget of $562,173 is equal to the Governor’s recommendation and reflects a net decrease of 8.7 percent, or $54,430, from the final revised FY 2013 budget of $615,603. In the State Police program, the FY 2014 enacted budget totals $86.2 million, including $64.6 million in general revenue, $1.8 million in federal funds, $12.5 million in restricted receipts, and $7.4 million in other funds. The FY 2014 enacted budget is $152,267 less than the FY 2014 Governor’s recommendation comprised of $377,267 less in general revenue, offset by $225,000 more in other funds. The program’s budget of $86.2 million reflects a net increase of 3.7 percent, or $3.0 million, from the final revised FY 2013 budget of $83.2 million. The program’s final revised FY 2013 budget is $2.4 million less than the FY 2013 Governor’s recommendation comprised of $214,747 less in general revenue and $2.5 million less in other funds, offset by $254,200 more in federal funds and $340,000 more in restricted receipts. The reductions can be attributed to a shift in financing for capital projects. The Department’s FY 2014 FTE authorization of 645.2 FTE positions reflects an increase of 36.0 FTE positions from the FY 2013 revised budget appropriation of 609.2 FTE positions. The net increase of
46

Overview
36.0 positions is comprised of the addition of 40.0 FTE troopers in a new academy class and reduction by the Legislature from the Governor’s recommendation of 2.0 FTE positions for a systems manager and computer programmer who were previously funded by federal stimulus funds in Central Management, but recommended funded with general revenue at the end of stimulus support, and of reduction by the Legislature from the Governor’s recommendation of 2.0 new FTE positions for a paralegal and a public information officer for the State Police. The FY 2014 enacted budget for the Office of the Public Defender totals $11.3 million, including $11.0 million in general revenue and $291,996 in federal funds. The FY 2014 general revenue budget is $577,272 more than the final FY 2013 revised budget, while federal funds remain the same. The agency’s FY 2014 enacted budget is unchanged from the Governor’s recommendation. The budget reflects adjustments to current services required for salary and employee benefits of the existing staff, including both initial statewide target increases for retirement, retiree health, and medical benefits and statewide reductions in these items due to identified savings. The enacted budget includes $45,940 in general revenue financing in contract services for both trial related work and continued funding of intake eligibility technicians. The final enacted budget also includes $30,215 for computer network and operating systems upgrades. The enacted budget also includes three federal grants: 1) $75,000 for the John R. Justice Incentive Grant, which will be loaned out as scholarly assistance to municipal, state and federal prosecutors and defenders; 2) $121,996 for the Juvenile Response grant; and 3) $95,000 for the Community Partnership program, which funds legal and social work assistance to clients.
The FY 2013 final revised budget totals $10.8 million, comprised of $10.5 million in general revenue and $291,996 in federal funds. The general revenue enacted budget is $300,000 less than the Governor’s recommendation, and reflects estimated turnover savings.
The FY 2013 and FY 2014 authorizations are for 93.0 FTE positions.
The FY 2014 enacted budget for the Department of Environmental Management totals $116.2 million, including $34.8 million in general revenue, $38.4 million in federal funds, $18.1 million in restricted receipts, and $24.9 million in other funds. The agency’s FY 2014 enacted budget is $9.6 million more than the FY 2014 Governor’s recommendation, reflecting
addition of $3.3 million in federal financing, mostly for a new commercial fishing infrastructure grant, $2.2 million more in restricted receipts financed with third- party contributions for a marine education center at Fort Adams State Park, and $4.3 million more in Rhode Island Capital Plan Fund. These increases are offset by a reduction of $120,129 in general revenue, reflecting expected staffing levels in the Coastal Resources and Criminal Investigation units. The FY 2014 enacted budget is $18.6 million, or 19.0 percent greater than the revised FY 2013 budget for the department, including $494,961 more in general revenue, mostly for statewide personnel benefit adjustments, $1.5 million more in federal funds reflecting availability of federal grants in the Natural Resources and Environmental Protection bureaus, $2.7 million more in restricted receipts largely for the marine education facility Ft. Adams, and $4.3 million more in Rhode Island Capital Plan Fund financing for various projects associated with maintaining the state’s commercial fishing industry and its outdoor recreational systems and facilities. The final revised FY 2013 budget totals $97.6 million, consisting of $34.3 million in general revenue, $36.9 million in federal funds, $15.4 million in restricted receipts, and $11.1 million in other funds. In relation to the Governor’s supplemental recommendation, the final revised FY 2014 budget is a decrease of $1.9 million, mostly to align Rhode Island Capital Plan Fund financing to known project requirements in FY 2013.
Natural Resources
47

Overview
In the Office of the Director program, the FY 2014 enacted budget totals $7.7 million, including $4.6 million in general revenue, $150,000 in federal funds, and $2.9 million in restricted receipts. The program’s budget of $7.7 million reflects a net decrease of 12.2 percent, or $1.1 million, from the final enacted FY 2013 budget of $8.8 million. The program’s FY 2014 enacted budget corresponds to the Governor’s recommendation, and preserves the Governor’s commitment to environmental policy and promotion efforts within the Office of the Director. Aside from policy and promotion, the Office of the Director is also the department-wide administrator of computer systems, legal services, personnel administration and the headquarters facility. The Office also administers commercial and recreational boat registrations and adjudicates environmental infractions. In the Bureau of Natural Resources program, the FY 2014 enacted budget totals $74.5 million, including $18.7 million in general revenue, $27.1 million in federal funds, $6.6 million in restricted receipts, and $22.0 million in other funds. The program’s FY 2014 enacted budget is a net increase of $21.6 million, or 40.8 percent from the final FY 2013 revised budget of $52.9 million, of which $13.8 million is attributable to acceleration of capital improvements for the Galilee and Newport fishing piers, improvements to Fort Adams for America’s Cup sailing events, refurbishment of World War II Park in Woonsocket, and development of Rocky Point as a public access recreation facility. In relation to the Governor’s FY 2014 recommendation, the Legislature added $9.6 million, comprised of $3.3 million more for a new federal commercial fishing infrastructure grant as recommended by the Governor, $2.2 million in restricted receipts for the marine education center at Fort Adams, and $4.3 million more in capital financing based on the Governor’s recommendation for Rhode Island Capital Plan Fund financing. The Legislature’s FY 2013 enacted budget for the Natural Resources corresponds to the Governor’s recommendation, including aligning Rhode Island Capital Plan Fund financing to known capital requirements. In the Bureau of Environmental Protection program, the FY 2014 enacted budget totals $34.1 million, including $11.4 million in general revenue, $11.1 million in federal funds, $8.6 million in restricted receipts, and $2.9 million in other funds. The Legislature’s recommendation for the Bureau is 5.4 percent less, or $1.9 million in comparison to the FY 2013 revised budget of $36.0 million. General revenue financing remains consistent from FY 2013 to FY 2014, and corresponds to the Governor’s recommendation for the Bureau. Federal funds decrease by $2.2 million year over year, reflecting availability of financing for grants to municipalities for non-point source pollution abatement projects. Restricted receipts and other funds remain consistent year over year in the amounts of $8.6 million and $2.9 million, respectively. The Department’s FY 2014 FTE positions authorization is 399.0 FTE positions, same as the FY 2013 authorization. The Department also has significant seasonal employment requirements for operation of the state’s beaches, natural areas, and campgrounds.
The FY 2014 enacted budget for the Coastal Resources Management Council totals $4.7 million, including $2.2 million of general revenue, $2.2 million of federal funds, and $374,982 in restricted receipts. The FY 2014 enacted budget is $477,222 less than the Governor’s recommendation. Of the reduction, $124,982 is in general revenue and results from the budgeting of a five percent indirect cost recovery target and is offset by the transfer of these expenses to restricted receipts. The federal funds reduction of $477,222 is comprised of the indirect recovery reduction of $124,982, and the shift of $352,240 in expenditures from FY 2014 to FY 2013, reflecting a revised project schedule for restoring access to spawning habitat in the Ten Mile and Pawcatuck River watersheds for migratory species.
In relation to the FY 2013 revised budget, general revenue decreases by $10,930, federal funds decrease by $376,810 and RI Capital Plan Fund financing decreases by $722,281. The $2.2 million of federal
48

Overview
funds includes $1.3 million for personnel and operating support; $338,281 for the Narragansett Bay Habitat Restoration Planning to complete the study of shorelines to determine how organic materials can be used to restore habitats; and $54,523 for aquatic invasive species management. Restricted receipts of $250,000 from the Oil Spill Prevention, Administration and Response Fund finances specific coastal habitat restoration projects. In addition to statewide target adjustments, including a revision in retirement, health benefit, and retiree health rates, the general revenue budget includes $126,000 for contract legal expenditures.
The final revised FY 2013 budget for the agency totals $5.7 million, including $2.2 million in general revenue, $2.5 million in federal funds, $250,000 in restricted receipts, and $722,281 from the Rhode Island Capital Plan Fund. The revised budget is $297,240 more than the Governor’s recommendation, comprised of $352,240 more federal funds reflecting the shift in projected expenditure in the Rhode Island River Ecosystem Restoration project, and $55,000 less general revenue reflecting adjustments for estimated turnover savings.
The FTE position authorization for the Council is unchanged at 29.0 FTE positions for FY 2013 and FY 2014.
The FY 2014 enacted budget for the Department of Transportation (RIDOT) totals $460.2 million, including $140.5 million in other funds, $311.8 million in federal funds, including $6.9 million in federal stimulus funds, and $8.0 million in restricted receipts. The agency’s FY 2014 enacted budget represents a $9.7 million, or 2.1 percent, decrease from the
Governor’s recommendation for the department, comprised entirely in other funds. The decrease in other funds is primarily due to the General Assembly not accepting the Governor’s plan for a Local Roads and Streetscape program in FY 2014, which would have provided $10.0 million in Rhode Island Capital Plan Funds for a State-funded Local Roads Program to improve the condition of local roads through a streamlined process to allow local communities to select the roads most in need of resurfacing, and to implement these projects on a local level. In place, the General Assembly passed Article 20, Relating to Municipal Road and Bridge Revolving Fund, which creates the Municipal Road and Bridge Revolving Fund Act of 2013, to be administered by the Rhode Island Clean Water Finance Agency. As start-up funding, Article 1 of the FY 2014 enacted budget provides $6,992,890 of bond premium proceeds from the Rhode Island Capital Plan Fund to be transferred to the Municipal Road and Bridge Revolving Fund. Local cities and towns will now be allowed to bond for road and bridge construction projects under the Clean Water Finance Agency. The article also gives authorization to RIDOT to inspect all approved projects, while also receiving an appropriation by the General Assembly for expenses incurred by the Department. Lastly, the Clean Water Finance Agency shall determine the maximum amount of financial assistance available for the forthcoming calendar year, not to exceed $20.0 million and provided that the agency shall not obligate more than 50.0 percent of available funding in any calendar year to any one city or town unless there are no other eligible projects on the project priority list. The Department's FY 2014 enacted budget represents a decrease of $5.6 million, or 1.2 percent, from the final FY 2013 revised budget of $465.8 million. The final revised FY 2013 budget for the Department totals $465.8 million, comprised of $317.0 million in federal funds, including $7.0 million in federal stimulus funds, $1.0 million in restricted receipts, and $147.9 million in other funds. In comparison to the Governor’s supplemental recommendation, the final revised FY 2013 budget for the department represents a decrease of $1.5 million, or 0.3 percent, from the Governor’s recommendation, including a decrease of $508,667 in federal funds, no change in restricted receipts, and a decrease of $2.0 million in other funds. The increase in federal funds is based on the
Transportation
Function
49

Overview
Governor’s proposed budget amendment, which the General Assembly accepted, to increase two federal stimulus accounts based on carry forward ARRA funds. For a variety of reasons, both projects extended into FY 2013 and based on timing, were not first initially budgeted. This increase is offset by decreases to multiple Rhode Island Capital Plan Fund shovel-ready projects for the Rhode Island Public Transit Authority, shifting Rhode Island Capital Plan funds into FY 2014 for RIDOT’s Portsmouth Facility and Salt Facility projects based on updated schedules, along with a slight decrease in the forecast of the per penny yield of gasoline tax revenues impacting other funds. The State’s gasoline tax remains at 32.0 cents per gallon in FY 2014, with an additional 1.0 cent per gallon for the Underground Storage Tank Fund. Upon receipt, all gasoline tax proceeds are deposited into the Intermodal Surface Transportation Fund from which statutory transfers are made to the Department of Transportation, the Rhode Island Public Transit Authority (RIPTA), and the elderly/disabled transportation program in the Department of Human Services. The disposition of the gasoline tax is as follows: the Department of Transportation receives 19.75 cents per gallon, RIPTA receives 9.25 cents per gallon, the GARVEE/ Motor Fuel program receives 2.0 cents per gallon (for debt service) and the Department of Human Services receives 1.0 cent per gallon for its elderly services program. The 1.0 cent from the Underground Storage Tank Fund originally directed to the Department of Environmental Management (DEM), was split as of FY 2009, with 0.50 cent directed to the Rhode Island Public Transit Authority, and the remainder to DEM.
FY 2014 Gas Tax Allocation (cents per gallon) Fiscal Year
Recipient 2008 2009 2010 2011 2012 2013 2014
DOT 20.75 20.75 21.753 21.75 21.75 21.75 21.75 RIPTA 7.251 7.752 9.754 9.75 9.75 9.75 9.75
General Fund 1.001 1.00 0.003 0.00 0.00 0.00 0.00 DHS5 1.00 1.00 1.00 1.00 1.00 1.00 1.00 DEM 1.00 0.502 0.50 0.50 0.50 0.50 0.50 Total 31.00 31.00 33.00 33.00 33.00 33.00 33.00
1 Increased to 7.25 cents in May 2006 with a corresponding decrease to the General Fund. 2 The Underground Storage Tank Fee of 1.00 cent which was previously directed to DEM is now split with 0.50 cent to DEM and 0.50 cent to RIPTA, beginning FY 2009. 3 The 1.00 cent that previously went to the General Fund now flows to the DOT as of July 2009. 4 Gasoline tax increased to 32.0 cents in July 2009 with a corresponding 2.00 cent increase to RIPTA. 5 The administration of the Elderly and Disabled Transportation Program has been transferred from DEA to DHS as of July 2009. The FY 2014 gasoline tax budget for the Intermodal Surface Transportation Fund totals $135.5 million, an increase of $167,147 from the Governor’s recommendation. The slight increase is primarily a result of an increase in the forecast of the per penny yield of gasoline tax revenues. The gasoline tax yield, as projected by the Office of Revenue Analysis, was increased $5,143 per cent to $4,170,507 from the original forecast utilized in the Governor’s recommendation, offset by a $12,975 decrease in projected balance forward funds within the Department of Transportation. Additionally, the General Assembly reduced general revenue financing that the Governor had recommended as part of a multi-year plan to shift financing of RIDOT’s debt service from gas tax resources to general revenue. The General Assembly reduced the amount of general revenue allocated for RIDOT debt service from $10.0 million to
50
Overview
$9.3 million in FY 2014. As a result, an additional $750,000 in gasoline tax revenue will be used towards debt service. The FY 2014 gasoline tax budget for the Intermodal Surface Transportation Fund of $135.5 million represents a decrease of $1.2 million from the final FY 2013 revised budget of $136.7 million. The primary variance is the decrease of $1.8 million in the carry forward balance between the two years. The FY 2014 budget of the Central Management division of the Department of Transportation totals $12.8 million, no change from the Governor’s recommendation. The $12.8 million enacted budget represents a decrease of $745,541 from the final FY 2013 revised budget of $13.5 million. Other funds, which are comprised solely of gasoline tax funds in this division, are $1.5 million, a decrease of $45,291 from the previous year’s final enacted. Federal funds of $11.3 million decrease $700,250 within the National Highway Transportation Safety Administration grants and reflect expected federal awards for various highway safety programs. Within the Management and Budget program, gasoline tax funds for FY 2014, the only funds appropriated within this division, total $1.5 million, an increase of $110,600 from the revised FY 2013 final budget of $1.4 million, which is attributable to an increase in personnel costs due to lower indirect cost recovery rates, which reduce the portion of personnel costs allocated to federal projects. There is no change from the Governor’s recommendation for the division. Other funds in the Infrastructure Engineering program increase $1.2 million from the Governor’s recommendation to $89.1 million, of which gasoline tax funded expenses of $53.1 million increased by $60,430. The gasoline tax increase is primarily due to the upward revised estimate of the per penny gasoline tax yield. The $1.2 million increase in other funds is primarily due to the Legislature appropriating an additional $1.1 million from the Rhode Island Capital Plan Fund to accelerate the elimination of general obligation bond financing for the Department of Transportation’s federal highway match. The 2013 General Assembly appropriated $20.0 million from the RICAP Fund to replace debt financing, which will eventually reduce the debt service of the department and alleviate the systemic deficits that have recurred in the recent past. The department will also be using a new motor vehicle surcharge for a portion of the funding, to be used as a pay-go match in lieu of borrowing. The surcharge language in current law was altered by the Governor under Article 6, which also included revised data and revenue projections, which reflect a decrease in available funding for the match. Revised estimates based on the phase-in plan as part of Article 6 include $5.9 million in FY 2014, $11.4 million in FY 2015 and $16.8 million in FY 2016 and beyond. The FY 2014 enacted budget increases the Highway Projects Match Plan by $1.1 million for a total of $21.1 million to ensure the department maintains sufficient funding to be used as the state match as bond proceeds go away. The remaining other funds have not changed from the Governor’s recommendation of $14.8 million, from land sales revenue, primarily the anticipated sale of the land made available from the I-195 project. Federal funds total $300.5 million, including the $6.9 million related to the American Recovery and Reinvestment Act of 2009, which did not change from the Governor’s recommendation. Restricted receipts of $8.0 million for FY 2014 within the Infrastructure Engineering Division remained at the same funding level as the Governor’s recommendation. Total funds of $397.6 million are appropriated in Infrastructure Engineering for FY 2014, a decrease of $8.2 million from the final FY 2013 enacted budget. Federal funds account for $4.5 million of the decrease over the previous year, $11.7 million decrease in other funds, the majority of which are due to a reduction in projected land sales as compared to FY 2013. The decreases are offset by an increase of $1.1 million in Rhode Island Capital Plan Fund and an increase of $7.0 million in restricted receipts for the inclusion of the new Rhode Island Highway Maintenance Trust Fund.
51

Overview
The FY 2014 enacted budget includes $6.9 million from the American Recovery and Reinvestment Act of 2009, no change from the Governor’s recommendation, and a decrease of $655,915 from the final FY 2013 revised budget of $7.5 million. The stimulus funds $5.7 million for improvements to Kingston track capacity and platform improvements and $1.2 million for the Providence Train Station Improvement Project. Funds for the Highway Improvement Program, Commuter Rail projects and an on–the-job training program have been exhausted in FY 2013. FY 2013 represents the end of highway stimulus funding under the American Recovery and Reinvestment Act of 2009. The Department of Transportation originally increased total employment of 89.0 FTE temporary positions to complete the projects budgeted, which have been converted to permanent positions. These FTE positions are assigned to the federal highway funded construction projects. Other funds of $48.4 million in the Infrastructure Maintenance program decrease $10.8 million from the Governor’s recommendation. Gasoline tax revenues of $42.3 million decrease $648,426 from the Governor’s recommend. Rhode Island Capital Plan Fund resources of $5.8 million decreased $10.2 million from the recommendation due to the removal of the Governor’s recommended Local Roads and Streetscapes Project, as discussed previously. The General Assembly accepted the Governor’s proposal to include $1.0 million in each of FY 2013 and FY 2014 from the Rhode Island Capital Plan Fund for the purchase of heavy duty equipment, such as ten-wheel dump trucks and large scale vacuum trucks, necessary to the operations of the department’s Maintenance Division. Total appropriated expenditures for the Infrastructure Maintenance program increased $3.2 million in FY 2014 from the final FY 2013 enacted budget. The primary reasons were the inclusion of additional funds in the amount of $1.4 million for the purchase of new maintenance vehicles combined with an increase in Rhode Island Capital Plan Fund financed projects of $1.2 million over the previous year. The General Assembly introduced a new Article 5, Relating to Highways. The new version of Article 5, then superseded by House Bill 6329 Substitute A, amends RIGL 24-12-40.F entitled “Sakonnet River Bridge Vested in Rhode Island Turnpike and Bridge Authority – Institution of Tolls”. The amendment delays the collection of tolls on the Sakonnet River Bridge until August 19, 2013, at which time; the Authority may then charge and collect tolls for the use of the bridge. The toll imposed shall not exceed ten cents ($0.10) until April 1, 2014. The amendment also establishes a Special Legislative Commission to make a comprehensive study of all types of funding mechanisms and strategies to support Rhode Island’s infrastructure, including the Sakonnet River Bridge. A total of 772.6 FTE positions are authorized for the department in FY 2014, no change from the final FY 2013 enacted authorization.
52
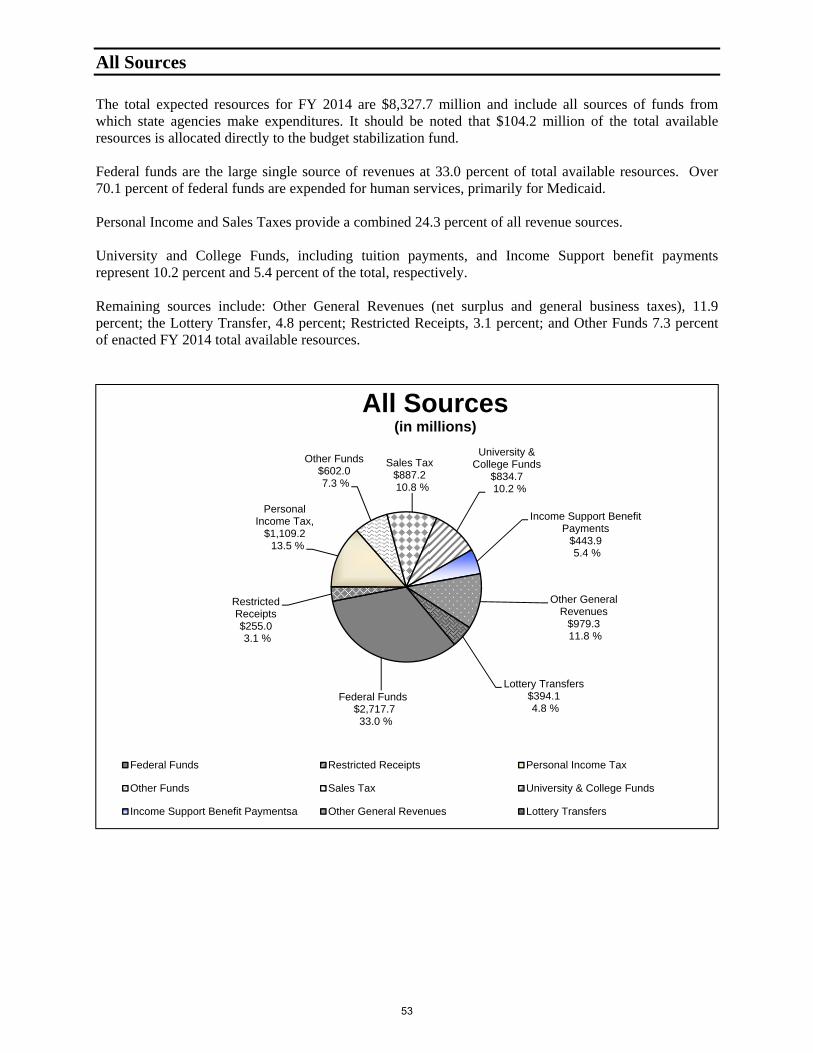
All Sources
The total expected resources for FY 2014 are $8,327.7 million and include all sources of funds from which state agencies make expenditures. It should be noted that $104.2 million of the total available resources is allocated directly to the budget stabilization fund. Federal funds are the large single source of revenues at 33.0 percent of total available resources. Over 70.1 percent of federal funds are expended for human services, primarily for Medicaid. Personal Income and Sales Taxes provide a combined 24.3 percent of all revenue sources. University and College Funds, including tuition payments, and Income Support benefit payments represent 10.2 percent and 5.4 percent of the total, respectively. Remaining sources include: Other General Revenues (net surplus and general business taxes), 11.9 percent; the Lottery Transfer, 4.8 percent; Restricted Receipts, 3.1 percent; and Other Funds 7.3 percent of enacted FY 2014 total available resources.
Federal Funds$2,717.733.0 %
Restricted Receipts $255.03.1 %
Personal Income Tax,
$1,109.213.5 %
Other Funds$602.07.3 %
Sales Tax$887.210.8 %
University &College Funds
$834.710.2 %
Income Support Benefit Payments
$443.95.4 %
Other General Revenues
$979.311.8 %
Lottery Transfers $394.14.8 %
All Sources (in millions)
Federal Funds Restricted Receipts Personal Income Tax
Other Funds Sales Tax University & College Funds
Income Support Benefit Paymentsa Other General Revenues Lottery Transfers
53

All Expenditures
Approximately 68.5 percent of all expenditures are for human services and education programs. The budgets for the human services agencies total $3.3 billion, or 40.3 percent of all expenditures. Education expenditures of $2.7 billion are 33.1 percent of the total expenditures, with $1.2 billion for aid to local units of government for category aid, teacher retirement, school construction, and charter schools. This is approximately 52.9 percent of all education expenditures, and 14.9 percent of all spending authorized for FY 2014. Expenditures of $1.5 billion authorized for general government programs include $603.1 million in non-education aid to local units of government and for assistance, grants and benefits to individuals. These expenditures are primarily for vehicle and property tax relief in addition to employment training, and unemployment benefits. General government expenditures are 18.1 percent of the total all funds budget. Transportation expenditures of $460.3 million compose 5.6 percent of the total budget, including funds for public transportation, highway, road and bridge expenditures. Remaining expenditures are $641.6 million, or 6.3 percent for public safety agencies, and $120.9 million, or 1.5 percent for natural resources agencies. Overall, expenditures from all funds increased 1.4 percent, or $111.5 million, from the final revised FY 2013 budget authorization.
Education$2,317.95
28%
General Government$1,487.50
18%
Human Services$3,305.79
40%
Public Safety$520.69
6%
Natural Resources$120.89
2%
Transportation$460.25
6%
Statewide Expenditures(in millions)
Education General Government Human Services Public Safety Natural Resources Transportation
54

General Revenues
The enacted FY 2014 general revenue budget is based upon $3.381 billion of general revenues. General revenues are subject to appropriation for any lawful government purpose. The personal income tax is the largest single general revenue source at 32.8 percent. All sales and use taxes, including the sales tax, motor vehicle licenses and fees, cigarette taxes and alcohol taxes, are an additional 32.2 percent of general revenue. The sales tax on its own is projected at $887.2 million, or 26.2 percent of general revenue. General business taxes, including corporate income taxes, are 11.4 percent of general revenue while all departmental receipts equal 10.3 percent of general revenues. Other revenue sources, including other taxes, are an additional $449.8 million, or 13.3 percent of the general revenue.
Personal Income Tax
$1,109.232.8 %
Sales and Use Tax $887.226.2 %
General Business Taxes $384.411.4 %
Other Sales & Use Taxes$201.7
6.0 %
Other Taxes & Other Sources
$449.813.3 %
Departmental Receipts$348.710.3 %
General Revenues (in millions)
Personal Income Tax Sales Tax General Business Taxes
Other Sales and Use Taxes Other Taxes and Other Sources Departmental Receipts
55
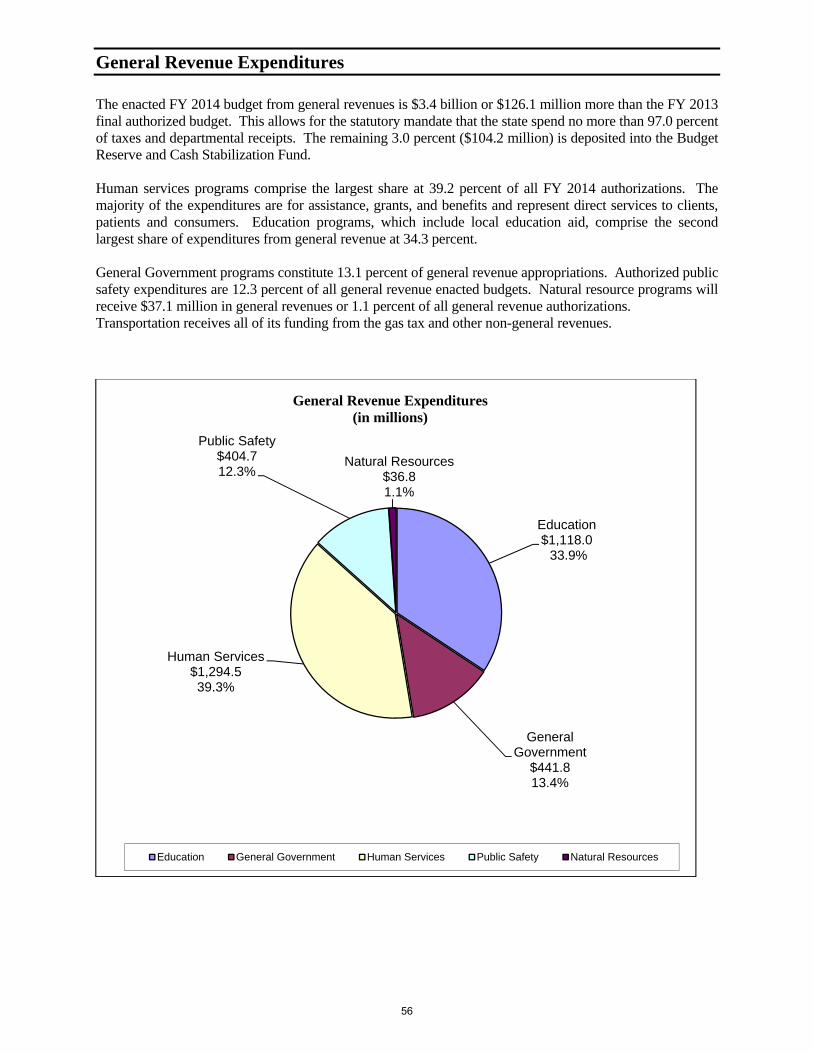
General Revenue Expenditures
The enacted FY 2014 budget from general revenues is $3.4 billion or $126.1 million more than the FY 2013 final authorized budget. This allows for the statutory mandate that the state spend no more than 97.0 percent of taxes and departmental receipts. The remaining 3.0 percent ($104.2 million) is deposited into the Budget Reserve and Cash Stabilization Fund. Human services programs comprise the largest share at 39.2 percent of all FY 2014 authorizations. The majority of the expenditures are for assistance, grants, and benefits and represent direct services to clients, patients and consumers. Education programs, which include local education aid, comprise the second largest share of expenditures from general revenue at 34.3 percent. General Government programs constitute 13.1 percent of general revenue appropriations. Authorized public safety expenditures are 12.3 percent of all general revenue enacted budgets. Natural resource programs will receive $37.1 million in general revenues or 1.1 percent of all general revenue authorizations. Transportation receives all of its funding from the gas tax and other non-general revenues.
Education $1,118.0
33.9%
General Government
$441.8 13.4%
Human Services $1,294.5 39.3%
Public Safety $404.7 12.3%
Natural Resources $36.8 1.1%
Education General Government Human Services Public Safety Natural Resources
General Revenue Expenditures(in millions)
56

Full Time Equivalent Positions
Full Time Equivalent Positions
The number of full time equivalent (FTE) positions authorized within the agency FTE caps in the FY 2014 final enacted budget is 15,118.3, an increase of 41.9 FTE positions from the FY 2013 final revised budget of 15,076.4. This net increase is made up of both increases and decreases in several agencies. The largest variances are in the Public Safety function, where there is an increase of 44.0 FTE positions
from the FY 2013 final revised budget, including a 36.0 FTE position increase in the Department of Public Safety for the July 2013 State Trooper Academy training class, a 5.0 FTE increase in the Military Staff for Emergency Management, and a 3.0 FTE position increase in the Judiciary for the Veterans Court.
The next largest increase of 35.3 FTE positions is in the Human Services function. The Department of Human Services increases by 26.0 FTE positions for the Unified Health Infrastructure Program. The Executive Office of Health and Human Services increases by 15.0 FTE positions for administrative staff. These increases are partially offset by reductions in Children, Youth and Families (1.0), Health (3.9), and Behavioral Healthcare, Developmental Disabilities, and Hospitals (1.0), and a technical adjustment of 0.2 in the Office of the Child Advocate.
The largest decrease of 20.0 FTE positions is in the Education function, where the Higher Education increase of 10.0 FTE positions for additional faculty and staff in URI and RIC is offset by reductions in the Office of Higher Education (3.0), the Higher Education Assistance Authority (13.0) and the Public Telecommunication Authority (14.0). The reduction in FTE positions for the Public Telecommunication Authority is due to the end of state funding for the agency.
The next largest decrease of 17.4 FTE positions is in the General Government function. In the Department of Labor and Training, the reduction of 31.0 FTE positions (along with a 39.5 FTE position decrease in FY 2013) relates to the end of Unemployment Insurance Extended Benefits. The Department of Revenue increases by 3.0 FTE positions, including 2.0 tax investigators and 1.0 chief financial officer position in the Office of the Director. This is in addition to the 31.0 FTE positions added in FY 2013 in the Lottery Division to oversee table gaming operations at the Twin River casino. The General Treasurer FTE position cap increases by 1.0 legal counsel position in the retirement program. The Public Utilities Commission adds 1.0 consumer agent FTE in FY 2014 (in addition to 1.0 audit FTE in FY 2013), while the Department of Administration’s FTE cap increases by 8.6 FTE positions.
The final enacted FY 2014 FTE cap of 15,118.3 is 53.3 FTE positions less than the Governor’s recommended FTE cap of 15,171.6 positions. The General Assembly made the following changes to the Governor’s recommendation:
Reduced the Governor’s recommended increase in Administration by 7.0 FTE positions, including2.0 State Police and Motor Vehicle human resources coordinators, 3.0 information technology(RIFANS) positions, a deputy director of purchasing, and a capital projects manager.
Reduced the Governor’s recommended FTE position increases by 10.0 administrative staffpositions in the Executive Office of Health and Human Services.
Reduced the Governor’s recommended increase in the Department of Human Services by 15.5 FTEpositions, including eligibility technicians and social caseworker positions.
Adjusted by 0.2 the FTE position cap of the Office of the Child Advocate.
Reduced the Governor’s recommended FTE position increases by 4.0 FTE positions in the Office ofHigher Education.
Reduced the Governor’s recommended FTE level by 13.0 FTE positions in the Higher EducationAssistance Authority.
57

Full Time Equivalent Positions
Added 3.0 FTE positions in the Judiciary for the Veterans Court.
Reduced the Governor’s recommended FTE position increases by 6.0 FTE positions in theDepartment of Public Safety, including 2.0 information technology positions, 2.0 positions in theWorkers Comp unit, 1.0 paralegal, and 1.0 public information officer.
Reduced the Governor’s recommended FTE position increases by 1.0 senior reconciliation clerkposition in the Department of Environmental Management.
In the final FY 2013 revised budget, the number of full time equivalent positions is 15,076.4, an increase of 50.1 FTE positions from the FY 2013 original enacted budget of 15,026.3. The authorized FTE position level in the FY 2013 revised budget includes increases of 31.0 in Revenue, 41.2 in Behavioral Healthcare, Developmental Disabilities, and Hospitals, 24.9 in Administration. and 6.0 in Children, Youth and Families. These increases are partially offset by reductions in Labor and Training (39.5), Human Services (7.6), and Environmental Management (8.0). The final revised budget includes is a 26.1 FTE position reduction from the Governor’s recommended supplemental budget of 15,102.5 positions. Changes include 11.6 FTE positions less in Administration, 1.0 FTE position less in the Business Regulation, and 13.5 FTE position less in Human Services.
Full Time Equivalent Positions
.
0
2,000
4,000
6,000
8,000
10,000
12,000
14,000
16,000
18,000
20,000
1994 1996 1998 2000 2002 2004 2006 2008 2010 2012 2014
FTE Exempt
58

Schedules


General Revenues as Enacted
FY 2011 FY 2012 FY 2013 FY 2013 FY 2014
Actual Actual Enacted a Final Enacted Enacted
Personal Income Tax 1,021,338,869$ 1,060,481,684$ 1,080,856,603$ 1,075,300,000$ 1,109,154,500$
General Business TaxesBusiness Corporations 84,510,308 123,054,377 133,251,413 137,000,000 141,300,000 Public Utilities Gross Earnings 103,743,912 100,631,477 100,100,000 98,300,000 94,900,000 Financial Institutions 2,459,474 3,557,938 1,700,000 12,800,000 4,300,000 Insurance Companies 60,590,000 89,487,511 89,825,327 93,600,000 98,815,832 Bank Deposits 1,967,288 2,000,645 2,100,000 2,500,000 2,500,000 Health Care Provider Assessment 40,760,872 41,922,464 42,206,533 41,400,000 42,610,544
Sales and Use TaxesSales and Use 813,007,301 851,055,730 886,720,059 872,500,000 887,201,672 Motor Vehicle 47,654,534 48,391,564 47,758,650 51,100,000 51,800,000 Motor Fuel 1,054,939 732,672 1,100,000 800,000 1,000,000 Cigarettes 134,060,439 131,085,912 138,053,896 131,800,000 130,700,000 Alcohol 11,683,059 11,873,646 12,200,000 12,000,000 18,173,328
Other TaxesInheritance and Gift 46,855,153 46,411,738 35,148,959 30,200,000 31,800,000 Racing and Athletics 1,325,193 1,327,003 1,200,000 1,200,000 1,200,000 Realty Transfer 6,370,632 6,434,665 5,900,000 7,100,000 7,500,000
Total Taxes 2,377,381,973$ 2,518,449,026$ 2,578,121,440$ 2,567,600,000$ 2,622,955,876$
Departmental Receipts 332,714,668$ 339,895,284 342,873,883$ 363,400,000$ 348,707,542$
Taxes and Departmentals 2,710,096,641$ 2,858,344,310$ 2,920,995,323$ 2,931,000,000$ 2,971,663,418$
Other SourcesGas Tax Transfer -$ -$ -$ -$ -$ Other Miscellaneous 11,116,047 20,110,214 4,440,000 5,665,000 5,545,000 Lottery 354,860,987 377,706,394 387,553,420 380,160,000 394,100,000 Unclaimed Property 7,640,462 14,555,573 7,900,000 7,000,000 9,700,000
Other Sources 373,617,496$ 412,372,181$ 399,893,420$ 392,825,000$ 409,345,000$
Total General Revenues 3,083,714,137$ 3,270,716,491$ 3,320,888,743$ 3,323,825,000$ 3,381,008,418$
a Omits $163,409 in additional revenue from various legislative changes which became law after the Budget was enacted.
59

FY 2013 General Revenue Changes to Enacted
Original Enacted Revenues
November 2012 REC
Governor Recommended May 2013 REC
Total Enacted Revenue
Enhancements Final Enacted
Revenues
June 2012 November 2012 January 2013 May 2013 June 2013 June 2013
Personal Income Tax 1,080,856,603$ 1,078,600,000$ 1,078,600,000$ 1,075,300,000$ -$ 1,075,300,000$
General Business TaxesBusiness Corporations 133,251,413 135,900,000 135,900,000 137,000,000 - 137,000,000 Public Utilities Gross Earnings 100,100,000 104,000,000 104,000,000 98,300,000 - 98,300,000 Financial Institutions 1,700,000 8,200,000 8,200,000 12,800,000 - 12,800,000 Insurance Companies 89,825,327 91,900,000 91,900,000 93,600,000 - 93,600,000 Bank Deposits 2,100,000 2,100,000 2,100,000 2,500,000 - 2,500,000 Health Care Provider Assessment 42,206,533 42,300,000 42,300,000 41,400,000 - 41,400,000
Sales and Use TaxesSales and Use 886,720,059 879,400,000 879,400,000 872,500,000 - 872,500,000 Motor Vehicle 47,758,650 48,700,000 48,700,000 51,100,000 - 51,100,000 Motor Fuel 1,100,000 1,000,000 1,000,000 800,000 - 800,000 Cigarettes 138,053,896 137,700,000 137,700,000 131,800,000 - 131,800,000 Alcohol 12,200,000 12,000,000 12,000,000 12,000,000 - 12,000,000
Other TaxesInheritance and Gift 35,148,959 33,800,000 33,800,000 30,200,000 - 30,200,000 Racing and Athletics 1,200,000 1,200,000 1,200,000 1,200,000 - 1,200,000 Realty Transfer 5,900,000 6,500,000 6,500,000 7,100,000 - 7,100,000
Total Taxes 2,578,121,440$ 2,583,300,000$ 2,583,300,000$ 2,567,600,000$ -$ 2,567,600,000$
Departmental Receipts 342,873,883$ 347,500,000$ 351,935,000$ 363,100,000$ 300,000$ 363,400,000$
Taxes and Departmentals 2,920,995,323$ 2,930,800,000$ 2,935,235,000$ 2,930,700,000$ 300,000$ 2,931,000,000$
Other SourcesGas Tax Transfer -$ -$ -$ -$ -$ -$ Other Miscellaneous 4,440,000 4,615,000 4,615,000 5,665,000 - 5,665,000 Lottery 387,553,420 386,700,000 385,100,000 380,160,000 - 380,160,000 Unclaimed Property 7,900,000 6,300,000 6,300,000 7,000,000 - 7,000,000
Other Sources 399,893,420$ 397,615,000$ 396,015,000$ 392,825,000$ -$ 392,825,000$
Total General Revenues 3,320,888,743$ 3,328,415,000$ 3,331,250,000$ 3,323,525,000$ 300,000$ 3,323,825,000$
60

FY 2014 General Revenue Changes to Estimated
Initial Estimated Revenues
Governor Recommended May 2013 REC
Enacted Revenue Enhancements Original Enacted
November 2012 January 2013 May 2013 June 2013 June 2013
Personal Income Tax 1,129,000,000$ 1,130,750,000$ 1,107,800,000$ 1,354,500$ 1,109,154,500$
General Business TaxesBusiness Corporations 140,400,000 135,120,004 141,300,000 - 141,300,000 Public Utilities Gross Earnings 102,400,000 102,400,000 94,900,000 - 94,900,000 Financial Institutions 3,100,000 3,100,000 4,300,000 - 4,300,000 Insurance Companies 97,000,000 96,822,068 98,000,000 815,832 98,815,832 Bank Deposits 2,200,000 2,200,000 2,500,000 - 2,500,000 Health Care Provider Assessment 43,500,000 43,069,721 43,000,000 (389,456) 42,610,544
Sales and Use TaxesSales and Use 904,100,000 904,300,000 895,000,000 (7,798,328) 887,201,672 Motor Vehicle 48,700,000 48,700,000 51,800,000 - 51,800,000 Motor Fuel 1,000,000 1,000,000 1,000,000 - 1,000,000 Cigarettes 137,400,000 137,400,000 130,700,000 - 130,700,000 Alcohol 12,200,000 12,200,000 12,200,000 5,973,328 18,173,328
Other TaxesInheritance and Gift 35,400,000 35,400,000 31,800,000 - 31,800,000 Racing and Athletics 1,100,000 1,100,000 1,200,000 - 1,200,000 Realty Transfer 6,700,000 6,700,000 7,500,000 - 7,500,000
Total Taxes 2,664,200,000$ 2,660,261,793$ 2,623,000,000$ (44,124)$ 2,622,955,876$
Departmental Receipts 206,800,000 353,292,687$ 206,600,000$ 142,107,542$ 348,707,542$
Taxes and Departmentals 2,871,000,000$ 3,013,554,480$ 2,829,600,000$ 142,063,418$ 2,971,663,418$
Other SourcesGas Tax Transfer -$ -$ -$ - - Other Miscellaneous 2,430,000 2,430,000 2,545,000 3,000,000 5,545,000 Lottery 405,100,000 400,800,000 395,100,000 (1,000,000) 394,100,000 Unclaimed Property 9,600,000 9,600,000 9,700,000 - 9,700,000
Other Sources 417,130,000$ 412,830,000$ 407,345,000$ 2,000,000$ 409,345,000$
Total General Revenues 3,288,130,000$ 3,426,384,480$ 3,236,945,000$ 144,063,418$ 3,381,008,418$
61
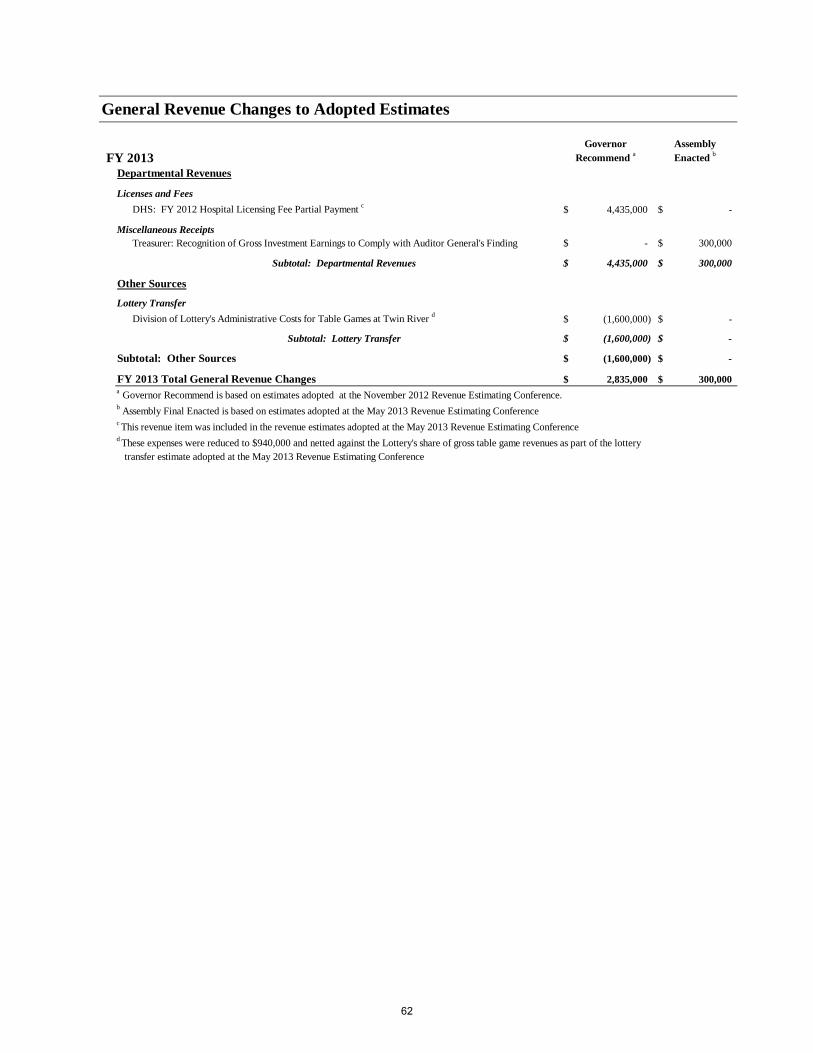
General Revenue Changes to Adopted Estimates
FY 2013Governor
Recommend aAssembly Enacted b
Departmental Revenues
Licenses and Fees
DHS: FY 2012 Hospital Licensing Fee Partial Payment c 4,435,000$ -$
Miscellaneous ReceiptsTreasurer: Recognition of Gross Investment Earnings to Comply with Auditor General's Finding -$ 300,000$
Subtotal: Departmental Revenues 4,435,000$ 300,000$
Other Sources
Lottery Transfer
Division of Lottery's Administrative Costs for Table Games at Twin River d (1,600,000)$ -$
Subtotal: Lottery Transfer (1,600,000)$ -$
Subtotal: Other Sources (1,600,000)$ -$
FY 2013 Total General Revenue Changes 2,835,000$ 300,000$ a Governor Recommend is based on estimates adopted at the November 2012 Revenue Estimating Conference.b Assembly Final Enacted is based on estimates adopted at the May 2013 Revenue Estimating Conferencec This revenue item was included in the revenue estimates adopted at the May 2013 Revenue Estimating Conferenced These expenses were reduced to $940,000 and netted against the Lottery's share of gross table game revenues as part of the lottery transfer estimate adopted at the May 2013 Revenue Estimating Conference
62

General Revenue Changes to Adopted Estimates
FY 2014Governor
Recommend aAssembly Enacted b
Taxes
Personal Income TaxRefunds: Creation of Special Investigation Tax Unit 1,000,000$ 1,000,000$ Finals: Out of State Collection Agencies 750,000 750,000 Finals: Increase Cap on Contributions to Scholarship Organizations Tax Credit - (395,500)
Finals: Conform to Internal Revenue Code on Section 179 Expensing and Bonus Depreciation Rules c n/a n/a
Finals: Disallow Federal Domestic Production Activities Deduction c n/a n/a
Subtotal: Personal Income Tax 1,750,000$ 1,354,500$
General Business TaxesBusiness Corporations Tax
Reduce Business Corporations Tax Rate to 8.00% effective January 1, 2014 (8,038,007)$ -$ Decrease of 25.0% in value of Job Development Act Rate Reduction effective Jan 1, 2014 2,448,632 - Elimination of Enterprise Zone Wage Credit effective January 1, 2014 309,380 -
Conform to Internal Revenue Code on Section 179 Expensing and Bonus Depreciation Rules c n/a n/a
Disallow Federal Domestic Production Activities Deduction c n/a n/a
Subtotal: Business Corporations Tax (5,279,996)$ -$
Insurance Companies Gross Premiums TaxHealth/HMO: Managed Care Rate Reduction (177,932)$ (179,668)$ Property, Casualty, and Life: Increase Cap on Contributions to Scholarship Organizations Tax Credit - (104,500) Health/HMO: Affordable Care Act Medicaid Expansion - 1,100,000
Subtotal: Insurance Companies Gross Premiums Tax (177,932)$ 815,832$
Health Care Provider Assessment - Nursing HomesSuspend Nursing Home COLA effective October 1, 2012 (430,279)$ (389,456)$
Subtotal: Health Care Provider Assessment (430,279)$ (389,456)$
Subtotal: General Business Taxes (5,888,207)$ 426,376$
Sales and Excise Taxes Sales and Use Tax
Creation of Special Investigation Tax Unit 200,000$ 200,000$ Repeal Tax on Sales of Wine and Spirits by Class A Licensees, eff Dec 1, 2013 thru Mar 31, 2015 - (7,173,328) Add Statewide Exemption for Unique Work(s) of Art incl Print and Photograph eff Dec 1, 2013 - (825,000)
Subtotal: Sales and Use Tax 200,000$ (7,798,328)$
Alcohol Tax Increase Tax on Beer and Malt to from $3.00 per 31 Gallons (Barrel) to $3.30 per 31 Gallons -$ 390,868$ Increase Tax on Still Wine from $0.60 per Gallon to $1.40 per Gallon - 2,699,976 Increase Tax on High Proof Distilled Spirits from $3.75 per Gallon to $5.40 per Gallon - 2,882,484
Subtotal: Alcohol Tax -$ 5,973,328$
Subtotal: Sales and Excise Taxes 200,000$ (1,825,000)$
Other TaxesInheritance and Gift Tax
Farmland Included in Estate Valued at Use Not Full and Fair Cash Value d -$ n/a
Subtotal: Other Taxes -$ n/a
Subtotal: All Taxes (3,938,207)$ (44,124)$
63
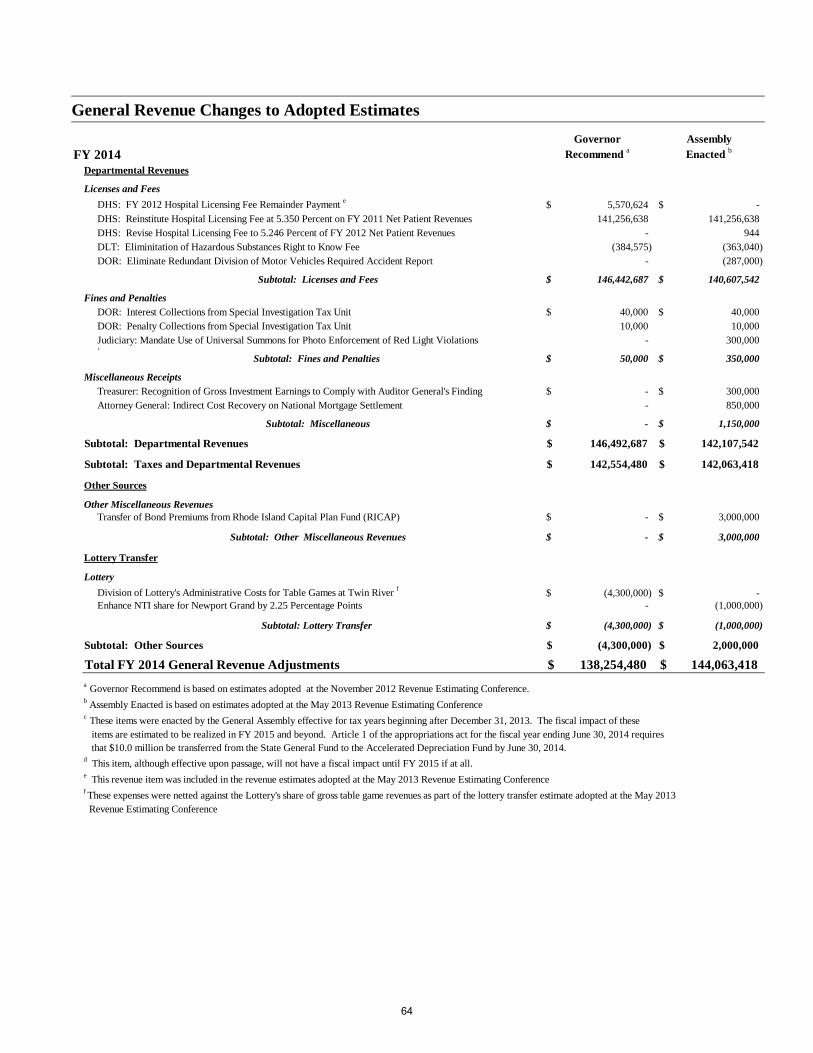
General Revenue Changes to Adopted Estimates
FY 2014Governor
Recommend aAssembly Enacted b
Departmental Revenues
Licenses and Fees
DHS: FY 2012 Hospital Licensing Fee Remainder Payment e 5,570,624$ -$ DHS: Reinstitute Hospital Licensing Fee at 5.350 Percent on FY 2011 Net Patient Revenues 141,256,638 141,256,638 DHS: Revise Hospital Licensing Fee to 5.246 Percent of FY 2012 Net Patient Revenues - 944 DLT: Eliminitation of Hazardous Substances Right to Know Fee (384,575) (363,040) DOR: Eliminate Redundant Division of Motor Vehicles Required Accident Report - (287,000)
Subtotal: Licenses and Fees 146,442,687$ 140,607,542$
Fines and PenaltiesDOR: Interest Collections from Special Investigation Tax Unit 40,000$ 40,000$ DOR: Penalty Collections from Special Investigation Tax Unit 10,000 10,000 Judiciary: Mandate Use of Universal Summons for Photo Enforcement of Red Light Violations - 300,000 .
Subtotal: Fines and Penalties 50,000$ 350,000$
Miscellaneous ReceiptsTreasurer: Recognition of Gross Investment Earnings to Comply with Auditor General's Finding -$ 300,000$ Attorney General: Indirect Cost Recovery on National Mortgage Settlement - 850,000
Subtotal: Miscellaneous -$ 1,150,000$
Subtotal: Departmental Revenues 146,492,687$ 142,107,542$
Subtotal: Taxes and Departmental Revenues 142,554,480$ 142,063,418$
Other Sources
Other Miscellaneous RevenuesTransfer of Bond Premiums from Rhode Island Capital Plan Fund (RICAP) -$ 3,000,000$
Subtotal: Other Miscellaneous Revenues -$ 3,000,000$
Lottery Transfer
Lottery
Division of Lottery's Administrative Costs for Table Games at Twin River f (4,300,000)$ -$ Enhance NTI share for Newport Grand by 2.25 Percentage Points - (1,000,000)
Subtotal: Lottery Transfer (4,300,000)$ (1,000,000)$
Subtotal: Other Sources (4,300,000)$ 2,000,000$
Total FY 2014 General Revenue Adjustments 138,254,480$ 144,063,418$ a Governor Recommend is based on estimates adopted at the November 2012 Revenue Estimating Conference.b Assembly Enacted is based on estimates adopted at the May 2013 Revenue Estimating Conferencec These items were enacted by the General Assembly effective for tax years beginning after December 31, 2013. The fiscal impact of these items are estimated to be realized in FY 2015 and beyond. Article 1 of the appropriations act for the fiscal year ending June 30, 2014 requires that $10.0 million be transferred from the State General Fund to the Accelerated Depreciation Fund by June 30, 2014.d This item, although effective upon passage, will not have a fiscal impact until FY 2015 if at all.e This revenue item was included in the revenue estimates adopted at the May 2013 Revenue Estimating Conferencef These expenses were netted against the Lottery's share of gross table game revenues as part of the lottery transfer estimate adopted at the May 2013 Revenue Estimating Conference
64
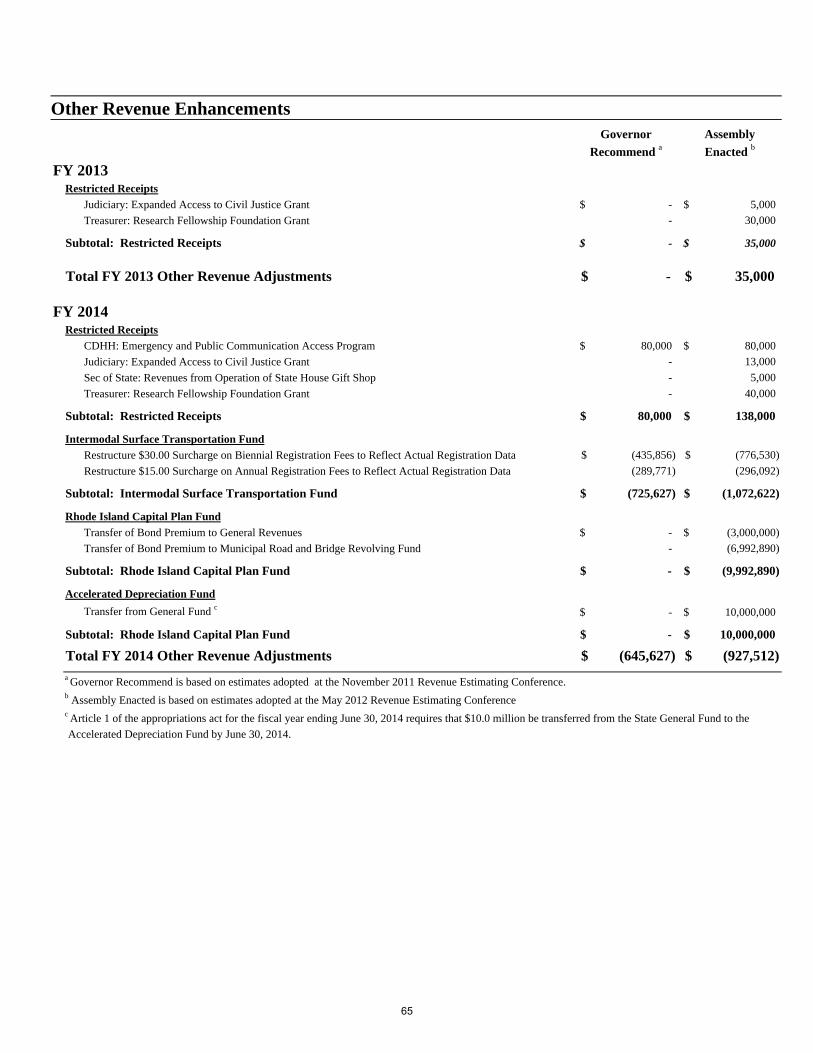
Other Revenue EnhancementsGovernor
Recommend aAssembly
Enacted b
FY 2013Restricted Receipts
Judiciary: Expanded Access to Civil Justice Grant -$ 5,000$
Treasurer: Research Fellowship Foundation Grant - 30,000
Subtotal: Restricted Receipts -$ 35,000$
Total FY 2013 Other Revenue Adjustments -$ 35,000$
FY 2014Restricted Receipts
CDHH: Emergency and Public Communication Access Program 80,000$ 80,000$
Judiciary: Expanded Access to Civil Justice Grant - 13,000
Sec of State: Revenues from Operation of State House Gift Shop - 5,000
Treasurer: Research Fellowship Foundation Grant - 40,000
Subtotal: Restricted Receipts 80,000$ 138,000$
Intermodal Surface Transportation Fund
Restructure $30.00 Surcharge on Biennial Registration Fees to Reflect Actual Registration Data (435,856)$ (776,530)$
Restructure $15.00 Surcharge on Annual Registration Fees to Reflect Actual Registration Data (289,771) (296,092)
Subtotal: Intermodal Surface Transportation Fund (725,627)$ (1,072,622)$
Rhode Island Capital Plan Fund
Transfer of Bond Premium to General Revenues -$ (3,000,000)$
Transfer of Bond Premium to Municipal Road and Bridge Revolving Fund - (6,992,890)
Subtotal: Rhode Island Capital Plan Fund -$ (9,992,890)$
Accelerated Depreciation Fund
Transfer from General Fund c -$ 10,000,000$
Subtotal: Rhode Island Capital Plan Fund -$ 10,000,000$
Total FY 2014 Other Revenue Adjustments (645,627)$ (927,512)$ a Governor Recommend is based on estimates adopted at the November 2011 Revenue Estimating Conference.b Assembly Enacted is based on estimates adopted at the May 2012 Revenue Estimating Conferencec Article 1 of the appropriations act for the fiscal year ending June 30, 2014 requires that $10.0 million be transferred from the State General Fund to the
Accelerated Depreciation Fund by June 30, 2014.
65

Expenditures from All Funds
FY 2011 Actuals FY 2012 Actuals FY 2013 Enacted FY 2013 Final
Revised FY 2014 Enacted
General Government
Administration (3 & 4) $466,350,825 $390,215,975 $389,897,691 $412,981,480 $428,701,337
Business Regulation 9,861,335 12,591,226 $13,977,309 $17,887,800 $12,989,880
Labor and Training 912,521,587 801,847,663 $661,604,139 $723,610,771 $592,481,112
Revenue 268,488,387 345,151,113 $333,502,288 $340,617,136 $353,439,739
Legislature 34,703,108 35,327,139 $38,844,218 $41,913,816 $37,791,548
Lieutenant Governor 890,413 1,068,715 $1,092,692 $1,738,416 $2,095,378
Secretary of State 6,995,441 6,742,224 $7,418,107 $7,317,488 $6,952,764
General Treasurer 28,031,616 39,706,807 $37,571,560 $45,718,506 $35,407,461
Board of Elections 3,400,118 1,660,728 $1,952,116 $1,886,823 $1,739,361
Rhode Island Ethics Commission 1,419,805 1,410,813 $1,557,881 $1,530,853 $1,577,204
Governor's Office 4,701,867 4,648,355 $26,581,535 $4,325,010 $4,443,513
Commission for Human Rights 1,355,743 1,408,199 $1,463,760 $1,439,817 $1,459,423
Public Utilities Commission 6,088,904 6,335,868 $8,246,708 $8,489,940 $8,420,293
Subtotal - General Government $1,744,809,149 $1,648,114,825 $1,523,710,004 $1,609,457,856 $1,487,499,013
Human Services
Office of Health & Human Services (1) 6,284,050 17,098,684 $1,752,372,084 $1,680,440,795 $1,867,935,132
Children, Youth, and Families 235,882,905 216,588,816 $216,622,996 $214,110,548 $213,873,566
Health 119,439,071 104,085,326 $119,522,083 $126,742,680 $120,980,759
Human Services (2) 2,198,054,450 2,206,209,397 $650,256,012 $662,291,578 $662,090,161
Behavioral Healthcare, Developmental Disabilities and Hospitals 450,952,134 428,033,267 $445,671,144 $429,040,289 $437,848,408
Governor's Commission on Disabilities 514,758 597,971 $751,439 $599,003 $1,455,336
Commission On Deaf and Hard of Hearing 358,036 377,005 $390,251 $381,701 $471,609
Office of the Child Advocate 597,596 558,884 $657,572 $636,732 $648,648
Office of the Mental Health Advocate 399,837 387,894 $447,119 $323,307 $486,144
Subtotal - Human Services $3,012,482,837 $2,973,937,244 $3,186,690,700 $3,114,566,633 $3,305,789,763
Education
Elementary and Secondary 1,128,629,694 1,122,700,087 $1,198,219,358 $1,205,460,794 $1,225,973,266
Higher Education - Board of Governors 953,160,729 1,009,942,858 $1,031,676,319 $1,036,013,963 $1,057,498,950
RI Council on the Arts 3,454,128 2,760,123 $3,408,107 $3,907,496 $2,765,495
RI Atomic Energy Commission 1,198,881 1,282,491 $1,476,951 $1,402,436 $1,436,731
Higher Education Assistance Authority 23,672,445 24,036,466 $27,722,149 $28,223,979 $26,763,735
Historical Preservation and Heritage Comm. 2,183,534 1,908,488 $2,728,977 $2,450,493 $3,506,949
Public Telecommunications Authority 1,525,009 1,557,832 $1,500,972 $799,077 $0
Subtotal - Education $2,113,824,420 $2,164,188,345 $2,266,732,833 $2,278,258,238 $2,317,945,126
66

Expenditures from All Funds
FY 2011 Actuals FY 2012 Actuals FY 2013 Enacted FY 2013 Final
Revised FY 2014 Enacted
Public Safety
Attorney General 23,618,629 24,597,318 $30,009,938 $29,151,427 $30,400,101
Corrections 183,456,477 189,703,152 $196,749,862 $197,868,409 $204,702,527
Judicial 97,166,263 100,907,796 $104,248,298 $106,251,433 $107,624,121
Military Staff 36,424,255 36,046,730 $42,450,127 $66,012,642 $43,157,514
Public Safety (3) 88,811,483 102,975,645 $122,500,068 $120,142,885 $123,477,749
Office Of Public Defender 9,990,894 10,560,860 $11,213,124 $10,749,410 $11,326,682
Subtotal - Public Safety $439,468,001 $464,791,501 $507,171,417 $530,176,206 $520,688,694
Natural Resources
Environmental Management 66,346,606 74,010,170 $98,837,511 $97,596,949 $116,179,523
Coastal Resources Management Council 5,724,792 6,100,775 $5,092,818 $5,694,945 $4,709,906
Water Resources Board (4) 1,335,871 0 $0 $0 $0
Subtotal - Natural Resources $73,407,269 $80,110,945 $103,930,329 $103,291,894 $120,889,429
Transportation
Transportation 345,215,545 387,375,260 $511,621,101 $465,845,728 $460,249,997
Subtotal - Transportation $345,215,545 $387,375,260 $511,621,101 $465,845,728 $460,249,997
Total $7,729,207,221 $7,718,518,120 $8,099,856,384 $8,101,596,555 $8,213,062,022
(1) In FY 2013, the Medicaid program is moved from the Department of Human Services to the Office of Health and Human Services.
(2) In FY 2012, the Department of Elderly Affairs was merged into the Department of Human Services as its own program.
(3) In FY 2012, the Sheriffs program was moved from the Department of Administration to the Department of Public Safety.
(4) In FY 2012, the Water Resources Board was merged into the Statewide Planning program in the Department of Administration.
67

Expenditures from General Revenues
FY 2011 Actuals FY 2012 Actuals FY 2013 Enacted FY 2013 Final
Revised FY 2014 Enacted
General Government
Administration (3 & 4) $331,624,887 $248,320,234 $272,514,956 $265,410,090 $264,801,211
Business Regulation 8,128,770 8,394,345 $9,362,048 $8,925,512 $9,245,878
Labor and Training 6,902,868 7,553,602 $7,859,170 $7,728,901 $9,064,061
Revenue 35,111,465 95,686,157 $95,342,244 $96,482,436 $102,007,495
Legislature 33,127,794 33,685,084 $37,217,044 $40,388,233 $36,186,933
Lieutenant Governor 890,413 948,391 $962,955 $945,311 $986,890
Secretary of State 6,564,248 6,262,148 $6,913,038 $6,833,325 $6,497,833
General Treasurer 2,240,286 2,531,859 $2,542,115 $2,826,501 $2,654,692
Board of Elections 3,290,424 1,610,728 $1,952,116 $1,886,823 $1,739,361
Rhode Island Ethics Commission 1,419,805 1,410,813 $1,557,881 $1,530,853 $1,577,204
Governor's Office 4,102,488 4,081,232 $4,418,290 $4,325,010 $4,443,513
Commission for Human Rights 1,214,438 1,093,206 $1,137,768 $1,133,129 $1,150,785
Public Utilities Commission - - - - -
Subtotal - General Government $434,617,886 $411,577,799 $441,779,625 $438,416,124 $440,355,856
Human Services
Office of Health & Human Services (1) 3,314,257 9,694,301 $825,065,703 $778,931,286 $843,227,650
Children, Youth, and Families 156,123,293 154,375,838 $152,586,452 $151,871,086 $152,976,991
Health 27,469,636 23,518,929 $24,821,836 $24,446,722 $24,308,001
Human Services (2) 735,671,107 844,385,003 $97,023,967 $95,668,119 $93,479,195 Behaviroal Healthcare, Developmental Disabilities and Hospitals 172,743,967 190,883,740 $193,137,995 $193,234,700 $202,091,382
Governor's Commission on Disabilities 352,190 381,164 $371,096 $324,421 $357,711
Commission On Deaf and Hard of Hearing 358,036 377,005 $390,251 $381,701 $391,609
Office of the Child Advocate 550,911 512,165 $611,469 $590,664 $608,651
Office of the Mental Health Advocate 399,837 387,894 $447,119 $323,307 $486,144
Subtotal - Human Services $1,096,983,234 $1,224,516,039 $1,294,455,888 $1,245,772,006 $1,317,927,334
Education
Elementary and Secondary 846,144,631 860,936,950 $935,364,061 $928,916,698 $964,706,909
Higher Education - Board of Governors 163,941,500 165,658,691 $172,456,170 $172,696,230 $180,013,795
RI Council on the Arts 1,681,095 1,656,365 $1,565,813 $1,565,813 $1,335,630
RI Atomic Energy Commission 858,629 875,412 $876,213 $841,750 $861,710
Higher Education Assistance Authority 7,320,186 5,911,331 $5,617,064 $5,693,667 $4,281,726
Historical Preservation and Heritage Comm. 1,294,878 1,253,696 $1,361,801 $1,265,417 $1,357,510
Public Telecommunications Authority 929,325 928,421 $799,077 $799,077 $0
Subtotal - Education $1,022,170,244 $1,037,220,866 $1,118,040,199 $1,111,778,652 $1,152,557,280
68
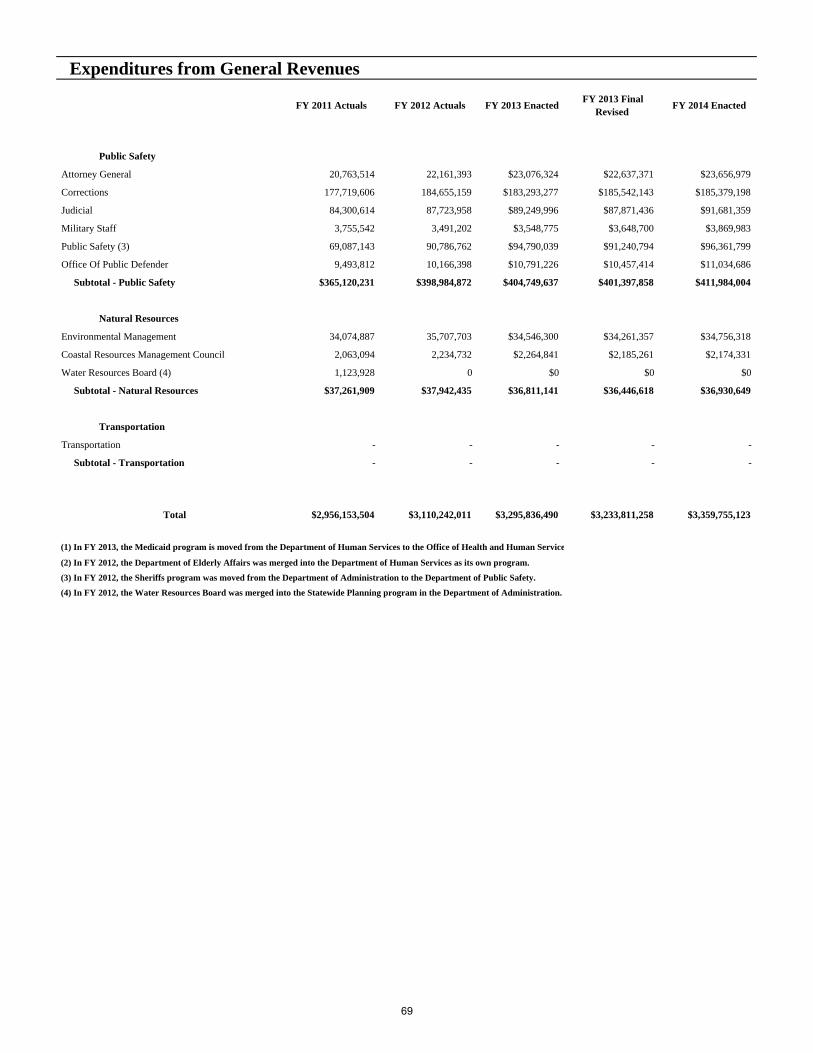
Expenditures from General Revenues
FY 2011 Actuals FY 2012 Actuals FY 2013 Enacted FY 2013 Final
Revised FY 2014 Enacted
Public Safety
Attorney General 20,763,514 22,161,393 $23,076,324 $22,637,371 $23,656,979
Corrections 177,719,606 184,655,159 $183,293,277 $185,542,143 $185,379,198
Judicial 84,300,614 87,723,958 $89,249,996 $87,871,436 $91,681,359
Military Staff 3,755,542 3,491,202 $3,548,775 $3,648,700 $3,869,983
Public Safety (3) 69,087,143 90,786,762 $94,790,039 $91,240,794 $96,361,799
Office Of Public Defender 9,493,812 10,166,398 $10,791,226 $10,457,414 $11,034,686
Subtotal - Public Safety $365,120,231 $398,984,872 $404,749,637 $401,397,858 $411,984,004
Natural Resources
Environmental Management 34,074,887 35,707,703 $34,546,300 $34,261,357 $34,756,318
Coastal Resources Management Council 2,063,094 2,234,732 $2,264,841 $2,185,261 $2,174,331
Water Resources Board (4) 1,123,928 0 $0 $0 $0
Subtotal - Natural Resources $37,261,909 $37,942,435 $36,811,141 $36,446,618 $36,930,649
Transportation
Transportation - - - - -
Subtotal - Transportation - - - - -
Total $2,956,153,504 $3,110,242,011 $3,295,836,490 $3,233,811,258 $3,359,755,123
(1) In FY 2013, the Medicaid program is moved from the Department of Human Services to the Office of Health and Human Service
(2) In FY 2012, the Department of Elderly Affairs was merged into the Department of Human Services as its own program.
(3) In FY 2012, the Sheriffs program was moved from the Department of Administration to the Department of Public Safety.
(4) In FY 2012, the Water Resources Board was merged into the Statewide Planning program in the Department of Administration.
69

Expenditures from Federal Funds
FY 2011 Actuals FY 2012 Actuals FY 2013 Enacted FY 2013 Final
Revised FY 2014 Enacted
General Government
Administration (3 & 4) $64,251,529 $64,385,784 $25,578,747 $63,667,321 $62,189,669
Business Regulation 465,176 2,726,596 $2,719,081 $7,002,215 $1,747,589
Labor and Training 234,108,321 205,099,595 $111,743,981 $166,276,062 $95,710,236
Revenue 1,139,852 1,472,179 $2,450,709 $2,897,330 $3,048,651
Legislature - - $0 $0 $0
Lieutenant Governor - 120,324 $129,737 $793,105 $1,108,488
Secretary of State 33,659 52,872 $0 $2,566 $0
General Treasurer 1,140,258 1,199,276 $1,159,712 $1,099,497 $1,130,422
Board of Elections 109,694 50,000 $0 $0 $0
Rhode Island Ethics Commission - - $0 $0 $0
Governor's Office 40,411 (1) $22,163,245 $0 $0
Commission for Human Rights 141,305 314,993 $325,992 $306,688 $308,638
Public Utilities Commission 266,641 307,914 $321,795 $348,421 $166,818
Subtotal - General Government $301,696,846 $275,729,532 $166,592,999 $242,393,205 $165,410,511
Human Services $0 $0 $0
Office of Health & Human Services (1) 2,367,877 6,506,943 $914,833,795 $888,267,679 $1,014,710,198
Children, Youth, and Families 76,711,604 59,251,759 $58,440,291 $57,005,897 $56,692,405
Health 69,303,495 55,441,392 $65,015,651 $70,657,028 $62,004,542
Human Services (2) 1,446,893,845 1,344,961,678 $539,731,758 $550,001,881 $554,368,102
Behaviroal Healthcare, Developmental Disabilities and Hospitals 267,384,605 225,892,158 $234,125,964 $223,826,063 $217,759,723
Governor's Commission on Disabilities 124,377 70,987 $120,649 $215,368 $129,989
Commission On Deaf and Hard of Hearing - - $0 $0 $0
Office of the Child Advocate 46,685 46,719 $46,103 $46,068 $39,997
Office of the Mental Health Advocate - - - $0 $0
Subtotal - Human Services $1,862,832,488 $1,692,171,636 $1,812,314,211 $1,790,019,984 $1,905,704,956
Education $0 $0 $0
Elementary and Secondary 259,873,651 234,690,933 $230,760,206 $238,106,081 $225,746,654
Higher Education - Board of Governors 10,274,936 23,218,046 $4,852,615 $5,226,649 $6,190,306
RI Council on the Arts 954,515 824,067 $998,794 $754,191 $797,329
RI Atomic Energy Commission 76,635 79,057 $267,616 $267,044 $267,044
Higher Education Assistance Authority 9,744,236 9,566,865 $13,346,283 $13,994,483 $13,274,020
Historical Preservation and Heritage Comm. 831,658 537,821 $836,139 $589,279 $609,949
Public Telecommunications Authority - - - $0 $0
Subtotal - Education $281,755,631 $268,916,789 $251,061,653 258,937,727 246,885,302
70

Expenditures from Federal Funds
FY 2011 Actuals FY 2012 Actuals FY 2013 Enacted FY 2013 Final
Revised FY 2014 Enacted
Public Safety $0 $0 $0
Attorney General 1,788,468 1,475,840 $1,483,604 $2,674,447 $1,619,532
Corrections 2,780,906 2,388,892 $1,995,588 $3,128,620 $1,788,688
Judicial 2,555,921 2,377,916 $2,682,107 $2,760,203 $2,624,248
Military Staff 32,256,773 31,350,783 $33,842,074 $55,878,959 $34,878,752
Public Safety (3) 9,267,352 7,573,445 6,940,151 $10,741,797 $6,155,535
Office Of Public Defender 497,082 394,462 421,898 $291,996 $291,996
Subtotal - Public Safety $49,146,502 $45,561,338 $47,365,422 $75,476,022 $47,358,751
Natural Resources $0 $0 $0
Environmental Management 19,885,602 22,171,087 34,997,551 $36,876,754 $38,391,731
Coastal Resources Management Council 3,501,698 3,054,725 1,677,977 $2,537,403 $2,160,593
Water Resources Board (4) - - - $0 $0
Subtotal - Natural Resources $23,387,300 $25,225,812 $36,675,528 $39,414,157 $40,552,324
Transportation
Transportation 229,999,857 291,517,766 362,340,586 $316,969,784 $311,761,586
Subtotal - Transportation $229,999,857 $291,517,766 $362,340,586 $316,969,784 $311,761,586
Total $2,748,818,624 $2,599,122,873 $2,676,350,399 $2,723,210,879 $2,717,673,430
(1) In FY 2013, the Medicaid program is moved from the Department of Human Services to the Office of Health and Human Servi
(2) In FY 2012, the Department of Elderly Affairs was merged into the Department of Human Services as its own program.
(3) In FY 2012, the Sheriffs program was moved from the Department of Administration to the Department of Public Safety.
(4) In FY 2012, the Water Resources Board was merged into the Statewide Planning program in the Department of Administration.
71

Expenditures from Restricted Receipts
FY 2011 Actuals FY 2012 Actuals FY 2013 Enacted FY 2013 Final
Revised FY 2014 Enacted
General Government
Administration (3 & 4) $14,219,372 $15,107,473 $16,286,426 $13,968,691 $15,912,808
Business Regulation 1,267,389 1,470,285 $1,896,180 $1,960,073 $1,996,413
Labor and Training 20,821,559 23,685,420 $36,292,695 $60,844,618 $43,125,719
Revenue 4,836,294 1,993,811 $1,845,255 $1,821,849 $1,821,886
Legislature 1,575,314 1,642,055 $1,627,174 $1,525,583 $1,604,615
Lieutenant Governor - - $0 $0 $0
Secretary of State 397,534 427,204 $505,069 $481,597 $454,931
General Treasurer 24,442,547 35,767,114 $33,618,221 $41,575,920 $31,393,424
Board of Elections - - $0 $0 $0
Rhode Island Ethics Commission - - $0 $0 $0
Governor's Office 558,968 567,124 $0 $0 $0
Commission for Human Rights - - $0 $0 $0
Public Utilities Commission 5,822,263 6,027,954 $7,924,913 $8,141,519 $8,253,475
Subtotal - General Government $73,941,240 $86,688,440 $99,995,933 $130,319,850 $104,563,271
Human Services $0 $0 $0
Office of Health & Human Services (1) 601,916 897,440 $12,472,586 $13,241,830 $9,997,284
Children, Youth, and Families 2,426,338 2,682,360 $2,825,253 $2,538,664 $2,614,170
Health 22,658,203 25,113,233 $29,512,596 $31,512,619 $34,632,906
Human Services (2) 10,590,911 12,585,836 $9,111,103 $12,057,553 $9,762,500
Behaviroal Healthcare, Developmental Disabilities and Hospitals 6,941,943 6,973,731 $7,188,834 $7,177,366 $7,396,872
Governor's Commission on Disabilities 5,191 7,442 $9,694 $9,214 $10,365
Commission On Deaf and Hard of Hearing - - $0 $0 $80,000
Office of the Child Advocate - - $0 $0 $0
Office of the Mental Health Advocate - - - $0 $0
Subtotal - Human Services $43,224,502 $48,260,042 $61,120,066 $66,537,246 $64,494,097
Education $0 $0 $0
Elementary and Secondary 19,581,873 23,014,366 $25,643,868 $26,634,021 $27,658,516
Higher Education - Board of Governors 660,509 739,741 $702,583 $702,583 $702,583
RI Council on the Arts - - $0 $0 $0
RI Atomic Energy Commission - - $0 $0 $0
Higher Education Assistance Authority - - $0 $0 $0
Historical Preservation and Heritage Comm. 56,998 41,971 $456,037 $454,191 $454,491
Public Telecommunications Authority - - - $0 $0
Subtotal - Education $20,299,380 $23,796,078 $26,802,488 $27,790,795 $28,815,590
72

Expenditures from Restricted Receipts
FY 2011 Actuals FY 2012 Actuals FY 2013 Enacted FY 2013 Final
Revised FY 2014 Enacted
Public Safety $0 $0 $0
Attorney General 791,992 837,372 $5,162,510 $3,239,609 $5,073,590
Corrections 12,347 92,770 $61,397 $73,362 $64,890
Judicial 9,480,024 9,731,044 $10,641,195 $11,245,237 $11,803,514
Military Staff 189,042 205,899 $481,278 $736,890 $1,000,779
Public Safety (3) 209,090 416,630 12,687,548 $12,752,856 $12,753,188
Office Of Public Defender - - - $0 $0
Subtotal - Public Safety $10,682,495 $11,283,715 $29,033,928 $28,047,954 $30,695,961
Natural Resources $0 $0 $0
Environmental Management 10,389,053 11,406,708 14,309,942 $15,360,459 $18,081,515
Coastal Resources Management Council 160,000 145,000 250,000 $250,000 $374,982
Water Resources Board (4) - - - - $0
Subtotal - Natural Resources $10,549,053 $11,551,708 $14,559,942 $15,610,459 $18,456,497
Transportation
Transportation 187,949 2,518,104 998,758 $1,010,255 $8,010,496
Subtotal - Transportation $187,949 $2,518,104 $998,758 $1,010,255 $8,010,496
Total $158,884,619 $184,098,087 $232,511,115 $269,316,559 $255,035,912
(1) In FY 2013, the Medicaid program is moved from the Department of Human Services to the Office of Health and Human Services.
(2) In FY 2012, the Department of Elderly Affairs was merged into the Department of Human Services as its own program.
(3) In FY 2012, the Sheriffs program was moved from the Department of Administration to the Department of Public Safety.
(4) In FY 2012, the Water Resources Board was merged into the Statewide Planning program in the Department of Administration.
73
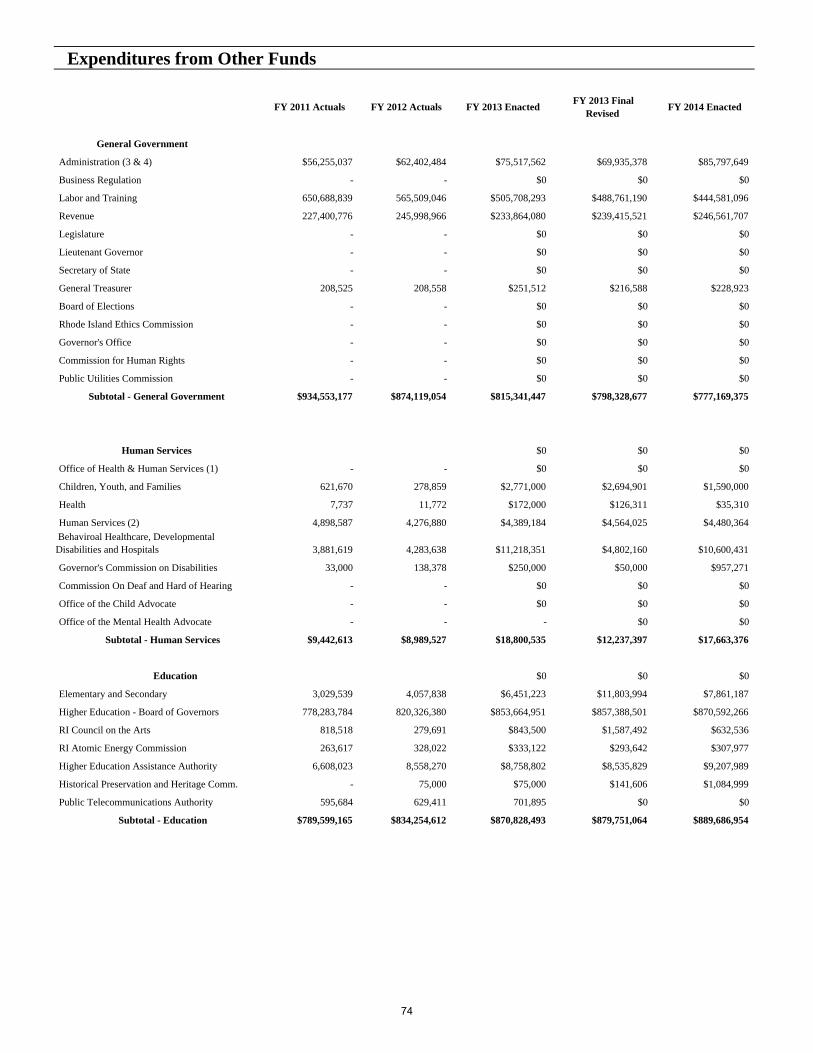
Expenditures from Other Funds
FY 2011 Actuals FY 2012 Actuals FY 2013 Enacted FY 2013 Final
Revised FY 2014 Enacted
General Government
Administration (3 & 4) $56,255,037 $62,402,484 $75,517,562 $69,935,378 $85,797,649
Business Regulation - - $0 $0 $0
Labor and Training 650,688,839 565,509,046 $505,708,293 $488,761,190 $444,581,096
Revenue 227,400,776 245,998,966 $233,864,080 $239,415,521 $246,561,707
Legislature - - $0 $0 $0
Lieutenant Governor - - $0 $0 $0
Secretary of State - - $0 $0 $0
General Treasurer 208,525 208,558 $251,512 $216,588 $228,923
Board of Elections - - $0 $0 $0
Rhode Island Ethics Commission - - $0 $0 $0
Governor's Office - - $0 $0 $0
Commission for Human Rights - - $0 $0 $0
Public Utilities Commission - - $0 $0 $0
Subtotal - General Government $934,553,177 $874,119,054 $815,341,447 $798,328,677 $777,169,375
Human Services $0 $0 $0
Office of Health & Human Services (1) - - $0 $0 $0
Children, Youth, and Families 621,670 278,859 $2,771,000 $2,694,901 $1,590,000
Health 7,737 11,772 $172,000 $126,311 $35,310
Human Services (2) 4,898,587 4,276,880 $4,389,184 $4,564,025 $4,480,364
Behaviroal Healthcare, Developmental Disabilities and Hospitals 3,881,619 4,283,638 $11,218,351 $4,802,160 $10,600,431
Governor's Commission on Disabilities 33,000 138,378 $250,000 $50,000 $957,271
Commission On Deaf and Hard of Hearing - - $0 $0 $0
Office of the Child Advocate - - $0 $0 $0
Office of the Mental Health Advocate - - - $0 $0
Subtotal - Human Services $9,442,613 $8,989,527 $18,800,535 $12,237,397 $17,663,376
Education $0 $0 $0
Elementary and Secondary 3,029,539 4,057,838 $6,451,223 $11,803,994 $7,861,187
Higher Education - Board of Governors 778,283,784 820,326,380 $853,664,951 $857,388,501 $870,592,266
RI Council on the Arts 818,518 279,691 $843,500 $1,587,492 $632,536
RI Atomic Energy Commission 263,617 328,022 $333,122 $293,642 $307,977
Higher Education Assistance Authority 6,608,023 8,558,270 $8,758,802 $8,535,829 $9,207,989
Historical Preservation and Heritage Comm. - 75,000 $75,000 $141,606 $1,084,999
Public Telecommunications Authority 595,684 629,411 701,895 $0 $0
Subtotal - Education $789,599,165 $834,254,612 $870,828,493 $879,751,064 $889,686,954
74

Expenditures from Other Funds
FY 2011 Actuals FY 2012 Actuals FY 2013 Enacted FY 2013 Final
Revised FY 2014 Enacted
$0 $0 $0
Public Safety $0 $0 $0
Attorney General 274,655 122,713 $287,500 $600,000 $50,000
Corrections 2,943,618 2,566,331 $11,399,600 $9,124,284 $17,469,751
Judicial 829,704 1,074,878 $1,675,000 $4,374,557 $1,515,000
Military Staff 222,898 998,846 $4,578,000 $5,748,093 $3,408,000
Public Safety (3) 10,247,898 4,198,808 8,082,330 $5,407,438 $8,207,227
Office Of Public Defender - - - $0 $0
Subtotal - Public Safety $14,518,773 $8,961,576 $26,022,430 $25,254,372 $30,649,978
Natural Resources $0 $0 $0
Environmental Management 1,997,064 4,724,672 $14,983,718 $11,098,379 $24,949,959
Coastal Resources Management Council 0 666,318 900,000 $722,281 $0
Water Resources Board (4) 211,943 0 - $0 $0
Subtotal - Natural Resources $2,209,007 $5,390,990 $15,883,718 $11,820,660 $24,949,959
Transportation
Transportation 115,027,739 93,339,390 148,281,757 $147,865,689 $140,477,915
Subtotal - Transportation $115,027,739 $93,339,390 $148,281,757 $147,865,689 $140,477,915
Total $1,865,350,474 $1,825,055,149 $1,895,158,380 $1,875,257,859 $1,880,597,557
(1) In FY 2013, the Medicaid program is moved from the Department of Human Services to the Office of Health and Human Serv
(2) In FY 2012, the Department of Elderly Affairs was merged into the Department of Human Services as its own program.
(3) In FY 2012, the Sheriffs program was moved from the Department of Administration to the Department of Public Safety.
(4) In FY 2012, the Water Resources Board was merged into the Statewide Planning program in the Department of Administration.
75
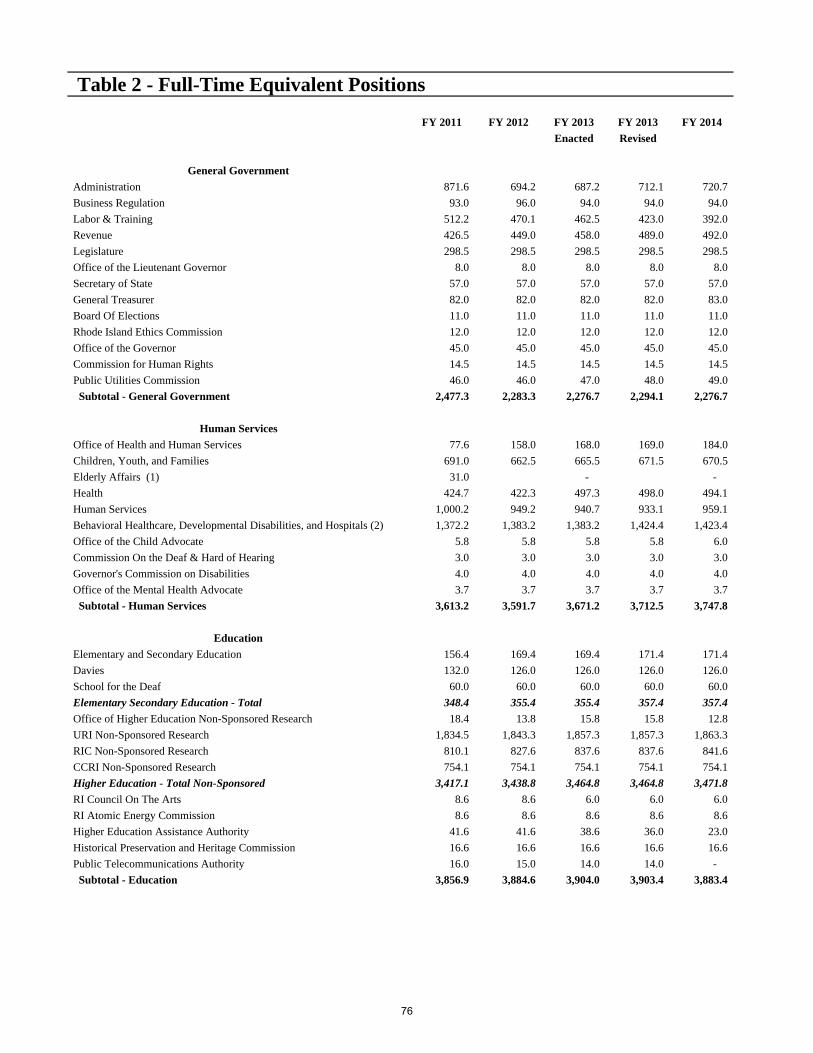
Table 2 - Full-Time Equivalent Positions
FY 2011 FY 2012 FY 2013 FY 2013 FY 2014
Enacted Revised
General Government
Administration 871.6 694.2 687.2 712.1 720.7
Business Regulation 93.0 96.0 94.0 94.0 94.0
Labor & Training 512.2 470.1 462.5 423.0 392.0
Revenue 426.5 449.0 458.0 489.0 492.0
Legislature 298.5 298.5 298.5 298.5 298.5
Office of the Lieutenant Governor 8.0 8.0 8.0 8.0 8.0
Secretary of State 57.0 57.0 57.0 57.0 57.0
General Treasurer 82.0 82.0 82.0 82.0 83.0
Board Of Elections 11.0 11.0 11.0 11.0 11.0
Rhode Island Ethics Commission 12.0 12.0 12.0 12.0 12.0
Office of the Governor 45.0 45.0 45.0 45.0 45.0
Commission for Human Rights 14.5 14.5 14.5 14.5 14.5
Public Utilities Commission 46.0 46.0 47.0 48.0 49.0
Subtotal - General Government 2,477.3 2,283.3 2,276.7 2,294.1 2,276.7
Human Services
Office of Health and Human Services 77.6 158.0 168.0 169.0 184.0
Children, Youth, and Families 691.0 662.5 665.5 671.5 670.5
Elderly Affairs (1) 31.0 - -
Health 424.7 422.3 497.3 498.0 494.1
Human Services 1,000.2 949.2 940.7 933.1 959.1
Behavioral Healthcare, Developmental Disabilities, and Hospitals (2) 1,372.2 1,383.2 1,383.2 1,424.4 1,423.4
Office of the Child Advocate 5.8 5.8 5.8 5.8 6.0
Commission On the Deaf & Hard of Hearing 3.0 3.0 3.0 3.0 3.0
Governor's Commission on Disabilities 4.0 4.0 4.0 4.0 4.0
Office of the Mental Health Advocate 3.7 3.7 3.7 3.7 3.7
Subtotal - Human Services 3,613.2 3,591.7 3,671.2 3,712.5 3,747.8
Education
Elementary and Secondary Education 156.4 169.4 169.4 171.4 171.4
Davies 132.0 126.0 126.0 126.0 126.0
School for the Deaf 60.0 60.0 60.0 60.0 60.0
Elementary Secondary Education - Total 348.4 355.4 355.4 357.4 357.4
Office of Higher Education Non-Sponsored Research 18.4 13.8 15.8 15.8 12.8
URI Non-Sponsored Research 1,834.5 1,843.3 1,857.3 1,857.3 1,863.3
RIC Non-Sponsored Research 810.1 827.6 837.6 837.6 841.6
CCRI Non-Sponsored Research 754.1 754.1 754.1 754.1 754.1
Higher Education - Total Non-Sponsored 3,417.1 3,438.8 3,464.8 3,464.8 3,471.8
RI Council On The Arts 8.6 8.6 6.0 6.0 6.0
RI Atomic Energy Commission 8.6 8.6 8.6 8.6 8.6
Higher Education Assistance Authority 41.6 41.6 38.6 36.0 23.0
Historical Preservation and Heritage Commission 16.6 16.6 16.6 16.6 16.6
Public Telecommunications Authority 16.0 15.0 14.0 14.0 -
Subtotal - Education 3,856.9 3,884.6 3,904.0 3,903.4 3,883.4
76
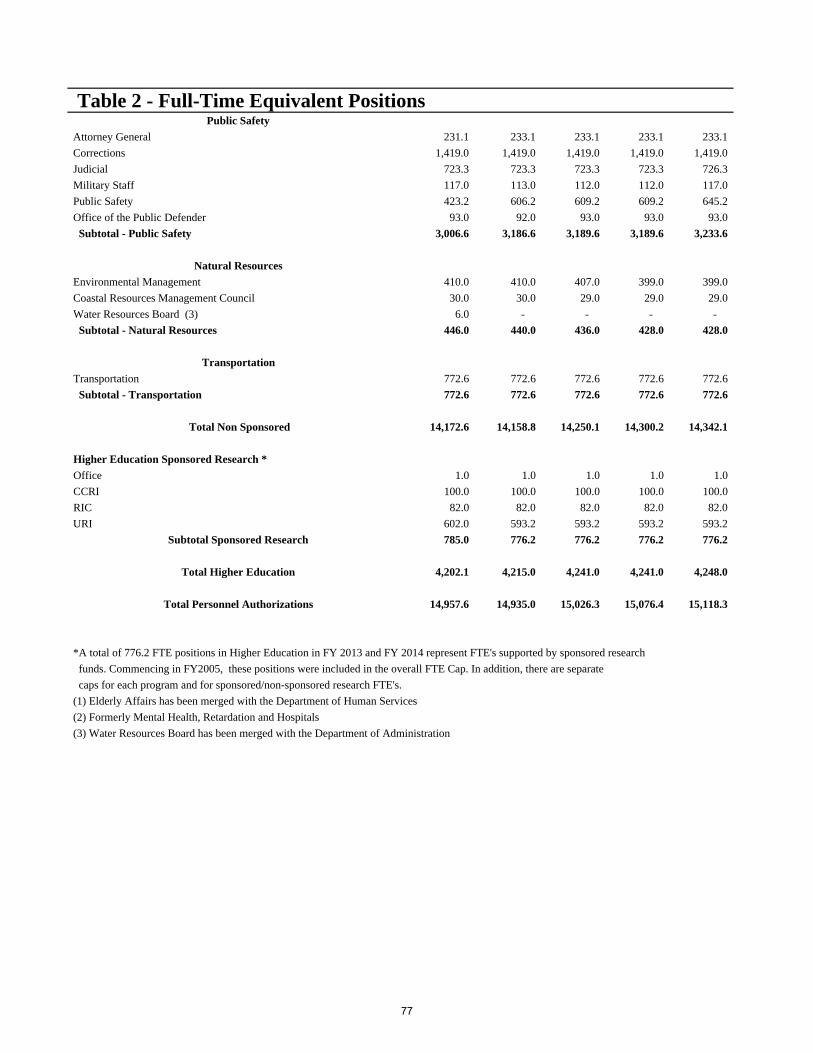
Table 2 - Full-Time Equivalent PositionsPublic Safety
Attorney General 231.1 233.1 233.1 233.1 233.1
Corrections 1,419.0 1,419.0 1,419.0 1,419.0 1,419.0
Judicial 723.3 723.3 723.3 723.3 726.3
Military Staff 117.0 113.0 112.0 112.0 117.0
Public Safety 423.2 606.2 609.2 609.2 645.2
Office of the Public Defender 93.0 92.0 93.0 93.0 93.0
Subtotal - Public Safety 3,006.6 3,186.6 3,189.6 3,189.6 3,233.6
Natural Resources
Environmental Management 410.0 410.0 407.0 399.0 399.0
Coastal Resources Management Council 30.0 30.0 29.0 29.0 29.0
Water Resources Board (3) 6.0 - - - -
Subtotal - Natural Resources 446.0 440.0 436.0 428.0 428.0
Transportation
Transportation 772.6 772.6 772.6 772.6 772.6
Subtotal - Transportation 772.6 772.6 772.6 772.6 772.6
Total Non Sponsored 14,172.6 14,158.8 14,250.1 14,300.2 14,342.1
Higher Education Sponsored Research *
Office 1.0 1.0 1.0 1.0 1.0
CCRI 100.0 100.0 100.0 100.0 100.0
RIC 82.0 82.0 82.0 82.0 82.0
URI 602.0 593.2 593.2 593.2 593.2
Subtotal Sponsored Research 785.0 776.2 776.2 776.2 776.2
Total Higher Education 4,202.1 4,215.0 4,241.0 4,241.0 4,248.0
Total Personnel Authorizations 14,957.6 14,935.0 15,026.3 15,076.4 15,118.3
*A total of 776.2 FTE positions in Higher Education in FY 2013 and FY 2014 represent FTE's supported by sponsored research
funds. Commencing in FY2005, these positions were included in the overall FTE Cap. In addition, there are separate
caps for each program and for sponsored/non-sponsored research FTE's.
(1) Elderly Affairs has been merged with the Department of Human Services
(2) Formerly Mental Health, Retardation and Hospitals
(3) Water Resources Board has been merged with the Department of Administration
77

Total Statewide Expenditures
FY 2011 Actuals
FY 2012 Actuals
FY 2013 Enacted
FY 2013 Final Revised
FY 2014 Enacted
Expenditure by Function
General Government 1,744,809,149 1,648,114,825 1,523,710,004 1,609,457,856 1,487,499,013
Human Services 3,012,482,837 2,973,937,244 3,186,690,700 3,114,566,633 3,305,789,763
Education 2,113,824,420 2,164,188,345 2,266,732,833 2,278,258,238 2,317,945,126
Public Safety 439,468,001 464,791,501 507,171,417 530,176,206 520,688,694
Natural Resourses 73,407,269 80,110,945 103,930,329 103,291,894 120,889,429
Transportation 345,215,545 387,375,260 511,621,101 465,845,728 460,249,997
Total Expenditures $7,729,207,221 $7,718,518,120 $8,099,856,384 $8,101,596,555 $8,213,062,022
Expenditure by Object
Personnel 1,610,865,883 1,695,027,963 1,815,136,144 1,810,623,338 1,824,134,039
Operating Supplies and Expenses 635,144,212 637,798,015 700,146,511 719,816,056 711,109,016
Aid to Local Units of Government 1,093,673,959 1,080,134,299 1,129,850,763 1,127,136,289 1,169,756,434
Assistance, Grants, and Benefits 3,802,918,648 3,661,124,878 3,665,108,724 3,643,400,115 3,710,006,209
Subtotal: Operating Expenditures $7,142,602,702 $7,074,085,155 $7,310,242,142 $7,300,975,798 $7,415,005,698
Capital Purchases and Equipment 180,221,023 255,698,846 370,534,627 354,356,801 383,205,201
Debt Service 204,706,430 216,006,495 274,353,607 283,377,004 268,061,893
Operating Transfers 201,677,066 172,727,624 144,726,008 162,886,952 146,789,230
Total Expenditures $7,729,207,221 $7,718,518,120 $8,099,856,384 $8,101,596,555 $8,213,062,022
Expenditures by Funds
General Revenue 2,956,153,504 3,110,242,011 3,295,836,490 3,233,811,258 3,359,755,123
Federal Funds 2,748,818,624 2,599,122,873 2,676,350,399 2,723,210,879 2,717,673,430
Restricted Receipts 158,884,619 184,098,087 232,511,115 269,316,559 255,035,912
Other Funds 1,865,350,474 1,825,055,149 1,895,158,380 1,875,257,859 1,880,597,557
Total Expenditures 7,729,207,221$ 7,718,518,120$ 8,099,856,384$ 8,101,596,555$ 8,213,062,022$
Total FTE Complement 14,172.6 14,158.8 14,250.1 14,300.2 14,342.1
Higher Education Sponsored Research 785.0 776.2 776.2 776.2 776.2
Total Personnel 14,957.6 14,935.0 15,026.3 15,076.4 15,118.3
-
78

FY 2014 General Revenue Budget Surplus
FY 2012 FY 2013 FY 2014 FY 2014 Change
Audited (1) Final Enacted (2) Recommended (3) Final Enacted (4) from RecommendedSurplus
Opening Surplus $64,229,426 $115,187,511 $79,315,556 $93,407,399 $14,091,843Audit Adjustments - - - - - Adjustment to Opening Surplus - - - - - Reappropriated Surplus 4,532,242 7,726,521 - - -
Subtotal $68,761,668 $122,914,033 $79,315,556 $93,407,399 $14,091,843
General Taxes $2,518,449,026 2,578,121,440 2,664,200,000 2,664,200,000 - Revenue estimators' revision - (10,521,440) - (41,200,000) (41,200,000) Changes to Adopted - - (3,938,206) (44,124) 3,894,082
Subtotal $2,518,449,026 $2,567,600,000 $2,660,261,794 $2,622,955,876 ($37,305,918)
Departmental Revenues 339,895,284 342,873,883 206,800,000 206,800,000 - Revenue estimators' revision - 20,226,117 - (200,000) (200,000) Changes to Adopted - - 146,492,687 142,107,542 (4,385,145)
Subtotal $339,895,284 $363,100,000 $353,292,687 $348,707,542 ($4,585,145)Other Sources
Other Miscellaneous 20,110,214 4,440,000 2,430,000 2,430,000 - Revenue estimators' revision - 1,225,000 - 115,000 115,000 Changes to Adopted - 300,000 - 3,000,000 3,000,000 Lottery 377,706,394 387,553,420 405,100,000 405,100,000 - Revenue estimators' revision - (7,393,420) - (10,000,000) (10,000,000) Changes to Adopted - - (4,300,000) (1,000,000) 3,300,000 Unclaimed Property 14,555,573 7,900,000 9,600,000 9,600,000 - Revenue estimators' revision - (900,000) - 100,000 100,000
Subtotal $412,372,181 $393,125,000 $412,830,000 $409,345,000 ($3,485,000)
Total Revenues $3,270,716,491 $3,323,825,000 $3,426,384,481 $3,381,008,418 ($45,376,063)Transfer to Budget Reserve (93,378,486) (103,170,375) (105,171,001) (104,232,475) $938,527
Total Available $3,246,099,674 $3,343,568,657 $3,400,529,036 $3,370,183,343 ($30,345,693)
Actual/Enacted Expenditures $3,110,242,012 $3,295,836,490 $3,399,154,309 $3,399,154,309 $0Reappropriations - $7,726,521 - - -Caseload Conference Changes - ($44,222,399) - (7,718,265) (7,718,265)FMAP Makeup - - - - -Other Changes in Expenditures - ($25,529,354) - (31,680,921) (31,680,921)
Total Expenditures $3,110,242,012 $3,233,811,258 $3,399,154,309 $3,359,755,123 ($39,399,186)
Total Ending Balances $135,857,662 $109,757,399 $1,374,727 $10,428,220 $9,053,493
Transfer to Other Funds (5) ($12,943,629) ($16,350,000) $0 ($10,000,000) ($10,000,000)Reappropriations (7,726,521)
Free Surplus $115,187,511 $93,407,399 $1,374,727 $428,220 ($946,507)
Budget Reserve and Cash
Stabilization Account $153,407,512 $171,950,626 $175,285,002 $173,720,791 ($1,564,211)
(1) Derived from the State Controller's final closing report for FY 2012, dated January 4, 2013.(2) Reflects the final FY 2013 revised budget enacted by the General Assembly and signed into law by the Governor on July 3, 2013.(3) Reflects the Governor's recommended budget for FY 2014 as submitted to the General Assembly on January 16, 2013.(4) Reflects the FY 2014 budget enacted by the General Assembly and signed into law by the Governor on July 3, 2013. (5) Reflects restricted General Fund balances transfered to the retirement fund and to the Information Technology Investment Fund and State Fleet Revolving Loan Fund in FY 2013 and to the Accelerated Depreciation Fund in FY 2014.
79

FY 2013 Budget

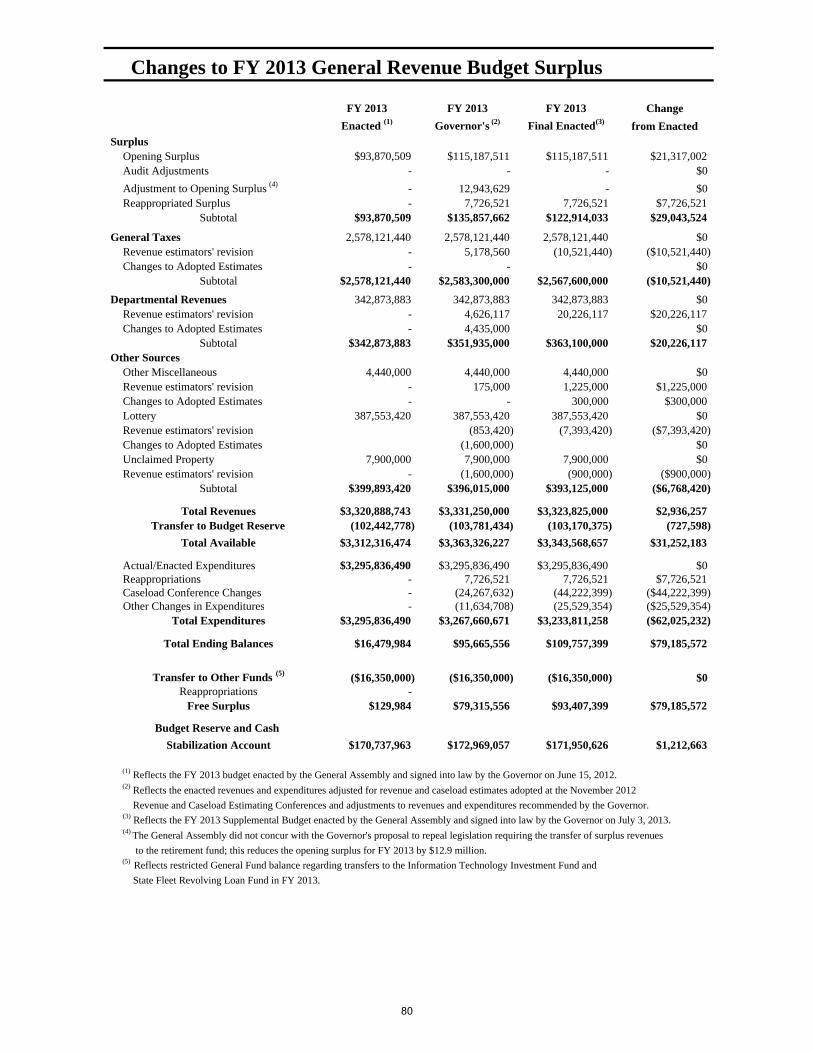
Changes to FY 2013 General Revenue Budget Surplus
FY 2013 FY 2013 FY 2013 Change
Enacted (1) Governor's (2) Final Enacted(3) from EnactedSurplus
Opening Surplus $93,870,509 $115,187,511 $115,187,511 $21,317,002Audit Adjustments - - - $0
Adjustment to Opening Surplus (4) - 12,943,629 - $0Reappropriated Surplus - 7,726,521 7,726,521 $7,726,521
Subtotal $93,870,509 $135,857,662 $122,914,033 $29,043,524
General Taxes 2,578,121,440 2,578,121,440 2,578,121,440 $0Revenue estimators' revision - 5,178,560 (10,521,440) ($10,521,440)Changes to Adopted Estimates - - $0
Subtotal $2,578,121,440 $2,583,300,000 $2,567,600,000 ($10,521,440)
Departmental Revenues 342,873,883 342,873,883 342,873,883 $0Revenue estimators' revision - 4,626,117 20,226,117 $20,226,117Changes to Adopted Estimates - 4,435,000 $0
Subtotal $342,873,883 $351,935,000 $363,100,000 $20,226,117Other Sources
Other Miscellaneous 4,440,000 4,440,000 4,440,000 $0Revenue estimators' revision - 175,000 1,225,000 $1,225,000Changes to Adopted Estimates - - 300,000 $300,000Lottery 387,553,420 387,553,420 387,553,420 $0Revenue estimators' revision (853,420) (7,393,420) ($7,393,420)Changes to Adopted Estimates (1,600,000) $0Unclaimed Property 7,900,000 7,900,000 7,900,000 $0Revenue estimators' revision - (1,600,000) (900,000) ($900,000)
Subtotal $399,893,420 $396,015,000 $393,125,000 ($6,768,420)
Total Revenues $3,320,888,743 $3,331,250,000 $3,323,825,000 $2,936,257Transfer to Budget Reserve (102,442,778) (103,781,434) (103,170,375) (727,598)
Total Available $3,312,316,474 $3,363,326,227 $3,343,568,657 $31,252,183
Actual/Enacted Expenditures $3,295,836,490 $3,295,836,490 $3,295,836,490 $0Reappropriations - 7,726,521 7,726,521 $7,726,521Caseload Conference Changes - (24,267,632) (44,222,399) ($44,222,399)Other Changes in Expenditures - (11,634,708) (25,529,354) ($25,529,354)
Total Expenditures $3,295,836,490 $3,267,660,671 $3,233,811,258 ($62,025,232)
Total Ending Balances $16,479,984 $95,665,556 $109,757,399 $79,185,572
Transfer to Other Funds (5) ($16,350,000) ($16,350,000) ($16,350,000) $0Reappropriations -
Free Surplus $129,984 $79,315,556 $93,407,399 $79,185,572
Budget Reserve and Cash
Stabilization Account $170,737,963 $172,969,057 $171,950,626 $1,212,663
(1) Reflects the FY 2013 budget enacted by the General Assembly and signed into law by the Governor on June 15, 2012.(2) Reflects the enacted revenues and expenditures adjusted for revenue and caseload estimates adopted at the November 2012
Revenue and Caseload Estimating Conferences and adjustments to revenues and expenditures recommended by the Governor.(3) Reflects the FY 2013 Supplemental Budget enacted by the General Assembly and signed into law by the Governor on July 3, 2013.(4) The General Assembly did not concur with the Governor's proposal to repeal legislation requiring the transfer of surplus revenues
to the retirement fund; this reduces the opening surplus for FY 2013 by $12.9 million. (5) Reflects restricted General Fund balance regarding transfers to the Information Technology Investment Fund and
State Fleet Revolving Loan Fund in FY 2013.
80

Changes to FY 2013 Enacted Agency General Revenue Expenditures
FY2013 Enacted Reappropriation/ Distribution Final FY 2013 Projected Appropriation Appropriation of Medical Enacted Final Surplus/
Transfer Holiday Savings Changes Appropriation (Deficit)
General GovernmentAdministration
Central Management 2,272,523Shift ODE Operating from General Program 50,000 Shift ODE Personnel from General Program 250,000 Personnel-Salary & Benefits (Turnover) (6,984) (66,557)Add Staff Office of Digital Excellence 99,182 Operating (Out-of-state travel, Telecomm O/H) 0 Personnel Reform Study Savings (55,000)Other Contracted Services 7,225 Capital Purchases & Equipment (Shift lease costs to operating) (3,300)
Subtotal 2,272,523 - (6,984) 281,550 2,547,089 (274,566)
Accounts & Control 3,815,349Personnel-Salary & Benefits (Turnover) (18,768) (21,842) Capital Purchases & Equipment (Computers) 4,000
Personnel-Salary & Benefits 3,815,349 - (18,768) (17,842) 3,778,739 36,610
Office of Management and Budget 3,004,055Office of Regulatory Reform (transfer staff from RIEDC) 37,743 Shift Electronic Local Permitting System from CPAL 300,000 Electronic Local Permitting - Delay to FY 2014 (280,000) All Other Capital 9,200 Personnel-Salary & Benefits (8,715) - Operating (Printing and Publications) 20,109
Subtotal 3,004,055 - (8,715) 87,052 3,082,392 (78,337)
Purchasing 2,741,468Personnel-Salary & Benefits (Turnover) (11,056) (192,166) Capital Purchases & Equipment (Computers) 12,000
Subtotal 2,741,468 - (11,056) (180,166) 2,550,246 191,222
Auditing 1,200,000Personnel-Salary & Benefits (Turnover) (3,376) (76,031) Capital Purchases & Equipment (Computers Replacement) 10,000 Operating 6,135
Subtotal 1,200,000 - (3,376) (59,896) 1,136,728 63,272
Human Resources 8,839,720 Personnel-Salary & Benefits (Turnover) (30,312) (317,229) Personnel - State Police & DMV HR Coordinators (229,687) Contract Services (Legal - Class Action Lawsuit Defense) 2,800 Diversity Training 10,000 Operating (Printing, Advertisements, etc) 24,202 Capital (3,932)
Subtotal 8,839,720 - (30,312) (513,846) 8,295,562 544,158
Personnel Appeal Board 75,036 - Subtotal 75,036 - - 0 75,036 0
Legal Services 2,006,995
Personnel-Salary & Benefits (Turnover) ($5,741) (100,520) Operating (Online Legal Research Subscription, etc) 2,000 Capital Purchases & Equipment (Computers Replacement) 7,500
Subtotal 2,006,995 - (5,741) (91,020) 1,910,234 96,761
Facilities Management 32,593,888Personnel-Salary & Benefits (Turnover) (51,327) (448,104) Contract Services 25,860 Operating - Utilities (Natural Gas and Electric) (1,165,675) Capital Purchase (MV Purchase Debt Service to ARLF) 9,988 Transfer Facilities Expenses to Dept. of Corrections (395,386)
Subtotal 32,593,888 - (51,327) (1,973,317) 30,569,244 2,024,644
Capital Projects and Property Management 3,040,310Transfer CPAL Personnel from Capital Projects (1,396,573) Transfer CPAL Operating from Capital Projects (69,864)
81
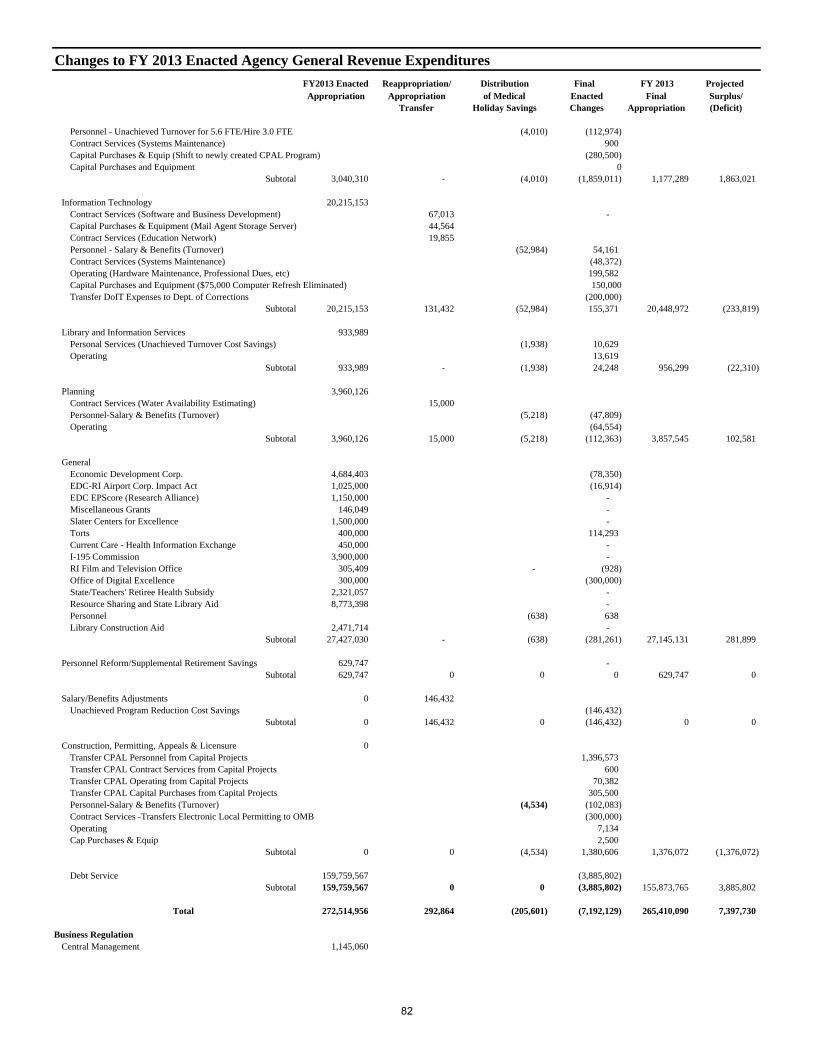
Changes to FY 2013 Enacted Agency General Revenue Expenditures
FY2013 Enacted Reappropriation/ Distribution Final FY 2013 Projected Appropriation Appropriation of Medical Enacted Final Surplus/
Transfer Holiday Savings Changes Appropriation (Deficit)
Personnel - Unachieved Turnover for 5.6 FTE/Hire 3.0 FTE (4,010) (112,974) Contract Services (Systems Maintenance) 900 Capital Purchases & Equip (Shift to newly created CPAL Program) (280,500) Capital Purchases and Equipment 0
Subtotal 3,040,310 - (4,010) (1,859,011) 1,177,289 1,863,021
Information Technology 20,215,153Contract Services (Software and Business Development) 67,013 - Capital Purchases & Equipment (Mail Agent Storage Server) 44,564 Contract Services (Education Network) 19,855 Personnel - Salary & Benefits (Turnover) (52,984) 54,161 Contract Services (Systems Maintenance) (48,372) Operating (Hardware Maintenance, Professional Dues, etc) 199,582 Capital Purchases and Equipment ($75,000 Computer Refresh Eliminated) 150,000Transfer DoIT Expenses to Dept. of Corrections (200,000)
Subtotal 20,215,153 131,432 (52,984) 155,371 20,448,972 (233,819)
Library and Information Services 933,989Personal Services (Unachieved Turnover Cost Savings) (1,938) 10,629 Operating 13,619
Subtotal 933,989 - (1,938) 24,248 956,299 (22,310)
Planning 3,960,126Contract Services (Water Availability Estimating) 15,000 Personnel-Salary & Benefits (Turnover) (5,218) (47,809) Operating (64,554)
Subtotal 3,960,126 15,000 (5,218) (112,363) 3,857,545 102,581
GeneralEconomic Development Corp. 4,684,403 (78,350) EDC-RI Airport Corp. Impact Act 1,025,000 (16,914) EDC EPScore (Research Alliance) 1,150,000 - Miscellaneous Grants 146,049 - Slater Centers for Excellence 1,500,000 - Torts 400,000 114,293 Current Care - Health Information Exchange 450,000 - I-195 Commission 3,900,000 - RI Film and Television Office 305,409 - (928) Office of Digital Excellence 300,000 (300,000) State/Teachers' Retiree Health Subsidy 2,321,057 - Resource Sharing and State Library Aid 8,773,398 - Personnel (638) 638 Library Construction Aid 2,471,714 -
Subtotal 27,427,030 - (638) (281,261) 27,145,131 281,899
Personnel Reform/Supplemental Retirement Savings 629,747 - Subtotal 629,747 0 0 0 629,747 0
Salary/Benefits Adjustments 0 146,432 Unachieved Program Reduction Cost Savings (146,432)
Subtotal 0 146,432 0 (146,432) 0 0
Construction, Permitting, Appeals & Licensure 0Transfer CPAL Personnel from Capital Projects 1,396,573 Transfer CPAL Contract Services from Capital Projects 600 Transfer CPAL Operating from Capital Projects 70,382 Transfer CPAL Capital Purchases from Capital Projects 305,500 Personnel-Salary & Benefits (Turnover) (4,534) (102,083)Contract Services -Transfers Electronic Local Permitting to OMB (300,000)Operating 7,134Cap Purchases & Equip 2,500
Subtotal 0 0 (4,534) 1,380,606 1,376,072 (1,376,072)
Debt Service 159,759,567 (3,885,802)Subtotal 159,759,567 0 0 (3,885,802) 155,873,765 3,885,802
Total 272,514,956 292,864 (205,601) (7,192,129) 265,410,090 7,397,730
Business RegulationCentral Management 1,145,060
82

Changes to FY 2013 Enacted Agency General Revenue Expenditures
FY2013 Enacted Reappropriation/ Distribution Final FY 2013 Projected Appropriation Appropriation of Medical Enacted Final Surplus/
Transfer Holiday Savings Changes Appropriation (Deficit)
Personnel (3,950) (34,909) Operating (1,400)
1,145,060 - (3,950) (36,309) 1,104,801 40,259
Insurance Regulation 3,916,525Personnel (13,307) (45,478) Operating (4,500)
3,916,525 - (13,307) (49,978) 3,853,240 63,285
Office of the Health Commissioner 542,929Personnel (1,218) (14,129)
542,929 - (1,218) (14,129) 527,582 15,347
Board of Accountancy 82,483Personnel (231) (2,788)
82,483 - (231) (2,788) 79,464 3,019
Banking 1,637,766Personnel (6,902) (72,135) Operating (1,200)
1,637,766 - (6,902) (73,335) 1,557,529 80,237
Securities 1,068,375Personnel (4,520) (196,431) Operating (2,200)
1,068,375 - (4,520) (198,631) 865,224 203,151
Commercial Licensing, Racing & Athletics 719,111Personnel (2,041) (25,355) Operating (2,300)
719,111 - (2,041) (27,655) 689,415 29,696
Board of Design Professionals 249,799Personnel-Salary & Benefits (1,218) (324)
249,799 - (1,218) (324) 248,257 1,542
Total 9,362,048 - (33,387) (403,149) 8,925,512 436,536
Labor and TrainingCentral Management 107,310
Personnel-Salary & Benefits (465) (3,355) Contracted Professional Services 12,657 Operating Supplies and Expenses/Capital (793) Grants and Benefits (4)
107,310 - (465) 8,505 115,350 (8,040)
Workforce Regulation and Safety 2,994,552Personnel-Salary & Benefits (13,857) 34,680 Contracted Professional Services (19,984) Operating Supplies and Expenses/Capital (32,032) Grants and Benefits (767) Tardy and Interest Transfer -
2,994,552 - (13,857) (18,103) 2,962,592 31,960
Income Support 4,370,518Personnel-Salary & Benefits (324) 596 Contracted Professional Services (80) Operating Supplies and Expenses/Capital (164) Police Relief Fund 60,369 Firefighter Relief Fund (162,790)
4,370,518 - (324) (102,069) 4,268,125 102,393
Labor Relations Board 386,790Personnel-Salary & Benefits (808) (283) Contracted Professional Services 172 Operating Supplies and Expenses/Capital (3,035) Grants and Assistance (2)
386,790 - (808) (3,148) 382,834 3,956
83

Changes to FY 2013 Enacted Agency General Revenue Expenditures
FY2013 Enacted Reappropriation/ Distribution Final FY 2013 Projected Appropriation Appropriation of Medical Enacted Final Surplus/
Transfer Holiday Savings Changes Appropriation (Deficit)
Total 7,859,170 - (15,454) (114,815) 7,728,901 130,269
LegislatureLegislature 37,217,044 6,337,390 (161,240) (3,004,961)
Personnel-Salary & Benefits - Operating Supplies and Expenses -
Total 37,217,044 6,337,390 (161,240) (3,004,961) 40,388,233 3,166,201
Office of the Lieutenant Governor 962,955Personnel-Salary & Benefits (3,194) (14,062) Operating Supplies and Expenses/Capital (388)
Total 962,955 - (3,194) (14,450) 945,311 17,644
Secretary of StateAdministration 1,907,105
Personnel-Salary & Benefits (4,747) 68,784 Contracted Professional Services (700) Operating Supplies and Expenses 21,200 Capital Purchases and Equipment 4,735
1,907,105 - (4,747) 94,019 1,996,377 (89,272)
Corporations 2,068,731Personnel-Salary & Benefits (9,493) (22,539) Contracted Professional Services (1,225) Quick Start Master Application 30,000 Operating Supplies and Expenses 10,347 Capital Purchases and Equipment 11,500
2,068,731 - (9,493) 28,083 2,087,321 (18,590)
State Archives 79,385Personnel-Salary & Benefits (60,000) Operating Supplies and Expenses - 11,451
79,385 - (48,549) 30,836 48,549
Elections 1,900,552Personnel-Salary & Benefits (2,005) (70,468) Contracted Professional Services (85,000) Operating Supplies and Expenses 2,426 Capital Purchases and Equipment 3,600
1,900,552 (2,005) (149,442) 1,749,105 151,447
State Library 598,381Personnel-Salary & Benefits (2,014) (866) Operating Supplies and Expenses 2,400 Capital Purchases and Equipment 3,300
598,381 (2,014) 4,834 601,201 (2,820)
Office of Public Information 358,884Personnel-Salary & Benefits (1,454) (484) Contracted Professional Services 12,750 Operating Supplies and Expenses (1,764) Capital Purchases and Equipment 553
358,884 (1,454) 11,055 368,485 (9,601)
Total 6,913,038 - (19,713) (60,000) 6,833,325 79,713
Office of the General TreasurerTreasury 2,096,374 58,300
Personnel-Salary & Benefits (5,302) (38,942) Operating (20,517) Bank Fees 300,000 Contracted Professional Services 6,251 Capital 30,324
2,096,374 58,300 (5,302) 277,116 2,426,488 (271,814)
State Retirement System - Def. Comp Admn 311,760Personnel-Salary & Benefits (706) (61,597) Contracted Professional Services (20,000)
84

Changes to FY 2013 Enacted Agency General Revenue Expenditures
FY2013 Enacted Reappropriation/ Distribution Final FY 2013 Projected Appropriation Appropriation of Medical Enacted Final Surplus/
Transfer Holiday Savings Changes Appropriation (Deficit)
311,760 0 (706) (81,597) 229,457 82,303
Crime Victim Compensation Program 133,981Personnel-Salary & Benefits (606) 39,055 Operating Supplies and Expenses (1,874)
133,981 0 (606) 37,181 170,556 (36,575)
Total 2,542,115 58,300 (6,614) 232,700 2,826,501 (226,086)
Board of ElectionsBoard Of Elections 1,952,116
Personnel-Salary & Benefits (4,901) (12,227) Contracted Professional Services (271,969) Operating Supplies and Expenses 223,804
Total 1,952,116 - (4,901) (60,392) 1,886,823 65,293
R I Ethics CommissionsRI Ethics Commission 1,557,881 4,234
Personnel-Salary & Benefits (3,037) (16,225) Contracted Professional Services (10,000) Operating Supplies and Expenses (2,000)
Total 1,557,881 4,234 (3,037) (28,225) 1,530,853 31,262
Office of the Governor 4,168,290 - Personnel-Salary & Benefits (14,136) (74,625) Operating /Contracted Services 1,549 Capital (6,068) Contingency Fund 250,000
Total 4,418,290 0 (14,136) (79,144) 4,325,010 93,280
Commission for Human Rights 1,137,768Personal Salary and Benefits (4,639) (30,650) Contract Services 3,000 Operating 27,650
Total 1,137,768 0 (4,639) 0 1,133,129 4,639
Department of RevenueDirector of Revenue 783,388
Personnel-Salary & Benefits (2,925) 104,450 Contracted Professional Services 3,650 Operating Supplies and Expenses 2,554
783,388 0 (2,925) 110,654 891,117 (107,729)
Office of Revenue Analysis 538,285Turnover Savings (1,544) (59,276)
538,285 0 (1,544) (59,276) 477,465 60,820
Office of Municipal Finance 2,564,780Personnel-Salary & Benefits (6,963) (159,107) Woonsocket Municipal Oversight 67,641 Contract Services (160,000) Central Falls Receivership Legal Expenses 110,502 Operating (28,576) Grants (5,000)
2,564,780 0 (6,963) (174,540) 2,383,277 181,503
Taxation 17,904,225Turnover Savings (66,768) (182,338) Contracted Professional Services 30,479 Taxation Hospital Bankruptcy Legal Costs 21,000 Operating Supplies and Expenses 34,727 Assistance and Grants 1,273 Capital Purchases and Equipment (32,200)
17,904,225 0 (66,768) (127,059) 17,710,398 193,827
Registry 18,475,667 35,000
85

Changes to FY 2013 Enacted Agency General Revenue Expenditures
FY2013 Enacted Reappropriation/ Distribution Final FY 2013 Projected Appropriation Appropriation of Medical Enacted Final Surplus/
Transfer Holiday Savings Changes Appropriation (Deficit)
Personnel-Salary & Benefits (68,675) (529,716) Contracted Professional Services (127,357) Operating Supplies and Expenses 178,969 Grants 217 Operating Transfer to CCRI 16,036 Capital Purchases and Equipment (54,377)
18,475,667 35,000 (68,675) (516,228) 17,925,764 549,903
State Aid Municipal Reimb-50% Actuarial Pension Studies 60,424 (42,901) Distressed Communities Relief Fund 10,384,458Payment in Lieu of Tax Exempt Properties 33,080,409 2,000,000 Motor Vehicle Excise Tax Payments 10,000,000Property Revaluation Program 1,611,032House Finance Committee Adjustment 993 55,075,899 60,424 1,958,092 57,094,415 (2,018,516)
Total 95,342,244 95,424 (146,875) 1,191,643 96,482,436 (1,044,768)
Sub-Total General Government 441,779,625 6,788,212 (618,791) (9,532,922) 438,416,124 10,151,713
Human Services
Office of Health and Human Services Central Management 25,434,668 379,593 (40,185)
Personnel- Other Salary & Benefits (376,841) Unified Health Infrastructure Project 1,356,747 Legal Services 14,508 Other Contracted Professional Services (1,000,974) Operating Supplies/Equipment 125,266 Nurses Aide Training Program (150,000) Other Grants and Benefits (2,535,276)
25,434,668 379,593 (40,185) (2,566,570) 23,207,506 2,606,755 Medical Assistance
Managed Care- CEC 283,387,147 (22,669,265) Hospitals- CEC 107,337,545 (3,233,736) Nursing Facilities- CEC 173,959,640 (3,897,040) Home & Community Based Services- CEC 35,953,320 3,250,840 Other Services- CEC 43,765,745 (3,281,790) Pharmacy - CEC 52,354,074 (1,794,888) Rhody Health- CEC 102,873,564 (12,281,376)
799,631,035 - - (43,907,255) 755,723,780 43,907,255
825,065,703 379,593 (40,185) (46,473,825) 778,931,286 46,514,010
Children, Youth, and FamiliesCentral Management 4,674,549 (11,208)
Personnel-Salary & Benefits 400,100Contracted Professional Services 102,489 National Accreditation (450,000) Operating/Capital Purchases 202,652 Litigation Costs 102,812
4,674,549 - (11,208) 358,053 5,021,394 (346,845)
Children's Behavioral Health 10,077,912 (5,242) Personnel-Salary & Benefits (300,947) Contracted Professional Services 51,282 Operating Supplies and Expenses 1,225 Grants and Benefits (4,956,966)
10,077,912 - (5,242) (5,205,406) 4,867,264 5,210,648
Juvenile Corrections 30,203,577Personnel-Salary & Benefits (89,292) (1,308,460) Overtime 479,019 Contracted Professional Services 61,008
86

Changes to FY 2013 Enacted Agency General Revenue Expenditures
FY2013 Enacted Reappropriation/ Distribution Final FY 2013 Projected Appropriation Appropriation of Medical Enacted Final Surplus/
Transfer Holiday Savings Changes Appropriation (Deficit)
Operating Supplies and Expenses/Capital Purchases 72,798Grants and Benefits (2,632,744) Corrections Reentry Grant 24,300
30,203,577 0 (89,292) (3,304,079) 26,810,206 3,393,371
Child Welfare 96,800,18718 to 21 Year Olds 10630227Personnel-Salary & Benefits (85,566) (1,912,144) Overtime 668,533 Contracted Professional Services 75,285 Operating Supplies and Expenses (236,396) Grants and Benefits 9,032,096 Time Study/Base StructureCapital Purchases and Equipment
107,430,414 0 (85,566) 7,627,374 114,972,222 (7,541,808)
Higher Education Incentive Grants 200,000Higher Education Incentive Grants 200,000 0 0 0 200,000
Total 152,586,452 0 (191,308) (524,058) 151,871,086 715,366
HealthCentral Management 1,173,946 (882)
Personnel-Salary & Benefits (263,303) Contracted Professional Services (1,000) Capital Purchases and Equipment - Operating Supplies and Expenses (15,038)
1,173,946 - (882) (279,341) 893,723 280,223
State Medical Examiner 2,259,943 (5,213) Personnel-Salary & Benefits (19,416) Contracted Professional Services 58,024 Operating Supplies and Expenses 507
2,259,943 - (5,213) 39,115 2,293,845 (33,902)
Environmental & Health Services Regulations 9,145,421 (39,188) Personnel-Salary & Benefits (57,004) Contract Professional Servces 134,132 Operating Supplies and Expenses (12,740) Capital Purchases and Equipment (3,640) Assistance and Grants -
9,145,421 - (39,188) 60,748 9,166,981 (21,560)
Health Laboratories 6,300,363 (20,105) Personnel-Salary & Benefits (104,569) Contracted Professional Services (178,649) Operating Expenditures 265,876 Capital Purchases and Equipment (9,150)
6,300,363 - (20,105) (26,492) 6,253,766 46,597
Public Health Information 1,741,431 (7,924) Personnel-Salary & Benefits 98,226 Contracted Professional Services 145,104 Operating Supplies and Expenses (87,000) Capital Purchases and Equipment 8,040
1,741,431 (7,924) 164,370 1,897,877 (156,446)
Community & Family Health and Equity 2,418,974 (5,558) Personnel-Salary & Benefits (136,532) Contracted Professional Services 4,373 Operating Expenditures (11,602)
2,418,974 - (5,558) (143,761) 2,269,655 149,319
Infectious Disease and Epidemiology 1,781,758 (4,224) Personnel-Salary & Benefits (23,109) Contracted Professional Services (3,714) Operating Expenditures (29,836)
87

Changes to FY 2013 Enacted Agency General Revenue Expenditures
FY2013 Enacted Reappropriation/ Distribution Final FY 2013 Projected Appropriation Appropriation of Medical Enacted Final Surplus/
Transfer Holiday Savings Changes Appropriation (Deficit)
Assistance and Grants (50,000)
1,781,758 - (4,224) (106,659) 1,670,875 110,883
Total 24,821,836 - (83,094) (292,020) 24,446,722 375,114
Human ServicesCentral Management 5,052,482 (4,697)
Personnel- Salary & Benefits (13,572) Operating Supplies and Expenses 36,732 Community Service Grants 116,389
5,052,482 - (4,697) 139,549 5,187,334 (134,852)
Child Support Enforcement 2,305,759 (7,608)Personnel- Salary & Benefits 13,161 Constable Services 29,240 Other Contracted Professional Services 75,256 Operating Supplies and Expenses 12,671
2,305,759 - (7,608) 130,328 2,428,479 (122,720)
Individual and Family Support 20,616,357 (60,801) Personnel- Salary & Benefits (478,067) Contracted Professional Services 5,131 Operating Supplies and Expenses (85,628) Assistance and Grants 121,041 Urban Institute- Work Support Strategies Grant (Phase II) 83,540
20,616,357 - (60,801) (353,983) 20,201,573 414,784
Veterans' Affairs 19,568,977 (74,457) Personnel- Salary & Benefits 240,311 Contracted Professional Services (18,677) Operating Supplies and Expenses (70,236)
19,568,977 - (74,457) 151,398 19,645,918 (76,941)
Health Care Eligibility 8,314,370 (27,570)Personnel- Salary & Benefits (890,632) Contracted Professional Services (25,178) Operating Supplies and Expense 6,340
8,314,370 - (27,570) (909,470) 7,377,330 937,040
S.S.I. Program 18,240,600S.S.I. Program- CEC (38,920)
18,240,600 - - (38,920) 18,201,680 38,920
Rhode Island Works Child Care 9,668,635
9,668,635 - - - 9,668,635 -
State Funded Programs 2,572,658General Public Assistance- CEC (527,558)
2,572,658 (527,558) 2,045,100 527,558
Elderly Affairs 10,682,842 (3,568)General RevenuesPersonnel-Salary & Benefits (9,006)Contracted Professional Services 2,800Operating Supplies and Expenses (70,817)Assistance and Grants 308,532RIPAE - Care and Safety of the Elderly 1,287
10,684,129 - (3,568) 231,509 10,912,070 (227,941)
Total 97,023,967 - (178,701) (1,177,147) 95,668,119 1,355,848
Behavioral Health, Developmental Disabilities & HospitalsCentral Management 797,214
Personnel-Salary & Benefits (2,284) (1,982) Contracted Professional Services 447
88
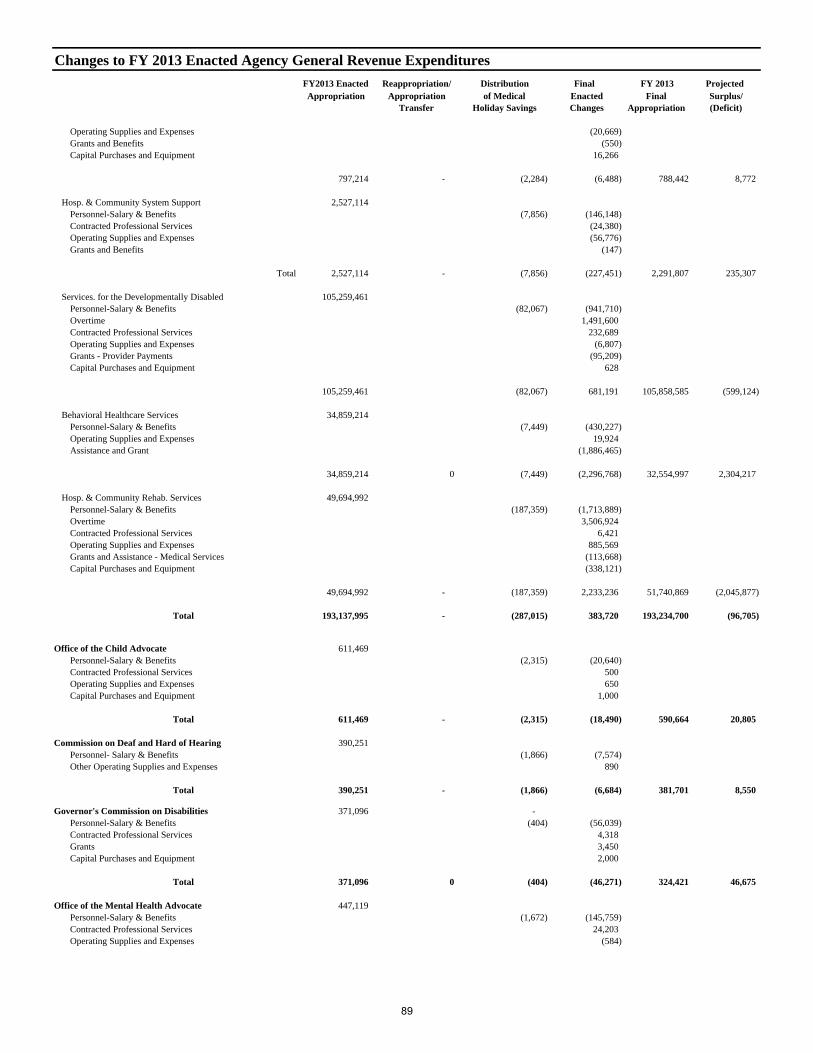
Changes to FY 2013 Enacted Agency General Revenue Expenditures
FY2013 Enacted Reappropriation/ Distribution Final FY 2013 Projected Appropriation Appropriation of Medical Enacted Final Surplus/
Transfer Holiday Savings Changes Appropriation (Deficit)
Operating Supplies and Expenses (20,669) Grants and Benefits (550) Capital Purchases and Equipment 16,266
797,214 - (2,284) (6,488) 788,442 8,772
Hosp. & Community System Support 2,527,114Personnel-Salary & Benefits (7,856) (146,148) Contracted Professional Services (24,380) Operating Supplies and Expenses (56,776) Grants and Benefits (147)
Total 2,527,114 - (7,856) (227,451) 2,291,807 235,307
Services. for the Developmentally Disabled 105,259,461Personnel-Salary & Benefits (82,067) (941,710) Overtime 1,491,600 Contracted Professional Services 232,689 Operating Supplies and Expenses (6,807) Grants - Provider Payments (95,209) Capital Purchases and Equipment 628
105,259,461 (82,067) 681,191 105,858,585 (599,124)
Behavioral Healthcare Services 34,859,214Personnel-Salary & Benefits (7,449) (430,227) Operating Supplies and Expenses 19,924 Assistance and Grant (1,886,465)
34,859,214 0 (7,449) (2,296,768) 32,554,997 2,304,217
Hosp. & Community Rehab. Services 49,694,992Personnel-Salary & Benefits (187,359) (1,713,889) Overtime 3,506,924 Contracted Professional Services 6,421 Operating Supplies and Expenses 885,569 Grants and Assistance - Medical Services (113,668)Capital Purchases and Equipment (338,121)
49,694,992 - (187,359) 2,233,236 51,740,869 (2,045,877)
Total 193,137,995 - (287,015) 383,720 193,234,700 (96,705)
Office of the Child Advocate 611,469Personnel-Salary & Benefits (2,315) (20,640)
Contracted Professional Services 500 Operating Supplies and Expenses 650 Capital Purchases and Equipment 1,000
Total 611,469 - (2,315) (18,490) 590,664 20,805
Commission on Deaf and Hard of Hearing 390,251Personnel- Salary & Benefits (1,866) (7,574) Other Operating Supplies and Expenses 890
Total 390,251 - (1,866) (6,684) 381,701 8,550
Governor's Commission on Disabilities 371,096 - Personnel-Salary & Benefits (404) (56,039)
Contracted Professional Services 4,318 Grants 3,450 Capital Purchases and Equipment 2,000
Total 371,096 0 (404) (46,271) 324,421 46,675
Office of the Mental Health Advocate 447,119Personnel-Salary & Benefits (1,672) (145,759) Contracted Professional Services 24,203 Operating Supplies and Expenses (584)
89
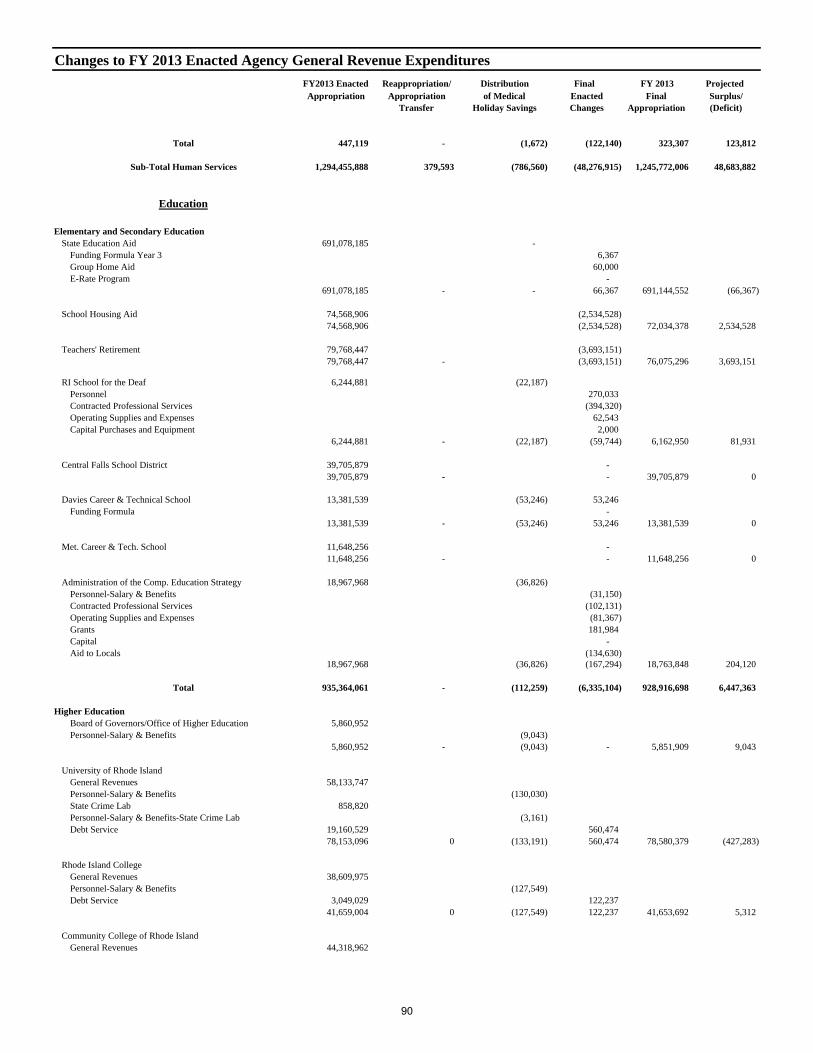
Changes to FY 2013 Enacted Agency General Revenue Expenditures
FY2013 Enacted Reappropriation/ Distribution Final FY 2013 Projected Appropriation Appropriation of Medical Enacted Final Surplus/
Transfer Holiday Savings Changes Appropriation (Deficit)
Total 447,119 - (1,672) (122,140) 323,307 123,812
Sub-Total Human Services 1,294,455,888 379,593 (786,560) (48,276,915) 1,245,772,006 48,683,882
Education
Elementary and Secondary EducationState Education Aid 691,078,185 -
Funding Formula Year 3 6,367 Group Home Aid 60,000
E-Rate Program - 691,078,185 - - 66,367 691,144,552 (66,367)
School Housing Aid 74,568,906 (2,534,528) 74,568,906 (2,534,528) 72,034,378 2,534,528
Teachers' Retirement 79,768,447 (3,693,151) 79,768,447 - (3,693,151) 76,075,296 3,693,151
RI School for the Deaf 6,244,881 (22,187) Personnel 270,033 Contracted Professional Services (394,320) Operating Supplies and Expenses 62,543 Capital Purchases and Equipment 2,000
6,244,881 - (22,187) (59,744) 6,162,950 81,931
Central Falls School District 39,705,879 - 39,705,879 - - 39,705,879 0
Davies Career & Technical School 13,381,539 (53,246) 53,246 Funding Formula -
13,381,539 - (53,246) 53,246 13,381,539 0
Met. Career & Tech. School 11,648,256 - 11,648,256 - - 11,648,256 0
Administration of the Comp. Education Strategy 18,967,968 (36,826) Personnel-Salary & Benefits (31,150) Contracted Professional Services (102,131) Operating Supplies and Expenses (81,367) Grants 181,984 Capital - Aid to Locals (134,630)
18,967,968 (36,826) (167,294) 18,763,848 204,120
Total 935,364,061 - (112,259) (6,335,104) 928,916,698 6,447,363
Higher Education Board of Governors/Office of Higher Education 5,860,952Personnel-Salary & Benefits (9,043)
5,860,952 - (9,043) - 5,851,909 9,043
University of Rhode Island General Revenues 58,133,747Personnel-Salary & Benefits (130,030) State Crime Lab 858,820 Personnel-Salary & Benefits-State Crime Lab (3,161) Debt Service 19,160,529 560,474
78,153,096 0 (133,191) 560,474 78,580,379 (427,283)
Rhode Island College General Revenues 38,609,975Personnel-Salary & Benefits (127,549) Debt Service 3,049,029 122,237
41,659,004 0 (127,549) 122,237 41,653,692 5,312
Community College of Rhode Island General Revenues 44,318,962
90

Changes to FY 2013 Enacted Agency General Revenue Expenditures
FY2013 Enacted Reappropriation/ Distribution Final FY 2013 Projected Appropriation Appropriation of Medical Enacted Final Surplus/
Transfer Holiday Savings Changes Appropriation (Deficit)
Personnel-Salary & Benefits (148,982) Debt Service 2,464,156 (23,886)
46,783,118 0 (148,982) (23,886) 46,610,250 172,868
Total 172,456,170 0 (418,765) 658,825 172,696,230 (240,060)
RI Council On The Arts 1,565,813Personnel-Salary & Benefits (1,800) (5,454) Operating Supplies and Expenses 7,254
Total 1,565,813 0 (1,800) 1,800 1,565,813 0
RI Atomic Energy Commission 876,213Personnel-Salary & Benefits (2,097) (32,784) Contracted Professional Services (2,873) Operating Supplies and Expenses 3,291
Total 876,213 - (2,097) (32,366) 841,750 34,463
RI Higher Education Assistance Authority Authority Operations and other Grants 456,061 (15,500) Personnel-Salary & Benefits (993) (48,904) Needs Based Grants and Work Opport. 5,161,003 142,000
Total 5,617,064 0 (993) 77,596 5,693,667 (76,603)
RI Historical Preservation & Heritage Commission 1,361,801Personnel-Salary & Benefits (5,735) (102,259) Contracted Professional Services 375 Operating Supplies and Expenses 10,735 Capital 500.00
Total 1,361,801 - (5,735) (90,649) 1,265,417 96,384
RI Public Telecommunications Authority 799,077Personnel-Salary & Benefits (3,591) 3,591 Contracted Professional Services - Operating Supplies and Expenses -
Total 799,077 - (3,591) 3,591 799,077 0
Sub-Total Education 1,118,040,199 - (545,240) (5,716,307) 1,111,778,652 6,261,547
Public Safety
Attorney GeneralCriminal 14,269,909
Personnel-Salary & Benefits (56,022) (352,566) Contracted Professional Services 167,862 Operating Supplies and Expenses (100,461) Capital Purchases and Equipment 3,956
14,269,909 - (56,022) (281,209) 13,932,678 337,231
Civil 4,888,477 40,401 Personnel-Salary & Benefits (17,162) (53,951) Contracted Professional Services 40,241 Operating Supplies and Expenses (95,507) Capital Purchases and Equipment 14,946
4,888,477 40,401 (17,162) (94,271) 4,817,445 111,433
Bureau of Criminal Identification 1,209,375Personnel-Salary & Benefits (4,465) 97,378 Contracted Professional Services 2,205 Operating Supplies and Expenses (15,911) Capital Purchases and Equipment 3,440
1,209,375 - (4,465) 87,112 1,292,022 (82,647)
General 2,708,563Personnel-Salary & Benefits (6,845) (46,755)
91
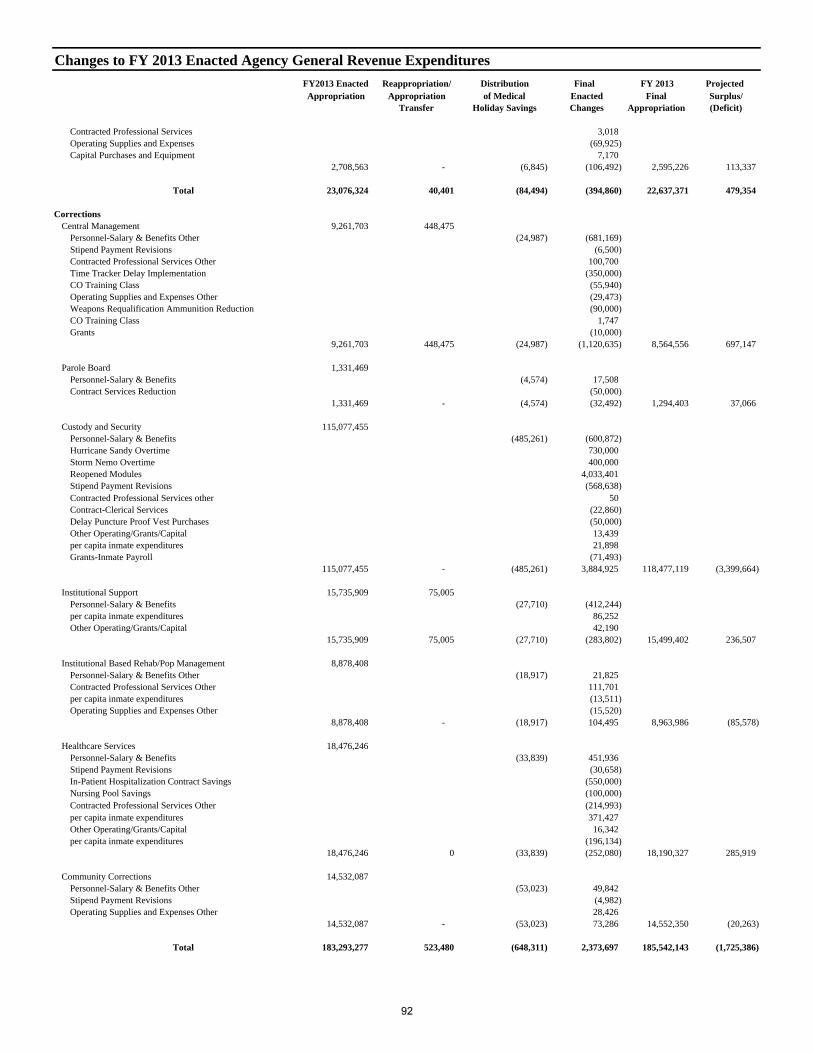
Changes to FY 2013 Enacted Agency General Revenue Expenditures
FY2013 Enacted Reappropriation/ Distribution Final FY 2013 Projected Appropriation Appropriation of Medical Enacted Final Surplus/
Transfer Holiday Savings Changes Appropriation (Deficit)
Contracted Professional Services 3,018 Operating Supplies and Expenses (69,925) Capital Purchases and Equipment 7,170
2,708,563 - (6,845) (106,492) 2,595,226 113,337
Total 23,076,324 40,401 (84,494) (394,860) 22,637,371 479,354
CorrectionsCentral Management 9,261,703 448,475
Personnel-Salary & Benefits Other (24,987) (681,169) Stipend Payment Revisions (6,500) Contracted Professional Services Other 100,700 Time Tracker Delay Implementation (350,000) CO Training Class (55,940) Operating Supplies and Expenses Other (29,473) Weapons Requalification Ammunition Reduction (90,000) CO Training Class 1,747 Grants (10,000)
9,261,703 448,475 (24,987) (1,120,635) 8,564,556 697,147
Parole Board 1,331,469Personnel-Salary & Benefits (4,574) 17,508 Contract Services Reduction (50,000)
1,331,469 - (4,574) (32,492) 1,294,403 37,066
Custody and Security 115,077,455Personnel-Salary & Benefits (485,261) (600,872) Hurricane Sandy Overtime 730,000 Storm Nemo Overtime 400,000 Reopened Modules 4,033,401 Stipend Payment Revisions (568,638) Contracted Professional Services other 50 Contract-Clerical Services (22,860) Delay Puncture Proof Vest Purchases (50,000) Other Operating/Grants/Capital 13,439 per capita inmate expenditures 21,898 Grants-Inmate Payroll (71,493)
115,077,455 - (485,261) 3,884,925 118,477,119 (3,399,664)
Institutional Support 15,735,909 75,005 Personnel-Salary & Benefits (27,710) (412,244) per capita inmate expenditures 86,252 Other Operating/Grants/Capital 42,190
15,735,909 75,005 (27,710) (283,802) 15,499,402 236,507
Institutional Based Rehab/Pop Management 8,878,408 Personnel-Salary & Benefits Other (18,917) 21,825 Contracted Professional Services Other 111,701 per capita inmate expenditures (13,511) Operating Supplies and Expenses Other (15,520)
8,878,408 - (18,917) 104,495 8,963,986 (85,578)
Healthcare Services 18,476,246Personnel-Salary & Benefits (33,839) 451,936 Stipend Payment Revisions (30,658) In-Patient Hospitalization Contract Savings (550,000) Nursing Pool Savings (100,000) Contracted Professional Services Other (214,993) per capita inmate expenditures 371,427 Other Operating/Grants/Capital 16,342 per capita inmate expenditures (196,134)
18,476,246 0 (33,839) (252,080) 18,190,327 285,919
Community Corrections 14,532,087Personnel-Salary & Benefits Other (53,023) 49,842 Stipend Payment Revisions (4,982) Operating Supplies and Expenses Other 28,426
14,532,087 - (53,023) 73,286 14,552,350 (20,263)
Total 183,293,277 523,480 (648,311) 2,373,697 185,542,143 (1,725,386)
92

Changes to FY 2013 Enacted Agency General Revenue Expenditures
FY2013 Enacted Reappropriation/ Distribution Final FY 2013 Projected Appropriation Appropriation of Medical Enacted Final Surplus/
Transfer Holiday Savings Changes Appropriation (Deficit)
JudiciarySupreme Court 25,969,098 135,941 -
General Revenues (62,467) (135,941) Personnel-Salary & Benefits (6,301) Contract Services (290,863) Operating/Capital (133,008) Judges Pensions (29,547) Defense of Indigents 3,562,240 -
29,531,338 135,941 (62,467) (595,660) 29,009,152 658,127
Superior Court 21,932,328 - Personnel-Salary & Benefits (58,413) (740,409) Contract Services 7,821 Operating 97,293 Judges Pensions 248,700
21,932,328 - (58,413) (386,595) 21,487,320 445,008
Family Court 18,044,955 - Personnel-Salary & Benefits (64,350) (28,278) Contract Services 95,560 Operating 68,955 Judges Pensions (86,138)
18,044,955 - (64,350) 50,099 18,030,704 14,251
District Court 11,435,878 - Personnel-Salary & Benefits (39,398) (82,508) Contract Services 9,199 Operating 75 Judges Pensions (25,961)
11,435,878 - (39,398) (99,195) 11,297,285 138,593
Traffic Tribunal 8,191,888 - Personnel-Salary & Benefits (30,271) (135,778) Contract Services 807 Operating 9,740 Judges Pensions (102,803)
8,191,888 - (30,271) (228,034) 7,933,583 258,305
Judicial Tenure and Discipline 113,609 ($217)113,609 (217) - 113,392 217
Total 89,249,996 135,941 (255,116) (1,259,385) 87,871,436 1,514,501
Military StaffNational Guard 1,516,835
Personnel-Salary & Benefits (3,625) (41,196) Contract-Buildings & Grounds Maintenance 26,835 Insurance (18,853) Electricity-Quonset Point Tower 10,500 Fuel Oil 7,783 Sewer/Water/Electricity 7,460 Other Operating 6,026 Armory Maintenance 175 Hurricane Sandy - Agency Reimbursement 82,625 Funeral Honors 18,400
1,516,835 - (3,625) 99,755 1,612,965 (96,130)
Emergency Management 2,031,940Personnel-Salary & Benefits (4,075) (34,430) Travel 8,400 Telecommunications 6,524 Hurricane Sandy - Agency Reimbursement 25,000 Other Operating 2,376
2,031,940 - (4,075) 7,870 2,035,735 (3,795)
Total 3,548,775 - (7,700) 107,625 3,648,700 (99,925)
93
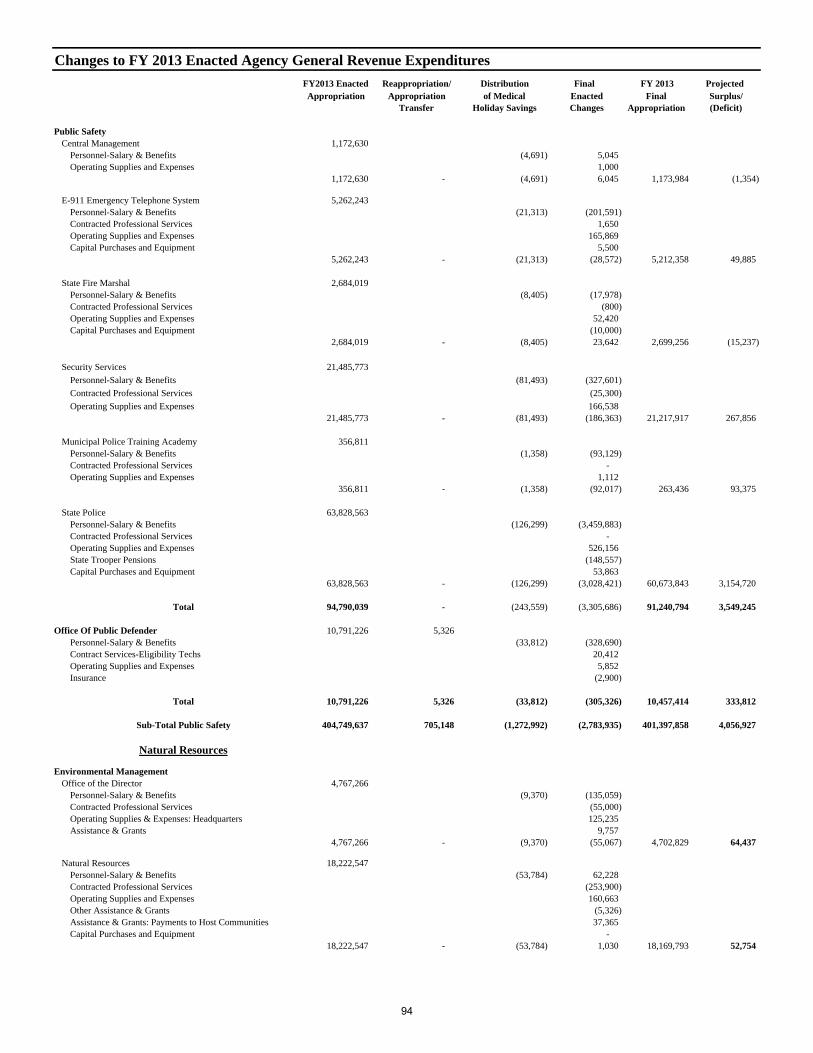
Changes to FY 2013 Enacted Agency General Revenue Expenditures
FY2013 Enacted Reappropriation/ Distribution Final FY 2013 Projected Appropriation Appropriation of Medical Enacted Final Surplus/
Transfer Holiday Savings Changes Appropriation (Deficit)
Public SafetyCentral Management 1,172,630
Personnel-Salary & Benefits (4,691) 5,045 Operating Supplies and Expenses 1,000
1,172,630 - (4,691) 6,045 1,173,984 (1,354)
E-911 Emergency Telephone System 5,262,243Personnel-Salary & Benefits (21,313) (201,591) Contracted Professional Services 1,650 Operating Supplies and Expenses 165,869 Capital Purchases and Equipment 5,500
5,262,243 - (21,313) (28,572) 5,212,358 49,885
State Fire Marshal 2,684,019Personnel-Salary & Benefits (8,405) (17,978) Contracted Professional Services (800) Operating Supplies and Expenses 52,420 Capital Purchases and Equipment (10,000)
2,684,019 - (8,405) 23,642 2,699,256 (15,237)
Security Services 21,485,773
Personnel-Salary & Benefits (81,493) (327,601)
Contracted Professional Services (25,300)
Operating Supplies and Expenses 166,538 21,485,773 - (81,493) (186,363) 21,217,917 267,856
Municipal Police Training Academy 356,811Personnel-Salary & Benefits (1,358) (93,129) Contracted Professional Services - Operating Supplies and Expenses 1,112
356,811 - (1,358) (92,017) 263,436 93,375
State Police 63,828,563Personnel-Salary & Benefits (126,299) (3,459,883) Contracted Professional Services - Operating Supplies and Expenses 526,156 State Trooper Pensions (148,557) Capital Purchases and Equipment 53,863
63,828,563 - (126,299) (3,028,421) 60,673,843 3,154,720
Total 94,790,039 - (243,559) (3,305,686) 91,240,794 3,549,245
Office Of Public Defender 10,791,226 5,326 Personnel-Salary & Benefits (33,812) (328,690) Contract Services-Eligibility Techs 20,412 Operating Supplies and Expenses 5,852 Insurance (2,900)
Total 10,791,226 5,326 (33,812) (305,326) 10,457,414 333,812
Sub-Total Public Safety 404,749,637 705,148 (1,272,992) (2,783,935) 401,397,858 4,056,927
Natural Resources
Environmental ManagementOffice of the Director 4,767,266
Personnel-Salary & Benefits (9,370) (135,059) Contracted Professional Services (55,000) Operating Supplies & Expenses: Headquarters 125,235 Assistance & Grants 9,757
4,767,266 - (9,370) (55,067) 4,702,829 64,437
Natural Resources 18,222,547Personnel-Salary & Benefits (53,784) 62,228 Contracted Professional Services (253,900) Operating Supplies and Expenses 160,663 Other Assistance & Grants (5,326) Assistance & Grants: Payments to Host Communities 37,365 Capital Purchases and Equipment -
18,222,547 - (53,784) 1,030 18,169,793 52,754
94

Changes to FY 2013 Enacted Agency General Revenue Expenditures
FY2013 Enacted Reappropriation/ Distribution Final FY 2013 Projected Appropriation Appropriation of Medical Enacted Final Surplus/
Transfer Holiday Savings Changes Appropriation (Deficit)
Environmental Protection 11,556,487Personnel-Salary & Benefits (43,625) (76,090) Operating Supplies and Expenses (3,037) Assistance & Grants (60,000) Capital Purchases and Equipment 15,000
11,556,487 - (43,625) (124,127) 11,388,735 167,752
Total 34,546,300 - (106,779) (178,164) 34,261,357 284,943
Coastal Resources Management Council 2,264,841Personnel-Salary & Benefits (9,000) (50,580) Shift Legal Services to Federal Funds (30,000) ATV Purchase-Hurricane Sandy 10,000
Total 2,264,841 - (9,000) (70,580) 2,185,261 79,580
Sub-Total Environment 36,811,141 - (115,779) (248,744) 36,446,618 364,523
Statewide General Revenue Total 3,295,836,490 7,872,953 (3,339,362) (66,558,823) 3,233,811,258 69,518,592
95
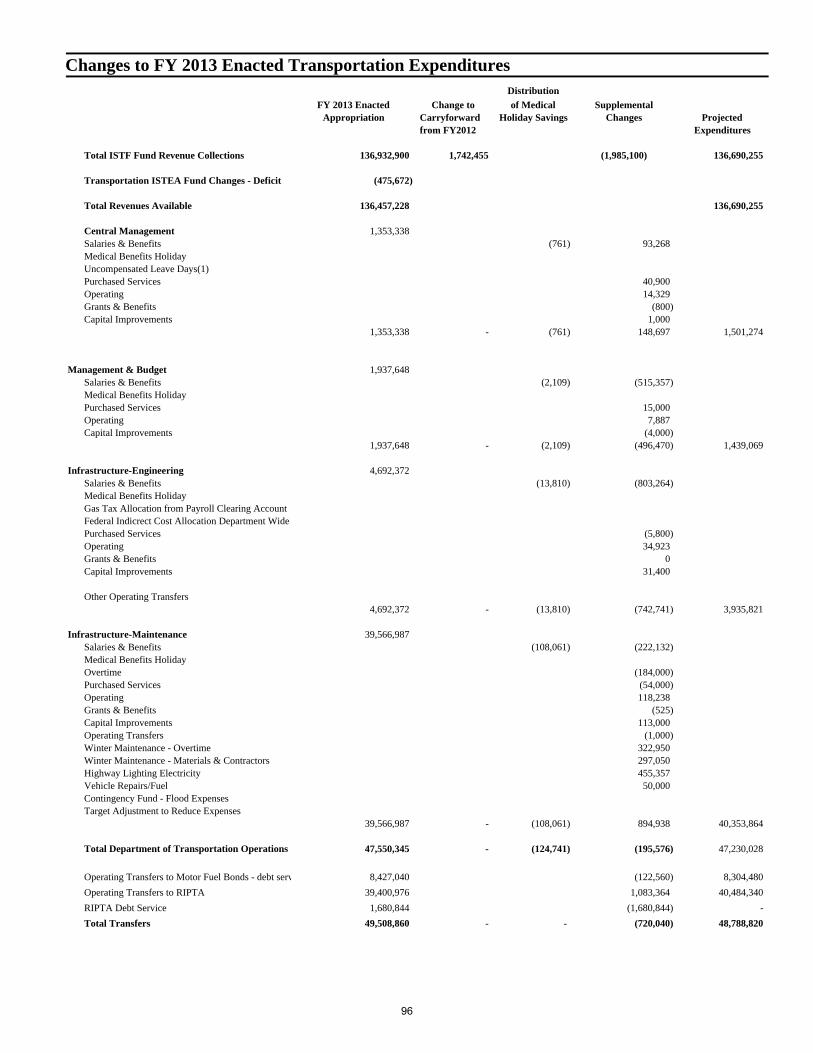
Changes to FY 2013 Enacted Transportation ExpendituresDistribution
FY 2013 Enacted Change to of Medical SupplementalAppropriation Carryforward Holiday Savings Changes Projected
from FY2012 Expenditures
Total ISTF Fund Revenue Collections 136,932,900 1,742,455 (1,985,100) 136,690,255
Transportation ISTEA Fund Changes - Deficit (475,672)
Total Revenues Available 136,457,228 136,690,255
Central Management 1,353,338 Salaries & Benefits (761) 93,268Medical Benefits HolidayUncompensated Leave Days(1)Purchased Services 40,900Operating 14,329Grants & Benefits (800)Capital Improvements 1,000
1,353,338 - (761) 148,697 1,501,274
Management & Budget 1,937,648 Salaries & Benefits (2,109) (515,357)Medical Benefits HolidayPurchased Services 15,000Operating 7,887Capital Improvements (4,000)
1,937,648 - (2,109) (496,470) 1,439,069
Infrastructure-Engineering 4,692,372 Salaries & Benefits (13,810) (803,264)Medical Benefits HolidayGas Tax Allocation from Payroll Clearing AccountFederal Indicrect Cost Allocation Department WidePurchased Services (5,800)Operating 34,923Grants & Benefits 0Capital Improvements 31,400
Other Operating Transfers4,692,372 - (13,810) (742,741) 3,935,821
Infrastructure-Maintenance 39,566,987 Salaries & Benefits (108,061) (222,132)Medical Benefits HolidayOvertime (184,000)Purchased Services (54,000)Operating 118,238Grants & Benefits (525)Capital Improvements 113,000Operating Transfers (1,000)Winter Maintenance - Overtime 322,950Winter Maintenance - Materials & Contractors 297,050Highway Lighting Electricity 455,357Vehicle Repairs/Fuel 50,000Contingency Fund - Flood ExpensesTarget Adjustment to Reduce Expenses
39,566,987 - (108,061) 894,938 40,353,864
Total Department of Transportation Operations 47,550,345 - (124,741) (195,576) 47,230,028
Operating Transfers to Motor Fuel Bonds - debt serv 8,427,040 (122,560) 8,304,480
Operating Transfers to RIPTA 39,400,976 1,083,364 40,484,340
RIPTA Debt Service 1,680,844 (1,680,844) -
Total Transfers 49,508,860 - - (720,040) 48,788,820
96

Total Transportation 97,059,205 - (124,741) (915,616) 96,018,848
Gas tax budgeted outside DOT
DOT Debt service(est DOT refunding allocation) 34,317,954 105,435 34,423,389
Gas tax budgeted in DOA-planning 34,317,954 - - 105,435 34,423,389
Consolidations Transfer 2,208,990 (100,237) 2,108,753
Total Transfers 2,208,990 (100,237) 2,108,753
Gas Tax Budgeted outside of DOT 36,526,944 - - 5,198 36,532,142
DHS - Elderly Transportation 4,213,320 (61,080) 4,152,240
General Fund Transfer - -
Total ISTEA Fund 137,799,469 - (124,741) (971,498) 136,703,230
Change in Fund Balance (866,569) 1,742,455 124,741 (1,013,602) (12,975)1 Beginning Balance (475,672)
Ending Balance (1,342,241) 1,742,455 124,741 (1,013,602) (12,975)
1 Planned balance from FY 12 programmed into enacted budget
97

Aid to Cities and Towns/Schools


Formula Aid to Cities and Towns
The Payment-in-Lieu-of-Taxes (PILOT) program reimburses communities for 27.0 percent of what they would have collected in property taxes from certain designated tax exempt property (subject to appropriation). The final FY 2013 revised budget and the FY 2014 enacted budget is funded at $35.1 million, which represents a reimbursement rate of 22.04 percent in FY 2014. Data used to determine distribution amounts is updated annually to reflect the most recent data.
The Distressed Communities Relief Fund provides state assistance to municipalities with the highest property tax burdens relative to the wealth of taxpayers. Municipalities are eligible that meet the statutorily determined distressed test in three of four categories. The program is level funded at $10.4 million in FY 2013 and FY 2014.
Beginning in FY 2014 and continuing through FY 2016, Municipal Incentive Aid will provide a new category of state assistance with the purpose of encouraging municipalities to improve the sustainability of their retirement plans and to reduce unfunded liabilities. Municipalities would be eligible to receive aid in FY 2014 if: (1) the municipality has no locally-administered pension plan(s); or (2) the municipality notified plan participants, beneficiaries and others pursuant to RIGL 45-65, and submitted to the Department of Revenue a Funding Improvement Plan (“FIP”) approved by the plan sponsor and the governing body no later than June 1, 2013 for every locally-administered pension plan in the municipality; or (3) there exists a locally-administered pension plan(s) in the municipality, but either no FIP was required per RIGL 45-65 or a FIP is required, but the due date for submission of the FIP is after the March payment of state aid. To be eligible for Municipal Incentive Aid in FY 2015 and FY 2016, other provisions would apply. The aid is provided at $5.0 million for FY 2014.
The FY 2014 budget continues to provide funding for the Property Valuation Statistical Update Program, which reimburses cities and towns for legislatively mandated property valuation statistical updates on a per parcel basis. Funding for FY 2013 is estimated at $1 million. The projected FY 2014 funding is $516,615.
Funding for Aid to Local Libraries is level funded at $8.8 million in FY 2013 and FY 2014. In addition, funding for library construction aid is provided at $2.5 million in FY 2013 and FY 2014 to finance anticipated debt service or construction reimbursement obligations under this program.
The 1998 General Assembly enacted the Motor Vehicle Excise Tax Phase-Out legislation to phase out the excise tax on motor vehicles and trailers over an original seven year period. There have been various legislative changes to the legislation since its inception. For FY 2011 and thereafter, the General Assembly enacted legislation that mandates a $500 exemption for which the State will reimburse municipalities an amount subject to appropriation. The legislation further allows municipalities to provide an additional exemption; however, that additional exemption will not be subject to reimbursement. The Assembly removed the provision that restricted municipalities from taxing the difference in the event that the value of a vehicle is higher than the prior fiscal year. It also allowed for rates and ratios of assessment to be lowered from the current frozen levels. Total funding enacted in FY 2013 and FY 2014 to support this program is $10.0 million. Data used to determine distribution amounts for FY 2014 is an estimate and is subject to change once finalized December 31, 2012 motor vehicle tax rolls are received.
The Public Service Corporation Tax is for tangible personal property of telegraph, cable and telecommunications corporations and express corporations that is exempt from local taxation, and instead is subject to taxation by the State. The revenue from this tax flows through the State (it is not appropriated by the State). The revenues (apart from some administrative expenses) are apportioned to the cities and towns based on the ratio of each municipality’s population relative to the total population of the State. The actual
98
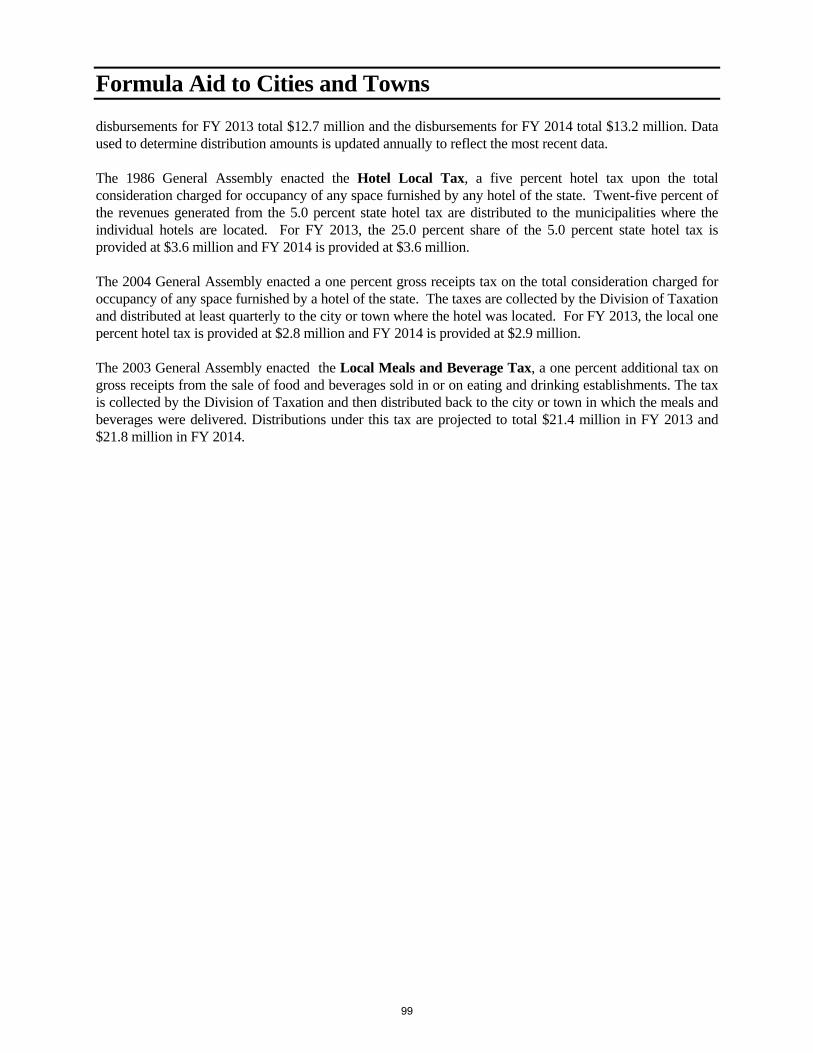
Formula Aid to Cities and Towns
disbursements for FY 2013 total $12.7 million and the disbursements for FY 2014 total $13.2 million. Data used to determine distribution amounts is updated annually to reflect the most recent data.
The 1986 General Assembly enacted the Hotel Local Tax, a five percent hotel tax upon the total consideration charged for occupancy of any space furnished by any hotel of the state. Twent-five percent of the revenues generated from the 5.0 percent state hotel tax are distributed to the municipalities where the individual hotels are located. For FY 2013, the 25.0 percent share of the 5.0 percent state hotel tax is provided at $3.6 million and FY 2014 is provided at $3.6 million.
The 2004 General Assembly enacted a one percent gross receipts tax on the total consideration charged for occupancy of any space furnished by a hotel of the state. The taxes are collected by the Division of Taxation and distributed at least quarterly to the city or town where the hotel was located. For FY 2013, the local one percent hotel tax is provided at $2.8 million and FY 2014 is provided at $2.9 million.
The 2003 General Assembly enacted the Local Meals and Beverage Tax, a one percent additional tax on gross receipts from the sale of food and beverages sold in or on eating and drinking establishments. The tax is collected by the Division of Taxation and then distributed back to the city or town in which the meals and beverages were delivered. Distributions under this tax are projected to total $21.4 million in FY 2013 and $21.8 million in FY 2014.
99
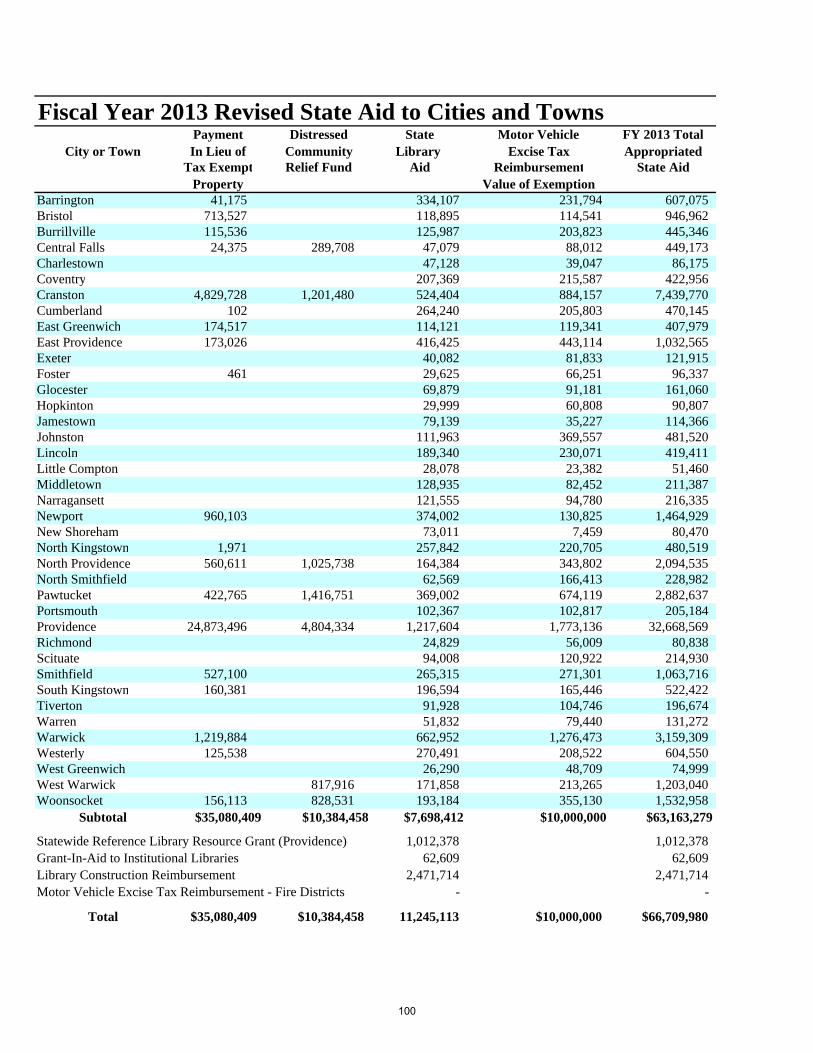
Fiscal Year 2013 Revised State Aid to Cities and TownsPayment Distressed State Motor Vehicle FY 2013 Total
City or Town In Lieu of Community Library Excise Tax AppropriatedTax Exempt Relief Fund Aid Reimbursement State Aid
Property Value of ExemptionBarrington 41,175 334,107 231,794 607,075 Bristol 713,527 118,895 114,541 946,962 Burrillville 115,536 125,987 203,823 445,346 Central Falls 24,375 289,708 47,079 88,012 449,173 Charlestown 47,128 39,047 86,175 Coventry 207,369 215,587 422,956 Cranston 4,829,728 1,201,480 524,404 884,157 7,439,770 Cumberland 102 264,240 205,803 470,145 East Greenwich 174,517 114,121 119,341 407,979 East Providence 173,026 416,425 443,114 1,032,565 Exeter 40,082 81,833 121,915 Foster 461 29,625 66,251 96,337 Glocester 69,879 91,181 161,060 Hopkinton 29,999 60,808 90,807 Jamestown 79,139 35,227 114,366 Johnston 111,963 369,557 481,520 Lincoln 189,340 230,071 419,411 Little Compton 28,078 23,382 51,460 Middletown 128,935 82,452 211,387 Narragansett 121,555 94,780 216,335 Newport 960,103 374,002 130,825 1,464,929 New Shoreham 73,011 7,459 80,470 North Kingstown 1,971 257,842 220,705 480,519 North Providence 560,611 1,025,738 164,384 343,802 2,094,535 North Smithfield 62,569 166,413 228,982 Pawtucket 422,765 1,416,751 369,002 674,119 2,882,637 Portsmouth 102,367 102,817 205,184 Providence 24,873,496 4,804,334 1,217,604 1,773,136 32,668,569 Richmond 24,829 56,009 80,838 Scituate 94,008 120,922 214,930 Smithfield 527,100 265,315 271,301 1,063,716 South Kingstown 160,381 196,594 165,446 522,422 Tiverton 91,928 104,746 196,674 Warren 51,832 79,440 131,272 Warwick 1,219,884 662,952 1,276,473 3,159,309 Westerly 125,538 270,491 208,522 604,550 West Greenwich 26,290 48,709 74,999 West Warwick 817,916 171,858 213,265 1,203,040 Woonsocket 156,113 828,531 193,184 355,130 1,532,958
Subtotal $35,080,409 $10,384,458 $7,698,412 $10,000,000 $63,163,279 Statewide Reference Library Resource Grant (Providence) 1,012,378 1,012,378 Grant-In-Aid to Institutional Libraries 62,609 62,609 Library Construction Reimbursement 2,471,714 2,471,714 Motor Vehicle Excise Tax Reimbursement - Fire Districts - -
Total $35,080,409 $10,384,458 11,245,113 $10,000,000 $66,709,980
100

Fiscal Year 2013 Revised Pass Through Aid-Cities & TownsPublic Service Meals and FY 2013 Total FY 2013 Total
City or Town Corporation Hotel Beverage Shared Taxes Shared & Tax Tax* Tax State Aid Appropriated Aid
Barrington 196,291 - 138,454 334,745 941,820Bristol 276,252 29,776 347,384 653,412 1,600,375Burrillville 192,019 - 173,580 365,599 810,945Central Falls 233,190 - 102,444 335,634 784,807Charlestown 94,198 19,966 108,638 222,801 308,977Coventry 421,394 69,449 366,500 857,344 1,280,300Cranston 967,459 9,036 1,493,970 2,470,466 9,910,235Cumberland 403,245 - 384,987 788,232 1,258,377East Greenwich 158,212 361 476,936 635,509 1,043,487East Providence 566,091 35,027 805,136 1,406,254 2,438,819Exeter 77,325 - 75,051 152,376 274,290Foster 55,433 129 14,368 69,930 166,268Glocester 117,293 1,779 71,566 190,638 351,698Hopkinton 98,543 - 48,443 146,986 237,793Jamestown 65,049 10,043 82,692 157,784 272,149Johnston 346,235 6,433 473,593 826,261 1,307,781Lincoln 253,999 88,333 694,452 1,036,784 1,456,196Little Compton 42,026 8,602 33,125 83,753 135,213Middletown 194,366 601,281 621,542 1,417,189 1,628,575Narragansett 190,972 78,698 545,111 814,782 1,031,117Newport 296,928 1,696,362 1,871,251 3,864,541 5,329,470New Shoreham 12,649 227,415 261,399 501,463 581,933North Kingstown 318,759 63,937 472,541 855,237 1,335,755North Providence 386,059 - 340,576 726,635 2,821,170North Smithfield 144,023 2,524 185,390 331,936 560,919Pawtucket 856,267 42,468 684,518 1,583,252 4,465,890Portsmouth 209,277 8,260 176,241 393,778 598,962Providence 2,142,738 1,715,451 4,534,406 8,392,595 41,061,164 Richmond 92,766 3,415 118,958 215,139 295,977Scituate 124,310 3,912 61,492 189,713 404,643Smithfield 257,910 128,154 569,507 955,571 2,019,287South Kingstown 368,741 122,858 635,917 1,127,516 1,649,938Tiverton 189,913 - 193,016 382,929 579,603Warren 127,704 - 246,894 374,598 505,870Warwick 994,959 880,113 2,366,982 4,242,054 7,401,363Westerly 274,242 326,165 718,374 1,318,781 1,923,331West Greenwich 73,835 83,091 99,849 256,775 331,774West Warwick 351,314 87,579 318,190 757,083 1,960,123Woonsocket 495,674 53,051 510,216 1,058,941 2,591,899
Subtotal $12,667,660 $6,403,667 $21,423,686 $40,495,013 $103,658,292
Statewide Reference Library Resource Grant 1,012,378 Grant-In-Aid to Institional Libraries 62,609 Library Construction Reimbursement 2,471,714 Motor Vehicle Excise Tax Reimbursement - Fire Districts -
Total $12,667,660 $6,403,667 $21,423,686 $40,495,013 $107,204,993
*Amount includes 1.0% local tax and 25.0% local share of state 5.0% tax.
101

Fiscal Year 2014 State Aid to Cities and TownsPayment Distressed Municipal State Motor Vehicle FY 2014 Total
City or Town In Lieu of Community Incentive Library Excise Tax AppropriatedTax Exempt Relief Fund Aid* Aid Reimbursement State Aid
Property Value of Exemption**
Barrington 13,387 77,873 341,149 253,456 685,864 Bristol 692,849 109,663 129,784 101,579 1,033,874 Burrillville 112,265 75,644 129,564 192,748 510,220 Central Falls 24,638 170,622 91,844 14,022 87,356 388,482 Charlestown 37,260 47,837 42,696 127,793 Coventry 166,126 215,315 235,735 617,176 Cranston 5,236,467 2,320,642 381,766 541,181 966,785 9,446,841 Cumberland 101 158,223 268,332 235,961 662,616 East Greenwich 204,947 62,403 121,963 90,440 479,752 East Providence 176,390 224,226 403,334 484,524 1,288,475 Exeter 30,874 41,703 89,481 162,058 Foster 372 21,699 31,569 55,664 109,304 Glocester 46,378 71,674 99,703 217,754 Hopkinton 38,721 34,084 66,491 139,295 Jamestown 25,703 80,467 23,683 129,853 Johnston 136,438 120,380 404,093 660,911 Lincoln 100,146 191,841 209,370 501,357 Little Compton 16,614 29,670 14,660 60,943 Middletown 76,967 135,566 73,198 285,731 Narragansett 75,677 123,055 65,718 264,449 Newport 1,101,495 116,689 378,526 84,173 1,680,882 New Shoreham 4,521 78,316 4,089 86,926 North Kingstown 1,941 125,831 263,710 197,458 588,939 North Providence 544,065 846,788 152,463 171,750 375,931 2,090,997 North Smithfield 56,226 63,341 181,965 301,532 Pawtucket 472,601 1,252,008 338,638 315,245 720,887 3,099,379 Portsmouth 82,157 103,446 84,872 270,475 Providence 24,227,138 4,429,560 845,052 1,182,779 1,737,590 32,422,119 Richmond 36,482 26,139 61,243 123,864 Scituate 48,940 95,169 74,943 219,051 Smithfield 537,747 101,774 269,659 275,736 1,184,915 South Kingstown 154,721 144,389 203,946 146,786 649,842 Tiverton 74,510 94,109 63,673 232,292 Warren 50,918 53,561 86,863 191,342 Warwick 1,226,062 394,570 688,368 1,270,121 3,579,121 Westerly 121,833 108,439 265,543 201,730 697,544 West Greenwich 28,597 27,126 53,261 108,984 West Warwick 675,775 138,805 147,770 197,021 1,159,371 Woonsocket 231,391 689,062 196,763 197,423 388,319 1,702,958
Subtotal $35,080,409 $10,384,458 $5,000,000 $7,698,416 $10,000,000 $68,163,283
Statewide Reference Library Resource Grant 1,012,378 1,012,378 Grant-In-Aid to Institional Libraries 62,609 62,609 Library Construction Reimbursement 2,500,667 2,500,667 Motor Vehicle Excise Tax Reimbursement - Fire Districts - -
Total $35,080,409 $10,384,458 $11,274,070 $10,000,000 $71,738,937
*To be eligible to receive incentive aid, municipalities must meet eligibility criteria.** Estimate as of 7/9/13. Subject to change in the spring of 2014 once finalized motor vehicle tax rolls are received from cities and towns.
102

Fiscal Year 2014 Pass Through Aid to Cities & TownsPublic Service Meals and FY 2014 Total FY 2014 Total
City or Town Corporation Hotel Beverage Shared Taxes Shared & Tax Tax* Tax State Aid Appropriated Aid
Barrington 205,617 - 140,738 346,356 1,032,220 Bristol 289,555 30,309 353,116 672,981 1,706,855 Burrillville 199,730 - 176,444 376,174 886,394 Central Falls 242,507 - 104,134 346,641 735,123 Charlestown 98,381 20,323 110,430 229,134 356,927 Coventry 438,642 70,692 372,548 881,882 1,499,058 Cranston 1,008,020 9,198 1,518,621 2,535,839 11,982,680 Cumberland 417,774 - 391,340 809,113 1,471,730 East Greenwich 164,770 367 484,805 649,942 1,129,694 East Providence 592,051 35,654 818,421 1,446,125 2,734,600 Exeter 81,520 - 76,289 157,809 319,867 Foster 57,295 132 14,605 72,032 181,336 Glocester 122,456 1,811 72,747 197,014 414,768 Hopkinton 102,239 - 49,242 151,481 290,776 Jamestown 67,867 10,222 84,057 162,146 291,998 Johnston 360,253 6,548 481,407 848,209 1,509,120 Lincoln 264,428 89,914 705,910 1,060,253 1,561,609 Little Compton 43,867 8,756 33,671 86,294 147,237 Middletown 203,225 612,044 631,797 1,447,066 1,732,796 Narragansett 199,818 80,107 554,106 834,031 1,098,480 Newport 308,107 1,726,727 1,902,127 3,936,960 5,617,843 New Shoreham 11,937 231,486 265,712 509,135 596,061 North Kingstown 332,245 65,082 480,338 877,664 1,466,603 North Providence 402,567 - 346,195 748,762 2,839,759 North Smithfield 148,460 2,569 188,449 339,478 641,010 Pawtucket 894,145 43,228 695,812 1,633,185 4,732,564 Portsmouth 216,929 8,408 179,149 404,485 674,960 Providence 2,231,291 1,746,158 4,609,224 8,586,672 41,008,791 Richmond 96,326 3,476 120,921 220,724 344,588 Scituate 129,220 3,982 62,506 195,708 414,759 Smithfield 268,724 130,448 578,904 978,076 2,162,991 South Kingstown 381,247 125,057 646,410 1,152,714 1,802,556 Tiverton 196,736 - 196,200 392,937 625,229 Warren 134,444 - 250,968 385,412 576,753 Warwick 1,041,829 895,867 2,406,037 4,343,732 7,922,853 Westerly 286,324 332,003 730,227 1,348,554 2,046,098 West Greenwich 75,508 84,578 101,497 261,583 370,566 West Warwick 366,504 89,146 323,440 779,091 1,938,462 Woonsocket 519,536 54,000 518,635 1,092,171 2,795,130
Subtotal $13,202,094 $6,518,292 $21,777,177 $41,497,564 $109,660,847
Statewide Reference Library Resource Grant (Providence) 1,012,378 Grant-In-Aid to Institional Libraries 62,609 Library Construction Reimbursement 2,500,667 Motor Vehicle Excise Tax Reimbursement - Fire Districts -
Total $13,202,094 $6,518,292 $21,777,177 $41,497,564 $113,236,501
*Amount includes 1.0% local tax and 25.0% local share of state 5.0% tax.
103

Changes in Formula Aid - FY 2014 vs. FY 2013 RevisedPayment Distressed Municipal State Motor Vehicle Total
City or Town In Lieu of Community Incentive Aid Library Excise Tax AppropriatedTax Exempt Relief Fund (New FY14) Aid Reimbursement Difference
Property Value of ExemptionBarrington (27,788) - 77,873 7,042 21,662 78,789 Bristol (20,678) - 109,663 10,889 (12,962) 86,912 Burrillville (3,271) - 75,644 3,577 (11,075) 64,875 Central Falls 263 (119,086) 91,844 (33,057) (655) (60,691) Charlestown - - 37,260 709 3,649 41,618 Coventry - - 166,126 7,946 20,147 194,219 Cranston 406,739 1,119,162 381,766 16,777 82,628 2,007,071 Cumberland (1) - 158,223 4,092 30,158 192,472 East Greenwich 30,430 - 62,403 7,842 (28,902) 71,773 East Providence 3,364 - 224,226 (13,091) 41,411 255,910 Exeter - - 30,874 1,621 7,648 40,143 Foster (89) - 21,699 1,944 (10,587) 12,967 Glocester - - 46,378 1,795 8,521 56,694 Hopkinton - - 38,721 4,085 5,683 48,488 Jamestown - - 25,703 1,328 (11,544) 15,487 Johnston - - 136,438 8,417 34,536 179,391 Lincoln - - 100,146 2,501 (20,702) 81,945 Little Compton - - 16,614 1,592 (8,722) 9,483 Middletown - - 76,967 6,631 (9,254) 74,344 Narragansett - - 75,677 1,500 (29,062) 48,114 Newport 141,392 - 116,689 4,524 (46,652) 215,953 New Shoreham - - 4,521 5,305 (3,370) 6,456 North Kingstown (30) - 125,831 5,868 (23,247) 108,421 North Providence (16,546) (178,951) 152,463 7,366 32,129 (3,538) North Smithfield - - 56,226 772 15,552 72,550 Pawtucket 49,837 (164,743) 338,638 (53,757) 46,768 216,742 Portsmouth - - 82,157 1,079 (17,946) 65,290 Providence (646,358) (374,774) 845,052 (34,825) (35,546) (246,451) Richmond - - 36,482 1,310 5,234 43,026 Scituate - - 48,940 1,161 (45,979) 4,121 Smithfield 10,647 - 101,774 4,344 4,436 121,200 South Kingstown (5,660) - 144,389 7,352 (18,661) 127,420 Tiverton - - 74,510 2,181 (41,072) 35,618 Warren - - 50,918 1,729 7,424 60,070 Warwick 6,178 - 394,570 25,416 (6,352) 419,812 Westerly (3,705) - 108,439 (4,948) (6,792) 92,994 West Greenwich - - 28,597 836 4,552 33,985 West Warwick - (142,141) 138,805 (24,088) (16,244) (43,668) Woonsocket 75,278 (139,469) 196,763 4,239 33,188 170,000
Subtotal ($0) ($0) 5,000,000 $4 $0 $5,000,004
Statewide Reference Library Resource Grant (Providence) - - Grant-In-Aid to Institutional Libraries - - Library Construction Reimbursement 28,953 28,953 Motor Vehicle Excise Tax Reimbursement - Fire Districts - -
Total ($0) ($0) 5,000,000 28,957 $0 $5,028,957
104
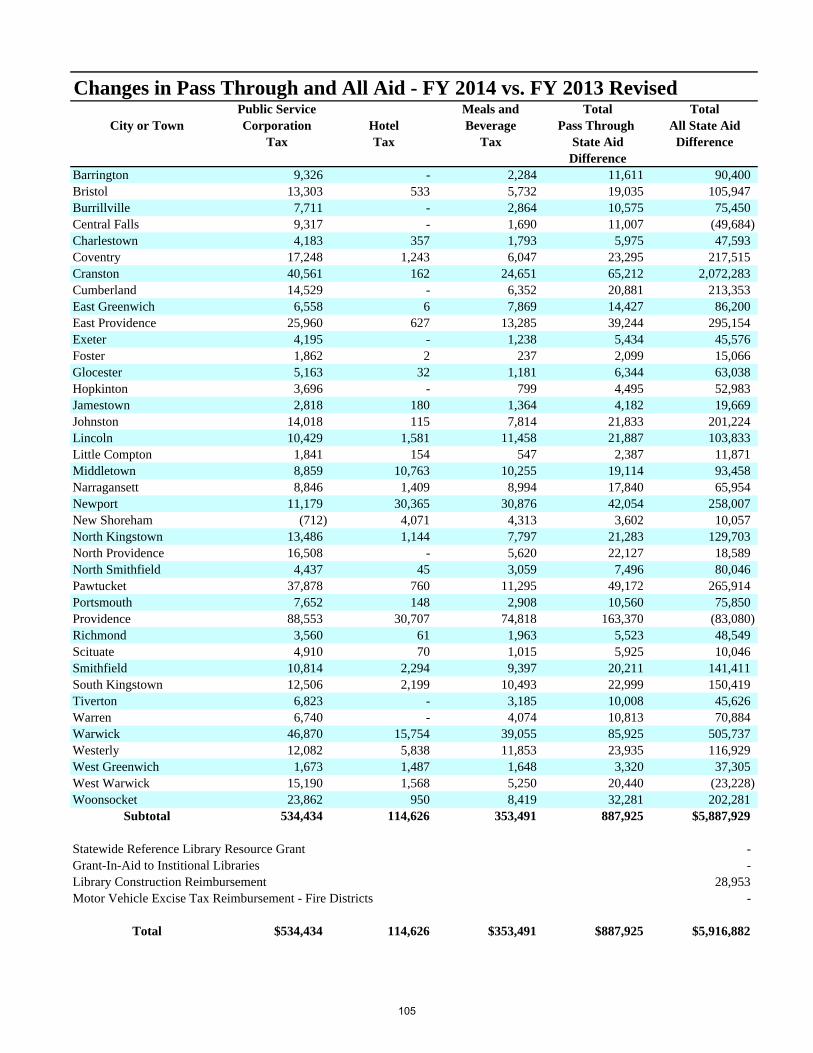
Changes in Pass Through and All Aid - FY 2014 vs. FY 2013 RevisedPublic Service Meals and Total Total
City or Town Corporation Hotel Beverage Pass Through All State AidTax Tax Tax State Aid Difference
DifferenceBarrington 9,326 - 2,284 11,611 90,400 Bristol 13,303 533 5,732 19,035 105,947 Burrillville 7,711 - 2,864 10,575 75,450 Central Falls 9,317 - 1,690 11,007 (49,684) Charlestown 4,183 357 1,793 5,975 47,593 Coventry 17,248 1,243 6,047 23,295 217,515 Cranston 40,561 162 24,651 65,212 2,072,283 Cumberland 14,529 - 6,352 20,881 213,353 East Greenwich 6,558 6 7,869 14,427 86,200 East Providence 25,960 627 13,285 39,244 295,154 Exeter 4,195 - 1,238 5,434 45,576 Foster 1,862 2 237 2,099 15,066 Glocester 5,163 32 1,181 6,344 63,038 Hopkinton 3,696 - 799 4,495 52,983 Jamestown 2,818 180 1,364 4,182 19,669 Johnston 14,018 115 7,814 21,833 201,224 Lincoln 10,429 1,581 11,458 21,887 103,833 Little Compton 1,841 154 547 2,387 11,871 Middletown 8,859 10,763 10,255 19,114 93,458 Narragansett 8,846 1,409 8,994 17,840 65,954 Newport 11,179 30,365 30,876 42,054 258,007 New Shoreham (712) 4,071 4,313 3,602 10,057 North Kingstown 13,486 1,144 7,797 21,283 129,703 North Providence 16,508 - 5,620 22,127 18,589 North Smithfield 4,437 45 3,059 7,496 80,046 Pawtucket 37,878 760 11,295 49,172 265,914 Portsmouth 7,652 148 2,908 10,560 75,850 Providence 88,553 30,707 74,818 163,370 (83,080) Richmond 3,560 61 1,963 5,523 48,549 Scituate 4,910 70 1,015 5,925 10,046 Smithfield 10,814 2,294 9,397 20,211 141,411 South Kingstown 12,506 2,199 10,493 22,999 150,419 Tiverton 6,823 - 3,185 10,008 45,626 Warren 6,740 - 4,074 10,813 70,884 Warwick 46,870 15,754 39,055 85,925 505,737 Westerly 12,082 5,838 11,853 23,935 116,929 West Greenwich 1,673 1,487 1,648 3,320 37,305 West Warwick 15,190 1,568 5,250 20,440 (23,228) Woonsocket 23,862 950 8,419 32,281 202,281
Subtotal 534,434 114,626 353,491 887,925 $5,887,929
Statewide Reference Library Resource Grant - Grant-In-Aid to Institional Libraries - Library Construction Reimbursement 28,953 Motor Vehicle Excise Tax Reimbursement - Fire Districts -
Total $534,434 114,626 $353,491 $887,925 $5,916,882
105

Education Aid to Local Units of Government
Education Aid to Local Units of Governments totals $944.8 million in FY 2014. This includes aid to the local education agencies (LEAs), state schools (Metropolitan Career and Technical School, Davies Career and Technical School, and the School for the Deaf), as well as state contributions for Teacher Retirement and Housing (school construction) Aid. Total education aid enacted in FY 2014 reflects an increase of $34.7 million from the revised FY 2013 budget. FY 2014 represents year three of the education aid funding formula. Distributed aid reflects funding formula calculations and group home aid to both districts and charter schools. Distributed education aid to districts increased by $21.4 million while aid to charter schools and the Urban Collaborative Accelerated Program increased by $8.7 million. The majority of the increase results from fully funding year three of the funding formula and reducing the overall total amount of funding remaining to be transitioned for underfunded districts by increasing those district’s FY 2014 base. Non-Distributed Aid Non-distributed aid increased by $2.3 million from revised FY 2013 levels. The overall change is driven by an increase in the Transportation categorical fund of $1.1 million; $500,000 for the Early Childhood Demonstration program; $500,000 for the High Cost Special Education categorical fund; $400,000 to offset the loss of revenue from the surcharge placed on all residence and business landlines to fund the Rhode Island Telecommunications Education Access Fund; and an initial investment of $250,000 to implement the Full-Day Kindergarten Pilot Program. This is partially offset by the three-year phase-out of the regionalization bonus for current regionalized districts, and no new districts have merged since the implementation of the funding formula. Remaining non-distributed aid consists of $240,000 for non-public textbook reimbursement and $270,000 for school breakfast administrative fees, which is consistent with FY 2013 levels. State Schools State financing of operations at the three state schools- the Davies Career and Technical School, the Rhode Island School for the Deaf, and the Met School- decreased in the FY 2014 budget by a combined total of $1.2 million as compared to the FY 2013 revised total. Davies and the Met fall under year three of the education aid funding formula, but School for the Deaf does not. Other Aid The FY 2014 budget also includes increases in other aid of $3.5 million. Specifically, an increase of $5.6 million in state contribution for teacher retirement is offset by a decrease of $2.1 million in school housing aid. Explanation of Tables- by Category and LEA The following two tables display education aid first by category, and then by apportionment among the state’s local and regional education authorities. FY 2014 is year three of the education aid funding formula passed into law by the 2010 session of the General Assembly. “Distributed LEA Aid” consists of the various categories of aid that are directly distributed to school districts on a regular (usually monthly) basis, such as Formula Aid and Group Home Funding. For completeness, financing of the Central Falls School District is also displayed in this section. “Non-Distributed Aid” includes several categories of aid that are either utilized at the departmental level or are not distributed regularly to school districts. “State Schools” include the Metropolitan School, Davies, and the School for the Deaf. On each table, “Other Aid” includes allocations for School Construction Aid and state contributions to the Teachers’ Retirement Fund.
106
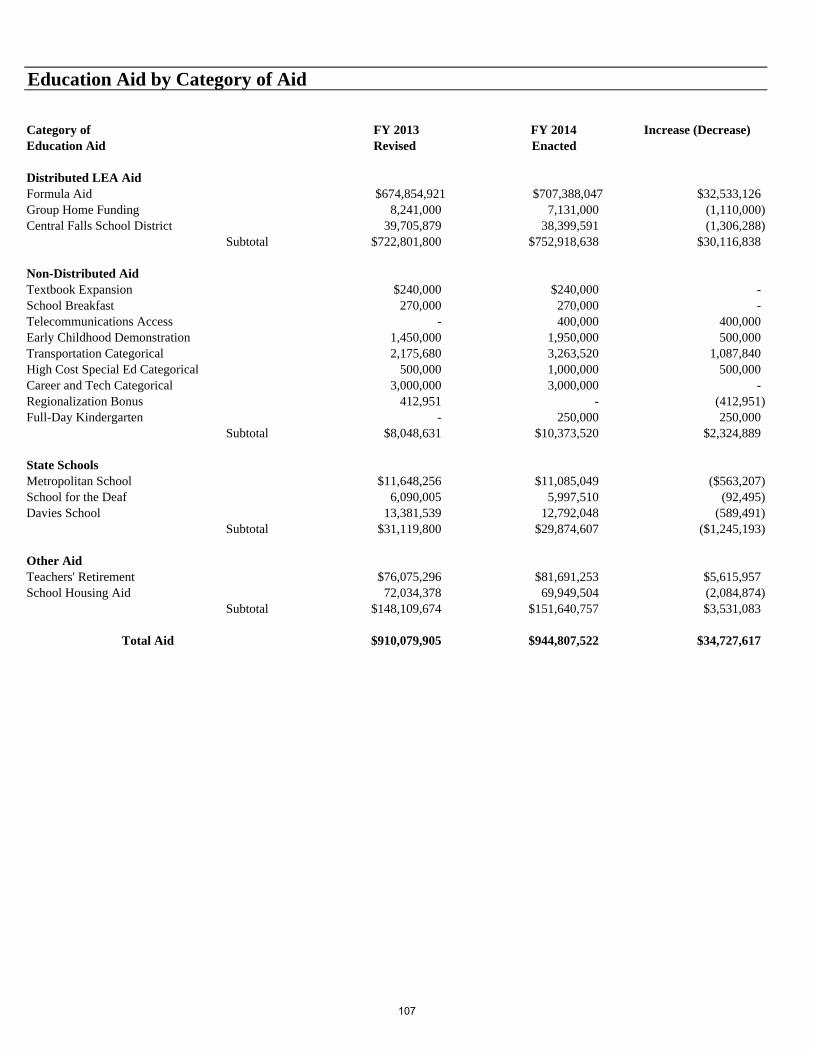
Education Aid by Category of Aid
Category of FY 2013 FY 2014 Increase (Decrease)Education Aid Revised Enacted
Distributed LEA AidFormula Aid $674,854,921 $707,388,047 $32,533,126Group Home Funding 8,241,000 7,131,000 (1,110,000)Central Falls School District 39,705,879 38,399,591 (1,306,288)
Subtotal $722,801,800 $752,918,638 $30,116,838
Non-Distributed AidTextbook Expansion $240,000 $240,000 - School Breakfast 270,000 270,000 - Telecommunications Access - 400,000 400,000Early Childhood Demonstration 1,450,000 1,950,000 500,000Transportation Categorical 2,175,680 3,263,520 1,087,840High Cost Special Ed Categorical 500,000 1,000,000 500,000Career and Tech Categorical 3,000,000 3,000,000 - Regionalization Bonus 412,951 - (412,951)Full-Day Kindergarten - 250,000 250,000
Subtotal $8,048,631 $10,373,520 $2,324,889
State SchoolsMetropolitan School $11,648,256 $11,085,049 ($563,207)School for the Deaf 6,090,005 5,997,510 (92,495)Davies School 13,381,539 12,792,048 (589,491)
Subtotal $31,119,800 $29,874,607 ($1,245,193)
Other AidTeachers' Retirement $76,075,296 $81,691,253 $5,615,957School Housing Aid 72,034,378 69,949,504 (2,084,874)
Subtotal $148,109,674 $151,640,757 $3,531,083
Total Aid $910,079,905 $944,807,522 $34,727,617
107
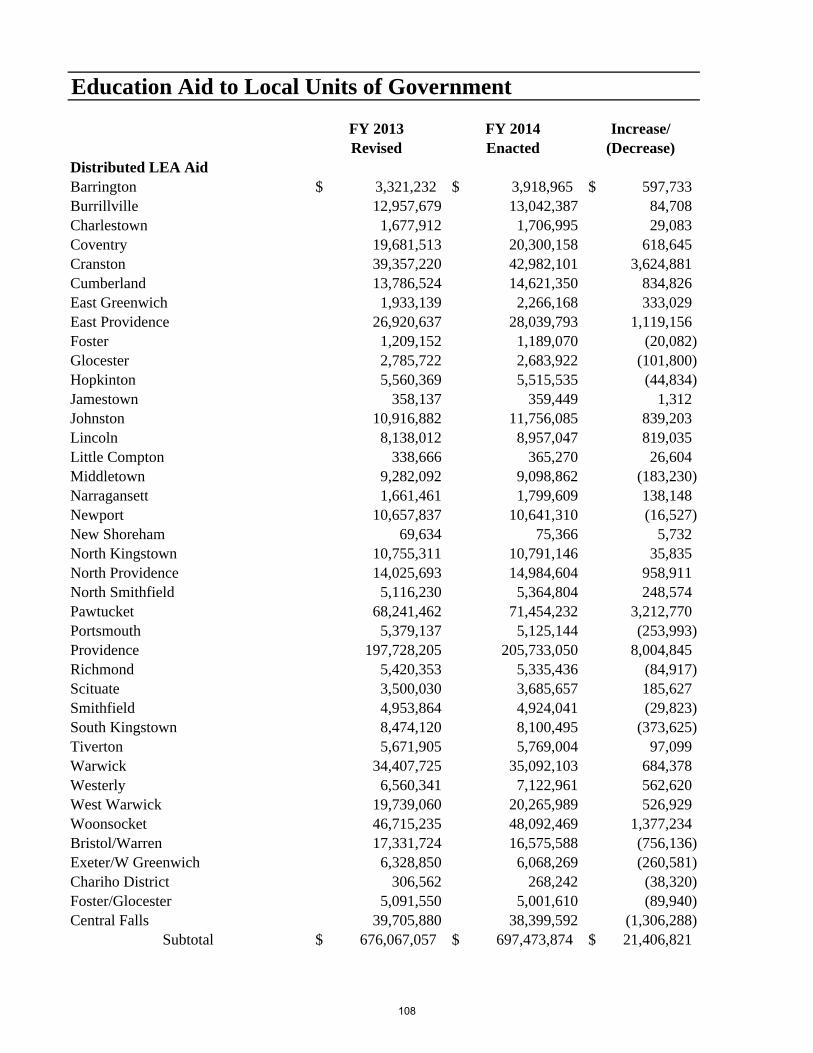
Education Aid to Local Units of Government
FY 2013 FY 2014 Increase/Revised Enacted (Decrease)
Distributed LEA AidBarrington 3,321,232$ 3,918,965$ 597,733$ Burrillville 12,957,679 13,042,387 84,708Charlestown 1,677,912 1,706,995 29,083Coventry 19,681,513 20,300,158 618,645Cranston 39,357,220 42,982,101 3,624,881Cumberland 13,786,524 14,621,350 834,826East Greenwich 1,933,139 2,266,168 333,029East Providence 26,920,637 28,039,793 1,119,156Foster 1,209,152 1,189,070 (20,082)Glocester 2,785,722 2,683,922 (101,800)Hopkinton 5,560,369 5,515,535 (44,834)Jamestown 358,137 359,449 1,312Johnston 10,916,882 11,756,085 839,203Lincoln 8,138,012 8,957,047 819,035Little Compton 338,666 365,270 26,604Middletown 9,282,092 9,098,862 (183,230)Narragansett 1,661,461 1,799,609 138,148Newport 10,657,837 10,641,310 (16,527)New Shoreham 69,634 75,366 5,732North Kingstown 10,755,311 10,791,146 35,835North Providence 14,025,693 14,984,604 958,911North Smithfield 5,116,230 5,364,804 248,574Pawtucket 68,241,462 71,454,232 3,212,770Portsmouth 5,379,137 5,125,144 (253,993)Providence 197,728,205 205,733,050 8,004,845Richmond 5,420,353 5,335,436 (84,917)Scituate 3,500,030 3,685,657 185,627Smithfield 4,953,864 4,924,041 (29,823)South Kingstown 8,474,120 8,100,495 (373,625)Tiverton 5,671,905 5,769,004 97,099Warwick 34,407,725 35,092,103 684,378Westerly 6,560,341 7,122,961 562,620West Warwick 19,739,060 20,265,989 526,929Woonsocket 46,715,235 48,092,469 1,377,234Bristol/Warren 17,331,724 16,575,588 (756,136)Exeter/W Greenwich 6,328,850 6,068,269 (260,581)Chariho District 306,562 268,242 (38,320)Foster/Glocester 5,091,550 5,001,610 (89,940)Central Falls 39,705,880 38,399,592 (1,306,288)
Subtotal 676,067,057$ 697,473,874$ 21,406,821$
108

Education Aid to Local Units of Government
FY 2013 FY 2014 Increase/Revised Recommend (Decrease)
Distributed LEA AidAchievement First -$ 1,745,202$ 1,745,202$ Beacon Charter School 1,694,107 1,682,079 (12,028)Blackstone Academy 1,588,944 1,619,062 30,118Compass School 579,647 561,195 (18,452)Greene School 898,333 892,101 (6,232)Highlander 2,733,717 3,331,257 597,540International Charter School 2,876,846 2,867,619 (9,227)Kingston Hill Academy 689,636 653,830 (35,806)Learning Community 6,095,627 6,122,147 26,520New England Laborers 1,255,888 1,230,541 (25,347)Nowell Academy - 1,573,568 1,573,568Nurses Institute 1,633,673 2,478,686 845,013Paul Cuffee Charter School 7,588,913 7,962,677 373,764RIMA Blackstone Valley 6,076,368 7,818,591 1,742,223Segue Institute for Learning 2,572,083 2,596,191 24,108Textron 2,323,013 2,342,238 19,225Times 2 Academy 7,054,405 7,013,322 (41,083)Trinity Academy 1,073,542 1,448,044 374,502Village Green - 1,209,709 1,209,709
Subtotal 46,734,743$ 55,148,061$ 8,413,318$
Urban Collaborative -$ 296,703$ 296,703$
Distributed LEA Subtotal 722,801,800$ 752,918,638$ 30,116,842$
FY 2013 FY 2014 DifferenceRevised Recommend
Non-Distributed AidTextbook Expansion 240,000$ 240,000$ -$ School Breakfast 270,000 270,000 - Telecommunications Access - 400,000 400,000 Early Childhood Demonstration 1,450,000 1,950,000 500,000 Transportation Categorical 2,175,680 3,263,520 1,087,840 High Cost Special Ed Categorical 500,000 1,000,000 500,000 Career and Tech Categorical 3,000,000 3,000,000 - Regionalization Bonus 412,951 - (412,951) Full-Day Kindergarten - 250,000 250,000
Subtotal 8,048,631$ 10,373,520$ 2,324,889$
109

Education Aid to Local Units of Government
State SchoolsMetropolitan School 11,648,256$ 11,085,049$ (563,207)$ School for the Deaf 6,090,005 5,997,510 (92,495) Davies School 13,381,539 12,792,048 (589,491)
Subtotal 31,119,800$ 29,874,607$ (1,245,193)$
Other AidTeachers' Retirement 76,075,296$ 81,691,253$ 5,615,957$ School Housing Aid 72,034,378 69,949,504 (2,084,874)
Subtotal 148,109,674$ 151,640,757$ 3,531,083$
Total 910,079,905$ 944,807,522$ 34,727,617$
110


RI Capital Plan Fund

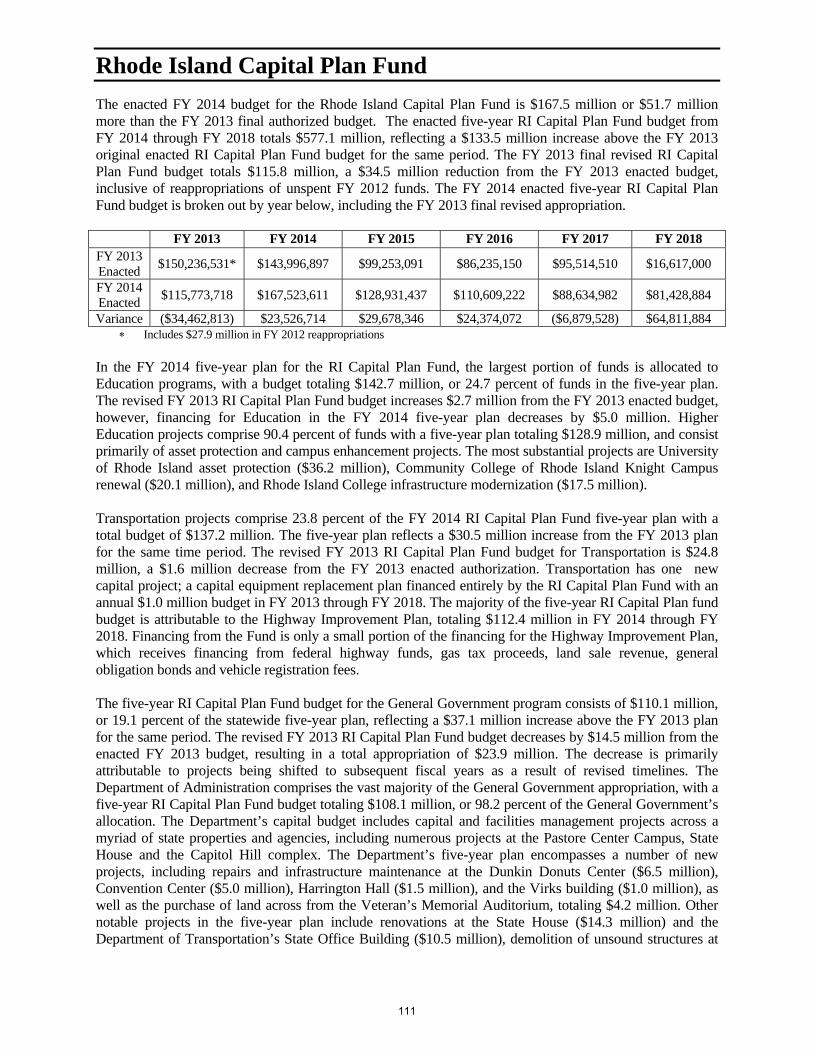
Rhode Island Capital Plan Fund
The enacted FY 2014 budget for the Rhode Island Capital Plan Fund is $167.5 million or $51.7 million more than the FY 2013 final authorized budget. The enacted five-year RI Capital Plan Fund budget from FY 2014 through FY 2018 totals $577.1 million, reflecting a $133.5 million increase above the FY 2013 original enacted RI Capital Plan Fund budget for the same period. The FY 2013 final revised RI Capital Plan Fund budget totals $115.8 million, a $34.5 million reduction from the FY 2013 enacted budget, inclusive of reappropriations of unspent FY 2012 funds. The FY 2014 enacted five-year RI Capital Plan Fund budget is broken out by year below, including the FY 2013 final revised appropriation.
FY 2013 FY 2014 FY 2015 FY 2016 FY 2017 FY 2018 FY 2013Enacted
$150,236,531* $143,996,897 $99,253,091 $86,235,150 $95,514,510 $16,617,000
FY 2014Enacted
$115,773,718 $167,523,611 $128,931,437 $110,609,222 $88,634,982 $81,428,884
Variance ($34,462,813) $23,526,714 $29,678,346 $24,374,072 ($6,879,528) $64,811,884 ∗ Includes $27.9 million in FY 2012 reappropriations
In the FY 2014 five-year plan for the RI Capital Plan Fund, the largest portion of funds is allocated to Education programs, with a budget totaling $142.7 million, or 24.7 percent of funds in the five-year plan. The revised FY 2013 RI Capital Plan Fund budget increases $2.7 million from the FY 2013 enacted budget, however, financing for Education in the FY 2014 five-year plan decreases by $5.0 million. Higher Education projects comprise 90.4 percent of funds with a five-year plan totaling $128.9 million, and consist primarily of asset protection and campus enhancement projects. The most substantial projects are University of Rhode Island asset protection ($36.2 million), Community College of Rhode Island Knight Campus renewal ($20.1 million), and Rhode Island College infrastructure modernization ($17.5 million).
Transportation projects comprise 23.8 percent of the FY 2014 RI Capital Plan Fund five-year plan with a total budget of $137.2 million. The five-year plan reflects a $30.5 million increase from the FY 2013 plan for the same time period. The revised FY 2013 RI Capital Plan Fund budget for Transportation is $24.8 million, a $1.6 million decrease from the FY 2013 enacted authorization. Transportation has one new capital project; a capital equipment replacement plan financed entirely by the RI Capital Plan Fund with an annual $1.0 million budget in FY 2013 through FY 2018. The majority of the five-year RI Capital Plan fund budget is attributable to the Highway Improvement Plan, totaling $112.4 million in FY 2014 through FY 2018. Financing from the Fund is only a small portion of the financing for the Highway Improvement Plan, which receives financing from federal highway funds, gas tax proceeds, land sale revenue, general obligation bonds and vehicle registration fees.
The five-year RI Capital Plan Fund budget for the General Government program consists of $110.1 million, or 19.1 percent of the statewide five-year plan, reflecting a $37.1 million increase above the FY 2013 plan for the same period. The revised FY 2013 RI Capital Plan Fund budget decreases by $14.5 million from the enacted FY 2013 budget, resulting in a total appropriation of $23.9 million. The decrease is primarily attributable to projects being shifted to subsequent fiscal years as a result of revised timelines. The Department of Administration comprises the vast majority of the General Government appropriation, with a five-year RI Capital Plan Fund budget totaling $108.1 million, or 98.2 percent of the General Government’s allocation. The Department’s capital budget includes capital and facilities management projects across a myriad of state properties and agencies, including numerous projects at the Pastore Center Campus, State House and the Capitol Hill complex. The Department’s five-year plan encompasses a number of new projects, including repairs and infrastructure maintenance at the Dunkin Donuts Center ($6.5 million), Convention Center ($5.0 million), Harrington Hall ($1.5 million), and the Virks building ($1.0 million), as well as the purchase of land across from the Veteran’s Memorial Auditorium, totaling $4.2 million. Other notable projects in the five-year plan include renovations at the State House ($14.3 million) and the Department of Transportation’s State Office Building ($10.5 million), demolition of unsound structures at
111

RI Capital Plan Fund - Five Year Capital Plan As Enacted
FY 2014 FY 2015 FY 2016 FY 2017 FY 2018
General Government
Administration $42,532,174 $24,412,500 $17,357,500 $15,027,500 $8,817,500
Labor and Training 702,000 962,500 152,000 - -
Revenue 150,000 - - - -
Subtotal - General Government $43,384,174 $25,375,000 $17,509,500 $15,027,500 $8,817,500
Human Services
Children, Youth, and Families $1,590,000 $775,000 $492,000 - -
Human Services 165,000 165,000 165,000 165,000 165,000
Behavioral Healthcare, Developmental Disabilities, and Hospitals 10,600,431 18,306,406 20,705,161 8,625,000 4,450,000
Governor's Commission on Disabilities 1,000,000 1,000,000 2,000,000 2,000,000 2,000,000
Subtotal - Human Services $13,355,431 $20,246,406 $23,362,161 $10,790,000 $6,615,000
Education
Elementary and Secondary $7,561,187 $4,576,384 $1,002,996 $371,500 $250,000
Higher Education - Board of Governors 30,019,250 22,346,853 20,747,400 23,445,800 30,561,384
RI Atomic Energy Commission 50,000 50,000 50,000 50,000 50,000
Historical Preservation and Heritage Commission 1,000,000 575,000 - - -
Subtotal - Education $38,630,437 $27,548,237 $21,800,396 $23,867,300 $30,861,384
Public Safety
Attorney General $50,000 $150,000 $150,000 $150,000 $150,000
Corrections 17,469,751 12,440,794 10,913,415 5,926,432 3,160,000
Judicial 1,515,000 1,200,000 3,450,000 2,125,000 2,200,000
Military Staff 3,408,000 1,005,000 1,013,750 1,053,750 975,000
Public Safety 3,144,743 4,237,000 725,000 225,000 -
Subtotal - Public Safety $25,587,494 $19,032,794 $16,252,165 $9,480,182 $6,485,000
Natural Resources
Environmental Management $19,515,865 $5,775,000 $4,315,000 $3,000,000 $2,250,000
Coastal Resources Management Council - 1,000,000 - - -
Subtotal - Natural Resources $19,515,865 $6,775,000 $4,315,000 $3,000,000 $2,250,000
Transportation
Transportation $27,050,210 $29,954,000 $27,370,000 $26,470,000 $26,400,000
Subtotal - Transportation $27,050,210 $29,954,000 $27,370,000 $26,470,000 $26,400,000
Total Statewide $167,523,611 $128,931,437 $110,609,222 $88,634,982 $81,428,884
112

Five-Year Forecast

FY 2014 – FY 2018 Overview
Summary The Five-Year Financial Projection is prepared at the time of the Governor’s recommended budget submission pursuant to Section 35-3-1 of the Rhode Island General Laws, which requires that, the Budget Officer:
(6) Prepare a five-year financial projection of anticipated general revenue receipts and expenditures, including detail of principal revenue sources and expenditures by major program areas, which projection shall be included in the budget submitted to the general assembly pursuant to subsection 35-3-7.
The five-year financial projection presented in the following pages has been updated from the one prepared in January 2013 based on the final enacted budget for FY 2014. The projection includes tables that present anticipated revenues and expenditures for the five fiscal years ending in June 2018. Also included are tables that provide detail on the planning values used in these projections. The planning values reflect policy assumptions, as well as economic and demographic forecasts. The purpose of the five-year forecast is to provide a baseline fiscal outlook for the State of Rhode Island. Although the forecast may be used as a benchmark in assessing the affordability and desirability of alternative policy options, caution should be exercised in the interpretation of the forecast. Forward-looking estimates, such as those made in this forecast, are inherently subject to a variety of risks and uncertainties that could cause actual results to differ materially and adversely from those projected. Many of these risks, such as national economic and business conditions, political or legal impediments, are beyond the control of the State. The estimates and forecasts made here are as of the date they were prepared and will change as factors used in the forecasts change. From the FY 2014 budget base, expenditures will exceed revenues in each of the out-years projected through FY 2018. The projected operating deficits by fiscal year are as follows: $149.2 million in FY 2015, $215.3 million in FY 2016, $325.0 million in FY 2017, and $410.4 million in FY 2018. In percentage terms, the deficits are projected to range from 4.3 percent of spending in FY 2015 to 10.4 percent of spending in FY 2018. The expenditure-side of the budget is estimated to increase at an average annual rate 4.0 percent from the FY 2014 base to FY 2018. Inflation, however, as measured by the United States consumer price index for all urban consumers (CPI-U), is expected to grow at an average annual rate of 2.3 percent over this same period. The Governor is constitutionally obligated to submit and the General Assembly to enact a balanced budget. As such, the deficits projected in any given fiscal year in this five year projection are not carried over to an ensuing year under the expectation that such deficits will be resolved in the respective fiscal year. Projected out year revenues are significantly impacted by the expected opening of gaming facilities in Massachusetts in the coming years. Lottery transfers to the State general fund are projected to diminish by a total of $293.2 million over the five year forecast period, due to the increased competition to Rhode Island’s gaming facilities in Lincoln and Newport. Without this impact on Rhode Island’s revenues, the five year forecast would show deficits of $149.2 million in FY 2015, $165.9 million in FY 2016, $220.6 million in FY 2017, and $278.9 million in FY 2018. The five year projection anticipates average annual general revenue growth of approximately 1.8 percent beyond the budget year, based upon the adopted May 2013 Revenue Estimating Conference forecast for the Rhode Island economy and the enacted revenues. The forecast underlying the five year projection assumes
113

FY 2014 – FY 2018 Overview
that the recovery in the Rhode Island economy which started in FY 2011 will regain momentum in FY 2014 and FY 2015. The underlying forecasts in FY 2014 anticipate significant growth for wage and salaries and personal income, while the FY 2015 forecasts assumes acceleration in non-farm employment growth and a decrease in the unemployment rate.
On the expenditure side, average annual growth is projected to be 4.0 percent over the forecast period. This is comprised of average annual growth of 2.6 percent for personnel and operating, 5.3 percent for grants and benefits, 3.3 percent for local aid and 7.7 percent for debt service.
The wage projections contained in the personnel estimates assume no cost of living adjustment (COLA) in FY 2015, as none has been negotiated with the state employee unions. As a proxy for any negotiated COLAs, CPI has been used in FY 2016 and thereafter and an additional 0.75 percent increase has been used for step and educational incentive increases that occur annually.
Grants and Benefits are projected to increase by an average of 5.3 percent annually from FY 2014 to FY 2018. This growth rate results in an increase of $267.5 million in this category of spending over the five year horizon. The growth rates used in the five year forecast were derived from state-specific Medicaid expenditure projections released by the Centers for Medicaid and Medicare Services (CMS) in June 2012. As these are national projections, they may or may not be valid for Rhode Island, but lacking more regionally applicable data, the State Budget Office selected these growth rates for use in this year’s five year projections. Several projections under this section also use the CPI-U, particularly with respect to programs of (non-Medicaid) cash assistance.
The forecast takes into consideration changes made to the Medicaid programs in the enacted budget, including expansions authorized under the Affordable Care Act, which are fully funded with federal dollars until January 2017, at which time some state participation will be required.
Local aid increases are primarily driven by continued phase-in of the education funding formula, which results in increased expenditures of $147.8 million over the five year period. Other aid programs, such as PILOT, Distressed Communities Relief and Motor Vehicle Tax Reimbursements are assumed to remain level at the FY 2014 enacted appropriations. The new Municipal Incentive Aid program is assumed to remain in effect at $5.0 million through FY 2016 and then sunset.
Finally, general revenue funded debt service is projected to increase by $63.2 million over the forecast period. General revenue funded debt service on all tax supported obligations are projected to rise from $190.0 million in FY 2014 to $253.2 million in FY 2018, an increase of $63.2 million. The increase is attributable to the issuance of debt for the Historic Tax Credit stabilization program, which increases by $18.9 million, and the inclusion of funding for debt service on the $75.0 million issuance under the EDC Job Creation Guaranty program, which adds approximately $12.5 million annually beginning in FY 2015. Also included in the five year projection is continuation of the Governor’s proposal to shift financing of transportation debt service from the Intermodal Surface Transportation Fund to general revenue over a five year period which began with the FY 2013 Budget as enacted shifting $8.0 million to general revenue funding. The enacted FY 2014 budget increased this shift to $9.25 million and the five year projections assume this increases by $10 million annually until all such debt service is moved. This adds over $40.0 million in general revenue expenditures by FY 2018.
114

General Revenue Outyear Estimates FY 2014 - FY 2018
FY 2014 FY 2015 FY 2016 FY 2017 FY 2018
Opening Surplus (1) $93.4 $0.0 $0.0 $0.0 $0.0
Plus:Taxes and Departmentals 2,971.7 3,037.5 3,157.7 3,248.3 3,327.6Other Sources 409.3 418.2 375.0 325.6 308.5Budget Stabilization Fund (104.2) (103.7) (106.0) (107.2) (109.1)
Total Available 3,370.2 3,352.1 3,426.7 3,466.7 3,527.1
Minus Expenditures (2) 3,369.8 3,501.2 3,642.1 3,791.7 3,937.5
Equals Ending Balance $0.4 ($149.2) ($215.3) ($325.0) ($410.4)
Operating Surplus or Deficit ($93.0) ($149.2) ($215.3) ($325.0) ($410.4)
Budget & Cash Stabilization Balance $173.7 $172.8 $176.6 $178.7 $181.8RI Capital Fund Balance $29.3 $5.0 ($3.5) $16.5 $41.1
Rhode Island Capital Fund Capital Projects Disbursements $167.5 $128.9 $110.6 $88.6 $81.4
(1) Under the Rhode Island Constitution, the budget must be balanced each year, thus deficits in any given fiscal year cannot be carried forward
to the ensuing fiscal year.(2) FY 2014 expenditures include a transfer of $10.0 million to an Accelerated Depreciation Fund.
$2,600$2,800$3,000$3,200$3,400$3,600$3,800$4,000$4,200
FY 2014 FY 2015 FY 2016 FY 2017 FY 2018
mill
ion
s
Outyear Expenditures vs. Available Funds
Total Available Expenditures
115
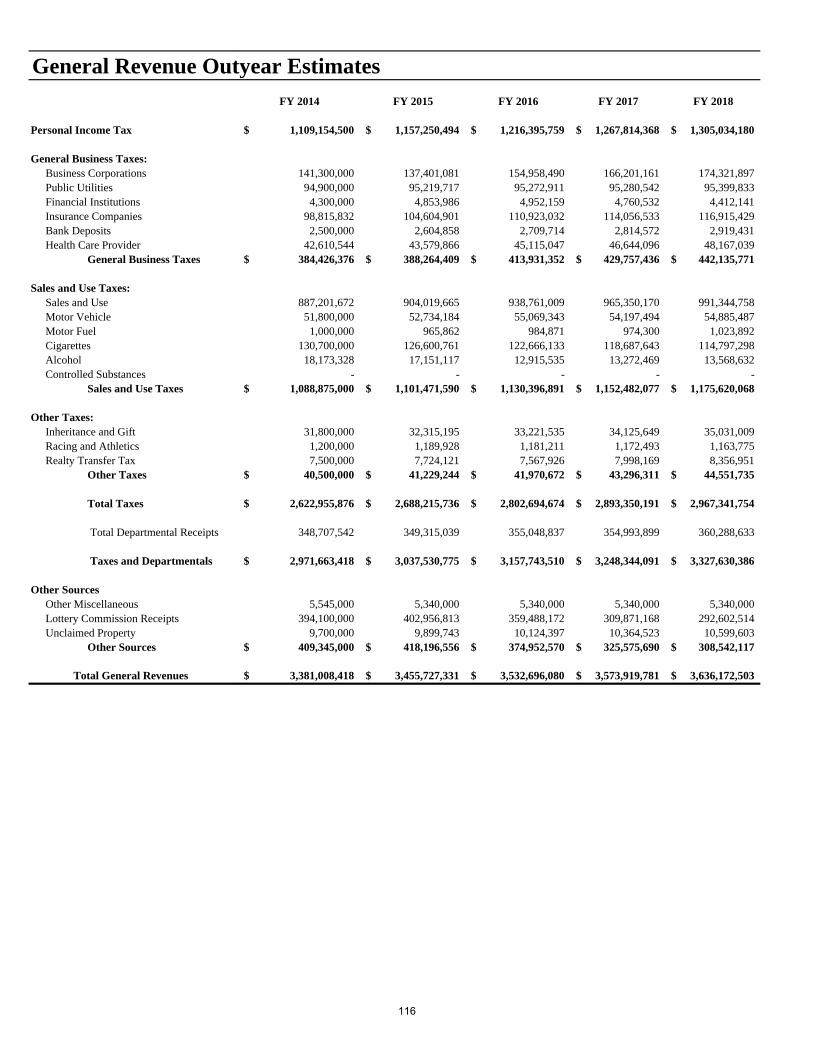
General Revenue Out
Personal Income Tax
General Business Taxes:Business CorporationsPublic UtilitiesFinancial InstitutionsInsurance CompaniesBank DepositsHealth Care Provider General Business Taxes
Sales and Use Taxes:Sales and UseMotor VehicleMotor FuelCigarettesAlcoholControlled Substances Sales and Use Taxes
Other Taxes:Inheritance and GiftRacing and AthleticsRealty Transfer Tax Other Taxes
Total Taxes
Total Departmental Receipts
Taxes and Departmentals
Other SourcesOther MiscellaneousLottery Commission ReceiptsUnclaimed Property Other Sources
Total General Revenues
tyear Estimates
FY 2014 FY 2015 FY 2016 FY 2017 FY 2018
1,109,154,500$ 1,157,250,494$ 1,216,395,759$ 1,267,814,368$ 1,305,034,180$
141,300,000 137,401,081 154,958,490 166,201,161 174,321,897 94,900,000 95,219,717 95,272,911 95,280,542 95,399,833
4,300,000 4,853,986 4,952,159 4,760,532 4,412,141 98,815,832 104,604,901 110,923,032 114,056,533 116,915,429 2,500,000 2,604,858 2,709,714 2,814,572 2,919,431
42,610,544 43,579,866 45,115,047 46,644,096 48,167,039 384,426,376$ 388,264,409$ 413,931,352$ 429,757,436$ 442,135,771$
887,201,672 904,019,665 938,761,009 965,350,170 991,344,758 51,800,000 52,734,184 55,069,343 54,197,494 54,885,487
1,000,000 965,862 984,871 974,300 1,023,892 130,700,000 126,600,761 122,666,133 118,687,643 114,797,298 18,173,328 17,151,117 12,915,535 13,272,469 13,568,632
- - - - - 1,088,875,000$ 1,101,471,590$ 1,130,396,891$ 1,152,482,077$ 1,175,620,068$
31,800,000 32,315,195 33,221,535 34,125,649 35,031,009 1,200,000 1,189,928 1,181,211 1,172,493 1,163,775 7,500,000 7,724,121 7,567,926 7,998,169 8,356,951
40,500,000$ 41,229,244$ 41,970,672$ 43,296,311$ 44,551,735$
2,622,955,876$ 2,688,215,736$ 2,802,694,674$ 2,893,350,191$ 2,967,341,754$
348,707,542 349,315,039 355,048,837 354,993,899 360,288,633
2,971,663,418$ 3,037,530,775$ 3,157,743,510$ 3,248,344,091$ 3,327,630,386$
5,545,000 5,340,000 5,340,000 5,340,000 5,340,000 394,100,000 402,956,813 359,488,172 309,871,168 292,602,514
9,700,000 9,899,743 10,124,397 10,364,523 10,599,603 409,345,000$ 418,196,556$ 374,952,570$ 325,575,690$ 308,542,117$
3,381,008,418$ 3,455,727,331$ 3,532,696,080$ 3,573,919,781$ 3,636,172,503$
116
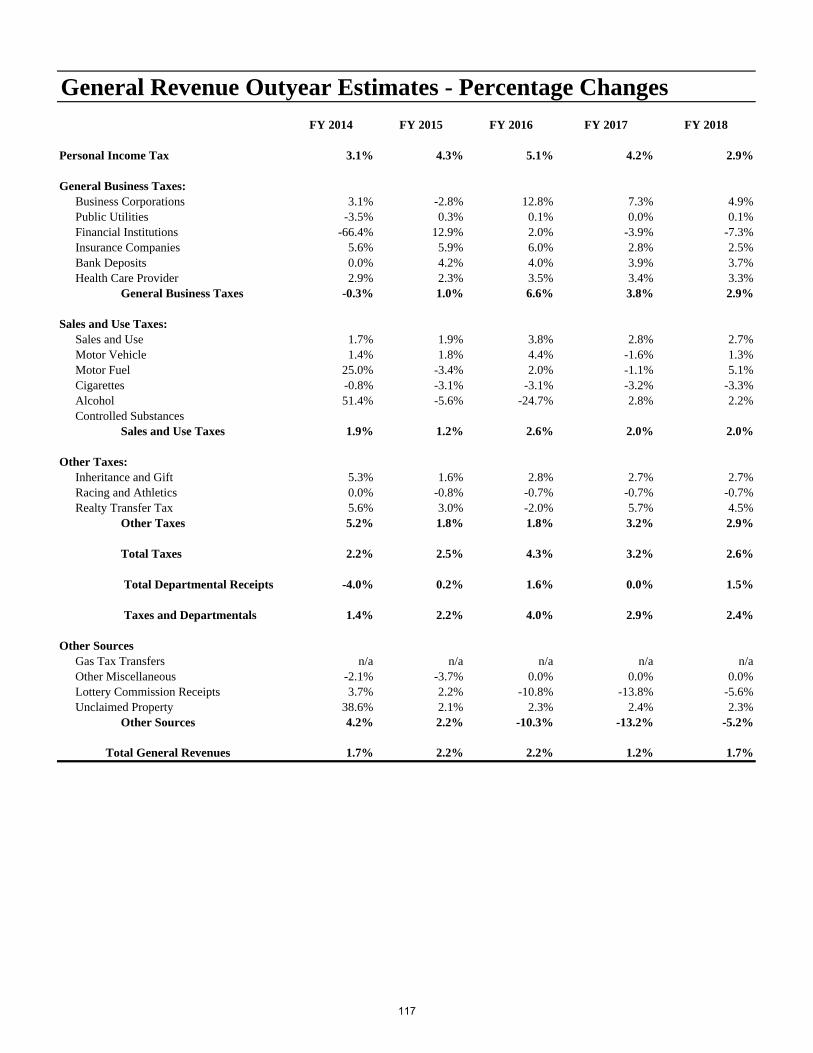
General Revenue Outyear Estimates - Percentage Changes
FY 2014 FY 2015 FY 2016 FY 2017 FY 2018
Personal Income Tax 3.1% 4.3% 5.1% 4.2% 2.9%
General Business Taxes:Business Corporations 3.1% -2.8% 12.8% 7.3% 4.9%Public Utilities -3.5% 0.3% 0.1% 0.0% 0.1%Financial Institutions -66.4% 12.9% 2.0% -3.9% -7.3%Insurance Companies 5.6% 5.9% 6.0% 2.8% 2.5%Bank Deposits 0.0% 4.2% 4.0% 3.9% 3.7%Health Care Provider 2.9% 2.3% 3.5% 3.4% 3.3% General Business Taxes -0.3% 1.0% 6.6% 3.8% 2.9%
Sales and Use Taxes:Sales and Use 1.7% 1.9% 3.8% 2.8% 2.7%Motor Vehicle 1.4% 1.8% 4.4% -1.6% 1.3%Motor Fuel 25.0% -3.4% 2.0% -1.1% 5.1%Cigarettes -0.8% -3.1% -3.1% -3.2% -3.3%Alcohol 51.4% -5.6% -24.7% 2.8% 2.2%Controlled Substances Sales and Use Taxes 1.9% 1.2% 2.6% 2.0% 2.0%
Other Taxes:Inheritance and Gift 5.3% 1.6% 2.8% 2.7% 2.7%Racing and Athletics 0.0% -0.8% -0.7% -0.7% -0.7%Realty Transfer Tax 5.6% 3.0% -2.0% 5.7% 4.5% Other Taxes 5.2% 1.8% 1.8% 3.2% 2.9%
Total Taxes 2.2% 2.5% 4.3% 3.2% 2.6%
Total Departmental Receipts -4.0% 0.2% 1.6% 0.0% 1.5%
Taxes and Departmentals 1.4% 2.2% 4.0% 2.9% 2.4%
Other SourcesGas Tax Transfers n/a n/a n/a n/a n/aOther Miscellaneous -2.1% -3.7% 0.0% 0.0% 0.0%Lottery Commission Receipts 3.7% 2.2% -10.8% -13.8% -5.6%Unclaimed Property 38.6% 2.1% 2.3% 2.4% 2.3% Other Sources 4.2% 2.2% -10.3% -13.2% -5.2%
Total General Revenues 1.7% 2.2% 2.2% 1.2% 1.7%
117
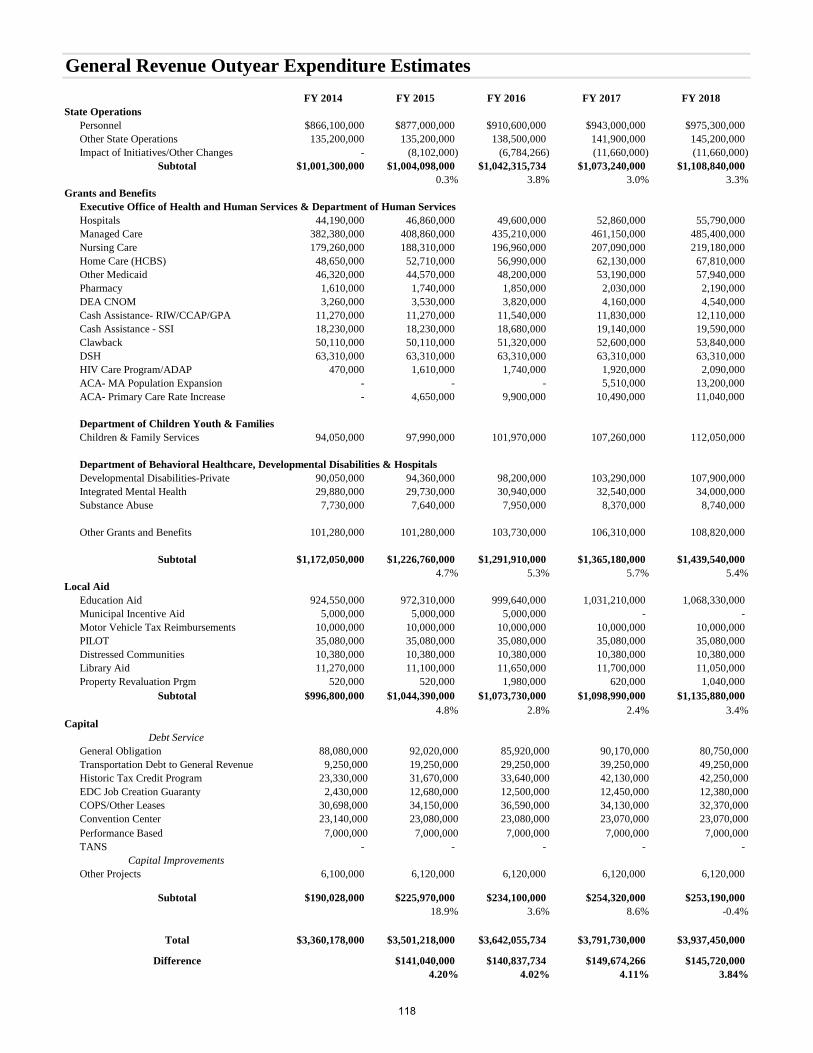
General Revenue Outyear Expenditure Estimates
FY 2014 FY 2015 FY 2016 FY 2017 FY 2018State Operations
Personnel $866,100,000 $877,000,000 $910,600,000 $943,000,000 $975,300,000Other State Operations 135,200,000 135,200,000 138,500,000 141,900,000 145,200,000Impact of Initiatives/Other Changes - (8,102,000) (6,784,266) (11,660,000) (11,660,000)
Subtotal $1,001,300,000 $1,004,098,000 $1,042,315,734 $1,073,240,000 $1,108,840,0000.3% 3.8% 3.0% 3.3%
Grants and BenefitsExecutive Office of Health and Human Services & Department of Human ServicesHospitals 44,190,000 46,860,000 49,600,000 52,860,000 55,790,000Managed Care 382,380,000 408,860,000 435,210,000 461,150,000 485,400,000Nursing Care 179,260,000 188,310,000 196,960,000 207,090,000 219,180,000Home Care (HCBS) 48,650,000 52,710,000 56,990,000 62,130,000 67,810,000Other Medicaid 46,320,000 44,570,000 48,200,000 53,190,000 57,940,000Pharmacy 1,610,000 1,740,000 1,850,000 2,030,000 2,190,000DEA CNOM 3,260,000 3,530,000 3,820,000 4,160,000 4,540,000Cash Assistance- RIW/CCAP/GPA 11,270,000 11,270,000 11,540,000 11,830,000 12,110,000Cash Assistance - SSI 18,230,000 18,230,000 18,680,000 19,140,000 19,590,000Clawback 50,110,000 50,110,000 51,320,000 52,600,000 53,840,000DSH 63,310,000 63,310,000 63,310,000 63,310,000 63,310,000HIV Care Program/ADAP 470,000 1,610,000 1,740,000 1,920,000 2,090,000ACA- MA Population Expansion - - - 5,510,000 13,200,000ACA- Primary Care Rate Increase - 4,650,000 9,900,000 10,490,000 11,040,000
Department of Children Youth & FamiliesChildren & Family Services 94,050,000 97,990,000 101,970,000 107,260,000 112,050,000
Department of Behavioral Healthcare, Developmental Disabilities & HospitalsDevelopmental Disabilities-Private 90,050,000 94,360,000 98,200,000 103,290,000 107,900,000Integrated Mental Health 29,880,000 29,730,000 30,940,000 32,540,000 34,000,000Substance Abuse 7,730,000 7,640,000 7,950,000 8,370,000 8,740,000
Other Grants and Benefits 101,280,000 101,280,000 103,730,000 106,310,000 108,820,000
Subtotal $1,172,050,000 $1,226,760,000 $1,291,910,000 $1,365,180,000 $1,439,540,0004.7% 5.3% 5.7% 5.4%
Local AidEducation Aid 924,550,000 972,310,000 999,640,000 1,031,210,000 1,068,330,000Municipal Incentive Aid 5,000,000 5,000,000 5,000,000 - - Motor Vehicle Tax Reimbursements 10,000,000 10,000,000 10,000,000 10,000,000 10,000,000PILOT 35,080,000 35,080,000 35,080,000 35,080,000 35,080,000Distressed Communities 10,380,000 10,380,000 10,380,000 10,380,000 10,380,000Library Aid 11,270,000 11,100,000 11,650,000 11,700,000 11,050,000Property Revaluation Prgm 520,000 520,000 1,980,000 620,000 1,040,000
Subtotal $996,800,000 $1,044,390,000 $1,073,730,000 $1,098,990,000 $1,135,880,0004.8% 2.8% 2.4% 3.4%
CapitalDebt Service
General Obligation 88,080,000 92,020,000 85,920,000 90,170,000 80,750,000Transportation Debt to General Revenue 9,250,000 19,250,000 29,250,000 39,250,000 49,250,000Historic Tax Credit Program 23,330,000 31,670,000 33,640,000 42,130,000 42,250,000EDC Job Creation Guaranty 2,430,000 12,680,000 12,500,000 12,450,000 12,380,000COPS/Other Leases 30,698,000 34,150,000 36,590,000 34,130,000 32,370,000Convention Center 23,140,000 23,080,000 23,080,000 23,070,000 23,070,000Performance Based 7,000,000 7,000,000 7,000,000 7,000,000 7,000,000TANS - - - - -
Capital ImprovementsOther Projects 6,100,000 6,120,000 6,120,000 6,120,000 6,120,000
Subtotal $190,028,000 $225,970,000 $234,100,000 $254,320,000 $253,190,00018.9% 3.6% 8.6% -0.4%
Total $3,360,178,000 $3,501,218,000 $3,642,055,734 $3,791,730,000 $3,937,450,000
Difference $141,040,000 $140,837,734 $149,674,266 $145,720,0004.20% 4.02% 4.11% 3.84%
118
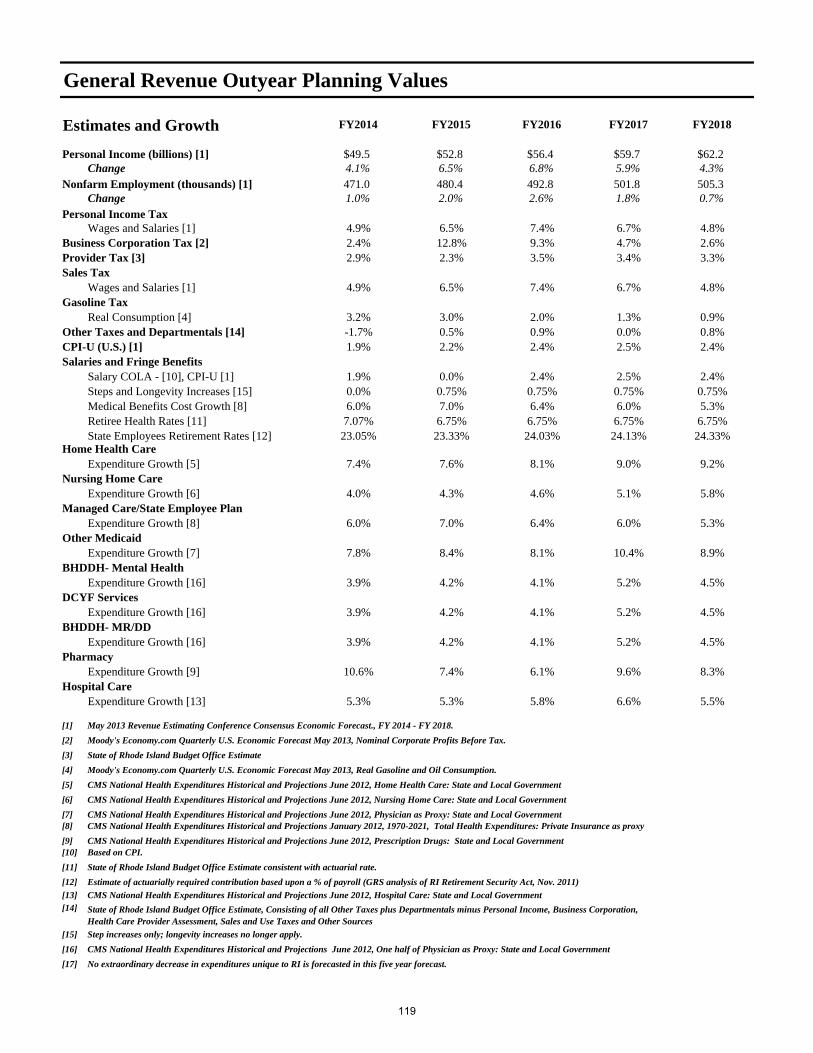
General Revenue Outyear Planning Values
Estimates and Growth FY2014 FY2015 FY2016 FY2017 FY2018
Personal Income (billions) [1] $49.5 $52.8 $56.4 $59.7 $62.2Change 4.1% 6.5% 6.8% 5.9% 4.3%
Nonfarm Employment (thousands) [1] 471.0 480.4 492.8 501.8 505.3Change 1.0% 2.0% 2.6% 1.8% 0.7%
Personal Income TaxWages and Salaries [1] 4.9% 6.5% 7.4% 6.7% 4.8%
Business Corporation Tax [2] 2.4% 12.8% 9.3% 4.7% 2.6%Provider Tax [3] 2.9% 2.3% 3.5% 3.4% 3.3%Sales Tax
Wages and Salaries [1] 4.9% 6.5% 7.4% 6.7% 4.8%Gasoline Tax
Real Consumption [4] 3.2% 3.0% 2.0% 1.3% 0.9%Other Taxes and Departmentals [14] -1.7% 0.5% 0.9% 0.0% 0.8%CPI-U (U.S.) [1] 1.9% 2.2% 2.4% 2.5% 2.4%Salaries and Fringe Benefits
Salary COLA - [10], CPI-U [1] 1.9% 0.0% 2.4% 2.5% 2.4%Steps and Longevity Increases [15] 0.0% 0.75% 0.75% 0.75% 0.75%Medical Benefits Cost Growth [8] 6.0% 7.0% 6.4% 6.0% 5.3%Retiree Health Rates [11] 7.07% 6.75% 6.75% 6.75% 6.75%State Employees Retirement Rates [12] 23.05% 23.33% 24.03% 24.13% 24.33%
Home Health CareExpenditure Growth [5] 7.4% 7.6% 8.1% 9.0% 9.2%
Nursing Home CareExpenditure Growth [6] 4.0% 4.3% 4.6% 5.1% 5.8%
Managed Care/State Employee PlanExpenditure Growth [8] 6.0% 7.0% 6.4% 6.0% 5.3%
Other MedicaidExpenditure Growth [7] 7.8% 8.4% 8.1% 10.4% 8.9%
BHDDH- Mental HealthExpenditure Growth [16] 3.9% 4.2% 4.1% 5.2% 4.5%
DCYF ServicesExpenditure Growth [16] 3.9% 4.2% 4.1% 5.2% 4.5%
BHDDH- MR/DDExpenditure Growth [16] 3.9% 4.2% 4.1% 5.2% 4.5%
PharmacyExpenditure Growth [9] 10.6% 7.4% 6.1% 9.6% 8.3%
Hospital CareExpenditure Growth [13] 5.3% 5.3% 5.8% 6.6% 5.5%
[1]
[2]
[3]
[4]
[5] CMS National Health Expenditures Historical and Projections June 2012, Home Health Care: State and Local Government
[6] CMS National Health Expenditures Historical and Projections June 2012, Nursing Home Care: State and Local Government
[7] CMS National Health Expenditures Historical and Projections June 2012, Physician as Proxy: State and Local Government[8] CMS National Health Expenditures Historical and Projections January 2012, 1970-2021, Total Health Expenditures: Private Insurance as proxy
[9] CMS National Health Expenditures Historical and Projections June 2012, Prescription Drugs: State and Local Government[10] Based on CPI.
[11] State of Rhode Island Budget Office Estimate consistent with actuarial rate.
[12] Estimate of actuarially required contribution based upon a % of payroll (GRS analysis of RI Retirement Security Act, Nov. 2011)
[13] CMS National Health Expenditures Historical and Projections June 2012, Hospital Care: State and Local Government[14]
[15] Step increases only; longevity increases no longer apply.
[16] CMS National Health Expenditures Historical and Projections June 2012, One half of Physician as Proxy: State and Local Government
[17] No extraordinary decrease in expenditures unique to RI is forecasted in this five year forecast.
Moody's Economy.com Quarterly U.S. Economic Forecast May 2013, Real Gasoline and Oil Consumption.
State of Rhode Island Budget Office Estimate, Consisting of all Other Taxes plus Departmentals minus Personal Income, Business Corporation, Health Care Provider Assessment, Sales and Use Taxes and Other Sources
May 2013 Revenue Estimating Conference Consensus Economic Forecast., FY 2014 - FY 2018.
Moody's Economy.com Quarterly U.S. Economic Forecast May 2013, Nominal Corporate Profits Before Tax.
State of Rhode Island Budget Office Estimate
119


![STATE OF RHODE ISLAND AND PROVIDENCE PLANTATIONS … · 2017-08-31 · state of rhode island and providence plantations kent, sc. superior court [filed: august 30, 2017] david clark](https://img.dokumen.tips/doc/110x75/5f4cee2565b3152cb212d519/state-of-rhode-island-and-providence-plantations-2017-08-31-state-of-rhode-island.jpg)