Embed Size (px)
Citation preview
STATE OF INDIANA INDIANA UTILITY REGULATORY COMMISSION
VERIFIED PETITION OF NORTHERN INDIANA PUBLIC SERVICE COMPANY FOR (1) APPROVAL OF AND A CERTIFICATE OF PUBLIC CONVENIENCE AND NECESSITY FOR A FEDERALLY MANDATED ENVIRONMENTAL COMPLIANCE PROJECT; (2) AUTHORITY TO RECOVER FEDERALLY MANDATED COSTS INCURRED IN CONNECTION WITH THE ENVIRONMENTAL COMPLIANCE PROJECT; (3) APPROVAL OF THE ESTIMATED FEDERALLY MANDATED COSTS ASSOCIATED WITH THE ENVIRONMENTAL COMPLIANCE PROJECT; (4) AUTHORITY FOR THE TIMELY RECOVERY OF 80% OF THE FEDERALLY MANDATED COSTS THROUGH RIDER 787 – ADJUSTMENT OF FEDERALLY MANDATED COSTS AND APPENDIX I – FEDERALLY MANDATED COST ADJUSTMENT FACTOR; (5) AUTHORITY TO DEFER 20% OF THE FEDERALLY MANDATED COSTS FOR RECOVERY IN NIPSCO’S NEXT GENERAL RATE CASE; (6) APPROVAL OF SPECIFIC RATEMAKING AND ACCOUNTING TREATMENT; (7) APPROVAL TO DEPRECIATE THE ENVIRONMENTAL COMPLIANCE PROJECT ACCORDING TO PREVIOUSLY APPROVED DEPRECIATION RATES; AND (8) APPROVAL OF ONGOING REVIEW OF THE ENVIRONMENTAL COMPLIANCE PROJECT; ALL PURSUANT TO IND. CODE § 8-1-8.4-1 ET SEQ., § 8-1- 2-19, § 8-1-2-23, AND § 8-1-2-42.
) ) ) ) ) ) ) ) ) ) ) ) CAUSE NO. 44872 ) ) ) ) ) ) ) ) ) ) ) ) ) )
SUBMISSION OF CAC DIRECT TESTIMONY AND PUBLIC ATTACHMENTS
Citizens Action Coalition of Indiana, Inc. (“CAC”), by counsel, hereby submits CAC
Exhibit 1, the Verified Direct Testimony and Public Attachments of Elizabeth A. Stanton, in the
above referenced Cause to the Indiana Utility Regulatory Commission (“IURC”). Upon a
preliminary finding of confidentiality, CAC will file Attachment EAS-2-Confidential, which
contains information deemed confidential by Northern Indiana Public Service Company
(“NIPSCO”).

2
Respectfully submitted,
_________________________ Jennifer A. Washburn, Atty. No. 30462-49 Citizens Action Coalition of Indiana, Inc. 603 East Washington Street, Suite 502 Indianapolis, Indiana 46204 Phone: (317) 735-7764 Fax: (317) 290-3700 [email protected]
3
CERTIFICATE OF SERVICE
The undersigned hereby certifies that the foregoing was served by electronic mail this 3rd
day of April, 2017, to the following:
Claudia J. Earls Bryan M. Likins NISOURCE CORPORATE SERVICES - LEGAL 150 West Market Street, Suite 600 Indianapolis, IN 46204 [email protected] [email protected] Copy to: Timothy R. Caister NORTHERN INDIANA PUBLIC SERVICE
COMPANY 150 West Market Street, Suite 600 Indianapolis, IN 46204 [email protected] Kathryn A. Watson Spalding & Hilmes, PC PO Box 199020 Indianapolis, IN 46219-9020 [email protected]
Randall C. Helmen Tiffany Murray OFFICE OF THE UTILITY CONSUMER
COUNSELOR PNC Center 115 West Washington Street, Suite 1500 South Indianapolis, IN 46204 [email protected] [email protected] [email protected] Joseph Rompala Jennifer Terry Lewis & Kappes, P.C. One American Square, Suite 2500 Indianapolis, IN 46282 [email protected] [email protected]
________________________ Jennifer A. Washburn Citizens Action Coalition
STATE OF INDIANA
INDIANA UTILITY REGULATORY COMMISSION VERIFIED PETITION OF NORTHERN INDIANA PUBLIC SERVICE COMPANY FOR (1) APPROVAL OF AND A CERTIFICATE OF PUBLIC CONVENIENCE AND NECESSITY FOR A FEDERALLY MANDATED ENVIRONMENTAL COMPLIANCE PROJECT; (2) AUTHORITY TO RECOVER FEDERALLY MANDATED COSTS INCURRED IN CONNECTION WITH THE ENVIRONMENTAL COMPLIANCE PROJECT; (3) APPROVAL OF THE ESTIMATED FEDERALLY MANDATED COSTS ASSOCIATED WITH THE ENVIRONMENTAL COMPLIANCE PROJECT; (4) AUTHORITY FOR THE TIMELY RECOVERY OF 80% OF THE FEDERALLY MANDATED COSTS THROUGH RIDER 787 – ADJUSTMENT OF FEDERALLY MANDATED COSTS AND APPENDIX I – FEDERALLY MANDATED COST ADJUSTMENT FACTOR; (5) AUTHORITY TO DEFER 20% OF THE FEDERALLY MANDATED COSTS FOR RECOVERY IN NIPSCO’S NEXT GENERAL RATE CASE; (6) APPROVAL OF SPECIFIC RATEMAKING AND ACCOUNTING TREATMENT; (7) APPROVAL TO DEPRECIATE THE ENVIRONMENTAL COMPLIANCE PROJECT ACCORDING TO PREVIOUSLY APPROVED DEPRECIATION RATES; AND (8) APPROVAL OF ONGOING REVIEW OF THE ENVIRONMENTAL COMPLIANCE PROJECT; ALL PURSUANT TO IND. CODE § 8-1-8.4-1 ET SEQ., § 8-1- 2-19, § 8-1-2-23, AND § 8-1-2-42.
) ) ) ) ) ) ) ) ) ) ) ) ) CAUSE NO. 44872 ) ) ) ) ) ) ) ) ) ) ) ) ) ) )
DIRECT TESTIMONY & ATTACHMENTS OF ELIZABETH A. STANTON, PHD,
ON BEHALF OF CITIZENS ACTION COALITION OF INDIANA, INC.
IURC CAUSE NO. 44872 Direct Testimony of Elizabeth A. Stanton, PhD CAC Exhibit 1
2
Direct Testimony of Elizabeth A. Stanton, PhD On Behalf of Citizens Action Coalition of Indiana, Inc.
Cause No. 44872 April 3, 2017
Q. Please state your name and business address. 1
A. My name is Elizabeth A. Stanton. I am the Director of the Applied Economics 2
Clinic and a Research Fellow at the Global Development and Environment 3
Institute at Tufts University. 4
Q. Please describe the Applied Economics Clinic. 5
A. The Applied Economics Clinic is a non-profit economic and energy consulting 6
group providing expert testimony, analysis, modeling, policy briefs, and reports to 7
public interest groups on the topics of environment, consumer protection, and 8
equity. The Clinic also serves to train the next generation of expert technical 9
witnesses and analysts by providing applied, on-the-job training to graduate 10
students in related fields and working proactively to support diversity among both 11
student workers and professional staff. The Clinic is housed at Tufts University’s 12
Global Development and Environment Institute and began operations in February 13
2017. 14
Q. Please describe your professional background and experience. 15
A. I am a researcher and analyst with more than 16 years of professional experience 16
as a political and environmental economist. I have authored more than 120 17
reports, policy studies, white papers, journal articles, and book chapters on topics 18
related to energy, the economy, and the environment. I founded and direct the 19
IURC CAUSE NO. 44872 Direct Testimony of Elizabeth A. Stanton, PhD CAC Exhibit 1
3
Applied Economics Clinic and am a Research Fellow with the Global 1
Development and Environment Institute at Tufts University. 2
In my previous position as a principal economist at Synapse Energy 3
Economics, I led studies examining environmental regulation, cost-benefit 4
analyses, and the economics of energy efficiency and renewable energy. I have 5
submitted expert testimony and comments in Illinois, Vermont, New Hampshire, 6
Massachusetts, and several federal dockets. My recent work includes extensive 7
analysis of the EPA’s proposed Clean Power Plan, critiquing the analyses used to 8
support a flawed valuation method for nuclear power plants, developing 9
testimony on Global Warming Solutions Act (GWSA) compliance for the 10
Massachusetts Departments of Energy Resources and Environmental Protection, 11
and analysis of the need for new gas pipelines in New England and the U.S. 12
Southeast. 13
Prior to joining Synapse, I was a senior economist with the Stockholm 14
Environment Institute’s (SEI) Climate Economics Group, where I was responsible 15
for leading the organization’s work on the Consumption-Based Emissions 16
Inventory (CBEI) model and on water issues and climate change in the western 17
United States. While at SEI, I led domestic and international studies 18
commissioned by the United Nations Development Programme, Friends of the 19
Earth-U.K., and Environmental Defense. 20
My articles have been published in Ecological Economics, Renewable 21
Climatic Change, Environmental and Resource Economics, Environmental 22
Science & Technology, and other journals. I have also published books, including 23
IURC CAUSE NO. 44872 Direct Testimony of Elizabeth A. Stanton, PhD CAC Exhibit 1
4
Climate Change and Global Equity (Anthem Press, 2014) and Climate 1
Economics: The State of the Art (Routledge, 2013), which I co-wrote with Frank 2
Ackerman. I am also coauthor of Environment for the People (Political Economy 3
Research Institute, 2005, with James K. Boyce) and co-editor of Reclaiming 4
Nature: Worldwide Strategies for Building Natural Assets (Anthem Press, 2007, 5
with Boyce and Sunita Narain). 6
I earned my Ph.D. in economics at the University of Massachusetts-7
Amherst, and have taught economics at Tufts University, the University of 8
Massachusetts-Amherst, and the College of New Rochelle, among others. 9
My professional resume is attached as Attachment EAS-1. 10
Q. Have you testified previously before the Indiana Utility Regulatory 11
Commission (“Commission” or “IURC”)? 12
A. Yes. I recently filed testimony on behalf of Citizens Action Coalition of Indiana, 13
Inc. (“CAC”), in Cause No. 43955 DSM 4. 14
Q. On whose behalf are you testifying? 15
A. I am testifying on behalf of CAC. 16
Q. What is the purpose of your testimony? 17
A. Northern Indiana Public Service Company (“NIPSCO”) seeks 18 19
a CPCN to for its Environmental Compliance Project which 20 includes numerous capital projects and ongoing activities at 21 three (3) different locations, Bailly Generating Station, 22 Michigan City Generating Station and R. M. Schahfer 23 Generating Station within NIPSCO’s electric system (i.e., its 24 three coal‐fired generation stations) necessary to comply 25 with the Environmental Rules (the “Environmental 26 Compliance Project”). The Environmental Compliance 27
IURC CAUSE NO. 44872 Direct Testimony of Elizabeth A. Stanton, PhD CAC Exhibit 1
5
Project includes the following types of capital projects: 1 Ground Water Monitoring Projects at all three coal stations; 2 Landfill Projects as a result of pond closure at all three coal 3 stations; Ash Handling Projects and New CCR Containment 4 Area Projects at the R. M. Schahfer and Michigan City 5 Generating Stations; and a New Process Water Pond Project 6 and ELG Projects at R. M. Schahfer Generating Station. 7 NIPSCO is also requesting approval of projected federally 8 mandated ongoing O&M, depreciation, taxes, financing and 9 carrying costs, and AFUDC, which are also part of the 10 Environmental Compliance Project. 11 12
NIPSCO Verified Petition, page 8. 13
My testimony and attached comments assess the Integrated Resource Plan 14
(“IRP”) analysis conducted by NIPSCO in support of this application, which is 15
discussed primarily in NIPSCO Witness Douglas’ testimony (Petitioner’s Exhibit 16
No. 5). 17
Q. Have you already performed an analysis of NIPSCO’s 2016 Integrated 18
Resource Plan (“IRP”) upon which this filing its based? 19
A. Yes. I incorporate those comments into this testimony as Attachment EAS-2 and 20
Attachment EAS-2-Confidential. Attachment EAS-2 is the public version, while 21
Attachment EAS-2-Confidential is the confidential version. 22
Q. Please summarize your conclusions and recommendations. 23
A. In 2023, NIPSCO (1) plans to retire some of the coal units at issue here, and (2) is 24
treating replacement of these coal units with a combined cycle gas turbine 25
(“CCGT”) as the default option in this case. Considering the replacement 26
capacity that may be needed in 2023, it is critically important for NIPSCO to be 27
required to do a proper analysis of all cost-effective demand side management 28
IURC CAUSE NO. 44872 Direct Testimony of Elizabeth A. Stanton, PhD CAC Exhibit 1
6
(“DSM”) and renewable resource alternatives, rather than NIPSCO setting itself 1
up to settle on a CCGT in 2023. Even if NIPSCO still finds, after addressing 2
deficiencies in its analysis, that some new gas capacity is needed, a better analysis 3
of alternatives may result in a smaller CCGT being proposed that would lower 4
costs for ratepayers. Furthermore, should NIPSCO perform a better analysis of 5
DSM and renewables now, rather than waiting until a future proceeding, it could 6
result in NIPSCO ramping up DSM and renewables more quickly, reducing long-7
term costs to ratepayers. Therefore, it is my recommendation that the CPCN be 8
denied due to the deficient IRP analysis and that NIPSCO take the time to 9
improve its analysis of DSM and renewables given the need for capacity that will 10
result from its planned retirements. 11
Q. Please summarize your assessment of NIPSCO’s 2016 IRP. 12
A. Our assessment of NIPSCO’s 2016 IRP reviewed 17 of the IURC’s requirements 13
for Indiana IRPs and found that none of these requirements had been met. We 14
highlighted the following issues on page 5 of our review, which can be found in 15
Attachment EAS-2 and Attachment EAS-2-Confidential: 16
Failure to communicate core concepts to nontechnical audiences (170 17 IAC 4-7-4(a)): Despite the 8-page executive summary submitted with the 18 IRP, NIPSCO’s 2016 IRP obscures critical basic information, includes 19 inconsistencies among its sections and attachments, and includes multiple 20 sections that are simply unclear even to a technical audience. See Section I of 21 [Attachment EAS-2 and Attachment EAS-2-Confidential]. 22
Incomplete documentation of inputs, methods, and definitions (170 IAC 23 4-7-4(b)(1)): Missing documentation includes both methods and assumptions. 24 See Section II [of Attachment EAS-2 and Attachment EAS-2-Confidential]. 25
Numerous modeling errors (170 IAC 4-7-4(b)(9)): NIPSCO’s modeling 26 errors include its treatment of distributed generation, limitations constraining 27 the model’s ability to identify a least-cost portfolio, and incorrect calculation 28
IURC CAUSE NO. 44872 Direct Testimony of Elizabeth A. Stanton, PhD CAC Exhibit 1
7
of peak energy demand and, therefore, of capacity requirements. See Section 1 IV [of Attachment EAS-2 and Attachment EAS-2-Confidential]. 2
Preferred resource portfolio not selected from candidate portfolios and 3 not fully described in IRP (170 IAC 4-7-8(a),(b)): NIPSCO’s failure to 4 choose a preferred resource portfolio from among its candidate resource 5 portfolios invalidates its selection of a preferred resource portfolio. In 6 addition, NIPSCO fails to document the differences between its preferred 7 portfolio and its least-cost portfolio; these differences appear to consist 8 entirely of radically divergent treatments of market purchases of capacity. See 9 Section VII [of Attachment EAS-2 and Attachment EAS-2-Confidential]. 10
Biases against coal retirement (170 IAC 4-7-8(b)(3),(b)(4)): NIPSCO’s 11 retirement analysis is deeply flawed with the result that the preferred portfolio 12 is neither least cost nor risk reducing. See Sections IX and X [of Attachment 13 EAS-2 and Attachment EAS-2-Confidential]. 14
Biases against renewable resources (170 IAC 4-7-8(b)(3),(b)(4)): 15 NIPSCO’s modeling includes several assumptions that bias resource selection 16 against renewable generation. See Sections IX, X [of Attachment EAS-2 and 17 Attachment EAS-2-Confidential]. 18
Demand-side resources not evaluated on consistent and comparable 19 terms with supply-side resources (170 IAC 4-7-8(b)(3),(b)(4)): NIPSCO’s 20 modeling includes a faulty modeling methodology and numerous assumptions 21 that bias resource selection against energy efficiency. Demand-side resources 22 are not evaluated on a consistent and comparable basis with supply-side 23 resources. See Sections IX and X [of Attachment EAS-2 and Attachment 24 EAS-2-Confidential]. 25
Flawed risk assessment and price forecasting (170 IAC 4-7-26 8(b)(7)(B),(C)): NIPSCO’s risk and uncertainty assessment is insufficient in 27 its scope and includes errors in its execution. See Sections XIV and XV [of 28 Attachment EAS-2 and Attachment EAS-2-Confidential]. 29
Portfolio ranking criteria are opaque to the IRP audience (170 IAC 4-7-30 8(b)(7)(D)): NIPSCO ranks its candidate portfolios using a black-box, 31 qualitative scorecard that obscures their choice of a preferred portfolio. See 32 Section XVI [of Attachment EAS-2 and Attachment EAS-2-Confidential]. 33
Q. Please discuss your findings from the NIPSCO 2016 IRP assessment with 34
respect to energy efficiency and renewables. 35
A. We found that the NIPSCO 2016 IRP includes important biases against the 36
adoption of energy efficiency and renewable resources. Critically, we found that 37
NIPSCO has not evaluated demand-side resources on consistent and comparable 38
terms with supply-side resources, in particular by subjecting demand-side 39
IURC CAUSE NO. 44872 Direct Testimony of Elizabeth A. Stanton, PhD CAC Exhibit 1
8
resources to several additional screens not applied to supply-side resources. In 1
addition, NIPSCO has not provided stakeholders with the most basic assumptions 2
and explanations of methodology regarding its demand-side modeling, greatly 3
impeding our ability to provide a meaningful third-party review. 4
NIPSCO’s 2016 IRP modeling also includes: biases against renewable 5
resources, delaying the earliest date for their adoption until relevant tax credits 6
have sunset; and limitations on the adoption of complementary capacity 7
resources. 8
Q. Do any other aspects of NIPSCO’s 2016 IRP methodology act to limit the 9
adoption of energy efficiency and renewables? 10
A. Yes. NIPSCO’s scorecard system of combining various metrics to aid in the 11
determination of the preferred portfolio—which was also utilized in the 12
Company’s CPCN filing1—introduces additional biases against the adoption of 13
efficiency measures and renewable resources, particularly in the process used to 14
determine the Company’s retirement portfolio. As described in our report, 15
Attachment EAS-2 and Attachment EAS-2-Confidential, NIPSCO’s method of 16
determining which resources to retire includes the following flaws: 17
Its metric for communities and local economy is insufficiently documented 18
and appears to be one-sided, including expected economic losses from coal 19
retirement but not economic gains from new resources such as efficiency 20
measures and renewables. 21
1 Petitioner’s Exhibit 5, pp. 5-6.
IURC CAUSE NO. 44872 Direct Testimony of Elizabeth A. Stanton, PhD CAC Exhibit 1
9
Its metric for portfolio diversity sets up the “straw man” assumption that all 1
generation replacing retiring coal is a market purchase of gas generation, but 2
then proceeds to penalize portfolios with higher shares of retiring coal 3
generation for their lack of resource diversity—which is entirely the result of 4
the Company’s straw man assumption. If instead NIPSCO had modeled coal 5
generation replaced by a mixed portfolio including efficiency measures, 6
demand response, and renewables, portfolios with a greater share of coal 7
retired would have received a higher score. 8
Q. Please summarize your conclusions and recommendations. 9
A. In 2023, NIPSCO (1) plans to retire some of the coal units at issue here, and (2) is 10
treating replacement of these coal units with a combined cycle gas turbine 11
(“CCGT”) as the default option in this case. Considering the replacement 12
capacity that may be needed in 2023, it is critically important for NIPSCO to be 13
required to do a proper analysis of all cost-effective demand side management 14
(“DSM”) and renewable resource alternatives, rather than NIPSCO setting itself 15
up to settle on a CCGT in 2023. Even if NIPSCO still finds, after addressing 16
deficiencies in its analysis, that some new gas capacity is needed, a better analysis 17
of alternatives may result in a smaller CCGT being proposed that would lower 18
costs for ratepayers. Furthermore, should NIPSCO perform a better analysis of 19
DSM and renewables now, rather than waiting until a future proceeding, it could 20
result in NIPSCO ramping up DSM and renewables more quickly, reducing long-21
term costs to ratepayers. Therefore, it is my recommendation that the CPCN be 22
denied due to the deficient IRP analysis and that NIPSCO take the time to 23

IURC CAUSE NO. 44872 Direct Testimony of Elizabeth A. Stanton, PhD CAC Exhibit 1
10
improve its analysis of DSM and renewables given the need for capacity that will 1
result from its planned retirements. 2
Q. Does this conclude your testimony? 3
A. Yes. 4
VERIFICATION
I, Elizabeth Stanton, PhD, affirm under penalties of perjury that the foregoing representations are
true and correct to the best of my knowledge, information and belief.
April3,2017
Elizabeth Stanton, PhD Date

ATTACHMENT EAS-1
lizstantonconsulting.com Page 1 of 12 Elizabeth A. Stanton, PhD
Elizabeth A. Stanton, Ph.D., Independent Consultant Liz Stanton Consulting Arlington MA 781-819-3232 [email protected]
PROFESSIONAL EXPERIENCE
Liz Stanton Consulting, Arlington, MA. Independent Consultant, August 2016 ‒ Current.
Providing consulting services on the economics of energy, environment and equity.
Synapse Energy Economics Inc., Cambridge, MA. Principal Economist, 2012 ‒ 2016.
Consulted on issues of energy economics, environmental impacts, climate change policy, and environmental externalities valuation.
Stockholm Environment Institute - U.S. Center, Somerville, MA. Senior Economist, 2010 ‒ 2012; Economist, 2008 ‒ 2009.
Wrote extensively for academic, policy, and general audiences, and directed studies for a wide range of government agencies, international organizations, and nonprofit groups.
Global Development and Environment Institute, Tufts University, Medford, MA. Researcher, 2006 ‒ 2007.
Political Economy Research Institute, University of Massachusetts-Amherst, Amherst, MA. Editor and Researcher ‒ Natural Assets Project, 2002 ‒ 2005.
Center for Popular Economics, University of Massachusetts-Amherst, Amherst, MA. Program Director, 2001 ‒ 2003.
EDUCATION
University of Massachusetts-Amherst, Amherst, MA
Doctor of Philosophy in Economics, 2007
New Mexico State University, Las Cruces, NM
Master of Arts in Economics, 2000
School for International Training, Brattleboro, VT
Bachelor of International Studies, 1994
AFFILIATIONS
Global Development and Environment Institute, Tufts University, Medford, MA.
Research Fellow, 2007 ‒ present.
lizstantonconsulting.com Page 2 of 12 Elizabeth A. Stanton, PhD
TEACHING EXPERIENCE
College of New Rochelle, New Rochelle, NY
Assistant Professor, Department of Social Sciences, 2007 ‒ 2008
Tufts University, Medford, MA
Adjunct Professor, Department of Urban Environmental Policy and Planning, 2007
Fitchburg State College, Fitchburg, MA
Adjunct Professor, Social Sciences Department, 2006
University of Massachusetts-Amherst, Amherst, MA
Adjunct Professor, Department of Economics, 2003 ‒ 2006
Castleton State College and the Southeast Vermont Community Learning
Collaborative, Dummerston, VT
Adjunct Professor, 2005
School for International Training, Brattleboro, VT
Adjunct Professor, Program in Intercultural Management, Leadership, and Service, 2004
BOOKS AND BOOK CHAPTERS
Ackerman, F. and E. A. Stanton. 2015. “Climate Impacts on Agriculture: A Challenge to Complacency?” In The Oxford Handbook of the Macroeconomic of Global Warming, eds. Bernard, L. and W. Semmler. New York: Oxford University Press. (Previous edition appeared as Global Development and Environment Institute Working Paper No.13-01.)
Ackerman, F. and E. A. Stanton. 2014. Climate and Global Equity. London: Anthem Press.
Ackerman, F. and E. A. Stanton. 2013. Climate Economics: The State of the Art (Routledge Studies in Ecological Economics). Oxford: Routledge.
Stanton, E. A. 2011. “Greenhouse Gases and Human Well-Being: China in a Global Perspective.” In The Economics of Climate Change in China: Towards and Low-Carbon Economy eds. Gang, F., N. Stern, O. Edenhofer, X. Shanda, K. Eklund, F. Ackerman, L. Lailai, K. Hallding. London: Earthscan. (Previous version appeared as Stockholm Environment Institute-U.S. Center Working Paper WP-US-0907.)
Boyce, J. K., E. A. Stanton, and S. Narain, eds. 2007. Reclaiming Nature: Worldwide Strategies for Building Natural Assets. London: Anthem Press.
Boyce, J. K., E. A. Stanton, and S. Narain. 2007. “Land Reform and Sustainable Development.” In Reclaiming Nature: Worldwide Strategies for Building Natural Assets, eds. Boyce, J. K., E. A. Stanton, and S. Narain. London: Anthem Press.
lizstantonconsulting.com Page 3 of 12 Elizabeth A. Stanton, PhD
Stanton, E. A. 2007. “Inequality and the Human Development Index.” PhD dissertation, University of Massachusetts-Amherst, 2007.
Stanton, E. A. and J. K. Boyce. 2005. Environment for the People. Political Economy Research Institute: Amherst, MA.
PAPERS AND REPORTS
Knight, P., E. A. Stanton. 2016. “Sorting Out New England’s Pipeline Needs: A Round Up of Recent Studies and What They Mean. Synapse Energy Economics White Paper.
Stanton, E. A., P. Knight, A. Allison, T. Comings, A. Horowitz, W. Ong, N. R. Santen, K. Takahashi. 2016. The RGGI Opportunity 2.0: RGGI as the Electric Sector Compliance Tool to Achieve 2030 State Climate Targets. Prepared by Synapse Energy Economics for Sierra Club, Pace Energy and Climate Center, and Chesapeake Climate Action Network.
Jackson, S., P. Luckow, E. A. Stanton, A. Horowitz, P. Peterson, T. Comings, J. Daniel, and T. Vitolo. 2016. Reimagining Brayton Point: A Guide to Assessing Reuse Options for the Somerset Community. Prepared by Synapse Energy Economics for Coalition for Clean Air South Coast, Clean Water Action, and Toxics Action Center.
Stanton, E. A., P. Knight, A. Allison, T. Comings, A. Horowitz, W. Ong, N. R. Santen, K. Takahashi. 2016. The RGGI Opportunity: RGGI as the Electric Sector Compliance Tool to Achieve 2030 State Climate Targets. Prepared by Synapse Energy Economics for Sierra Club, Pace Energy and Climate Center, and Chesapeake Climate Action Network.
Luckow, P., E. A. Stanton, S. Fields, W. Ong, B. Biewald, S. Jackson, J. Fisher. 2016. Spring 2016 National Carbon Dioxide Price Forecast. Synapse Energy Economics White Paper.
Knight, P., A. Allison, W. Ong, N. R. Santen, E. A. Stanton. 2016. Cutting Electric Bills with the Clean Power Plan. Prepared by Synapse Energy Economics for The Energy Foundation.
Horowitz, A., S. Jackson, A. Allison, E. A. Stanton. 2016. Environmental Justice and the Clean Power Plan. Prepared by Synapse Energy Economics for The Energy Foundation.
Jackson, S., N. R. Santen, P. Knight, S. Fields, B. Biewald, E. A. Stanton. 2015. Clean Power Plan Handbook: A Guide to the Final Rule for Consumer Advocates. Prepared by Synapse Energy Economics for National Association of State Utility Consumer Advocates.
Wilson, R., T. Comings, E. A. Stanton. 2015. Analysis of the Tongue River Railroad Draft Environmental Impact Statement. Prepared by Synapse Energy Economics for Sierra Club and Earthjustice.
Knight, P., S. Fields, S. Jackson, W. Ong, N. R. Santen, B. Biewald, E. A. Stanton. 2015. Multi-State Compliance with the Clean Power Plan in CP3T. Prepared by Synapse Energy Economics for the National Association of State Utility Consumer Advocates.
lizstantonconsulting.com Page 4 of 12 Elizabeth A. Stanton, PhD
Vitolo, T., P. Luckow, S. Fields, P. Knight, B. Biewald, E. A. Stanton. 2015. Lower Electric Costs in a Low- Emission Future. Prepared by Synapse Energy Economics for The Energy Foundation.
Stanton, E. A., T. Comings, S. Jackson, E. Karaca. 2015. Atlantic Coast Pipeline Benefits Review. Prepared by Synapse Energy Economics for Southern Environmental Law Center.
Wilson, R., M. Whited, S. Jackson, B. Biewald, E. A. Stanton. 2015. Best Practices in Planning for Clean Power Plan Compliance. Prepared by Synapse Energy Economics for the National Association of State Utility Consumer Advocates.
Fields, S., S. Jackson, P. Knight, E. A. Stanton. 2015. Internal briefing on Clean Power Plan compliance in Ohio. Prepare by Synapse Energy Economics for Office of the Ohio Consumers’ Counsel.
Luckow, P., E. A. Stanton, S. Fields, B. Biewald, S. Jackson, J. Fisher, R. Wilson. 2015. 2015 Carbon Dioxide Price Forecast. Synapse Energy Economics White Paper.
Knight, P., A. Allison, E. A. Stanton. 2015. Preliminary Clean Power Plan Analysis for Kentucky. Prepared by Synapse Energy Economics for Kentuckians for the Commonwealth.
Stanton, E. A., P. Knight, J. Daniel, B. Fagan, D. Hurley, J. Kallay, E. Karaca, G. Keith, E. Malone, W. Ong, P. Peterson, L. Silvestrini, K. Takahashi, R. Wilson. 2015. Massachusetts Low Gas Demand Analysis: Final Report. Prepared by Synapse Energy Economics for the Massachusetts Department of Energy Resources.
Fields, S., E. A. Stanton, P. Knight, B. Biewald, J. Daniel, S. Jackson, E. Karaca, J. Rosenkranz, K. Takahashi. 2014. Calculating Alabama's 111(d) Target. Prepared by Synapse Energy Economics for the Southern Environmental Law Center.
Fields, S., E. A. Stanton, P. Knight, B. Biewald, J. Daniel, S. Jackson, E. Karaca, J. Rosenkranz, K. Takahashi. 2014. Calculating Georgia's 111(d) Target. Prepared by Synapse Energy Economics for the Southern Environmental Law Center.
Fields, S., E. A. Stanton, P. Knight, B. Biewald, J. Daniel, S. Jackson, E. Karaca, J. Rosenkranz, K. Takahashi. 2014. Alternate Scenarios for 111(d) Implementation in North Carolina. Prepared by Synapse Energy Economics for the Southern Environmental Law Center.
Stanton, E. A. 2014. “What Carbon Costs Us.” Economists for Peace & Security Quarterly 27 (4): 7-8.
Stanton, E. A., S. Jackson, B. Biewald, M. Whited. 2014. Final Report: Implications of EPA’s Proposed “Clean Power Plan.” Prepared by Synapse Energy Economics for the National Association of State Utility Consumer Advocates.
Stanton, E. A., J. Daniel, T. Vitolo, P. Knight, D. White, G. Keith. 2014. Net Metering in Mississippi: Costs, Benefits, and Policy Considerations. Prepared by Synapse Energy Economics for the Public Service Commission of Mississippi.
lizstantonconsulting.com Page 5 of 12 Elizabeth A. Stanton, PhD
Knight, P., E. A. Stanton, B. Biewald, J. Daniels, S. Fields, S. Jackson, A. Napoleon, J. Rosenkranz, and K. Takahashi. 2014. Internal briefing on Clean Power Plan implementation in Virginia. Prepared by Synapse Energy Economics for Sierra Club.
Jackson, S., E. A. Stanton. 2014. Internal briefing on Clean Power Plan implementation in Minnesota. Prepared by Synapse Energy Economics for Sierra Club.
Knight, P., E. A. Stanton, B. Biewald, J. Daniels, S. Fields, S. Jackson, A. Napoleon, J. Rosenkranz, and K. Takahashi. 2014. Internal briefing on Clean Power Plan implementation in Florida. Prepared by Synapse Energy Economics for Sierra Club.
E. A. Stanton, S. Jackson, B. Biewald, M. Chang, J. Daniels, S. Fields, P. Knight, A. Napoleon, M. Whited, and K. Takahashi. 2014. Internal briefing on Clean Power Plan implementation in Arizona, Montana, Nevada, and Utah. Prepared by Synapse Energy Economics for Sierra Club.
E. A. Stanton, S. Jackson, B. Biewald, M. Chang, J. Daniels, S. Fields, P. Knight, A. Napoleon, and K. Takahashi. 2014. Internal briefing on Clean Power Plan implementation Illinois. Prepared by Synapse Energy Economics for Sierra Club.
Luckow, P., E. A. Stanton, B. Biewald, S. Fields, S. Jackson, J. Fisher, F. Ackerman. 2014. CO2
Price Report, Spring 2014: Includes 2013 CO2 Price Forecast. Synapse Energy Economics White Paper.
Fisher, J., P. Knight, E. A. Stanton, and B. Biewald. 2014. Avoided Emissions and Generation Tool (AVERT): User Manual. Version 1.0. Prepared by Synapse Energy Economics for the U.S. Environmental Protection Agency.
Stanton, E. A., M. Whited, F. Ackerman. 2014. Estimating the Cost of Saved Energy in Utility Efficiency Programs. Prepared by Synapse Energy Economics for the U.S. Environmental Protection Agency.
Stanton, E. A., F. Ackerman, J. Daniel. 2013. Comments on the 2013 Technical Update of the Social Cost of Carbon. Prepared by Synapse Energy Economics for the Environment, Economics and Society Institute.
Luckow, P., E. A. Stanton, B. Biewald, J. Fisher, F. Ackerman, E. Hausman. 2013. 2013 Carbon Dioxide Price Forecast. Synapse Energy Economics White Paper.
Stanton, E. A., S. Jackson, G. Keith, E. Malone, D. White, T. Woolf. 2013. A Clean Energy Standard for Massachusetts. Prepared by Synapse Energy Economics for the Massachusetts Clean Energy Center and the Massachusetts Departments of Energy Resources, Environmental Protection, and Public Utilities.
Knight, P., E. A. Stanton, J. Fisher, B. Biewald. 2013. Forecasting Coal Unit Competitiveness: Coal Retirement Assessment Using Synapse’s Coal Asset Valuation Tool (CAVT). Prepared by Synapse Energy Economics for Energy Foundation.
lizstantonconsulting.com Page 6 of 12 Elizabeth A. Stanton, PhD
Hornby, R., P. Chernick, D. White, J. Rosenkranz, R. Denhardt, E. Stanton, J. Glifford, B. Grace, M. Chang, P. Luckow, T. Vitolo, P. Knight, B. Griffiths, B. Biewald. 2013. Avoided Energy Supply Costs in New England: 2013 Report. Prepared by Synapse Energy Economics for the Avoided-Energy-Supply-Component (AESC) Study Group.
Stanton, E. A., T. Comings, K. Takahashi, P. Knight, T. Vitolo, E. Hausman. 2013. Economic Impacts of the NRDC Carbon Standard. Prepared by Synapse Energy Economics for the Natural Resources Defense Council.
Stanton, E. A. 2013. Background research, consulting and support related to the Danish Energy Agency, Organisation for Economic Co-operation, and the UNEP Riso Centre’s “National Greenhouse Gas Emissions Baseline Scenarios: Learning from Experiences in Developing Countries.”
Whited, M., D. White, S. Jackson, P. Knight, E. A. Stanton. 2013. Declining Markets for Montana Coal. Prepared by Synapse Energy Economics for Northern Plains Resource Council.
Stanton, E. A., F. Ackerman. 2013. Climate Impacts on Agriculture: A Challenge to Complacency? Global Development and Environment Institute Working Paper 13-01.
Stanton, E. A., F. Ackerman, T. Comings, P. Knight, T. Vitolo, E. Hausman. 2013. Will LNG Exports Benefit the United States Economy? Prepared by Synapse Energy Economics for the Sierra Club.
Ackerman, F., T. Vitolo, E. Stanton, G. Keith. 2013. Not-so-smart ALEC: Inside the attacks on renewable energy. Prepared by Synapse Energy Economics for the Civil Society Institute.
Ackerman, F., E. A. Stanton, R. Bueno. 2012. Climate Policy and Development: An Economic Analysis. Economics for Equity and the Environment (E3 Network) Working Paper.
Stanton, E. A., M. Taylor. 2012. A Good Environment for Jobs. Economics for Equity and the Environment (E3 Network) Working Paper.
Stanton, E. A., F. Ackerman, R. Bueno. 2012. Reason, Empathy, and Fair Play: The Climate Policy Gap. UNDESA Working Paper No.113.
Erickson, P., M. Lazarus, E. A. Stanton, C. Chandler, R. Bueno, F. Ackerman, C. Munitz, J. Cegan. 2012. Greenhouse Gas Emissions in King County: An Updated Geographic-plus Inventory, a Consumption-based Inventory, and an Ongoing Tracking Framework. Prepared by Stockholm Environment Institute-U.S. Center for King County, Washington.
Stanton, E. A., R. Bueno, J. Cegan, C. Munitz. 2012. King County Community Greenhouse Gas Emissions Inventory – Consumption Methodology: Technical Report. Prepared by Stockholm Environment Institute-U.S. Center for King County, Washington.
Stanton, E. A., J. Cegan, R. Bueno, F. Ackerman. 2012. Estimating Regions’ Relative Vulnerability to Climate Damages in the CRED Model. Stockholm Environment Institute-U.S. Center Working Paper WP-US-1103.
lizstantonconsulting.com Page 7 of 12 Elizabeth A. Stanton, PhD
Stanton, E. A. 2012. Development without Carbon as Climate Policy. Economics for Equity and the Environment (E3 Network) Working Paper.
Ackerman, F., E. A. Stanton, R. Bueno. 2012. Epstein-Zin utility in DICE: Is risk aversion irrelevant to climate policy? Economics for Equity and the Environment (E3 Network) Working Paper.
Stanton, E. A., R. Bueno, M. Davis. 2011. Real People, Real Impacts: The Climate Impact Equity Lens. Stockholm Environment Institute-U.S. Center Report.
Stanton, E. A., R. Bueno. 2011. The CIEL Backgrounder: Understanding the Climate Impact Equity Lens. Stockholm Environment Institute-U.S. Center Report.
Stanton E. A. 2011. Development without Carbon: Climate and the Global Economy through the 21st Century. Stockholm Environment Institute-U.S. Center Report.
Erickson, P., M. Lazarus, E. A. Stanton, F. Ackerman. 2011. Consumption-Based Greenhouse Gas Emissions Inventory for Oregon – 2005: Summary Report. Prepared by Stockholm Environment Institute-U.S. Center for the State of Oregon Department of Environmental Quality.
Stanton, E. A., R. Bueno, F. Ackerman, P. Erickson, R. Hammerschlag, J. Cegan. 2011. Consumption-Based Greenhouse Gas Emissions Inventory for Oregon – 2005: Technical Report. Prepared by Stockholm Environment Institute-U.S. Center for the State of Oregon Department of Environmental Quality.
Ackerman, F., E. A. Stanton. 2011. The Social Cost of Carbon. Economics for Equity and the Environment (E3 Network) White Paper.
Stanton, E. A., R. Bueno, J. Cegan, C. Munitz. 2011. Consumption-Based Emissions Inventory for San Francisco: Technical Report. Prepared by Stockholm Environment Institute-U.S. Center for the City of San Francisco, California.
Stanton, E. A., F. Ackerman. 2011. Developing Baselines for Climate Policy Analysis. Prepared by Stockholm Environment Institute-U.S. Center as additional guidance for “United Nations Environmental Programme (UNEP) MCA4climate Initiative: A practical framework for planning pro-development climate policies.”
Ackerman, F., E. A. Stanton. 2011. A practical framework for planning pro- development climate policies. Prepared by Stockholm Environment Institute-U.S. Center as additional guidance for “United Nations Environmental Programme (UNEP) MCA4climate Initiative: A practical framework for planning pro-development climate policies.”
Ackerman, F., E. A. Stanton. 2011. The Last Drop: Climate Change and the Southwest Water Crisis. Stockholm Environment Institute-U.S. Center Report funded by the Kresge Foundation.
Stanton, E. A., E. Fitzgerald. 2011. California Water Supply and Demand: Technical Report. Stockholm Environment Institute-U.S. Center Report funded by the Kresge Foundation.
lizstantonconsulting.com Page 8 of 12 Elizabeth A. Stanton, PhD
Bueno, R., E. A. Stanton. 2011. Casting DICE for 350 ppm. Stockholm Environment Institute-U.S. Center Working Paper WPUS-1101.
Stanton, E. A., F. Ackerman. 2010. Emission Reduction, Interstate Equity, and the Price of Carbon. Prepared by Stockholm Environment Institute-U.S. Center Economics for Equity and the Environment (E3 Network).
Stanton, E. A., F. Ackerman. A2010. No State Left Behind: A Better Approach to Climate Policy. Economics for Equity and the Environment (E3 Network) White Paper.
Ackerman, F., E. A. Stanton, R. Bueno. 2010. CRED: A New Model of Climate and Development. United Nations Department of Economic and Social Affairs Working Paper No.96.
Stanton, E. A., M. Davis, A. Fencl. 2010. Costing Climate Impacts and Adaptation: A Canadian Study on Coastal Zones. Prepared by Stockholm Environment Institute-U.S. Center for the National Round Table on the Environment and the Economy Economic Risks and Opportunities of Climate Change Program.
Ackerman, F., E. A. Stanton. 2010. The socio-economic implications of climate change on FYR Macedonia and national policy options on adaptation. United Nations Development Programme (UNDP) Report.
Ackerman, F., E. A. Stanton, S. DeCanio, E. Goodstein, R. Howarth, R. Norgaard, C. Norman, K. Sheeran. 2009. The Economics of 350: The Benefits and Costs of Climate Stabilization. Economics for Equity and the Environment (E3 Network), Stockholm Environment Institute-U.S. Center, and Ecotrust Report.
Stanton, E. A., F. Ackerman, K. Sheeran. 2009. Understanding Interstate Differences in U.S. Greenhouse Gas Emissions. Stockholm Environment Institute-U.S. Center Working Paper WP-US-1004.
Stanton, E. A., F. Ackerman, K. Sheeran. 2009. Greenhouse Gases and the American Lifestyle: Understanding Interstate Differences in Emissions. Economics for Equity and the Environment (E3 Network), and Ecotrust Report.
Stanton, E. A., F. Ackerman, F. Resende. 2009. The Socio-Economic Impact of Climate Change in Armenia. Stockholm Environment Institute-U.S. Center for the United Nations Development Programme (UNDP).
Stanton, E. A., F. Ackerman. 2008. Generated User Benefits and the Heathrow Expansion: Understanding Consumer Surplus. Prepared by Stockholm Environment Institute-U.S. Center for Friends of the Earth England, Wales and Northern Ireland.
Stanton, E. A., F. Ackerman. 2008. Out of the “hadows: What’s Behind DEF‘A’s New Approach to the Price of Carbon. Prepared by Stockholm Environment Institute-U.S. Center for Friends of the Earth England, Wales and Northern Ireland.
lizstantonconsulting.com Page 9 of 12 Elizabeth A. Stanton, PhD
Bueno, R., C. Herzfeld, E. A. Stanton, F. Ackerman. 2008. The Caribbean and Climate Change: The Costs of Inaction. Prepared by Stockholm Environment Institute-U.S. Center for Environmental Defense Fund.
Ackerman, F., E. A. Stanton. 2008. The Cost of Climate Change: What We’ll Pay if Global Warming Continues Unchecked. Prepared by Stockholm Environment Institute-U.S. Center for Natural Resources Defense Council.
Stanton, E. A. 2008. Literature review of water resources infrastructure and related environmental costs and benefits for “Default Case Study Values and Management Options for WEAP in Massachusetts.” Prepared by Stockholm Environment Institute-U.S. Center for Keep Water Local, a project of the Massachusetts Riverways Program, Commonwealth of Massachusetts.
Stanton, E. A., F. Ackerman.2007. Florida and Climate Change: The Costs of Inaction. Prepared by Global Development and Environmental Institute ‒ Tufts University for Environmental Defense.
Stanton, E. A. 2007. United States-Specific Human Development Index: Methodology and Data. Report commissioned by American Human Development Report Project, as a technical background paper to The Measure of America: American Human Development Report 2008-2009.
Ackerman, F., E. A. Stanton. 2006. Climate Change – the Costs of Inaction. Prepared by Global Development and Environmental Institute ‒ Tufts University for Friends of the Earth England, Wales and Northern Ireland.
Ackerman, F., E. A. Stanton. 2006. Implications of REACH for the Developing Countries. Global Development and Environmental Institute ‒ Tufts University for European Parliament, Directorate- General for External Policies of the Union.
JOURNAL ARTICLES
Luckow, P., J. Daniel, S. Fields, E. A. Stanton, B. Biewald. 2014. “CO2 Price Forecast: Planning for Future Environmental Regulations.” EM Magazine, June 2014, 57-59.
Ackerman, F., E. A. Stanton, R. Bueno. 2013. “Epstein-Zin utility in DICE: Is risk aversion irrelevant to climate policy?” Environmental and Resource Economics 56 (1): 73-84.
Stanton, E. A. 2012. “Modeling Pessimism: Does Climate Stabilization Require a Failure of Development?” Environmental Development 3: 65-76.
Stanton, E. A. 2012. “The Tragedy of Maldistribution: Climate, Sustainability, and Equity.” Sustainability 4 (3): 394-411.
Erickson, P., D. Allaway, M. Lazarus, E. A. Stanton. 2012. “A Consumption-Based GHG Inventory for the U.S. State of Oregon.” Environmental Science & Technology 46 (7): 3679-3686.
lizstantonconsulting.com Page 10 of 12 Elizabeth A. Stanton, PhD
Ackerman, F., E. A. Stanton, R. Bueno. 2011. “CRED: A new model of climate and development.” Ecological Economics 85: 166-176.
Ackerman, F. and E. A. Stanton. 2012. “Climate Risks and Carbon Prices: Revising the Social Cost of Carbon.” Economics: The Open-Access, Open-Assessment E-Journal 6 (2012-10): 1-25.
Ackerman, F., E. A. Stanton, S. DeCanio, E. Goodstein, R. Howarth, R. Norgaard, C. Norman, K. Sheeran. 2010. “The Economics of 350.” Solutions 1 (5): 49-56.
Ackerman, F., E. A. Stanton, R. Bueno. 2010. “Fat Tails, Exponents, Extreme Uncertainty: Simulating Catastrophe in DICE.” Ecological Economics 69 (8): 1657-1665.
Stanton, E. A., F. Ackerman. 2009. “Climate and development economics: Balancing science, politics and equity.” Natural Resources Forum 33 (4): 262-273.
Stanton, E. A., F. Ackerman, S. Kartha. 2009. “Inside the Integrated Assessment Models: Four Issues in Climate Economics.” Climate and Development 1 (2): 166-184.
Stanton, E. A. 2009. “Negishi welfare weights in integrated assessment models: The mathematics of global inequality.” Climatic Change 107 (3): 417-432.
Ackerman, F., E. A. Stanton, C. Hope, S. Alberth. 2009. “Did the Stern Review Underestimate U.S. and Global Climate Damages?” Energy Policy 37 (7): 2717-2721.
Ackerman, F., E. A. Stanton. 2008. “Can Climate Change Save Lives? A comment on ‘Economy-wide estimates of the implications of climate change: Human health’”. Ecological Economics 66 (1): 8-13. (Previous edition appeared as Global Development and Environment Institute Working Paper No.06-05.)
Ackerman, F., E. A. Stanton, B. Roach, A. S. Andersson. 2008. “Implications of REACH for Developing Countries.” European Environment 18 (1): 16-29.
Ackerman, F., E. A. Stanton, R. Massey. 2007. “European Chemical Policy and the United States: The Impacts of REACH.” Renewable Resources Journal 25 (1). (Previously published as Global Development and Environment Institute Working Paper No.06-06.)
TESTIMONY AND EXPERT COMMENTS
Stanton, E. A. 2016. Testimony Regarding the National Grid Analysis of Economic Benefits of Proposed Access Northeast Gas Pipeline. Testimony to the Massachusetts Department of Public Utilities on behalf of Conservation Law Foundation. Docket No. 16-05. June 20, 2016.
Stanton, E. A. 2016. Testimony Regarding the Eversource Analysis of Economic Benefits of Proposed Access Northeast Gas Pipeline. Testimony to the Massachusetts Department of Public Utilities on behalf of Conservation Law Foundation. Docket No. 15-181. June 13, 2016.
lizstantonconsulting.com Page 11 of 12 Elizabeth A. Stanton, PhD
Stanton, E. A. 2016. Testimony on Byron Fleet Benefits. Testimony to the Illinois Property Tax Appeal Board on behalf of Whitt Law, Docket Nos. 12-01248 and 12-02297. May 18, 2016.
Stanton, E. A., P. Knight, F. Ackerman, and N. R. Santen. 2015. Byron Fleet Benefit Rebuttal. Expert comments submitted by Whitt Law to the Illinois Property Tax Appeal Board, Docket Nos. 12-01248 and 12-02297. April 3, 2015.
Nogee, A., M. Chang, P. Knight, and E. A. Stanton. 2015. Electricity Market Restructuring and the Nuclear Industry. Expert comments submitted by Whitt Law testimony regarding Byron Station to the Illinois Property Tax Appeal Board, Docket Nos. 12-01248 and 12-02297. April 3, 2015.
Stanton, E. A. 2015. Testimony on the Economic Analyses of a Proposed Brockton Power Company Generating Facility. Testimony before the Massachusetts Department of Environmental Protection on behalf of Alternatives for Community & Environment, Docket No. 2011-025 & 026.
Stanton, E. A. and P. Knight. 2015. Testimony in Opposition to HB 208 Repealing the New Hampshire Regional Greenhouse Gas Initiative. Testimony to the Science, Technology and Energy Committee on behalf of New Hampshire’s Office of Consumer Advocate. January 22, 2015.
Stanton, E. A. 2014. Testimony Regarding the Cost of Compliance with the Global Warming Solutions Act. Testimony to the Commonwealth of Massachusetts Department of Public Utilities on behalf of the Massachusetts Department of Energy Resources and the Department of Environmental Protection, Docket No. DPU 14-86.
Stanton E. A., F. Ackerman, and J. Daniel. 2014. Comments on the 2013 Technical Update of the Social Cost of Carbon. Submitted to the U.S. Office of Management and Budget as part of Environment, Economics, and Society Institute comments on Docket No. OMB-2013-0007.
Stanton, E. A. 2013. Testimony Regarding the Prudency of Public Service of New Hampshire’s Scrubber Project at Merrimack Station. Testimony on behalf of the Conservation Law Foundation. Testimony to the New Hampshire Public Utilities Commission, Docket No. DE 11-250.
Stanton E. A., J. Daniel, F. Ackerman, S. Jackson. 2013. Review of EPA’s June 2013 Steam Electric Effluent Limitations and Guidelines (40 CFR Part 423). Submitted as part of Earthjustice/Sierra Club/Environmental Integrity Project testimony on Docket No. EPA-HQ-OW-2009-0819.
Stanton, E. A., P. Knight, and F. Ackerman. 2013. LaSalle Fleet Benefit Rebuttal. Expert comments submitted by Whitt Law to the Illinois Property Tax Appeal Board, Dockets No. 09-04906.001-I-3, 09-04906.002-I-310-03549.001, 10-03549.002, 12-00643.001, 12-00643.002, 12-00643.003.
lizstantonconsulting.com Page 12 of 12 Elizabeth A. Stanton, PhD
Nogee A., M. Chang, P. Knight, E. A. Stanton. 2013. Electricity Market Restructuring and the Nuclear Industry. Expert comments submitted by Whitt Law testimony regarding LaSalle Station to the Illinois Property Tax Appeal Board, Dockets No. 09-04906.001-I-3, 09-04906.002-I-310-03549.001, 10-03549.002, 12-00643.001, 12-00643.002, 12-00643.003.
Stanton, E. A. 2013. Testimony Regarding Vermont Gas System’s Petition for Authorization to Construct New Natural Gas Transmission Pipeline. Testimony on behalf of the Conservation Law Foundation to the State of Vermont Public Service Board, Docket No. 7970.
Ackerman, F., and E. A. Stanton. 2011. Regulation of Cooling Water Intake Structures at Existing Facilities. Comments submitted to the U.S. Environmental Protection Agency, Docket ID EPA-HQ-OW-2008-0667.
Ackerman, F. and E. A. Stanton. 2010. Testimony on EPA’s ‘Coal Combustion Residuals: Proposed Rule’. Comment submitted as part of Earthjustice/Environmental Integrity Project testimony on Docket ID EPA-HQ-RCRA- 2009-6040.
Resume dated August 2016

ATTACHMENT EAS-2
1
March 16, 2017
Dr. Bradley Borum, Director of Research, Policy, and Planning Mr. M. Bob Pauley, Chief Technical Advisor of Research, Policy, and Planning Jeremy Comeau, Assistant General Counsel Indiana Utility Regulatory Commission 101 West Washington Street, Suite 1500 E Indianapolis, Indiana 46204 [email protected] [email protected] [email protected] Electronically delivered
Re: Public Version of the Comments on NIPSCO’s 2016 Integrated Resource Plan
Dear Director Borum, Chief Technical Advisor Pauley, and Assistant General Counsel Comeau,
Pursuant to the Indiana Utility Regulatory Commission’s (“IURC” or “Commission”) draft Integrated Resource Planning Rule, 170 IAC 4-7,1 Citizens Action Coalition of Indiana (“CAC”), Earthjustice, Indiana Distributed Energy Alliance (“IndianaDG”), Sierra Club, and Valley Watch (collectively, “Commenters”) hereby submit the attached public version of the comments by Anna Sommer with Sommer Energy, LLC, and Elizabeth A. Stanton, PhD, with Applied Economics Clinic on the 2016 IRP submitted by the Northern Indiana Public Service Company (“NIPSCO”).2 Please note that Commenters filed their unredacted version under seal in IURC Cause No. 44874, because the filing contained information deemed confidential by NIPSCO and protected as confidential per the Order issued in that Cause. Commenters respectfully reserve the right to challenge NIPSCO’s confidential designation of the information. We appreciate the opportunity to comment, as well as Commission Staff’s willingness to provide us with extensions of time that allowed us to seek information from NIPSCO through an informal discovery process.
As last year’s Electricity Director’s Final Report on the 2015 IRPs affirmed, “[w]ith the passage of P.L. 246-2015 (SEA 412-2015) on May 6, 2015, Indiana law now explicitly requires
1 All references to the Commission’s IRP Rule, 170 IAC 4-7, refer to the revised draft of the Proposed IRP Rule, which the Commission circulated on October 4, 2012 in the IRP rulemaking, RM# 11-07. As explained in the Electricity Director’s Final Report on the 2015 IRPs, since 2012 the Commission, utilities, and other stakeholders have followed the requirements of the draft rule (which was negotiated collaboratively, and includes improvements on the prior IRP rule) as if it were in effect. See Electricity Director’s Final Report: 2015-16 Integrated Resource Plans, at p. 1 (Aug. 30, 2016) (hereinafter “2015 Final Report”), available at http://www.in.gov/iurc/files/Consolidated%20IRP%20Report%20for%20DEI%20IM%20IMPA%20and%20WVPA%20-%20Final%208-30-16.pdf. 2 NIPSCO initially submitted its IRP on November 1, 2016, then submitted a revised version on November 15, 2016. Throughout these comments we refer to the revised version, unless otherwise specified.
Cause No. 44872, CAC Exhibit 1, Attachment EAS-2
2
long-term resource planning for the State of Indiana.”3 Anna Sommer with Sommer Consulting, LLC, and Elizabeth A. Stanton, PhD, with Applied Economics Clinic, have organized these comments to address NIPSCO’s compliance with the specific informational, procedural, and methodological requirements of the Commission’s IRP rule. Although these comments are not meant to be comprehensive reviews of NIPSCO’s IRP process, resource planning practices, or preferred resource plans, the report offers comments in a number of places that have a broader applicability to the IRP process in Indiana. We urge the Commission to consider these comments as it continues its rulemaking process to improve upon the IRP rules for future planning years. Commenters respectfully request that Commission Staff call on NIPSCO and all Indiana utilities to address the informational, procedural, and methodical deficiencies identified in the attached comments both in response to the Director’s Report on this year’s IRPs and in all future resource planning and decision making. As an initial matter, Commenters wish to express appreciation to NIPSCO for moving forward with a planning process in which it has done a commendable job of direct outreach to stakeholders as the Company weighs difficult choices concerning the future of its generation fleet. Commenters appreciate that NIPSCO took the time to speak with stakeholders one-on-one, in addition to the public stakeholder meetings. Commenters also appreciate NIPSCO’s efforts to balance the need to retire aging, uneconomic coal-fired generating units with the concerns of its workers, the communities in which it operates, and the desire to avoid passing stranded costs on to its customers. Commenters acknowledge as an important step forward NIPSCO’s proposal to retire four of its seven coal-fired generating units, representing approximately 50% of the Company’s coal-fired generating capacity, in the coming years. As set forth in detail in the attached comments, however, after completing a technical review of NIPSCO’s IRP, Commenters have identified numerous informational, procedural, and methodological deficiencies that call into question the validity of NIPSCO’s analysis. Many of the issues identified in the attached comments reflect ways in which the actual modeling that NIPSCO did in support of its IRP is not consistent with, or was not adequately documented in, the narrative that NIPSCO presents in its IRP and shared with stakeholders during the public outreach process. Moreover, after several months of attempting to seek clarification and additional information from NIPSCO through an informal discovery process, Commenters still do not have a complete set of information in order to evaluate the validity of NIPSCO’s analysis. The information that Commenters have been able to obtain demonstrates that numerous constraints in NIPSCO’s modeling introduce biases that limit the Company’s analysis of renewable and demand-side resources. As a result of these deficiencies, NIPSCO’s IRP analysis fails to reflect all available, economical demand-side management, distributed generation, and other renewable resource alternatives in their IRP modeling, and it fails to evaluate fairly and transparently the potential benefits to their ratepayers of retiring coal-fired generating units. Finally, we encountered much difficulty in accessing NIPSCO’s complete IRP information for review. This was burdensome for both the utility and us as stakeholders, requiring multiple rounds of discovery, many email communications, and a few phone calls to obtain the basic information required to do a competent review of NIPSCO’s IRP. As such, we endorse the recommendations made by CAC, Indiana Distributed Generation Alliance, the 3 2015 Final Report, at p. 1.
Cause No. 44872, CAC Exhibit 1, Attachment EAS-2
3
Indiana State Conference of the National Association for the Advancement of Colored People (NAACP), Sierra Club, and Valley Watch in IURC Rulemaking #15-06 to include a “technical appendix” as part of the IRP submissions. Since the utilities already have the files and should be able to provide them to stakeholders (under a nondisclosure agreement, if appropriate), it would likely enhance the quality of comments (if stakeholders have complete information at the outset), reduce the burden on stakeholders to provide comments, and likely reduce the number of requests for extensions on the comment period if stakeholders are able to get the basic modeling information upfront instead of having to ask for it over the course of several weeks, as happened this time around.
Thank you very much for this opportunity. We look forward to the issuance of and opportunity to comment on the Director’s Draft Report. Please feel free to contact Jennifer Washburn, Counsel at Citizens Action Coalition, with any questions or concerns.
Respectfully, Kerwin Olson, Executive Director Jennifer Washburn, Counsel Citizens Action Coalition of Indiana 603 E. Washington Street Suite 502 Indianapolis, Indiana 46204 317-735-7727 [email protected] [email protected] Steve Francis, Chairperson Sierra Club, Hoosier Chapter Jodi Perras, Senior Campaign Representative Sierra Club, Indiana Beyond Coal 1100 W. 42nd Street, Suite 218 Indianapolis, Indiana 46208 317-296-8395 [email protected] [email protected] Laura Ann Arnold, President Indiana Distributed Energy Alliance 545 E. Eleventh Street Indianapolis, Indiana 46202 317-635-1701 [email protected]
Thomas Cmar, Staff Attorney Earthjustice 1101 Lake Street, Suite 405B Oak Park, IL 60301 (312) 257-9338 [email protected] Shannon Fisk, Managing Attorney Earthjustice 1617 John F. Kennedy Blvd., Suite 1130 Philadelphia, PA 19103 (215) 717-4522 [email protected] John Blair Valley Watch 800 Adams Avenue Evansville, Indiana 47713 (812) 464-5663 [email protected]
Cause No. 44872, CAC Exhibit 1, Attachment EAS-2
Report on NIPSCO 2016 IRP Public Version Submitted to the IURC on March 16, 2017
1
Report on NIPSCO 2016 IRP
Submitted to the IURC on March 16, 2017
Authors:
Anna Sommer, Sommer Energy, LLC
Elizabeth A. Stanton, PhD, Applied Economics Clinic
on behalf of CAC, Earthjustice, Indiana Distributed Energy Alliance,
Sierra Club, and Valley Watch
Cause No. 44872, CAC Exhibit 1, Attachment EAS-2
Report on NIPSCO 2016 IRP Public Version Submitted to the IURC on March 16, 2017
2
Table of Contents
I. Does the IRP communicate core IRP concepts and results to nontechnical audiences? ......... 8 I‐A. Misleading and incomplete public executive summary .............................................................. 8
I‐B. Presentation of basic information buried ................................................................................... 8
I‐C. Difficulties accessing complete IRP information for review ......................................................... 9
I‐D. Errors and inconsistencies in NIPSCO’s 2016 IRP ........................................................................ 9
I‐E. Recommendations for communicating core IRP concepts and results with nontechnical
audiences ....................................................................................................................................... 10
II. Does IRP documentation include inputs, methods, and definitions? ................................. 11 II‐A. Complete documentation of inputs and outputs ..................................................................... 11
II‐B. Lack of transparency regarding modeling assumptions ............................................................ 12
II‐C. Recommendations for complete documentation of inputs, methods, and definitions ............. 13
III. Does the IRP include a discussion of distributed generation within the service territory and
the potential effects on generation, transmission, and distribution planning and load
forecasting? ........................................................................................................................... 14 III‐A. Unsubstantiated claims of obstacles to renewable adoption .................................................. 14
III‐B. Recommendations for discussion of distributed generation and its potential effects ............. 14
IV. Does the IRP include a description of the generation expansion criteria, including a full
explanation of the basis for the criteria selected? ................................................................. 15 IV‐A. Limitations on expansion options .......................................................................................... 15
IV‐B. Errors in estimation of peak energy ....................................................................................... 16
IV‐C. Recommendations for describing generation expansion criteria ............................................ 16
V. Does the IRP include an explanation of the methods utilized in its development? ............ 17 V‐A. Does the IRP include an explanation of the model structure and reasoning? ........................... 17
V‐B. Does the IRP explain the utility’s efforts to develop and improve its methodology? ................ 17
V‐C. Recommendations for explaining methods used in IRP development ...................................... 17
VI. Does the IRP include an explanation, with supporting documentation, of an avoided cost
calculation for each year in the forecasted period? ............................................................... 18 VI‐A. Avoided costs are inconsistent with similar cost elements in the IRP ..................................... 18
VI‐B. Recommendations for calculating and explaining avoided costs ............................................ 18
VII. Was the preferred resource portfolio selected from among the candidate resource
portfolios developed? ........................................................................................................... 19 VII‐A. Proper selection of a preferred resource portfolio ................................................................ 19
VII‐B. Recommendations for proper selection of a preferred resource portfolio in an IRP ............... 20
VIII. Is the preferred resource portfolio described? ............................................................... 21 VIII‐A. Are the key variables used to develop the preferred resource portfolio described? ............. 21
VIII‐B. Are the assumptions used to develop the preferred resource portfolio described? .............. 21
VIII‐C. Recommendations for adequate description of the preferred portfolio ............................... 22
Cause No. 44872, CAC Exhibit 1, Attachment EAS-2
Report on NIPSCO 2016 IRP Public Version Submitted to the IURC on March 16, 2017
3
IX. Are supply‐side and demand‐side resource alternatives evaluated on a consistent and
comparable basis? ................................................................................................................. 23 IX‐A. Is each supply‐side resource alternative evaluated on a consistent and comparable basis with
other supply‐side resources? .......................................................................................................... 23
IX‐A‐1. Retirement analysis is constructed in a manner such that “Retire 50% Coal” must be the
preferred retirement portfolio ........................................................................................................... 23
IX‐A‐2. Biases against renewables ...................................................................................................... 27
IX‐B. Are supply‐side resource alternatives evaluated on a consistent and comparable basis with
demand‐side resources? ................................................................................................................ 28
IX‐B‐2. Prescreening of demand‐side measures (and not supply‐side measures) ............................. 28
IX‐B‐2. Failure to document DSM selection ........................................................................................ 30
IX‐B‐3. Contradictory explanations of assumed program potential ................................................... 30
IX‐B‐4. All‐or‐nothing bundle selection ............................................................................................... 33
IX‐B‐5. Apparent errors in DSM savings modeled ............................................................................... 33
IX‐C. Recommendations for a consistent and comparable resource evaluation ............................... 34
X. Does the preferred resource portfolio utilize all economical resource alternatives as
sources of new supply? ......................................................................................................... 35 X‐A. Overall issues with NIPSCO’s method of selection of economical resources ............................ 35
X‐A‐1. Incorrect climate and weather assumptions ........................................................................... 35
X‐A‐2. Potentially problematic assumptions about power prices ...................................................... 35
X‐A‐3. Key aspect of NIPSCO’s preferred portfolio likely decided before IRP modeling conducted .. 37
X‐A‐4. Retirement analysis alternative incorrectly modeled .............................................................. 38
X‐B. Does the preferred resource portfolio utilize all economical load management, demand‐side
management, and energy efficiency improvements? ..................................................................... 38
X‐C. Does the preferred resource portfolio utilize all economical technology relying on renewable
resources? ...................................................................................................................................... 39
X‐D. Does the preferred resource portfolio utilize all economical cogeneration? ............................ 39
X‐E. Does the preferred resource portfolio utilize all economical distributed generation? .............. 39
X‐F. Does the preferred resource portfolio utilize all economical energy storage? .......................... 39
X‐G. Does the preferred resource portfolio utilize all economical transmission? ............................. 39
X‐H. Recommendations for utilizing all economical resource alternatives ...................................... 39
XI. Are targeted DSM programs evaluated, including their impacts on the utility’s
transmission and distribution system? .................................................................................. 40
XII. Are the financial impacts to the utility of acquiring the future resources identified in the
preferred resource portfolio assessed? ................................................................................. 41
XIII. Does the preferred resource portfolio balance cost minimization with cost‐effective risk
and uncertainty reduction? ................................................................................................... 42
XIV. Are risks and uncertainties quantified, including, but not limited to: regulatory
compliance, public policy, fuel prices, construction costs, resource performance, load
requirements, wholesale electricity and transmission prices, RTO requirements, and
technological progress? ......................................................................................................... 43
Cause No. 44872, CAC Exhibit 1, Attachment EAS-2
Report on NIPSCO 2016 IRP Public Version Submitted to the IURC on March 16, 2017
4
XIV‐A. Limited scope of sensitivity analysis..................................................................................... 43
XIV‐B. Recommendations for quantifying risks and uncertainties ................................................... 44
XV. Is the performance of candidate resource portfolios analyzed across a wide range of
potential futures? .................................................................................................................. 45
XVI. Are candidate resource portfolios ranked by present value of revenue requirement and
by risk metric? ....................................................................................................................... 46 XVI‐A. Are candidate resource portfolios ranked by their present value of revenue requirement in
total dollars and dollars per kilowatt‐hour delivered with discount rate specified? ........................ 46
XVI‐B. Are candidate resource portfolios ranked by risk metric? .................................................... 46
XVI‐C. Recommendations for appropriate ranking PVRR and risk metric ........................................ 46
XVII. Does an assessment of robustness factor into the selection of the preferred portfolio? 47
XVIII. Does the preferred resource portfolio incorporate a workable strategy for reacting to
unexpected changes in circumstances quickly and appropriately? ........................................ 48
Cause No. 44872, CAC Exhibit 1, Attachment EAS-2
Report on NIPSCO 2016 IRP Public Version Submitted to the IURC on March 16, 2017
5
Overview
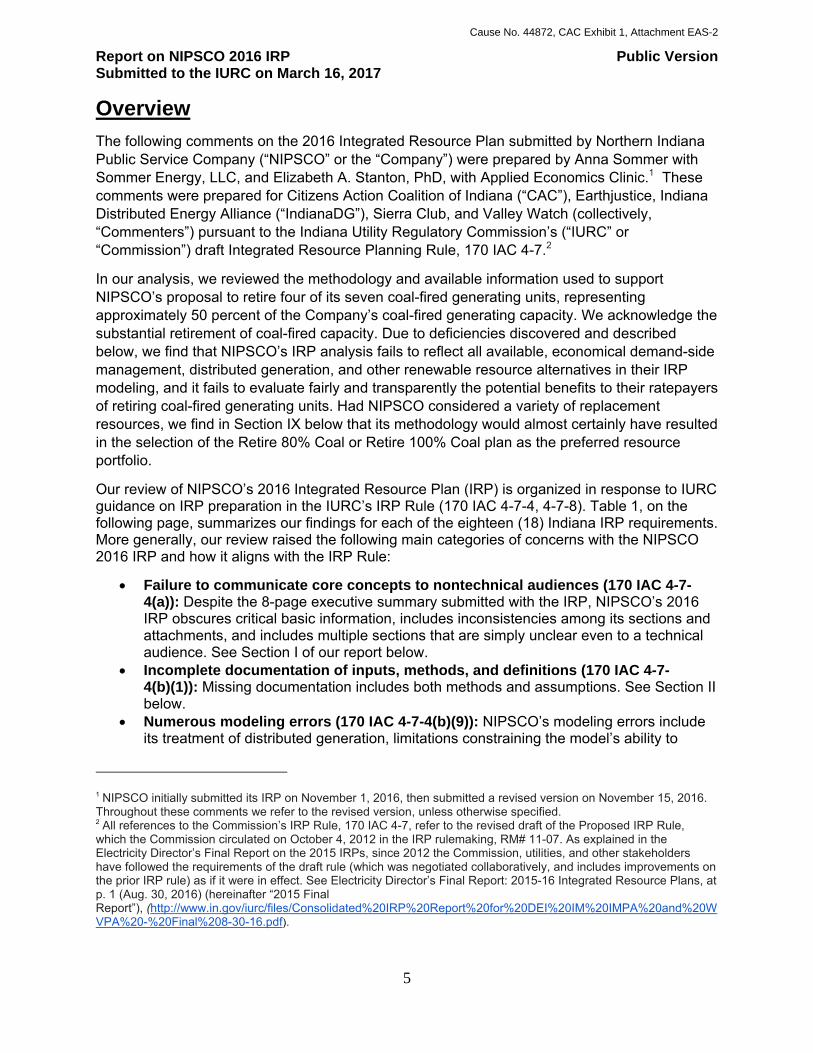
The following comments on the 2016 Integrated Resource Plan submitted by Northern Indiana Public Service Company (“NIPSCO” or the “Company”) were prepared by Anna Sommer with Sommer Energy, LLC, and Elizabeth A. Stanton, PhD, with Applied Economics Clinic.1 These comments were prepared for Citizens Action Coalition of Indiana (“CAC”), Earthjustice, Indiana Distributed Energy Alliance (“IndianaDG”), Sierra Club, and Valley Watch (collectively, “Commenters”) pursuant to the Indiana Utility Regulatory Commission’s (“IURC” or “Commission”) draft Integrated Resource Planning Rule, 170 IAC 4-7.2
In our analysis, we reviewed the methodology and available information used to support NIPSCO’s proposal to retire four of its seven coal-fired generating units, representing approximately 50 percent of the Company’s coal-fired generating capacity. We acknowledge the substantial retirement of coal-fired capacity. Due to deficiencies discovered and described below, we find that NIPSCO’s IRP analysis fails to reflect all available, economical demand-side management, distributed generation, and other renewable resource alternatives in their IRP modeling, and it fails to evaluate fairly and transparently the potential benefits to their ratepayers of retiring coal-fired generating units. Had NIPSCO considered a variety of replacement resources, we find in Section IX below that its methodology would almost certainly have resulted in the selection of the Retire 80% Coal or Retire 100% Coal plan as the preferred resource portfolio.
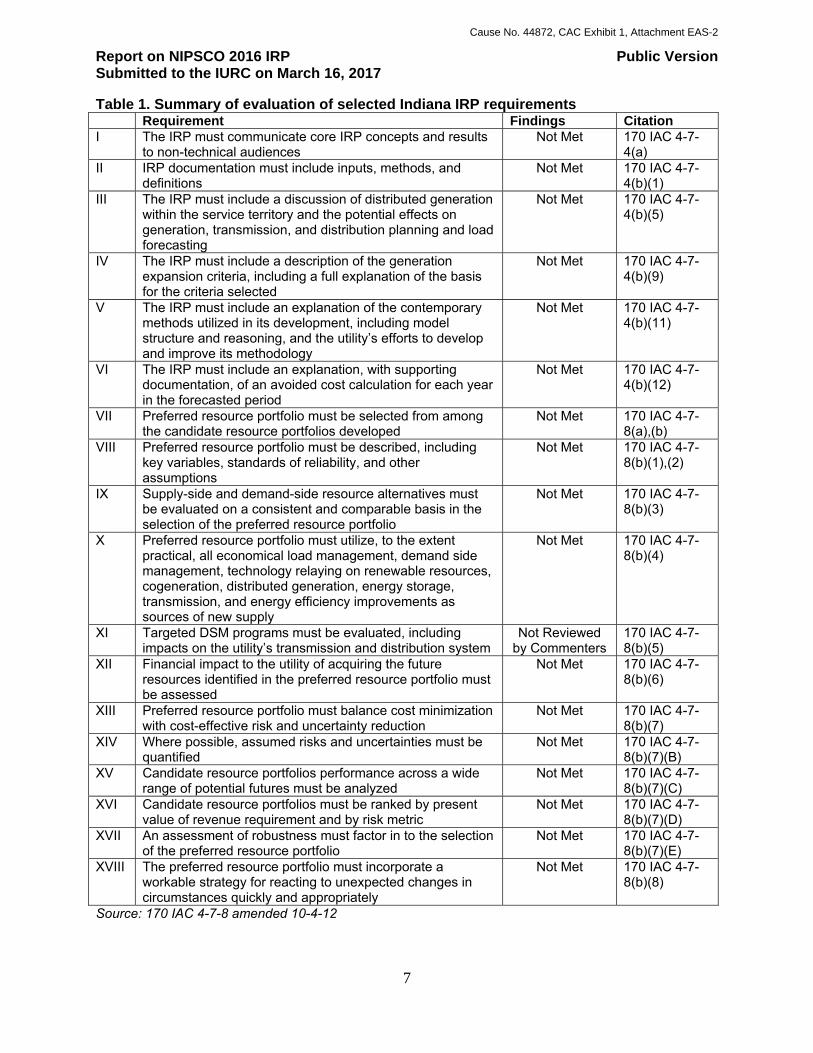
Our review of NIPSCO’s 2016 Integrated Resource Plan (IRP) is organized in response to IURC guidance on IRP preparation in the IURC’s IRP Rule (170 IAC 4-7-4, 4-7-8). Table 1, on the following page, summarizes our findings for each of the eighteen (18) Indiana IRP requirements. More generally, our review raised the following main categories of concerns with the NIPSCO 2016 IRP and how it aligns with the IRP Rule:
Failure to communicate core concepts to nontechnical audiences (170 IAC 4-7-4(a)): Despite the 8-page executive summary submitted with the IRP, NIPSCO’s 2016 IRP obscures critical basic information, includes inconsistencies among its sections and attachments, and includes multiple sections that are simply unclear even to a technical audience. See Section I of our report below.
Incomplete documentation of inputs, methods, and definitions (170 IAC 4-7-4(b)(1)): Missing documentation includes both methods and assumptions. See Section II below.
Numerous modeling errors (170 IAC 4-7-4(b)(9)): NIPSCO’s modeling errors include its treatment of distributed generation, limitations constraining the model’s ability to
1 NIPSCO initially submitted its IRP on November 1, 2016, then submitted a revised version on November 15, 2016. Throughout these comments we refer to the revised version, unless otherwise specified. 2 All references to the Commission’s IRP Rule, 170 IAC 4-7, refer to the revised draft of the Proposed IRP Rule, which the Commission circulated on October 4, 2012 in the IRP rulemaking, RM# 11-07. As explained in the Electricity Director’s Final Report on the 2015 IRPs, since 2012 the Commission, utilities, and other stakeholders have followed the requirements of the draft rule (which was negotiated collaboratively, and includes improvements on the prior IRP rule) as if it were in effect. See Electricity Director’s Final Report: 2015-16 Integrated Resource Plans, at p. 1 (Aug. 30, 2016) (hereinafter “2015 Final Report”), (http://www.in.gov/iurc/files/Consolidated%20IRP%20Report%20for%20DEI%20IM%20IMPA%20and%20WVPA%20-%20Final%208-30-16.pdf).
Cause No. 44872, CAC Exhibit 1, Attachment EAS-2
Report on NIPSCO 2016 IRP Public Version Submitted to the IURC on March 16, 2017
6
identify a least-cost portfolio, and incorrect calculation of peak energy demand and, therefore, of capacity requirements. See Section IV below.
Preferred resource portfolio not selected from candidate portfolios and not fully described in IRP (170 IAC 4-7-8(a),(b)): NIPSCO’s failure to choose a preferred resource portfolio from among its candidate resource portfolios invalidates its selection of a preferred resource portfolio. In addition, NIPSCO fails to document the differences between its preferred portfolio and its least-cost portfolio; these differences appear to consist entirely of radically divergent treatments of market purchases of capacity. See Section VII below.
Biases against coal retirement (170 IAC 4-7-8(b)(3),(b)(4)): NIPSCO’s retirement analysis is deeply flawed with the result that the preferred portfolio is neither least cost nor risk reducing. See Sections IX and X below.
Biases against renewable resources (170 IAC 4-7-8(b)(3),(b)(4)): NIPSCO’s modeling includes several assumptions that bias resource selection against renewable generation. See Sections IX, X below.
Demand-side resources not evaluated on consistent and comparable terms with supply-side resources (170 IAC 4-7-8(b)(3),(b)(4)): NIPSCO’s modeling includes a faulty modeling methodology and numerous assumptions that bias resource selection against energy efficiency. Demand-side resources are not evaluated on a consistent and comparable basis with supply-side resources. See Sections IX and X below.
Flawed risk assessment and price forecasting (170 IAC 4-7-8(b)(7)(B),(C)): NIPSCO’s risk and uncertainty assessment is insufficient in its scope and includes errors in its execution. See Sections XIV and XV below.
Portfolio ranking criteria are opaque to the IRP audience (170 IAC 4-7-8(b)(7)(D)): NIPSCO ranks its candidate portfolios using a black-box, qualitative scorecard that obscures their choice of a preferred portfolio. See Section XVI below.
NIPSCO did not make its background materials and modeling files available together with its 2016 IRP submission, and despite several rounds of discovery requests made over the course of 4.5 months for these documents, we still do not have a complete set at the time of our writing of this report. For these reasons, we respectfully reserve the right to continue reviewing materials as we receive them and to add new information to our response to the Director’s Draft Report.
Cause No. 44872, CAC Exhibit 1, Attachment EAS-2
Report on NIPSCO 2016 IRP Public Version Submitted to the IURC on March 16, 2017
7
Table 1. Summary of evaluation of selected Indiana IRP requirements Requirement Findings Citation
I The IRP must communicate core IRP concepts and results to non-technical audiences
Not Met 170 IAC 4-7-4(a)
II IRP documentation must include inputs, methods, and definitions
Not Met 170 IAC 4-7-4(b)(1)
III The IRP must include a discussion of distributed generation within the service territory and the potential effects on generation, transmission, and distribution planning and load forecasting
Not Met 170 IAC 4-7-4(b)(5)
IV The IRP must include a description of the generation expansion criteria, including a full explanation of the basis for the criteria selected
Not Met 170 IAC 4-7-4(b)(9)
V The IRP must include an explanation of the contemporary methods utilized in its development, including model structure and reasoning, and the utility’s efforts to develop and improve its methodology
Not Met 170 IAC 4-7-4(b)(11)
VI The IRP must include an explanation, with supporting documentation, of an avoided cost calculation for each year in the forecasted period
Not Met 170 IAC 4-7-4(b)(12)
VII Preferred resource portfolio must be selected from among the candidate resource portfolios developed
Not Met 170 IAC 4-7-8(a),(b)
VIII Preferred resource portfolio must be described, including key variables, standards of reliability, and other assumptions
Not Met 170 IAC 4-7-8(b)(1),(2)
IX Supply-side and demand-side resource alternatives must be evaluated on a consistent and comparable basis in the selection of the preferred resource portfolio
Not Met 170 IAC 4-7-8(b)(3)
X Preferred resource portfolio must utilize, to the extent practical, all economical load management, demand side management, technology relaying on renewable resources, cogeneration, distributed generation, energy storage, transmission, and energy efficiency improvements as sources of new supply
Not Met 170 IAC 4-7-8(b)(4)
XI Targeted DSM programs must be evaluated, including impacts on the utility’s transmission and distribution system
Not Reviewed by Commenters
170 IAC 4-7-8(b)(5)
XII Financial impact to the utility of acquiring the future resources identified in the preferred resource portfolio must be assessed
Not Met 170 IAC 4-7-8(b)(6)
XIII Preferred resource portfolio must balance cost minimization with cost-effective risk and uncertainty reduction
Not Met 170 IAC 4-7-8(b)(7)
XIV Where possible, assumed risks and uncertainties must be quantified
Not Met 170 IAC 4-7-8(b)(7)(B)
XV Candidate resource portfolios performance across a wide range of potential futures must be analyzed
Not Met 170 IAC 4-7-8(b)(7)(C)
XVI Candidate resource portfolios must be ranked by present value of revenue requirement and by risk metric
Not Met 170 IAC 4-7-8(b)(7)(D)
XVII An assessment of robustness must factor in to the selection of the preferred resource portfolio
Not Met 170 IAC 4-7-8(b)(7)(E)
XVIII The preferred resource portfolio must incorporate a workable strategy for reacting to unexpected changes in circumstances quickly and appropriately
Not Met 170 IAC 4-7-8(b)(8)
Source: 170 IAC 4-7-8 amended 10-4-12
Cause No. 44872, CAC Exhibit 1, Attachment EAS-2
Report on NIPSCO 2016 IRP Public Version Submitted to the IURC on March 16, 2017
8
Analysis
I. Does the IRP communicate core IRP concepts and results to nontechnical audiences?
No, NIPSCO’s 2016 IRP fails to communicate core IRP concepts and results to nontechnical audiences. While the IRP contains a nontechnical 8-page executive summary analysis, that summary misleads the public regarding obstacles to the viability of renewable energy and does not explain the process for selecting replacement generation for retiring coal plants. In addition, NIPSCO was not readily forthcoming with complete IRP information for review, presented an IRP that had a number of errors and inconsistencies, and buried critical basic information deep within the IRP rather than presenting it up front in the executive summary.
I-A. Misleading and incomplete public executive summary
NIPSCO’s 2016 IRP Executive Summary does not explain NIPSCO’s future plans in a clear way and claims, without evidence, that “wind and solar lack the same level of reliability offered by natural gas or coal-fired generation”, thereby implying, also without evidence, that these resources are not appropriate for NIPSCO’s near term needs. NIPSCO’s Executive Summary does not provide information on the relative costs of technologies considered, which would demonstrate that technologies such as coal and nuclear power are significantly more expensive than cleaner forms of energy.3 It also does not present information from the IRP showing that all of NIPSCO’s remaining coal plants are uneconomical, and that NIPSCO’s lowest cost option, based on its own analysis, is to retire all of its coal capacity. In fact, none of the alternative portfolios NIPSCO considered are explained in the Executive Summary, although we understand that they were a focal point of the stakeholder meetings.
I-B. Presentation of basic information buried
A clear communication of core IRP concepts and results to nontechnical audiences would be greatly facilitated by a summary of key IRP findings in the executive summary and/or at the beginning of the IRP. Ultimately, the main finding of an IRP is the utility’s preferred resource portfolio. NIPSCO’s IRP Executive Summary never uses the term “preferred resource portfolio” but gives a very brief text description of what it refers to as the IRP’s “findings”. Beyond a terse mention of the preferred resource portfolio’s existence on page 1 of the IRP, no further discussion of the preferred resource portfolio is provided until Section 8.5.4 (p.154).4 NIPSCO’s 2016 IRP also includes a “short-term” action plan (p.2-3), but this largely consists of vague commitments such as that, “Offer service options for customers, including demand-side
3 See NIPSCO 2016 IRP, Executive Summary, p.5. 4 Throughout this report, IRP pagination refers to the main NIPSCO 2016 IRP narrative unless the Executive Summary, or an attachment or appendix to the IRP is specifically referenced.
Cause No. 44872, CAC Exhibit 1, Attachment EAS-2
Report on NIPSCO 2016 IRP Public Version Submitted to the IURC on March 16, 2017
9
management.”(p.3) A nontechnical audience would benefit from a clear but detailed presentation of the characteristics of an IRP’s preferred resource plan within the summary of basic information at the front of the actual IRP narrative.
I-C. Difficulties accessing complete IRP information for review
NIPSCO has a responsibility to be transparent and forthcoming with interested stakeholders—both nontechnical and technical—seeking to understand and evaluate the Company’s IRP analysis. In response to CAC’s first informal set of discovery, NIPSCO stated that it would take 30 calendar days to respond. NIPSCO did not respond to CAC’s November 10, 2016 requests seeking IRP modeling files until December 9, 2016. After reviewing the modeling files received, we contacted NIPSCO on January 5, 2017, to report that the full set of Strategist files had not been provided. While NIPSCO’s Lead Resource Planning Analyst, Andrew Kramer, very helpfully offered to send additional files and put key information in spreadsheets, it took several weeks of back and forth to make clear what data were needed in the spreadsheets with the result that these data were only provided to us on February 9 and 15, 2017. This pushed us past the original due date for the comments.
With the goal of resolving our questions regarding critical assumptions in NIPSCO’s Strategist modeling, we requested a call with the utility’s IRP team on Feb. 17, 2017. This call took place on Feb. 27, 2017. During that call, Ed Achaab, NiSource’s Manager of Resource Planning, told us that he could not give an explanation for why NIPSCO made some of the resource planning related decisions that it did without getting input from other NIPSCO staff including Dan Douglas, VP of Corporate Strategy. In this call, it also became clear that we still did not have the full set of Strategist files used by NIPSCO to create its 2016 IRP because we were missing many files showing how the DSM bundles were optimized.5 In light of these issues in discovery we had no alternative but to write comments based on the incomplete information that NIPSCO provided to us by March 16, 2017. We respectfully reserve the right to continue reviewing materials as we receive them and to add new information to our response to the Director’s Draft Report.
I-D. Errors and inconsistencies in NIPSCO’s 2016 IRP
The errors and inconsistencies in NIPSCO’s 2016 IRP presented throughout this report result in a flawed “preferred” resource portfolio and an IRP that is not transparent and not easily understood. Key among these errors and inconsistencies are the following:
Failure to communicate core concepts to nontechnical audiences (Section I in our report below)
Incomplete documentation of inputs, methods, and definitions (Section II)
5 As discussed in Section IX-B-2, NIPSCO has told us on February 27, 2017 that there are thousands of runs showing how the DSM bundles were optimized. This number is too large for us to review in any meaningful way. We will need a call with NIPSCO to discuss their methodology and then follow up with the modeling inputs and outputs from the runs that would be most meaningful to analyze. It not possible to hold this call and incorporate this information into our comments in the time remaining before March 16.
Cause No. 44872, CAC Exhibit 1, Attachment EAS-2
Report on NIPSCO 2016 IRP Public Version Submitted to the IURC on March 16, 2017
10
Numerous modeling errors (Section IV) Preferred resource portfolio not selected from candidate portfolios and not fully
described in IRP (Section VII) Biases against coal retirement (Sections IX and X) Biases against renewable resources (Sections IX and X) Demand-side resources not evaluated on consistent and comparable terms with supply-
side resources (Sections IX, X) Flawed risk assessment and price forecasting (Section XIV and XV) Portfolio ranking criteria are opaque to the IRP audience (Section XVI)
I-E. Recommendations for communicating core IRP concepts and results with
nontechnical audiences
To best communicate core IRP concepts and results to nontechnical audiences, we recommend:
An executive summary presenting the candidate and preferred portfolios in clear,
simple terms: NIPSCO’s Executive Summary should include a description and/or charts showing the future generation portfolios considered, and NIPSCO’s preferred portfolio in multiple years up to and including the end of the study period.
A summary table describing the preferred resource portfolio in detail: Nontechnical readers would greatly benefit from a simple, clear table or chart located at the front of the IRP report and laying out the basic details of the utility’s preferred resource portfolio. Key details for inclusion in such a table include, but are not limited to, load, current resource capability, and the year-by-year planned capacity acquisition of the preferred resource portfolio.
A complete submission of all IRP modeling inputs and outputs in machine readable form at the time of IRP submission: NIPSCO’s 2016 IRP did include certain, selected Strategist model inputs and outputs for a subset of its Strategist runs in PDF format in its Confidential Appendix H. We applaud NIPSCO for taking this step. It would be even more helpful if those files, in addition to other modeling files requested by CAC and Earthjustice through informal discovery, were provided concurrently with the IRP and in the .REP and spreadsheet file formats that were ultimately delivered to us. The more prompt the submission of these files, the more prompt our comments can be. For this reason, we strongly encourage the Director to request that all modeling inputs and outputs be provided at the time of IRP submittal in spreadsheet format where possible and in text format otherwise.
Earlier submission of key information even prior to the IRP’s release: Early release of detailed descriptions and modeling files during the stakeholder process would make possible public review and comment that could aid the utility in identifying errors before the IRP is submitted to the Commission.
Cause No. 44872, CAC Exhibit 1, Attachment EAS-2
Report on NIPSCO 2016 IRP Public Version Submitted to the IURC on March 16, 2017
11
II. Does IRP documentation include inputs, methods, and definitions?
No. NIPSCO’s 2016 IRP documentation does not clearly present inputs, methods, and definitions.
II-A. Complete documentation of inputs and outputs
The term “inputs” should not mistakenly be interpreted to be limited to cost and electric consumption projections such as coal and natural gas price forecasts, the load forecast, combined cycle, solar, and wind costs. The full set of inputs to an IRP is significantly more complex than this and includes a very large number and variety of input assumptions made by the modeler, for example:
The first year a resource can be added to a portfolio The last year a resource can be added to a portfolio Limitations on the size of the resource that can be added The minimum and maximum number of units of a particular resource that can be added The reserve margin requirement The order in which resources must be dispatched Forced outage rates Heat rate profile Fuel delivery charges by unit Emissions rates Schedule of maintenance outages
Because there are so many inputs to an IRP, the only plausible way to completely document them is to provide the modeling input files in a format that is easily machine readable (for example, in an Excel spreadsheet) without requiring public interest groups and other intervenors to pay tens of thousands of dollars to license the model. Even accounting for Confidential Appendix H, NIPSCO did not provide the full set of these input files with its initial 2016 IRP submittal. The remaining input files, except for those corresponding to the DSM optimization runs, were provided in response to informal discovery on December 9, 2016. To be clear, the missing output files were not provided in their entirety on December 9, 2016. We are, however, very appreciative of NIPSCO’s offer to put significant Strategist data into an Excel spreadsheet in addition to providing text-based modeling files. Because standard Strategist inputs and outputs are in a formatted file, it is difficult to export those data into a spreadsheet without licensing the model ourselves. We hope NIPSCO will continue this practice, and we encourage the other Indiana utilities that use Strategist to follow NIPSCO’s lead.
For future resource plans, it would be extremely helpful to a meaningful and cooperative public process to set the expectation that all modeling files must be delivered concurrently with the final IRP report. We would be happy to work with each individual utility to help its staff understand how to best comply with this request given its particular modeling protocols.
It is also worth noting that while this section of the Indiana IRP requirements is specific to “inputs, methods, and definitions”, input files must be accompanied by output files for useful third-party review.
Cause No. 44872, CAC Exhibit 1, Attachment EAS-2
Report on NIPSCO 2016 IRP Public Version Submitted to the IURC on March 16, 2017
12
II-B. Lack of transparency regarding modeling assumptions
Complete documentation of an IRP requires that all inputs, outputs, methods, assumptions, and definitions be made available to stakeholders clearly, transparently, and, for data files, in machine readable form. NIPSCO did not make all of its IRP materials available to stakeholders.
In particular, despite repeated requests from CAC and Earthjustice, NIPSCO did not make data developed for it by PIRA available to stakeholders, including its emissions, power, and commodity price forecasts—despite the fact that CAC and Earthjustice have executed a Non-Disclosure Agreement with NISPCO regarding exchange of confidential information utilized by the Company in its IRP analysis. In response to these requests, NIPSCO explained, “The information is not available as it is proprietary to PIRA and has not been shared with NIPSCO”6 and “[t]he capacity analysis used in the optimization analysis cannot be provided due to the inclusion of information proprietary to PIRA.”7 Some of these data are directly viewable in the Strategist files (capacity price forecast and CO2 price forecast) that were made available to stakeholders and in graphs made public in the stakeholder process. In a phone call on February 27, 2017, NIPSCO staff indicated that they do possess a narrative explaining and documenting PIRA’s forecasts but they could not share it with CAC and Earthjustice. NIPSCO actions in withholding this information are antithetical to transparency and meaningful stakeholder participation.
In that same call, NIPSCO staff stated that they did not know what the price setting unit was in their Base Case MISO power price forecast. This lack of transparency is of particular concern because our informal attempts to estimate the marginal cost of coal and gas units—one of which seems likely to set the clearing price—fell short of PIRA’s estimate by $20 to $25 per MWh in the Base Case.8 Further, NIPSCO stated that the PIRA analysis was performed under NIPSCO’s direction, which magnifies our concern about why these data cannot be shared as well as raising questions about the independence of PIRA’s analysis. The development of key inputs like the MISO power price forecasts is completely opaque to us and to other stakeholders not the least because there is absolutely no narrative from PIRA about how these forecasts were developed. In our experience this would not be acceptable in a docketed case for a utility to acknowledge that it possesses data for which confidentiality has been resolved through a non-disclosure agreement but refuse to provide these data. We believe that it should not be acceptable in an undocketed IRP proceeding either.
As described further in Section X below, key assumptions and methodologies were never discussed in NIPSCO’s IRP including the fact that no “iron in the ground” capacity resources were available for selection by Strategist until 2023.
6 NIPSCO Response to CAC Data Request 1-13, included as Exhibit 1. 7 NIPSCO Response to CAC Data Request 2-001, included as Exhibit 2. 8 Our calculation and resulting comparison was based, in part, on page 122 of the NIPSCO 2016 IRP.
Cause No. 44872, CAC Exhibit 1, Attachment EAS-2
Report on NIPSCO 2016 IRP Public Version Submitted to the IURC on March 16, 2017
13
II-C. Recommendations for complete documentation of inputs, methods, and
definitions
To assure complete documentation of an IRP, we endorse the recommendations9 made by CAC, Indiana Distributed Generation Alliance, the Indiana State Conference of the National Association for the Advancement of Colored People (NAACP), Sierra Club, and Valley Watch in IURC Rulemaking #15-06 to include a “technical appendix” as part of the IRP submission. The following is a partial list of key items for inclusion in an IRP technical appendix:
The input and output files from all models in a readable electronic format o System Optimizer, Planning and Risk, Capacity Expansion: Input and output files
should be presented in spreadsheet format. o Strategist: Input and output files should be in text format at a minimum. Strategist
has the capability to export data into a spreadsheet, which is extremely helpful for review purposes, and we encourage other Strategist users to do as NIPSCO has done and provide us with that information.
o With any of these models, if stakeholders or Commission staff wish to create their own modeling runs, the executable files also should be made available, but this type of exercise would require licensing fees for model and is therefore usually beyond the resources available to an intervenor/stakeholder group.
o Other models: For most other models, spreadsheet-based input and output files will be of most use. We would be happy to consult with any Indiana utility on the appropriate format to use for a given model.
A user guide for each model used: Indiana utilities use many different models including Strategist, System Optimizer, Planning and Risk, MIDAS, Capacity Expansion model, and Plexos, so having a user guide on hand is essential to a public process so that stakeholders and Commission staff can have an understanding as to how a model works and how to interpret its input and output files.
Any files used to “post-process” IRP results in readable electronic format with formulae intact: For example, NIPSCO and at least one other Indiana utility, Duke, take the results of their modeling and modify the present value of revenue requirements (PVRR) in a spreadsheet.
9 Public Comments received by the IURC in IURC RM #15-06 are available here: http://www.in.gov/iurc/2844.htm.
Cause No. 44872, CAC Exhibit 1, Attachment EAS-2
Report on NIPSCO 2016 IRP Public Version Submitted to the IURC on March 16, 2017
14
III. Does the IRP include a discussion of distributed generation within the service territory and the potential effects on generation, transmission, and distribution planning and load forecasting?
No, NIPSCO’s 2016 IRP discussion of distributed generation is fundamentally flawed with the result that investments in these resources erroneously are not included in the preferred resource portfolio.
III-A. Unsubstantiated claims of obstacles to renewable adoption
NIPSCO explains that its surprising choice not to include distributed generation as a resource in IRP modeling is made because these resources are not sufficiently available or stable:
Based upon several years of operating data for currently installed renewable generation resources, these technologies present a recognized energy resource that can be utilized in supplementing customer electric energy needs. However, at this time, the impact on local electric distribution service infrastructure has not demonstrated to be sufficiently available or stable to be considered an adequate 24/7 substitute for NIPSCO’s local electric sources in reliably meeting electric capacity and service needs. Considering that these distributed generation resources have no guarantee of power dispatch, operate in a “take it as we make it” mode, and can permanently cease operations at any time, results in a lower confidence level regarding the availability of power supply at all times, especially during periods of system stress or problems. Consequently, continued traditional capital investment into local distribution infrastructure is necessary to insure that the utility can meet all of its service obligations to its customers. (NIPSCO 2016 IRP p.105)
This wholesale rejection of distributed generation is surprising for several reasons. First, just as larger plants do, distributed generators need a sustained revenue source to justify their construction and operation, which creates a disincentive to “permanently cease operations at any time”. Second, “take it as we make it” is no different than the need to operate nuclear power plants and other, large generators at minimum loading levels, which are daily dispatched within the MISO system. If, instead, what NIPSCO is getting at is the question of whether distributed generation is dispatchable or not, then it clearly depends on what type of distributed generation is at issue, But again, this is not an insurmountable barrier. There are thousands of megawatts of so-called “non-dispatchable” resources already operating in MISO and no evidence that more cannot be added. In fact, multiple utilities within MISO have plans to add more wind and solar including distributed resources of these types. There is no justification for the wholesale exclusion of distributed generation from IRP modeling, particularly when NIPSCO is trying to “bookend” its analysis by considering such unlikely possibilities as the construction of new nuclear power plants.
III-B. Recommendations for discussion of distributed generation and its potential
effects
Simply put, NIPSCO should have allowed distributed generation, particularly distributed solar in to be selected in its capacity expansion analysis (and done so well before 2023).
Cause No. 44872, CAC Exhibit 1, Attachment EAS-2
Report on NIPSCO 2016 IRP Public Version Submitted to the IURC on March 16, 2017
15
IV. Does the IRP include a description of the generation expansion criteria, including a full explanation of the basis for the criteria selected?
No, the description of generation expansion criteria in NIPSCO’s 2016 IRP is incomplete and/or incorrect. Deficiencies include limitations on expansion options that completely undermine the claim that NIPSCO’s preferred resource portfolio was truly “optimized” and critical errors in the estimation of peak energy demand.
IV-A. Limitations on expansion options
Options for generation expansion are limited in NIPSCO’s 2016 IRP modeling to such a degree as to greatly circumscribe Strategist’s cost minimization modeling function. In capacity expansion modeling, for any meaningful optimization or cost minimization to take place, the model must have the option to choose among available generation resources. When these choices are excessively limited, the resulting resource portfolio cannot be claimed—in any literal sense—to be the least-cost alternative. Two important examples of this problem from NIPSCO’s IRP modeling are as follows:
Strategist includes the option of permitting the model to select “deferral capacity units” instead of generation resources. These deferral capacity units represent market capacity purchases from MISO. For the years for which deferral capacity units are made available by the modeler, market purchases will be selected first, before any other resources, up to a maximum that is, again, set by the modeler. In NIPSCO’s 2016 IRP modeling, deferral capacity units (that is, market purchases) are available from 2015 through 2022 up to a maximum value of MW—well above the capacity needs in any year. The functional impact of these modeling choices in NIPSCO’s IRP is that no generation resources are added in any portfolio or scenario we reviewed before 2023. To be clear: The absence of capacity additions before 2023 is not for economic reasons (that is, Strategist is not choosing market purchases because they are less expensive). Rather, Strategist is constrained to choose market purchases to meet any capacity deficits regardless of the relative economics of other generation resources. If this constraint were not in place it can reasonably be inferred that in at least some portfolio/scenario combinations generation resources—including renewables and efficiency measures—would be selected prior to 2023.
Similarly, Strategist’s ability to select renewable generation as an expansion resource appears to be limited in those runs in which it could also select significant quantities of fossil fuel-based units. So even though solar PV and wind become available in 2023 like other supply-side units, they are not available in sufficient quantity to offset the addition of very large natural gas combined cycle plants.10 Again, this circumstance is a result of
10 An illustrative example of this constraint is as follow: If 10 MW of capacity is needed in 2023, but the only available resources are 1 MW of wind and a 10 MW combined cycle unit, Strategist will select the combined cycle unit only regardless of these resources’ relative costs. To meet capacity needs, wind could only be selected together with the combined cycle, which would always cost more than selecting the combined cycle alone.
Cause No. 44872, CAC Exhibit 1, Attachment EAS-2
Report on NIPSCO 2016 IRP Public Version Submitted to the IURC on March 16, 2017
16
limitations set by the modeler and does not lead to an unconstrained, least-cost resource portfolio.
Note that retirement options appear to be similarly curtailed (see Sections IX and X of our report below).
IV-B. Errors in estimation of peak energy
NIPSCO’s estimation of its peak energy demand is modeled incorrectly. NIPSCO fails to follow the accepted practice of accounting for coincidence of its load at the time of the MISO peak, which is in line with how their resource adequacy obligation is calculated by MISO. The correct calculation of NIPSCO’s peak energy, taking into account its coincidence, would result in a lower peak and, therefore, lower capacity requirements. During NIPSCO’s October 3, 2016 stakeholder meetings, NIPSCO staff explained that the coincidence factor was too speculative for use in modeling. Two facts point against the accuracy of this statement:
1) Far from being uncertain, Confidential Attachment CAC 1-411 reports a NIPSCO to MISO coincidence factor that appears to be quite consistently in the percent range from 2013 to 2017 (projected).
2) In its OMS-MISO survey submittal, NIPSCO uses a NIPSCO to MISO coincidence factor in its own calculations.
The erroneous practice of leaving MISO coincidence out of the estimation of peak load (or—equivalently—assuming a coincidence factor of 1.0) directly results in an overestimation of peak energy and an overestimation of reserve requirements and the capacity expansion necessary to meet these requirements.
IV-C. Recommendations for describing generation expansion criteria
For a complete and accurate description of generation expansion criteria in an IRP, we recommend that detailed data be provided at the time of IRP submission that is sufficient for a public process and third-party review. This information should include: the type, quantity, and size of capacity available to the model in each year, as well as any limitations on resource choices.
In addition, utilities should carefully review all narrative descriptions of scenario assumptions and modeling methodologies to ensure that this text is accurate, clear enough to be easily interpreted by a nontechnical audience, and internally consistent across all sections of the IRP and related materials.
11 Included as Confidential Attachment 3-C.
Cause No. 44872, CAC Exhibit 1, Attachment EAS-2
Report on NIPSCO 2016 IRP Public Version Submitted to the IURC on March 16, 2017
17
V. Does the IRP include an explanation of the methods utilized in its development?
No. The explanation of the methods utilized in the development of NIPSCO’s 2016 IRP is incomplete in its explanations of both the model structure and reasoning used, and in NIPSCO’s efforts to develop and improve its methodology.
V-A. Does the IRP include an explanation of the model structure and reasoning?
No. The explanation of the methods used in the development of NIPSCO’s 2016 IRP is incomplete and does not fully describe or explain the model structure and reasoning used. These issues are discussed more fully in Sections VII and VIII of this report.
V-B. Does the IRP explain the utility’s efforts to develop and improve its
methodology?
NIPSCO’s 2016 IRP includes a list of the actions the utility has taken to follow up on its 2014 IRP Short Term Action Plan (p.162).
V-C. Recommendations for explaining methods used in IRP development
Ultimately, the most important questions with regards to explaining and improving methods used in IRP development are whether and to what extent NIPSCO intends to address the issues regarding methodology, data quality, and clarity of presentation identified in this report.
Cause No. 44872, CAC Exhibit 1, Attachment EAS-2
Report on NIPSCO 2016 IRP Public Version Submitted to the IURC on March 16, 2017
18
VI. Does the IRP include an explanation, with supporting documentation, of an avoided cost calculation for each year in the forecasted period?
No. NIPSCO’s explanation and documentation of its IRP avoided cost calculations are incomplete and its application is inconsistent within the IRP. As we describe in Section IX, DSM programs were screened more times and differently than supply-side measures. The DSM screening step utilizing the model DSMore appears to be the one place that NIPSCO’s avoided cost was used. For DSM evaluation in an IRP, we make a recommendation in Section IX that focuses on the value of load reduction, which is an avoided cost proxy. To the extent that NIPSCO uses this avoided cost either for DSM screening or otherwise, however, we have concerns.
VI-A. Avoided costs are inconsistent with similar cost elements in the IRP
NIPSCO did not use the same PIRA forecasts in its avoided cost calculations as it utilized in its Strategist modeling runs, “For avoided energy and capacity, the DSMore model used hourly market prices based on MISO historic values in relation to weather.”(NIPSCO 2016 IRP, p.82). Not only are these data likely different and distinct from the PIRA forecasts, it is not clear why hourly data should have any relation to capacity prices since MISO’s capacity auction clears once per year.
In addition, it was not possible for us to review even the specific, annual components of the avoided cost because the only information made available was a single point estimate combined with an annual escalation schedule for each cost element. Unexpectedly, some of NIPSCO’s escalation factors start at above 2 while some start below 1. It is not clear to us what these factors are intended to represent—certainly not inflation because it would be highly unusual to make multiple inflation assumptions within the same analysis.
VI-B. Recommendations for calculating and explaining avoided costs
For our recommendation about a proxy avoided cost calculation for DSM see Section IX.
Cause No. 44872, CAC Exhibit 1, Attachment EAS-2
Report on NIPSCO 2016 IRP Public Version Submitted to the IURC on March 16, 2017
19
VII. Was the preferred resource portfolio selected from among the candidate resource portfolios developed?
No. The preferred resource portfolio was not selected from among the candidate resource portfolios developed. NIPSCO’s failure to select a preferred resource portfolio from among its candidate portfolios invalidates the results of its 2016 IRP and flouts the IRP process that was developed over several months with multiple stakeholders, including NIPSCO itself.
VII-A. Proper selection of a preferred resource portfolio
IURC guidance for IRP development (170 IAC 4-7-8 Amended 10-4-12) requires utilities to develop candidate resource portfolios and then select one of these candidates as their preferred resource portfolio:
8(a) The utility shall develop candidate resource portfolios from the selection of future resources in section 7 and provide a description of its process for developing its candidate resource portfolios.
8(b) From its candidate resource portfolios, a utility shall select a preferred resource portfolio…
Strangely, NIPSCO fails to meet this basic requirement and instead introduces a preferred resource portfolio that is—according to the IRP itself—not among the candidate resource portfolios:
[T]o evaluate NIPSCO’s preferred plan the Company compared the Net Present Value of Revenue requirement of the preferred plan against the stylized portfolio’s Net Present Value of Revenue Requirements in each scenario Sensitivity. This comparison showed clearly that not only was the preferred portfolio aligned with NIPSCO’s reliability compliance, diversity and flexibility criteria, it almost always had lower costs to customers across the scenarios. (NIPSCO 2016 IRP p.159)
NIPSCO compares its preferred resource portfolio to its candidate portfolios, which are distinct from it. Instead of selecting the preferred portfolio from among the candidate portfolios, the preferred portfolio is introduced at the eleventh hour and largely unexplained in the IRP. This method is nonstandard and highly misleading:
NIPSCO’s preferred portfolio was not subjected to the same optimization analysis and the IRP does not give it the detailed description of assumptions presented for the candidate portfolios.
The candidate portfolios—on which the bulk of NIPSCO’s 2016 IRP dwells—do not include a portfolio that the utility “prefers” even though such a scenario can be developed using an optimization model. Something must have changed between the model run that found the candidate portfolios to be “optimal” and the conclusion that the new preferred portfolio to even more optimal. If NIPSCO’s candidate portfolios include different, incorrect, or otherwise outdated assumptions the utility has not made this information available to stakeholders.
NIPSCO claims that its preferred portfolio has a lower cost than its least-cost portfolio (NIPSCO 2016 IRP, p.154). By definition, this can only be the case if the least-cost portfolio includes different, incorrect, or otherwise outdated assumptions.
Cause No. 44872, CAC Exhibit 1, Attachment EAS-2
Report on NIPSCO 2016 IRP Public Version Submitted to the IURC on March 16, 2017
20
One of the purposes of NIPSCO’s candidate portfolio analysis is to identify a least-cost resource portfolio. If the under-described preferred portfolio achieves a lower cost in modeling than the least-cost candidate portfolio, it can only be the case that different modeling assumptions were used. Adjustments to scenario or portfolio assumptions are not described in the IRP. Instead, NIPSCO provides its rationalization as follows:
The IRP process and document are ever evolving and no filed document is ever up-to-date with the world as it stands the day after filing. Rather than trying to model our future world with exact precision, this IRP seeks to utilize a broad set of scenarios and sensitivities which inform and develop NIPSCO’s preferred plan. (NIPSCO 2016 IRP p.163)
IURC’s guidance on IRP development, however, does not call for a preferred portfolio that is “informed and developed” by candidate scenarios. It requires a preferred portfolio that is selected from among the candidate scenarios that are described in detail and subjected to analysis. And there is no reason to think that NIPSCO’s preferred resource portfolio, which has not benefited directly from the analytical development of the IRP, would be any more accurate than the candidate portfolios that were not selected.
VII-B. Recommendations for proper selection of a preferred resource portfolio in
an IRP
In our opinion, this and other fundamental errors in NIPSCO methodology undermine the IRP as a whole. We question whether an IRP can be regarded as properly having been submitted to the Commission if its methodology strays from clear guidance and standard practice to this extent. In our opinion, NIPSCO’s 2016 IRP methodology is irredeemably flawed. To meet Indiana IRP guidance requirements, a preferred portfolio that differs from the original candidate resource portfolios must be described in detail and subjected to the same rigorous analysis as the originals—essentially adding it as an additional candidate portfolio. NIPSCO’s preferred resource portfolio is not chosen from among its candidate resource portfolios and as a consequence is not fully described or fully modeled in NIPSCO’s IRP process. In accordance with the IURC’s guidance, we recommend that all IRPs present a preferred resource portfolio that is selected from among carefully analyzed and described candidate resource portfolios, together with a detailed explanation of why the chosen portfolio is preferred to the other candidates.
Cause No. 44872, CAC Exhibit 1, Attachment EAS-2
Report on NIPSCO 2016 IRP Public Version Submitted to the IURC on March 16, 2017
21
VIII. Is the preferred resource portfolio described?
No, the description of the preferred resource portfolio in NIPSCO’s 2016 IRP is grossly incomplete, and lacks a description of its key variables, an explanation of how it was developed, and a complete presentation of how its assumptions differ from those used to develop the other portfolios. NIPSCO’s preferred resource portfolio is not selected from among its candidate resource portfolios (for which some key variables and assumptions are presented) and not based on the same set of assumptions.
VIII-A. Are the key variables used to develop the preferred resource portfolio
described?
No. NIPSCO’s 2016 IRP describes key variables used in its candidate resource portfolios but its preferred resource portfolio was not selected from among these candidates and—as discussed in Section VII and later in this section—appears to be based on a different set of assumptions and/or a different methodology from these candidates. Unless the modeling assumptions for the preferred portfolio were adjusted, it would be impossible for the preferred portfolio to have a lower cost than the least-cost portfolio. If Strategist is a valid model, it must give the same “answer” each time it is run unless its inputs are changed.
To be clear, NIPSCO’s selection of its preferred portfolio includes, but is not limited to, the results of its Strategist modeling. We wholeheartedly agree with the practice of considering factors other than PVRR results in the determination of a preferred resource portfolio. Our objection to NIPSCO’s late and largely obscured preferred portfolio is that it does not appear to have undergone the same level of evaluation in all categories of NIPSCO’s selection process—including local economic and employee impacts, portfolio diversity, environmental effects, and PVRR. If the preferred portfolio underwent the same level of scrutiny as the original candidate portfolios, this information has not been made available to stakeholders.
VIII-B. Are the assumptions used to develop the preferred resource portfolio
described?
No. NIPSCO fails to describe the assumptions used to develop its preferred resource portfolio. While we do not offer a comprehensive accounting of differences between the candidate portfolio and preferred portfolio assumptions, our analysis of the Strategist files provided by NIPSCO indicates that the difference is likely due to whether market capacity purchases are available or not after 2022. In the preferred portfolio, the existence of the capacity market after 2022 is what allows Strategist to avoid the addition of the second combined cycle unit in 2023, whereas two combined cycle units are added in the so-called Least Cost portfolio. The forced addition of two combined cycle units in the Least Cost portfolio creates a capacity oversupply situation that is probably not economical. The reserve margin reaches percent in 2023 in the Least Cost portfolio; the required minimum reserve margin is 7.6 percent.
Even if the preferred portfolio is a modification of the Least Cost portfolio, it is not clear how either portfolio was developed. NIPSCO also fails to make clear how it dealt with the limitations of resource optimization in Strategist. Strategist cannot optimize all the demand and supply-side options discussed in NIPSCO’s IRP simultaneously. Or at least, it cannot without runtimes that would make the analysis extremely time-consuming to complete. In the case of NIPSCO’s 2016 IRP, we understand that the results of one batch of runs helps determine some elements of the
Cause No. 44872, CAC Exhibit 1, Attachment EAS-2
Report on NIPSCO 2016 IRP Public Version Submitted to the IURC on March 16, 2017
22
resource plan that will be fixed for the next set of optimizations. That does not, however, necessarily mean that the most economic choice is moved forward.12 But fixing some resource choices is obligatory when using Strategist.
The problem is that the NIPSCO 2016 IRP does not make transparent how this iterative or “batch” optimization worked. The “retirement analysis” of NIPSCO’s coal units came first. Followed by the “optimization” of demand-side measures, a step for which we have been provided no Strategist modeling files whatsoever. Following these steps, NIPSCO seems to have performed “Fossil Fuel Optimization”, “Renewable Optimization”, and “Low Emission Optimization” runs.13 But how, if at all, these runs lead to the construction of the preferred portfolio or the Least Cost portfolio is not apparent nor is it discussed in the IRP. The “Renewable Optimization” and “Low Emission Optimization” files likely correspond to the “Renewable Focus” and “Low Emissions” portfolios in the IRP. But no NIPSCO staff member on a February 27, 2017 call with CAC and Earthjustice knew what “Fossil Fuel Optimization” meant.
Even if the steps had been clearly outlined, that would not have solved the problem of over-limiting the resources available for optimization prior to 2023—although it would have greatly improved the availability for stakeholder review of the process behind the development of the Least Cost and preferred portfolios. Regrettably, NIPSCO’s process for developing the Least Cost and preferred portfolios is ill-defined and appears to be irredeemably flawed.
VIII-C. Recommendations for adequate description of the preferred portfolio
For a complete and accurate description of the preferred resource portfolio, we recommend that an IRP’s preferred portfolio be selected from among its candidate portfolios. In this way, the assumptions and methodology presented in the IRP are applicable to the preferred portfolio. This practice is necessary for clarity and transparency in IRPs.
We understand that the limitations of resource optimization in Strategist are real. This practice does not, however, relieve the utility of an obligation to clearly explain the limitations of the model and make a clear accounting available to stakeholders of how they resolved this issue.
12 For example, according to NIPSCO’s modeling, the most economic retirement choice is to retire all coal plants, but that is not the retirement plan that was carried forward to later optimizations. 13 These names were used in some of the Strategist files given to us in response to CAC Data Request 1-001.
Cause No. 44872, CAC Exhibit 1, Attachment EAS-2
Report on NIPSCO 2016 IRP Public Version Submitted to the IURC on March 16, 2017
23
IX. Are supply-side and demand-side resource alternatives evaluated on a consistent and comparable basis?
No, supply-side and demand-side resource alternatives are not evaluated on a consistent and comparable basis in NIPSCO’s 2016 IRP. NISPCO’s IRP modeling assumptions and methodology create a bias against the retirement of coal generation and the adoption of renewable resources. In addition, demand-side resources are not evaluated on a consistent and comparable basis with supply-side resources and information sufficient to a third-party review was not provided to stakeholders.
IX-A. Is each supply-side resource alternative evaluated on a consistent and
comparable basis with other supply-side resources?
No, or at least the limitations on supply-side resources are inappropriate if equally applied to those resources. For reasons that NIPSCO could not articulate to us during our February 27, 2017 call, Strategist was set up by NISPCO’s modelers so that no capacity resources, other than MISO capacity market purchases, could be chosen before 2023. In addition, the following subsections discuss 1) the construction of NIPSCO’s retirement analysis in such a manner that no retirement portfolio other than “Retire 50% Coal” would be selected for IRP modeling, and 2) significant biases against the selection of renewable resources.
IX-A-1. Retirement analysis is constructed in a manner such that “Retire 50% Coal” must be the preferred retirement portfolio
NIPSCO concludes that the least-cost option is to retire all of its coal generation but discards its own findings, in part, as a result of its IRP modeling’s biased assumptions regarding replacement technologies for retired resources. NIPSCO fails to include any replacement resource other than a proxy capacity purchase price for a CCGT (not its MISO capacity purchase price) in its retirement analysis. This choice results in fewer retirements carried forward to later “optimizations” runs in NISPCO’s batched modeling process. Figure 1 reproduces NIPSCO’s Figure 8-16 comparing the PVRR cost to customers across six retirement portfolios and a “wide range of scenarios”(NIPSCO 2016 IRP, p.137); the height of the blue columns is the portfolio PVRR modeled in the Base Case scenario and the vertical “whiskers” represent the range of PVRR results across NIPSCO’s full set of modeled scenarios.
Cause No. 44872, CAC Exhibit 1, Attachment EAS-2
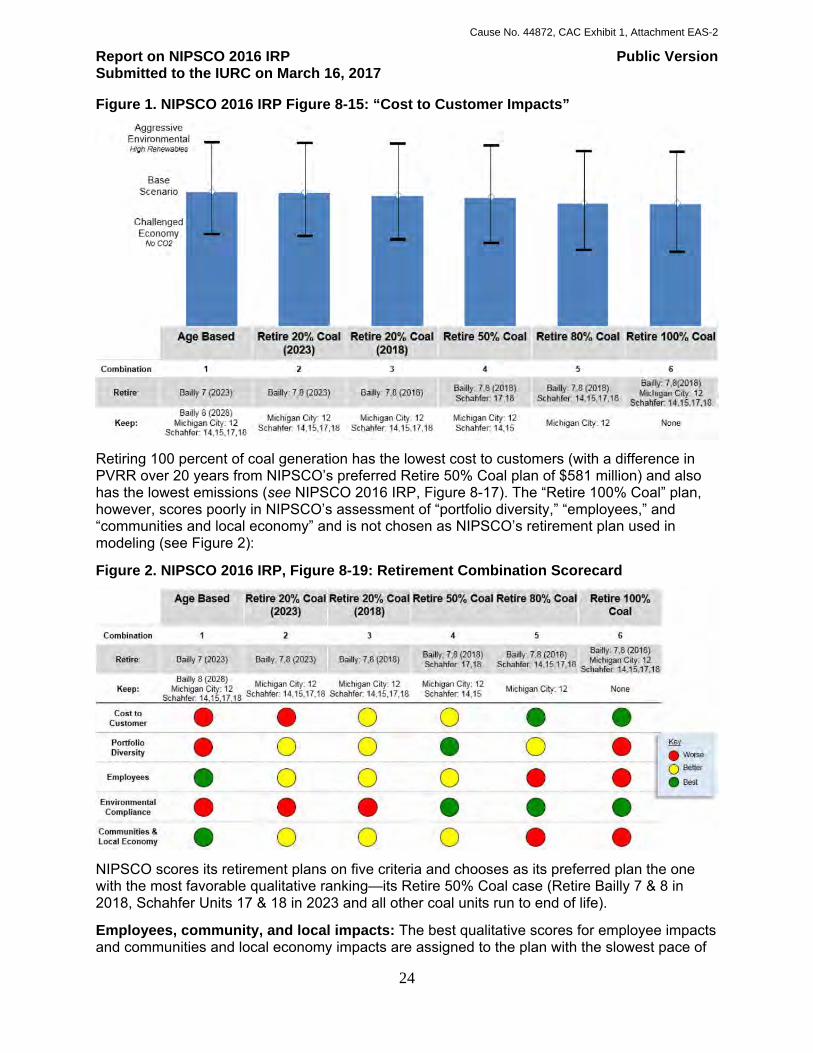
Report on NIPSCO 2016 IRP Public Version Submitted to the IURC on March 16, 2017
24
Figure 1. NIPSCO 2016 IRP Figure 8-15: “Cost to Customer Impacts”
Retiring 100 percent of coal generation has the lowest cost to customers (with a difference in PVRR over 20 years from NIPSCO’s preferred Retire 50% Coal plan of $581 million) and also has the lowest emissions (see NIPSCO 2016 IRP, Figure 8-17). The “Retire 100% Coal” plan, however, scores poorly in NIPSCO’s assessment of “portfolio diversity,” “employees,” and “communities and local economy” and is not chosen as NIPSCO’s retirement plan used in modeling (see Figure 2):
Figure 2. NIPSCO 2016 IRP, Figure 8-19: Retirement Combination Scorecard
NIPSCO scores its retirement plans on five criteria and chooses as its preferred plan the one with the most favorable qualitative ranking—its Retire 50% Coal case (Retire Bailly 7 & 8 in 2018, Schahfer Units 17 & 18 in 2023 and all other coal units run to end of life).
Employees, community, and local impacts: The best qualitative scores for employee impacts and communities and local economy impacts are assigned to the plan with the slowest pace of
Cause No. 44872, CAC Exhibit 1, Attachment EAS-2
Report on NIPSCO 2016 IRP Public Version Submitted to the IURC on March 16, 2017
25
retirement, and the worst scores to the Retire 80% Coal and Retire 100% Coal plans. NIPSCO’s 2016 IRP offer no empirical evidence or clear definition for these scores, stating only that:
NIPSCO believes that performing a retirement analysis requires careful planning and consideration of several factors in addition to the cost of generation. To that end, NIPSCO also considered the effect of unit retirements on its employees, the local economies of the communities it serves and the environment. NIPSCO remains committed to providing service to its customers that is affordable and reliable while also remaining compliant with environmental regulations and assuring that it achieves a greater portfolio diversity to meet future needs. (NIPSCO 2016 IRP p.132)…As previously discussed, NIPSCO also considered secondary impacts of coal unit retirements on surrounding communities. These impacts include the loss of work for NIPSCO employees and its service providers/suppliers as well as reductions to the property tax base for surrounding communities. While these factors do not directly impact power supply costs for customers, NIPSCO believes they are important considerations in selection of its preferred retirement scenario. (NIPSCO 2016 IRP p.135-136)
In response to CAC Data Request 1-02714, NIPSCO elaborated as follows:
NIPSCO performed two impact analyses: impact on employees and impact on the surrounding communities. For the impact on employees, NIPSCO performed an assessment of potential employee disruption for each retirement combination considered in the Integrated Resource Plan. Examples of employee disruptions considered include potential for staff reductions, employee turnover, union, bumping and the miscellaneous costs associated with each of these activities. Based on this, retirement of Bailly (combinations 2 and 3) would affect approximately 115 employees; retirement of Bailly and Schahfer 17 and 18 (combination 4) would affect between 115 and 275 employees; retirement of Bailly and Schahfer Station (combination 5) would affect 430 employees; and retirement of all coal units (combination 6) would affect 538 employees.
The analysis of the impact on surrounding communities includes the potential disruption from NIPSCO unit retirements on the broader local economy through the loss of property taxes as well as the economic multiplier effect from lost NIPSCO jobs. Due to the number of variables (retirements, relocations to other plants while maintaining current residences, etc.), NIPSCO has not performed an analysis on the potential impact of the lost NIPSCO jobs. The contribution of NIPSCO coal units to Porter and Jasper counties though property taxes is shown in CAC Set 1-027 Attachment A.
NIPSCO did not make its employment analysis available for stakeholder review. To perform this type of assessment correctly, NIPSCO would need to consider not only job losses from coal plant closures but also job gains from investments in replacement technologies. While evidence sufficient to review NIPSCO’s job analysis has not been made available us, we can safely infer that, given the structure of the utility’s retirement analysis, any consideration of job gains from replacement resources would have been based on a CCGT proxy capacity purchase—and not on the construction of a CCGT in NIPSCO’s service territory—and would not have appropriately considered the job impacts of investment in renewable resources or other alternative replacement resources (see below).
14 Included as Exhibit 3.
Cause No. 44872, CAC Exhibit 1, Attachment EAS-2
Report on NIPSCO 2016 IRP Public Version Submitted to the IURC on March 16, 2017
26
NIPSCO bases its score for communities and local economy solely on a partial accounting of lost tax revenues. Here, the utility has made its analysis available, and it is evident that only tax revenue losses from retiring units have been considered with no accounting made of the potential for tax gains from replacement generation, whether CCGT or alternative resources. It should be noted that impact on property taxes is an exceedingly narrow proxy for communities and local economy impacts, which should also include—at a minimum—local air and water quality, health impacts, environmental impacts, and business revenues and employee wages spent in the local economy. A full accounting of community impacts would also include, but not be limited to health care savings, reduction in school absenteeism, and other co-benefits of reducing pollution.
Portfolio diversity: The Retire 50% Coal plan’s “green” score in portfolio diversity is a direct result of NIPSCO’s choice to model only one alternative to its retirement analysis. As explained in NIPSCO’s response to CAC Data Request 1-01215:
The retirement analysis used a single proxy, a CCGT, for replacement selected as a proxy because of its favorable levelized cost of energy, reliability, dispatchability, and straightforwardness to plan, permit and build. Using only a CCGT as proxy results in only one portfolio type. To provide a renewable portfolio or a low emissions portfolio various replacement technologies would have to have been considered.
To be clear, NIPSCO did not actually model a CCGT as the alternative to retirement, but rather the purchase of capacity at a price that NIPSCO claims is equivalent to a CCGT. The aforementioned “levelized cost of energy, reliability, dispatchability, and straightforwardness to plan, permit and build” are completely irrelevant because NIPSCO’s alternative is not to construct a CCGT at all, but to purchase exactly enough capacity to meet NIPSCO’s reserve margin at a per MW-cost equal to that of a CCGT.
This in and of itself is nonsensical because the cost of capacity is modeled as higher than NIPSCO’s own estimate of the cost to purchase capacity from the MISO capacity auction. During our February 27, 2017, phone call, NIPSCO could not offer any explanation as to why it modeled the alternative to retirement in this way, rather than comparing retirement to resource choices that it might make in the real world such as actually building a CCGT or purchasing capacity from MISO.
Setting the specific choice of this CCGT proxy aside, NIPSCO uses “portfolio diversity” as a values-based criteria for selecting its preferred portfolio, but then makes clear that it did not actually model a diverse set of replacement technologies for the retiring coal plants. Replacing 50 percent coal with 50 percent natural gas does not result in a diverse portfolio. NIPSCO’s method doesn’t produce meaningful resource diversity and then penalizes the portfolios NIPSCO has created for not being diverse. The result is the Retire 50% Coal plans is selected as the preferred retirement portfolio.
In addition, limiting the retirement alternative to a single option, whatever it might be, effectively means that the Retire 50% Coal is preferred because it is the exact middle ground between retiring all coal plants and retiring none, and, therefore, the exact middle ground between the least amount of the alternative and the most. Of course this is not reflective of how NIPSCO will actually replace these units, there is no exclusively binary choice to make. Rather, there are
15 Included as Exhibit 4.
Cause No. 44872, CAC Exhibit 1, Attachment EAS-2
Report on NIPSCO 2016 IRP Public Version Submitted to the IURC on March 16, 2017
27
many replacement options available to the utility and the idea that this analysis has anything to do with the true diversity in NISPCO’s portfolio post-retirement is simply false.
NIPSCO’s choice to allow only one resource alternative in its retirement analysis leads inexorably to their judgment that the Retire 50% Coal plan is preferred. Had NIPSCO considered a variety of replacement resources, the same retirement assessment methodology would almost certainly have resulted in the selection of the Retire 80% Coal or Retire 100% Coal plan as the preference. When not limited by artificial constraints or unreasonable price assumptions, we think it is likely that Strategist would have selected some renewable and additional efficiency options on economic grounds. These selections would improve the high retirement scenarios portfolio diversity scores while making the Retire 50% Coal plan’s diversity score worse. NIPSCO’s conclusion regarding what combination of red, yellow, and green scores is “best” is subjective, making it very likely—based on our examination of their scoring and ranking system—that this change in portfolio diversity scores would result in a reordering of retirement portfolio ranks giving preference to the Retire 80% Coal or Retire 100% Coal plan.
Even so, the preferred retirement plan—Retire 50% Coal—is fixed throughout all of the optimization modeling and has a determining effect in the costs associated with the least-cost candidate scenario. To the (unexplained) extent that NIPSCO’s preferred portfolio relies on the least-cost candidate scenario it too is strongly impacted by the utility’s flawed retirement analysis.
NIPSCO’s retirement analysis includes several additional flaws that are discussed in Section X.
IX-A-2. Biases against renewables
NIPSCO’s 2016 IRP’s so-called “Renewables Focus” scenarios are actually distinctly biased against renewables. As is the case in NIPSCO’s other “optimizations,” renewables cannot be chosen until 2023, after the tax credits intended to promote those technologies have largely sunset. Renewables provide more energy than capacity benefits, so their optimization in MISO requires the ability to also select economical capacity resources. NIPSCO, however, limited their “Renewable Focus” analysis to add only 240 MW combustion turbine(s) throughout the entire study period, which meant that significant numbers of renewables had to be added, at low capacity value, just to meet the reserve margin requirement.16
In contrast to the significant acquisition of cost-effective renewables elsewhere, NIPSCO attributes undue risks to renewables and claims that these resources cannot play a part in meeting the service territory’s future capacity needs. (See our discussion of distributed generation in Section III above).
Indeed, in NIPSCO’s assessment of scenario variable diversity, it includes renewable adoption as a negative risk together with high commodity prices, high CO2 prices, high energy prices, and high demand (NIPSCO 2016 IRP, p.130).
16 Call with NIPSCO on February 27, 2017 and analysis of CAC Data Request 1-001 and Informal Set 2 responses.
Cause No. 44872, CAC Exhibit 1, Attachment EAS-2
Report on NIPSCO 2016 IRP Public Version Submitted to the IURC on March 16, 2017
28
IX-B. Are supply-side resource alternatives evaluated on a consistent and
comparable basis with demand-side resources?
No. Demand-side resources are decidedly not treated on a consistent and comparable basis with supply-side resources. As described in the subsequent sub-sections, NIPSCO screens demand-side measures three separate times in ways that it does not apply to supply-side measures, fails to document how it ultimately selected its preferred DSM bundles, provides contradictory and confusing accounts of its assumptions regarding program potential, requires a temporal all-or-nothing treatment in DSM bundles selection, and appears to have made modeling errors in the amount of savings modeled. Overall, NIPSCO’s failure to provide stakeholders with even the most basic assumptions and explanations of methodology regarding its DSM modeling has greatly impeded our ability to provide a meaningful third-party review.
IX-B-2. Prescreening of demand-side measures (and not supply-side measures)
Despite clear direction from the IURC (cited below), NIPSCO has applied multiple screening layers to demand-side resources that are not applied to supply-side resources. NIPSCO claims, erroneously, that this is not the case:
As further explained in Section 8.5.1.1: Demand-Side Modeling, while NIPSCO carried out a screening process for the demand-side resources prior to inclusion in the IRP model, NIPSCO performed a similar screen for the supply-side resources prior to inclusion in the model. (NIPSCO 2016 IRP, p.97)
In fact, NIPSCO applies no screening whatsoever to its supply-side measures—apart from their flawed selection in Strategist (as we discuss in Section IV)—as acknowledged by NIPSCO in the notes from its May 5, 2016 stakeholder meeting:
Q: A participant said she’s surprised to see conventional scrubbed coal on the list. She felt that some of these are not viable, and that no other utilities are considering new coal plants, especially with carbon costs in the future. She also stated that new nuclear plants are not being considered due to high costs. Please explain.
A: NIPSCO does not want to pre-judge technologies that may be “good” or “bad”, which is why all commercially available resources are included in the model. NIPSCO recognizes that it would be unlikely that the model would select either conventional coal or nuclear.
Q: A participant stated that NIPSCO noted it was not pre-screening supply-side resources, but that the IRP was going to pre-screen demand-side resources and asked NIPSCO to explain that.
A: NIPSCO noted that it is necessary to group some of the demand-side resources together so that they can all be included in the model. Please see below for comments made by the Commission staff after lunch regarding the selection of resources. (NIPSCO 2016 IRP, Appendix A, p.10-11)
The Commission staff’s comments on this topic from that same meeting were recorded by NIPSCO as follows:
Prior to beginning the afternoon portion of the discussion, Bob Venick and Bob Pauley of IURC discussed NIPSCO’s inclusion of various resources in its planning process and referred to slide 40. They clarified that the Commission is asking utilities to be as inclusive with planning process as they can be, and have asked all utilities to be more expansive in their analysis of risk. This means that utilities should not be pre-selecting
Cause No. 44872, CAC Exhibit 1, Attachment EAS-2
Report on NIPSCO 2016 IRP Public Version Submitted to the IURC on March 16, 2017
29
resources either on the demand- or supply- side. This does not mean that any of these particular resources will be selected, but they provide ‘bookends’ in order to make sure that the utility has a good representation of the risks. (ibid, p.11)
In fact, contrary to the IRP Rule (170 IAC 4-7-8(b)(3)) and the IURC’s clear comments in the stakeholder process, NIPSCO’s 2016 IRP screens energy efficiency for cost-effectiveness twice before it even reaches NIPSCO’s IRP modeling:
1. Economic Potential: “[R]epresents the adoption of all cost-effective DSM measures. In this analysis, the cost-effectiveness is measured by the total resource cost (TRC) test, which compares lifetime energy and capacity benefits to the costs of the (sic) delivering the measure through a utility program, with incentives not included since they are a transfer payment. If the benefits outweigh the costs (that is, if the TRC ratio is greater than 1.0), a given measure is included in the economic potential. Customers are then assumed to purchase the most efficient cost-effective option applicable to them at any decision juncture.” (NIPSCO 2016 IRP, Appendix B, p.5)
2. Program Potential: “MMP used the measure-level savings estimates to develop the program potential. The program potential includes budget and impact estimates for the subset of measures that fit these criteria. The final budgets and impacts were then run through cost-effectiveness modeling using the DSMore tool to finalize the cost-effective program savings potential. NIPSCO utilized this as the inputs into the IRP because anything that was not cost effective at this point would later be screened out as part of the subsequent DSM program filing. Therefore, NIPSCO only wanted to consider programs in the IRP that had cost-effective program savings potential as this would be critical for ultimate selection as a DSM program.” (NIPSCO 2016 IRP, p.72)
In addition to two rounds of cost-effectiveness screening, NIPSCO screens efficiency measures for customer participation and market saturation:
3. Achievable Potential: “[R]efines economic potential by applying customer participation rate that account for market barriers, customer awareness and attitudes, program maturity, and other factors that affect market penetration of DSM measures. (NIPSCO 2016 IRP, Appendix B, p.5)
There are no corollary screens applied to supply-side measures in the NIPSCO 2016 IRP analysis, and NIPSCO clearly articulated the importance of not pre-judging supply-side resources:
NIPSCO does not want to pre-judge technologies that may be “good” or “bad”, which is why all commercially available resources are included in the model. NIPSCO recognizes that it would be unlikely that the model would select either conventional coal or nuclear. (NIPSCO 2016 IRP, Appendix A, p.10)
NIPSCO’s assertions regarding pre-judgment of demand-side resources are diametrically and incontrovertibly opposed to its position on supply-side resources:
The final budgets and impacts were then run through the cost-effectiveness modeling using the DSMore tool to finalize the cost-effective savings program savings potential. NIPSCO utilized this as the inputs into the IRP because anything that was not cost-effective at this point would later be screened out as part of the subsequent DSM program filing. (NIPSCO 2016 IRP, p.72)
According to NIPSCO, supply-side resources in its IRP should not be pre-judged and for this reason “all commercially available resources are included in the model”. In stark contrast, NIPSCO states that demand-side resources in its IRP must be pre-judged by subjecting them to
Cause No. 44872, CAC Exhibit 1, Attachment EAS-2
Report on NIPSCO 2016 IRP Public Version Submitted to the IURC on March 16, 2017
30
additional cost-effectiveness modeling “because anything that was not cost-effective at this point would later be screened out”. By its own assertions NIPSCO’s evaluation of supply-side resources is not by any stretch of the imagination made on a consistent and comparable basis with demand-side resources.
IX-B-2. Failure to document DSM selection
Neither NIPSCO’s 2016 IRP submission nor the associated modeling files made available to stakeholders through discovery provide any documentation as to why or how particular DSM bundles were selected for either the candidate resource portfolios or the preferred portfolio. In a call with CAC and Earthjustice on February 27, 2017, NIPSCO staff explained that sharing this information would require them to make available the inputs and outputs associated with thousands of modeling runs (see also Section IV above).17 NIPSCO’s response to informal discovery in CAC Set 2 also refers to “model limitations on simultaneously selectable alternatives”:
Optimization Analysis – Studied various replacement alternatives based upon the unit retirement dates as determined by the Retirement Analysis. These replacement alternatives included demand side management (“DSM”) programs as well as a large array of supply side options that were optimized across all scenarios and sensitivities. Due to model limitations on simultaneously selectable alternatives as well as a desire to study different possibilities and risk, three portfolios and a final least cost plan were developed…
DSM Optimization Explanation – DSM was optimized prior to the development of the three optimization portfolios and least cost plan. DSM alternatives were optimized against and array of gas and renewable alternatives. The number of programs selected varied across the sensitivities and scenarios. After the DSM programs were optimized for each scenario and sensitivity, they were set for each of the three portfolios and least cost plan in the respective scenario and sensitivity. Additional inquires as related to this optimization process would be best explained directly and with guidance from Edward Achaab and/or Andrew Kramer due to the large amount of files used in the process. In regards to final programs chosen, inquiries should be directed to Alison Becker and the DSM team. (IRP Files Summary and Explanation.pdf)18
This explanation is incomplete and insufficient. Without appropriate descriptions, modeling files, and the criteria NIPSCO applied for DSM selection, it is not possible for stakeholders to review NIPSCO’s modeling choices to ensure that demand-side measures were (1) modeled correctly and accurately, and (2) evaluated on a consistent and comparable basis with supply-side measures within the IRP in addition to any screening steps before reaching the point of performing Strategist modeling.
IX-B-3. Contradictory explanations of assumed program potential
NIPSCO’s explanations of its method of determining energy efficiency potential are at best described with a surprising lack of precision and at worst illogical in a way that suggests a 17 Note that Table 8-18 of NIPSCO’s 2016 IRP, which purports to show “the number of DSM selected across the various scenarios and sensitivities” displays far fewer than thousands of runs. 18 Included as Exhibit 5.
Cause No. 44872, CAC Exhibit 1, Attachment EAS-2
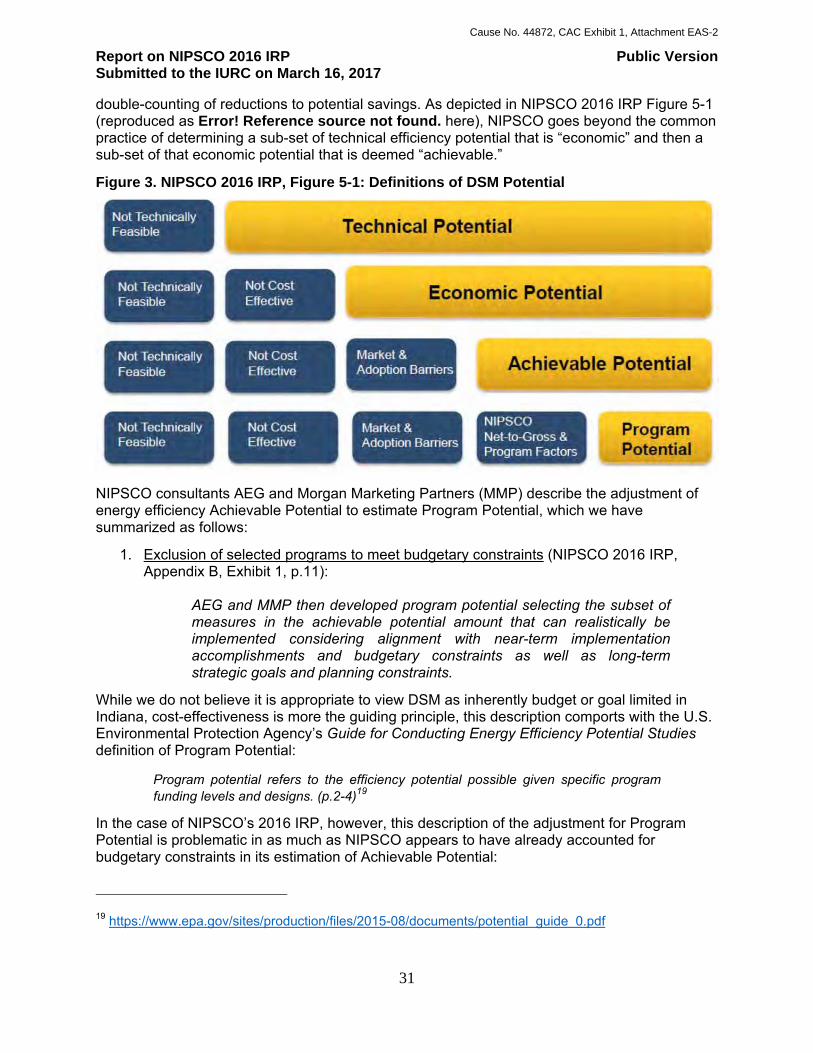
Report on NIPSCO 2016 IRP Public Version Submitted to the IURC on March 16, 2017
31
double-counting of reductions to potential savings. As depicted in NIPSCO 2016 IRP Figure 5-1 (reproduced as Error! Reference source not found. here), NIPSCO goes beyond the common practice of determining a sub-set of technical efficiency potential that is “economic” and then a sub-set of that economic potential that is deemed “achievable.”
Figure 3. NIPSCO 2016 IRP, Figure 5-1: Definitions of DSM Potential
NIPSCO consultants AEG and Morgan Marketing Partners (MMP) describe the adjustment of energy efficiency Achievable Potential to estimate Program Potential, which we have summarized as follows:
1. Exclusion of selected programs to meet budgetary constraints (NIPSCO 2016 IRP, Appendix B, Exhibit 1, p.11):
AEG and MMP then developed program potential selecting the subset of measures in the achievable potential amount that can realistically be implemented considering alignment with near-term implementation accomplishments and budgetary constraints as well as long-term strategic goals and planning constraints.
While we do not believe it is appropriate to view DSM as inherently budget or goal limited in Indiana, cost-effectiveness is more the guiding principle, this description comports with the U.S. Environmental Protection Agency’s Guide for Conducting Energy Efficiency Potential Studies definition of Program Potential:
Program potential refers to the efficiency potential possible given specific program funding levels and designs. (p.2-4)19
In the case of NIPSCO’s 2016 IRP, however, this description of the adjustment for Program Potential is problematic in as much as NIPSCO appears to have already accounted for budgetary constraints in its estimation of Achievable Potential:
19 https://www.epa.gov/sites/production/files/2015-08/documents/potential guide 0.pdf
Cause No. 44872, CAC Exhibit 1, Attachment EAS-2
Report on NIPSCO 2016 IRP Public Version Submitted to the IURC on March 16, 2017
32
Achievable potential refines the economic potential by taking into account expected participation, customer preferences, and budget constraints. (NIPSCO 2016 IRP, Appendix B, p.40)
NIPSCO goes on to provide three additional explanations within its IRP submission of its reasons and methods for adjusting Achievable Potential to estimate Program Potential, none of which appear to be part of the standard definition of Program Potential:
2. Exclusion of programs that are not cost-effective (NIPSCO 2016 IRP, p.72, 77): NIPSCO’s claim that it screens out programs that might later be found not cost effective raises questions both about the purpose of its cost-minimizing IRP modeling and about NIPSCO’s planning regarding low-income measures and programs:
MMP used the measure-level savings estimates to develop the program potential. The program potential includes budget and impact estimates for the subset of measures that fit these criteria. The final budgets and impacts were then run through cost-effectiveness modeling using the DSMore tool to finalize the cost-effective program savings potential. NIPSCO utilized this as the inputs into the IRP because anything that was not cost effective at this point would later be screened out as part of the subsequent DSM program filing. Therefore, NIPSCO only wanted to consider programs in the IRP that had cost-effective program savings potential as this would be critical for ultimate selection as a DSM program. (NIPSCO 2016 IRP, p.72)
MMP used the measure-level savings estimates from AEG to develop the Program Potential savings estimates for NIPSCO. To assure the measures were cost effective given the specifics of NIPSCO’s service territory, MMP utilized the DSMore economic analysis tool to perform the final screening. DSMore utilized NIPSCO-provided (1) utility rates, (2) escalation rates, (3) discount rates for the utility, society and the participant, (4) avoided costs, and (5) previous EM&V levels for NIPSCO’s past programs.
To assess the effectiveness of program design and implementation, an evaluation of all programs was conducted by a third-party EM&V vendor. MMP utilized the evaluation results from NIPSCO’s 2014 program year to develop NIPSCO’s program potential savings estimates. See 2014 Demand-Side Management Programs Evaluation Report – FINAL dated June 2015 prepared by The Cadmus Group, Inc., filed October 28, 2015 in Cause No. 43912 (the “2014 EM&V Report”). In its 2014 EM&V Report, Cadmus quantified each program’s impacts on energy use and assessed each program’s influence on encouraging future energy efficiency projects and market transformation effects in the energy marketplace. (NIPSCO 2016 IRP, p.77)
3. Exclusion of programs not within NIPSCO’s service territory (NIPSCO 2016 IRP, p.76-77): The suggestion that NIPSCO’s Available Potential is not already restricted to the NIPSCO service territory does not make sense because AEG’s Market Potential Study was performed for the NIPSCO service territory (see NIPSCO 2016 IRP, Appendix B).
Program Potential analyzes energy efficiency from the measure-level within NIPSCO’s service territory utilizing the Achievable Potential results…The Program Potential step incorporates the information from NIPSCO’s historic EM&V reports from past program years and applies that information to the Achievable Potential savings amount. The Program Potential is focused on localizing the energy efficiency potential to NIPSCO’s service territory and NIPSCO customers… (NIPSCO 2016 IRP, p.77)
4. Exclusion of free ridership (NIPSCO 2016 IRP, Figure 5-1, p.78, Appendix B, Appendix A): Our Error! Reference source not found., above, reproduces this explanation from
Cause No. 44872, CAC Exhibit 1, Attachment EAS-2
Report on NIPSCO 2016 IRP Public Version Submitted to the IURC on March 16, 2017
33
IRP Figure 5-1: Achievable Potential is adjusted by NIPSCO’s net-to-gross and program factors to estimate Program Potential. The AEG Market Potential Study prepared for NIPSCO (NIPSCO 2016 IRP, Appendix B) explains that Available Potential is adjusted for the net-to-gross ratio to estimate the Program Potential. Appendix A to the IRP further specifies this to mean adjustment for installation rates and free ridership. There is no indication that adjustment has been made for spillover and other impacts that would increase efficiency potential.
MMP utilized past evaluation reports for NIPSCO programs to review the DSM measures within the Program Potential step. The net-to-gross ratios from previous evaluations were applied to the Achievable Potential savings to provide NIPSCO with a better estimate of what is achievable in its service territory. (NIPSCO 2016 IRP, p.78)
Achievable potential is at the measure-level and includes every possible cost-effective opportunity for EE savings regardless of the type of intervention (i.e., utility program, government program, equipment promotion by manufacturers, etc.). The measure-level potential results are presented in Chapter 5. AEG and MMP then developed program potential by selecting the subset of measures in the achievable potential amount that can realistically be implemented considering alignment with near-term implementation accomplishments and budgetary constraints as well as long-term strategic goals and planning constraints. The program potential is what is recorded in the DSM Action Plan and is presented in Chapter 6. (NIPSCO 2016 IRP, Appendix B, p.11)
The Program Potential incorporations installation rates and free ridership from NISPCO EM&V reports. (NIPSCO 2016 IRP, Appendix A)
A single coherent and complete explanation of NIPSCO’s adjustment of Achievable Potential to estimate Program Potential would enhance stakeholders’ ability to appropriately review this IRP.
IX-B-4. All-or-nothing bundle selection
NIPSCO’s 2016 IRP energy efficiency bundles are grouped from 2016-2036 and cannot be selected by individual year, for only some years, or for years after a given date. The functional impact of this modeling constraint is that bundles can only be selected on the basis of economics (that is, on the basis of what will result in a lower cost resource portfolio) if (1) the bundle is cost-effective for the whole 20-year period, and (2) NIPSCO has accurately characterized the bundle’s cost and savings for that whole period. This is extraordinarily speculative and likely to have the effect of reducing the amount of energy efficiency selected in NIPSCO’s cost minimization modeling.
IX-B-5. Apparent errors in DSM savings modeled
On Feb. 17, 2017, CAC emailed NIPSCO asking for the incremental savings associated with its DSM bundles since none was given in the IRP and Strategist modeling files provided to stakeholders; instead, data on efficiency bundle savings were shared in terms of cumulative savings. On March 2, NIPSCO followed up with “incremental gross savings” by selected bundles for the years 2019, 2020, and 2021 only. We clarified to NIPSCO that our request had been for all years modeled but only received NISPCO’s response on March 3. In this response NIPSCO presented the incremental savings for each year from 2016-2036 but only for a subset of bundles, which we infer to be those that are part of the preferred plan. Those numbers revealed that:
Cause No. 44872, CAC Exhibit 1, Attachment EAS-2
Report on NIPSCO 2016 IRP Public Version Submitted to the IURC on March 16, 2017
34
Only 50,484 MWh of savings are included, from 19 of 26 bundles, in 2016 in the preferred plan, whereas NIPSCO’s currently approved plan goal for that year was 108,338 MWh (NIPSCO 2016 IRP, Table 5-5, p. 67).
Even if all 22 efficiency bundles had been included in the preferred plan, that is likely to have only constituted about 80,000 MWh of savings in 2016.
Indeed, the level of achievable potential in 2016, as shown in NIPSCO 2016 IRP Table 5-10, is lower than NIPSCO’s 2016 approved goal by over 20,000 MWh (81,000 MWh of “achievable” potential compared to the 108,338 MWh goal).
The amount of savings included in NIPSCO’s 2016 IRP is not reported consistently within the IRP narrative. Again, clear and consistent description of modeling assumptions and methodologies are essential to stakeholder review.
IX-C. Recommendations for a consistent and comparable resource evaluation
Regarding the evaluation of demand-side resources on a consistent and comparable basis with supply-side resources, we recommend a completely new approach. With so many assumptions layered into the construction of the energy efficiency bundles, it is extremely difficult, if not impossible, to completely evaluate each step for reasonableness. In addition, as each layer of complexity is added, the extent to which these layers of assumptions do not align with actual program offerings makes the bundles inconsistent with the DSM plan. NIPSCO acknowledges this inconsistency in its IRP, stating, “It is important to note that final program design is determined by the bidder(s) selected by NIPSCO, with consideration of input from its Oversight Board… That means that the programs included in the MPS typically change.” (NIPSCO 2016 IRP, p. 98).
We think the issue of consistency between the IRP and the DSM plan can be made more meaningful by focusing on what the IRP can say about the value of energy efficiency, so that all the complexity and assumptions that go into the market potential study, and, therefore, the efficiency bundles, do not lead to an incorrect answer regarding how much energy efficiency is cost-effective—an occurrence that is of particular concern when the selected bundles do not represent the programs the utility plans to offer.
To focus on the value of energy efficiency, we recommend that utilities use IRP modeling to estimate the value of increasing zero-cost decrements of load so that an implicit avoided cost for each decrement is developed. This analysis must be predicated on appropriate (and even-handed) selection of supply-side resources. For example, preventing the model from selecting anything other than MISO capacity and energy purchases before 2023 will not give a useful answer about the value of each load decrement.
If utilities instead continue to use the energy efficiency “bundle” approach employed by NIPSCO in its 2016 IRP, more useful, interpretable results would be achieved by testing generic “portfolio” efficiency bundles with increasing savings over a range of potential costs for each savings level. One of the biggest problems we see with the current energy efficiency bundle approach used by most Indiana utilities is that it assumes perfectly known information about cost and availability of energy efficiency extending twenty years into the future, when in fact there are many reasons to dispute this type of “crystal ball” approach to energy-sector forecasting. There is not even a basic sensitivity in which DSM costs less or is more widely available. Even if NIPSCO could plausibly make the case that its analysis of demand-side resources was “comparable and consistent” with supply-side resources—and we do not believe
Cause No. 44872, CAC Exhibit 1, Attachment EAS-2
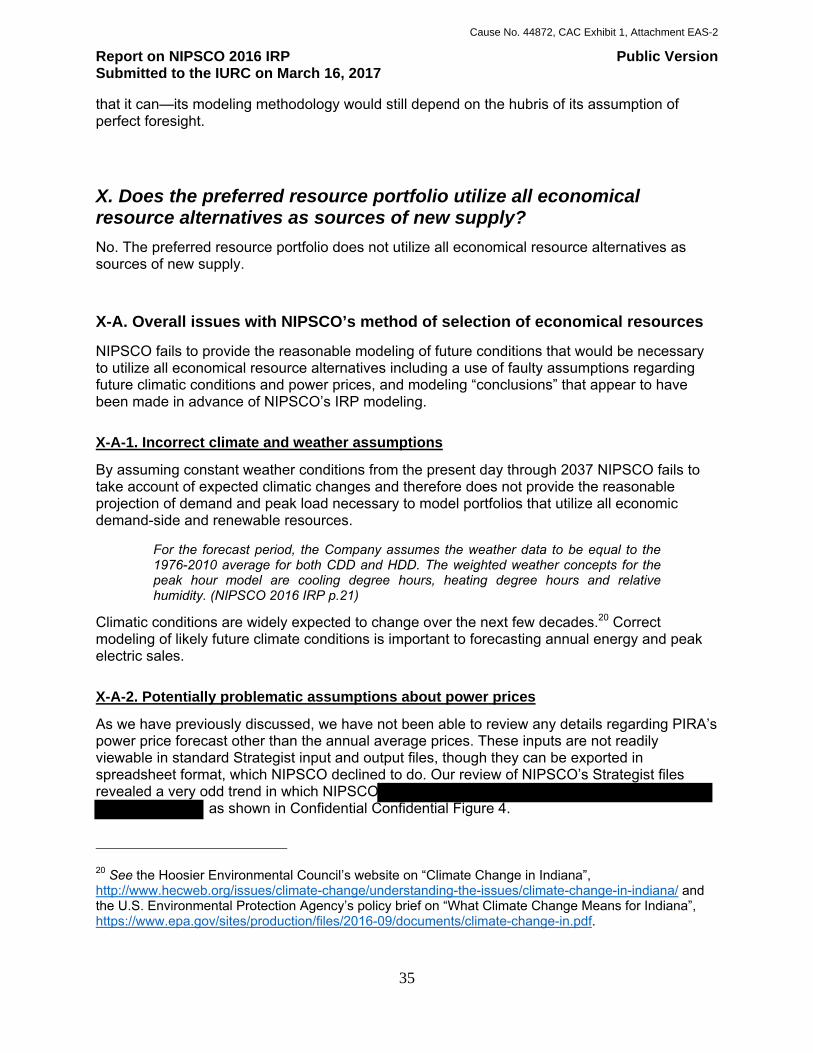
Report on NIPSCO 2016 IRP Public Version Submitted to the IURC on March 16, 2017
35
that it can—its modeling methodology would still depend on the hubris of its assumption of perfect foresight.
X. Does the preferred resource portfolio utilize all economical resource alternatives as sources of new supply?
No. The preferred resource portfolio does not utilize all economical resource alternatives as sources of new supply.
X-A. Overall issues with NIPSCO’s method of selection of economical resources
NIPSCO fails to provide the reasonable modeling of future conditions that would be necessary to utilize all economical resource alternatives including a use of faulty assumptions regarding future climatic conditions and power prices, and modeling “conclusions” that appear to have been made in advance of NIPSCO’s IRP modeling.
X-A-1. Incorrect climate and weather assumptions
By assuming constant weather conditions from the present day through 2037 NIPSCO fails to take account of expected climatic changes and therefore does not provide the reasonable projection of demand and peak load necessary to model portfolios that utilize all economic demand-side and renewable resources.
For the forecast period, the Company assumes the weather data to be equal to the 1976-2010 average for both CDD and HDD. The weighted weather concepts for the peak hour model are cooling degree hours, heating degree hours and relative humidity. (NIPSCO 2016 IRP p.21)
Climatic conditions are widely expected to change over the next few decades.20 Correct modeling of likely future climate conditions is important to forecasting annual energy and peak electric sales.
X-A-2. Potentially problematic assumptions about power prices
As we have previously discussed, we have not been able to review any details regarding PIRA’s power price forecast other than the annual average prices. These inputs are not readily viewable in standard Strategist input and output files, though they can be exported in spreadsheet format, which NIPSCO declined to do. Our review of NIPSCO’s Strategist files revealed a very odd trend in which NIPSCO
as shown in Confidential Confidential Figure 4.
20 See the Hoosier Environmental Council’s website on “Climate Change in Indiana”, http://www.hecweb.org/issues/climate-change/understanding-the-issues/climate-change-in-indiana/ and the U.S. Environmental Protection Agency’s policy brief on “What Climate Change Means for Indiana”, https://www.epa.gov/sites/production/files/2016-09/documents/climate-change-in.pdf.
Cause No. 44872, CAC Exhibit 1, Attachment EAS-2
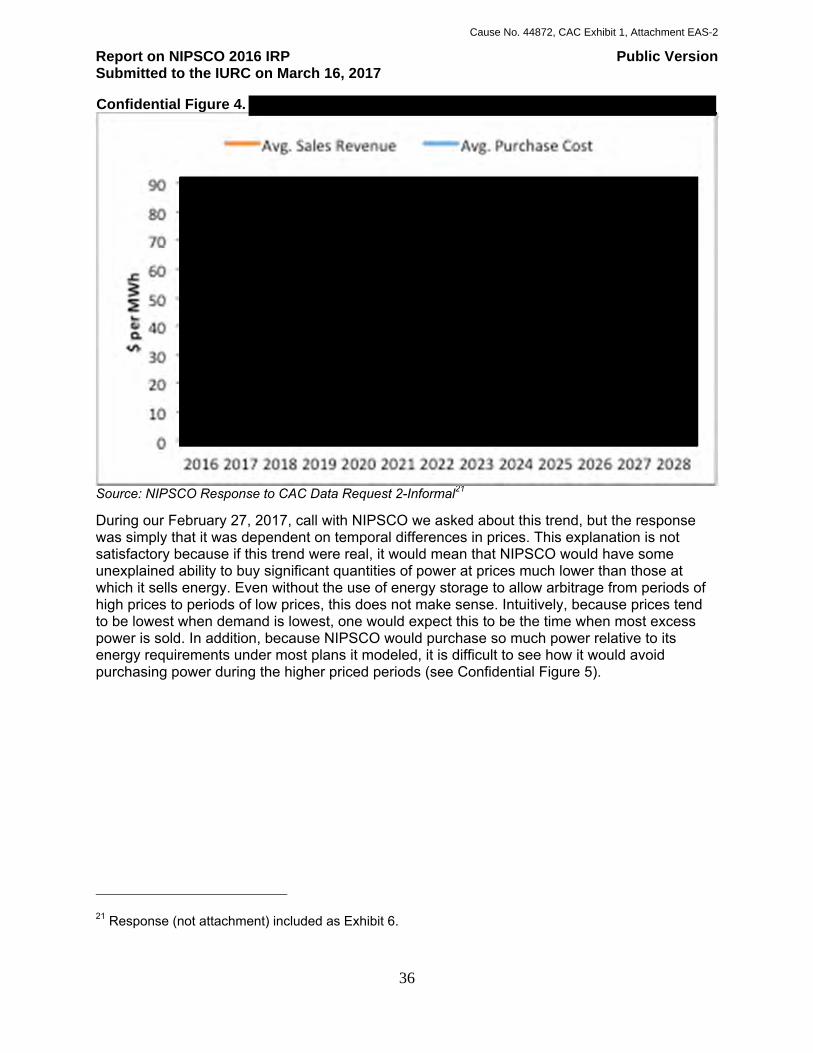
Report on NIPSCO 2016 IRP Public Version Submitted to the IURC on March 16, 2017
36
Confidential Figure 4.
Source: NIPSCO Response to CAC Data Request 2-Informal21
During our February 27, 2017, call with NIPSCO we asked about this trend, but the response was simply that it was dependent on temporal differences in prices. This explanation is not satisfactory because if this trend were real, it would mean that NIPSCO would have some unexplained ability to buy significant quantities of power at prices much lower than those at which it sells energy. Even without the use of energy storage to allow arbitrage from periods of high prices to periods of low prices, this does not make sense. Intuitively, because prices tend to be lowest when demand is lowest, one would expect this to be the time when most excess power is sold. In addition, because NIPSCO would purchase so much power relative to its energy requirements under most plans it modeled, it is difficult to see how it would avoid purchasing power during the higher priced periods (see Confidential Figure 5).
21 Response (not attachment) included as Exhibit 6.
Cause No. 44872, CAC Exhibit 1, Attachment EAS-2
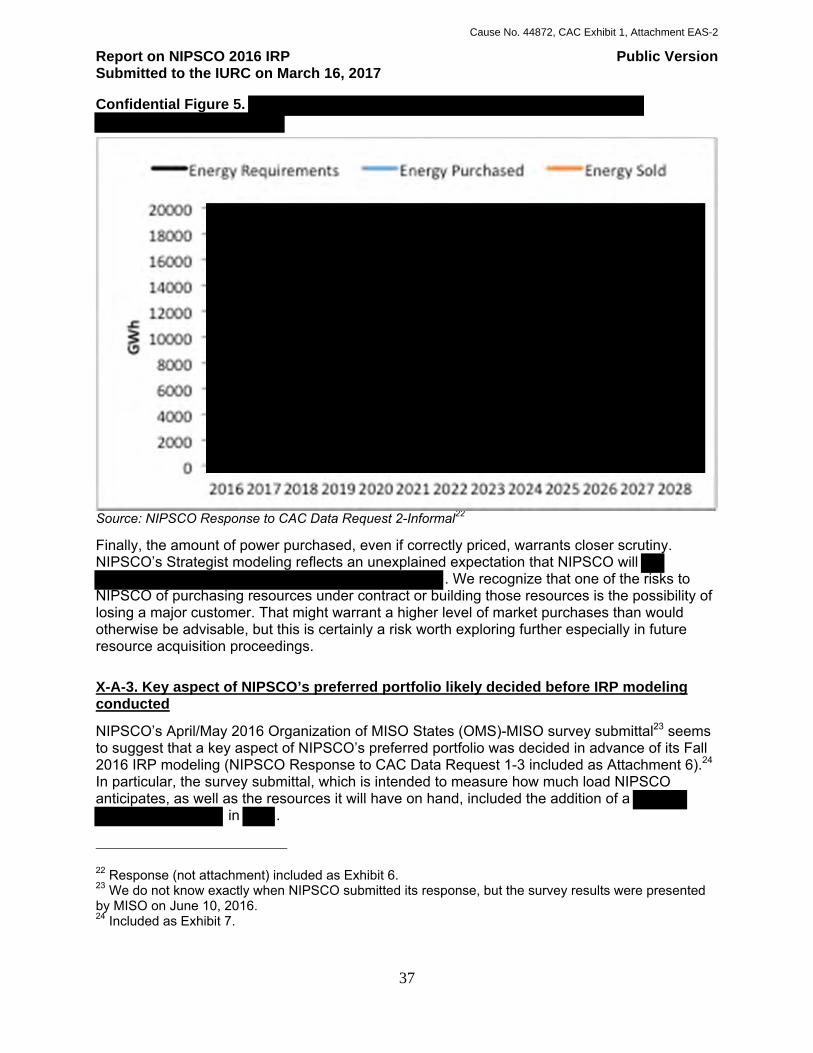
Report on NIPSCO 2016 IRP Public Version Submitted to the IURC on March 16, 2017
37
Confidential Figure 5.
Source: NIPSCO Response to CAC Data Request 2-Informal22
Finally, the amount of power purchased, even if correctly priced, warrants closer scrutiny. NIPSCO’s Strategist modeling reflects an unexplained expectation that NIPSCO will
. We recognize that one of the risks to NIPSCO of purchasing resources under contract or building those resources is the possibility of losing a major customer. That might warrant a higher level of market purchases than would otherwise be advisable, but this is certainly a risk worth exploring further especially in future resource acquisition proceedings.
X-A-3. Key aspect of NIPSCO’s preferred portfolio likely decided before IRP modeling conducted
NIPSCO’s April/May 2016 Organization of MISO States (OMS)-MISO survey submittal23 seems to suggest that a key aspect of NIPSCO’s preferred portfolio was decided in advance of its Fall 2016 IRP modeling (NIPSCO Response to CAC Data Request 1-3 included as Attachment 6).24 In particular, the survey submittal, which is intended to measure how much load NIPSCO anticipates, as well as the resources it will have on hand, included the addition of a
in .
22 Response (not attachment) included as Exhibit 6. 23 We do not know exactly when NIPSCO submitted its response, but the survey results were presented by MISO on June 10, 2016. 24 Included as Exhibit 7.
Cause No. 44872, CAC Exhibit 1, Attachment EAS-2
Report on NIPSCO 2016 IRP Public Version Submitted to the IURC on March 16, 2017
38
To our knowledge, NIPSCO has never declared that this resource decision was made prior to the IRP modeling or its reasons for making this decision. It seems like an unlikely coincidence that no resource additions can be made before 2023, resulting in a significant energy and capacity need that can be filled by this pre-planned resource.
X-A-4. Retirement analysis alternative incorrectly modeled
In addition to our prior critiques of NIPSCO’s retirement analysis (see Section IX), NIPSCO uses an incorrect, inflated cost of replacement capacity in its retirement analysis. NIPSCO’s 2016 IRP states that:
Replacement costs included ongoing variable costs, ongoing fixed costs and the cost of any future environmental controls for the replacement unit. In all comparison analyses, the costs of the replacement unit were scaled on a megawatt basis to the same generating capacity as the existing unit by using a replacement capacity value of the CCGT. Replacement costs for CCGT capacity are assumed to be $282/MW-day with 3% inflation to fill any capacity gaps due to early retirements. This assumption is in-line with the MISO cost of new entry (CONE) which is based on a greenfield CCGT. (NIPSCO 2016 IRP, p.134)
NIPSCO’s method of cost comparison is incorrect in at least two important ways:
NIPSCO states that CONE is $282/MW-day (NIPSCO 2016 IRP, p.134) but 2017/2018 planning year CONE for MISO Zone 6 (in which Indiana is located) is $258/MW-day and is based on a combustion turbine not a CCGT.25
CONE is not the correct cost with which to compare the cost of continued operation of NIPSCO’s coal units. A more correct comparison would reflect the cost of purchasing capacity. CONE is the effective cap on the MISO Planning Resource Auction price, was based on a combustion turbine (and not a combined cycle unit) in MISO’s most recent calculations, and is (by definition) higher than actual MISO capacity prices.
Had NIPSCO used a correct cost for its alternative to continued operation of coal units, retirement of these units would have been more favorable and resulted in lower PVRR values.
X-B. Does the preferred resource portfolio utilize all economical load
management, demand-side management, and energy efficiency improvements?
No. NIPSCO’s 2016 IRP does not appear to utilize all economical demand-side management and load management as discussed in Section IX.
25 See https://www.misoenergy.org/Library/Repository/Tariff/FERC%20Filings/FINAL Annual%20CONE%20Filing%20letter.pdf
Cause No. 44872, CAC Exhibit 1, Attachment EAS-2
Report on NIPSCO 2016 IRP Public Version Submitted to the IURC on March 16, 2017
39
X-C. Does the preferred resource portfolio utilize all economical technology
relying on renewable resources?
No. See Section 0 above entitled, “IX-A. Is each supply-side resource alternative evaluated on a consistent and comparable basis with other supply-side resources?”
X-D. Does the preferred resource portfolio utilize all economical cogeneration?
We did not review this aspect of NIPSCO’s IRP modeling.
X-E. Does the preferred resource portfolio utilize all economical distributed
generation?
No. See Section 0 above.
X-F. Does the preferred resource portfolio utilize all economical energy storage?
We did not review this aspect of NIPSCO’s IRP modeling.
X-G. Does the preferred resource portfolio utilize all economical transmission?
We did not review this aspect of NIPSCO’s IRP modeling.
X-H. Recommendations for utilizing all economical resource alternatives
For a complete, and even handed, utilization of all economical resource alternatives, we recommend that NIPSCO use a technology neutral approach to resource inclusion in modeling and take care to evaluate all resources on a consistent and comparable basis.
Cause No. 44872, CAC Exhibit 1, Attachment EAS-2

Report on NIPSCO 2016 IRP Public Version Submitted to the IURC on March 16, 2017
40
XI. Are targeted DSM programs evaluated, including their impacts on the utility’s transmission and distribution system?
We did not review this aspect of NIPSCO’s IRP modeling.
Cause No. 44872, CAC Exhibit 1, Attachment EAS-2
Report on NIPSCO 2016 IRP Public Version Submitted to the IURC on March 16, 2017
41
XII. Are the financial impacts to the utility of acquiring the future resources identified in the preferred resource portfolio assessed?
No. While NIPSCO does assess the financial impacts to the utility of acquiring the future resources identified in the portfolio that it designates as preferred (NIPSCO 2016 IRP p.160-162), as discussed above NIPSCO’s preferred resource has been improperly designated. To be the preferred resource portfolio, the portfolio must be selected from among the candidate portfolios or be subject to the same analysis as the original candidate portfolios and have the same information presented for candidate portfolios also presented for any additional portfolios.
Cause No. 44872, CAC Exhibit 1, Attachment EAS-2
Report on NIPSCO 2016 IRP Public Version Submitted to the IURC on March 16, 2017
42
XIII. Does the preferred resource portfolio balance cost minimization with cost-effective risk and uncertainty reduction?
No. NIPSCO has not performed or presented analysis related to balancing cost minimization with cost-effective risk and uncertainty reduction, and the portfolio that NIPSCO designates as preferred has been improperly identified. To be the preferred resource portfolio, the portfolio must be selected from among the candidate portfolios. In addition, the scant information that NIPSCO presents regarding its effort to balance cost minimization with cost-effect risk and uncertainty reduction in the design of its preferred portfolio is insufficient to third-party review. NIPSCO limits its discussion to the contradictory claim that its preferred portfolio is less expensive than its least-cost portfolio and cautions stakeholders that:
No longer is it possible to view the world in terms of choosing a simple least cost option; it is now necessary to think it terms of minimizing future environmental impacts and maximizing resource diversification all the while ensuring affordable service to customers. (NIPSCO 2016 IRP p.163)
If NIPSCO has performed any analysis—whether qualitative or quantitative—related to its efforts to balance cost minimization with cost-effective risk and uncertainty reduction in its design of the preferred portfolio the utility has failed to present this analysis to stakeholders. Any discussion or presentation of this balancing exercise is absent from the IRP.
NIPSCO could be said to have attempted to balance cost minimization and some measure of risk assessment, along with several other metrics, in its flawed retirement analysis but this is not a substitute for consideration of this balance in the preferred resource portfolio itself, as required in the IURC’s guidance.
We recommend that IRPs include an explicit, detailed account of how cost minimization has been balanced with cost-effective risk and uncertainty reduction in the selection of the preferred resource portfolio from among the candidate portfolios.
Cause No. 44872, CAC Exhibit 1, Attachment EAS-2
Report on NIPSCO 2016 IRP Public Version Submitted to the IURC on March 16, 2017
43
XIV. Are risks and uncertainties quantified, including, but not limited to: regulatory compliance, public policy, fuel prices, construction costs, resource performance, load requirements, wholesale electricity and transmission prices, RTO requirements, and technological progress?
No. NIPSCO’s 2016 IRP’s analysis of risks and uncertainties while quantitative does not include many of the risk categories listed in IURC guidance and contains other errors and limitations.
XIV-A. Limited scope of sensitivity analysis
NIPSCO’s analysis of risk and uncertainties is limited to load, CO2 prices, natural gas prices, power prices, and the presence or absence of a renewable portfolio standard in Indiana. NIPSCO’s sensitivity analysis does not include examination of variation in regulatory compliance, public policy other than CO2 prices and RPS, construction costs, resource performance, transmission prices, RTO requirements, or technological progress.
NIPSCO points out an additional limitation in its approach to sensitivity analysis and to the Strategist model:
NIPSCO has developed a robust set of scenarios and sensitivities to capture uncertainty. While this effort helps mitigate risk, a more dynamic effort would involve the inclusion of a stochastic process in the IRP modeling. Strategist® was the primary tool utilized in the IRP modeling process and is unfortunately incapable of directly utilizing statistical tools within its engine. (NIPSCO 2016 IRP, p.11)
In addition, NIPSCO’s choice of scenarios and sensitivities (see NIPSCO 2016 IRP, Table 8-1) appears to include a few errors:
The Aggressive Environmental Regulation scenario (which is actually a high carbon price scenario without other changes to environmental regulations) is tested for sensitivity to high renewables (adding an RPS policy) and changes to load simultaneously. It is difficult to see how these sensitivities could yield useful information without a sensitivity showing an RPS modeled at base load and an RPS modeled without a high carbon price.
Several of NIPSCO’s forecasted scenario variables result in conflicted or inconsistent changes to other related variables. In some scenarios, commodity and power prices change in response to changes in load; in others they do not, or, in some cases, change in the opposite direction:
Under the Base scenario the low load sensitivity uses base (and not low) natural gas and power price forecasts;
The Challenged Economy scenario, which has low load, uses low (and not base) natural gas and power prices;
The Booming Economy changes, which has high load, uses high (and not base) natural gas and power prices;
The No CO2 Price sensitivity to the Booming Economy scenario, which has high load, uses base natural gas and power prices (albeit with an adjustment for a zero CO2 price);
The Aggressive Environmental Regulation scenario high load sensitivity uses “very high” natural gas and power prices; and
Cause No. 44872, CAC Exhibit 1, Attachment EAS-2

Report on NIPSCO 2016 IRP Public Version Submitted to the IURC on March 16, 2017
44
The Aggressive Environmental Regulation scenario low load sensitivity also uses “very high” natural gas and power prices.
No explanation is offered in the IRP for these discrepancies.
XIV-B. Recommendations for quantifying risks and uncertainties
For complete quantification of risks and uncertainties our recommendation is to follow IURC’s guidance on key uncertain parameters to examine, and to carefully review all IRP materials for internal consistency.
Cause No. 44872, CAC Exhibit 1, Attachment EAS-2

Report on NIPSCO 2016 IRP Public Version Submitted to the IURC on March 16, 2017
45
XV. Is the performance of candidate resource portfolios analyzed across a wide range of potential futures?
No. NIPSCO’s candidate resource portfolios are not tested against a sufficiently wide range of potential futures, as discussed in Section XIV.
Cause No. 44872, CAC Exhibit 1, Attachment EAS-2
Report on NIPSCO 2016 IRP Public Version Submitted to the IURC on March 16, 2017
46
XVI. Are candidate resource portfolios ranked by present value of revenue requirement and by risk metric?
No. NIPSCO’s 2016 IRP candidate resource portfolios are only partially ranked by the PVRR values that IURC requires, and the utility’s approach to ranking by risk metric uses a methodology that is almost entirely opaque to stakeholders.
XVI-A. Are candidate resource portfolios ranked by their present value of revenue
requirement in total dollars and dollars per kilowatt-hour delivered with discount
rate specified?
No. Candidate resource portfolios appeared to be ranked by their present value of revenue requirement in total dollars in NIPSCO 2016 IRP Figure 8-15, although no units are specified in this figure. Candidate portfolios do not appear to be ranked by their dollars per kilowatt-hour delivered.
XVI-B. Are candidate resource portfolios ranked by risk metric?
NIPSCO’s qualitative presentation of its candidate portfolio results can be construed as a ranking by risk metric.
XVI-C. Recommendations for appropriate ranking PVRR and risk metric
We question the utility of black box, qualitative “scorecard” approaches to IRP portfolio selection. These methods are largely opaque to the IRP audience and cannot be subjected to the kind of rigorous third-party analysis that protects the public interest in an IRP process. Furthermore, because of their black box and qualitative characters, such analyses can be made to produce a very wide range of policy results (here, IRP preferred resource portfolios) based on small modeling choices that are not always expressed to stakeholders as explicit IRP goals.
Not only does NIPSCO’s 2016 IRP use such a scorecard approach, in the end it does not select its preferred resource portfolio from among the candidate portfolios assessed using this method. Instead, it introduces a new additional portfolio that is not given the same level of scrutiny as the candidate portfolios.
For a complete and appropriate ranking by PVRR and risk metric, we recommend a transparent IRP process in which all modeling files and descriptions, as well as all background analyses, are made available to stakeholders. We recommend against the use of black box, qualitative scorecards for IRP portfolio section and instead recommend clearly presented quantitative results for various key findings presented side-by-side for all portfolios and scenario combinations. This grid of results could be color coded to make obvious gradations in value without disguising underlying information. Utilities should reference this grid in their presentation of a clear, detailed justification for their choice of a preferred portfolio from among the candidates. This, too, is a qualitative and subjective approach, but it is far more transparent to stakeholders and requires utilities to carefully justify their subjective choices.
Cause No. 44872, CAC Exhibit 1, Attachment EAS-2

Report on NIPSCO 2016 IRP Public Version Submitted to the IURC on March 16, 2017
47
XVII. Does an assessment of robustness factor into the selection of the preferred portfolio?
No. If an assessment of robustness was factored into the selection of the portfolio designated as preferred in NIPSCO’s 2016 IRP the utility has failed to present any information related to this assessment. In the conclusion to its IRP, NIPSCO asserts that:
The NIPSCO Integrated Resource Plan seeks to ensure reliable, cost effective electric service for customers while maintaining a robust and diverse pool of supply-side generation and demand-side options. (NIPSCO 2016 IRP p.163)
However, any actual evidence of analysis performed to achieve a robust pool of resource options is conspicuously missing.
Several references made in the IRP suggest that NIPSCO has erroneously assessed scenarios for their robustness, instead of the actual resources chosen, i.e., the portfolios.
The scenarios were then assessed for diversity and robustness to ensure that they cover wide range of the most critical uncertainties and are internally consistent across the scenarios. (NIPSCO 2016 IRP p.115)
NIPSCO’s references to scenario robustness are puzzling. Scenarios—as used by NIPSCO—are potential future circumstances of prices, customer demand, and policy choices. Robustness simply isn’t a quality that applies to scenarios in this context. Portfolios (sets of resource options) and portfolio “results” under various scenarios can be qualified as more or less robust, but the scenarios themselves cannot.
We recommend that IRPs include an explicit, detailed account of how robustness was factored into the selection of the preferred resource portfolio from among the candidate portfolios.
Cause No. 44872, CAC Exhibit 1, Attachment EAS-2
Report on NIPSCO 2016 IRP Public Version Submitted to the IURC on March 16, 2017
48
XVIII. Does the preferred resource portfolio incorporate a workable strategy for reacting to unexpected changes in circumstances quickly and appropriately?
No. While NIPSCO frequently characterizes its preferred resource portfolio as “flexible”, its explanation of how this might be so is limited to two references to particularly flexible demand response resource options (see pages 89 and 96). If NIPSCO has incorporated in its preferred portfolio a workable strategy for reacting to unexpected changes in circumstances quickly and appropriately it has failed to describe this strategy in its 2016 IRP.
Cause No. 44872, CAC Exhibit 1, Attachment EAS-2

EXHIBIT 1
Cause No. 44872, CAC Exhibit 1, Attachment EAS-2
2016 NIPSCO IRP Northern Indiana Public Service Company’s
Responses to Citizens Action Coalition’s Data Request Set No. 1
CAC Request 1-013:
Please provide all analysis, in electronic format with all formulas and links intact, related to commodity price projections including that provided by PIRA Energy Consultants.
Response:
The information is not available as it is proprietary to PIRA and has not been shared with NIPSCO.
Cause No. 44872, CAC Exhibit 1, Attachment EAS-2

EXHIBIT 2
Cause No. 44872, CAC Exhibit 1, Attachment EAS-2
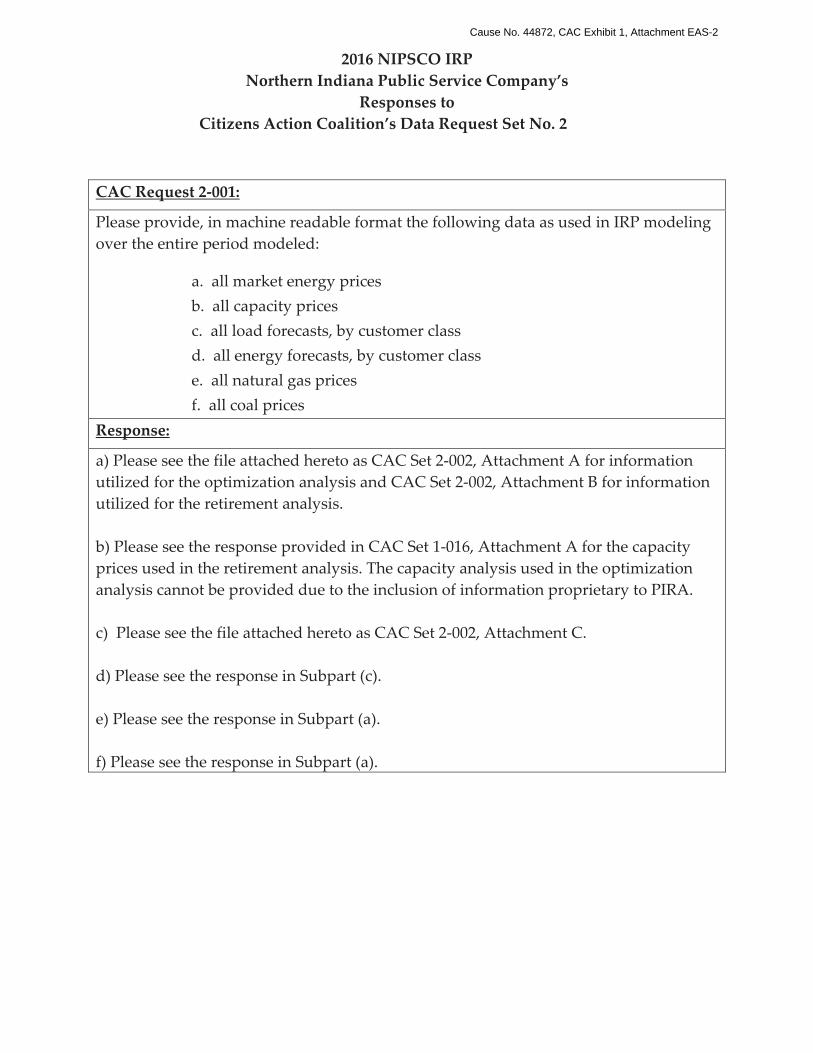
2016 NIPSCO IRP Northern Indiana Public Service Company’s
Responses to Citizens Action Coalition’s Data Request Set No. 2
CAC Request 2-001:
Please provide, in machine readable format the following data as used in IRP modeling over the entire period modeled:
a. all market energy prices b. all capacity prices c. all load forecasts, by customer class d. all energy forecasts, by customer class e. all natural gas prices f. all coal prices
Response:
a) Please see the file attached hereto as CAC Set 2-002, Attachment A for information utilized for the optimization analysis and CAC Set 2-002, Attachment B for information utilized for the retirement analysis. b) Please see the response provided in CAC Set 1-016, Attachment A for the capacity prices used in the retirement analysis. The capacity analysis used in the optimization analysis cannot be provided due to the inclusion of information proprietary to PIRA. c) Please see the file attached hereto as CAC Set 2-002, Attachment C. d) Please see the response in Subpart (c). e) Please see the response in Subpart (a). f) Please see the response in Subpart (a).
Cause No. 44872, CAC Exhibit 1, Attachment EAS-2

EXHIBIT 3
Cause No. 44872, CAC Exhibit 1, Attachment EAS-2
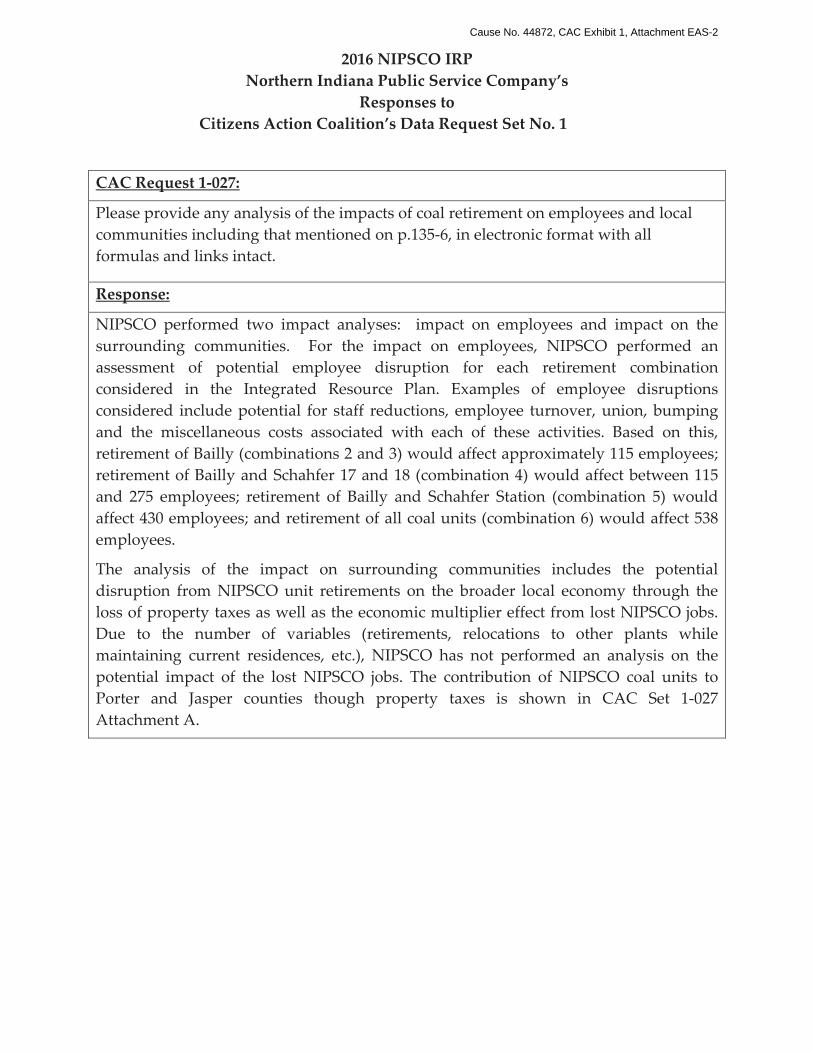
2016 NIPSCO IRP Northern Indiana Public Service Company’s
Responses to Citizens Action Coalition’s Data Request Set No. 1
CAC Request 1-027:
Please provide any analysis of the impacts of coal retirement on employees and local communities including that mentioned on p.135-6, in electronic format with all formulas and links intact.
Response:
NIPSCO performed two impact analyses: impact on employees and impact on the surrounding communities. For the impact on employees, NIPSCO performed an assessment of potential employee disruption for each retirement combination considered in the Integrated Resource Plan. Examples of employee disruptions considered include potential for staff reductions, employee turnover, union, bumping and the miscellaneous costs associated with each of these activities. Based on this, retirement of Bailly (combinations 2 and 3) would affect approximately 115 employees; retirement of Bailly and Schahfer 17 and 18 (combination 4) would affect between 115 and 275 employees; retirement of Bailly and Schahfer Station (combination 5) would affect 430 employees; and retirement of all coal units (combination 6) would affect 538 employees.
The analysis of the impact on surrounding communities includes the potential disruption from NIPSCO unit retirements on the broader local economy through the loss of property taxes as well as the economic multiplier effect from lost NIPSCO jobs. Due to the number of variables (retirements, relocations to other plants while maintaining current residences, etc.), NIPSCO has not performed an analysis on the potential impact of the lost NIPSCO jobs. The contribution of NIPSCO coal units to Porter and Jasper counties though property taxes is shown in CAC Set 1-027 Attachment A.
Cause No. 44872, CAC Exhibit 1, Attachment EAS-2

EXHIBIT 4
Cause No. 44872, CAC Exhibit 1, Attachment EAS-2
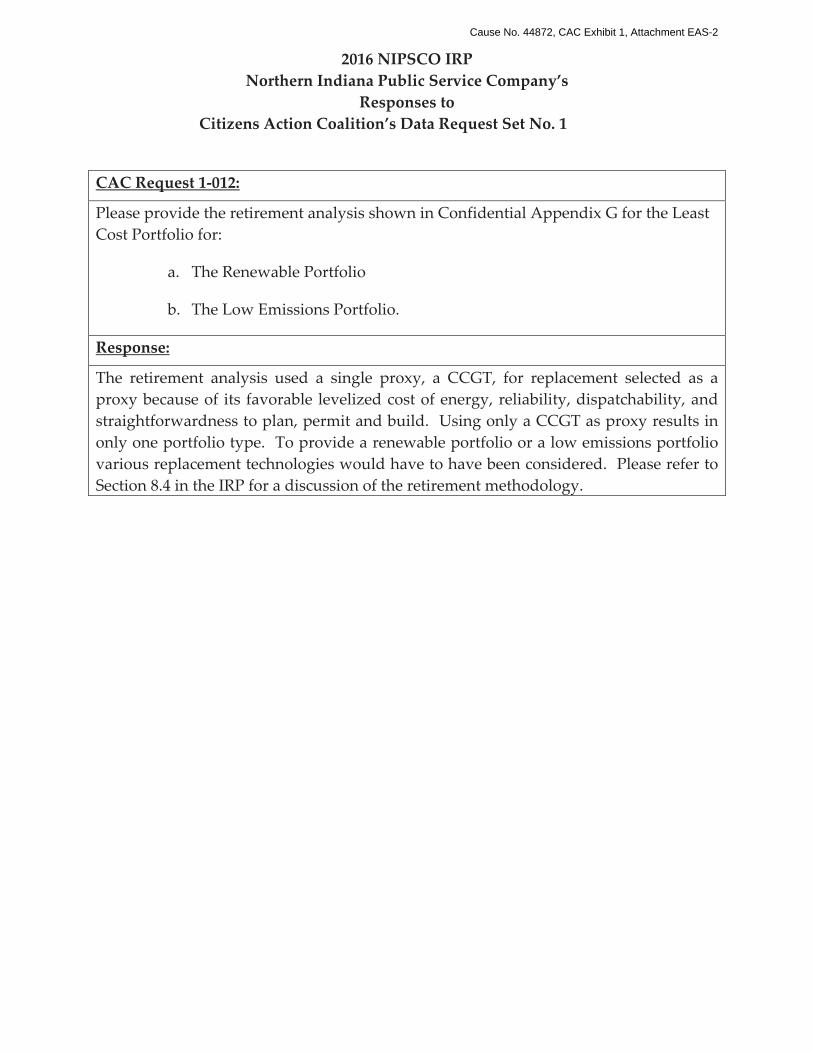
2016 NIPSCO IRP Northern Indiana Public Service Company’s
Responses to Citizens Action Coalition’s Data Request Set No. 1
CAC Request 1-012:
Please provide the retirement analysis shown in Confidential Appendix G for the Least Cost Portfolio for:
a. The Renewable Portfolio
b. The Low Emissions Portfolio.
Response:
The retirement analysis used a single proxy, a CCGT, for replacement selected as a proxy because of its favorable levelized cost of energy, reliability, dispatchability, and straightforwardness to plan, permit and build. Using only a CCGT as proxy results in only one portfolio type. To provide a renewable portfolio or a low emissions portfolio various replacement technologies would have to have been considered. Please refer to Section 8.4 in the IRP for a discussion of the retirement methodology.
Cause No. 44872, CAC Exhibit 1, Attachment EAS-2

EXHIBIT 5
Cause No. 44872, CAC Exhibit 1, Attachment EAS-2
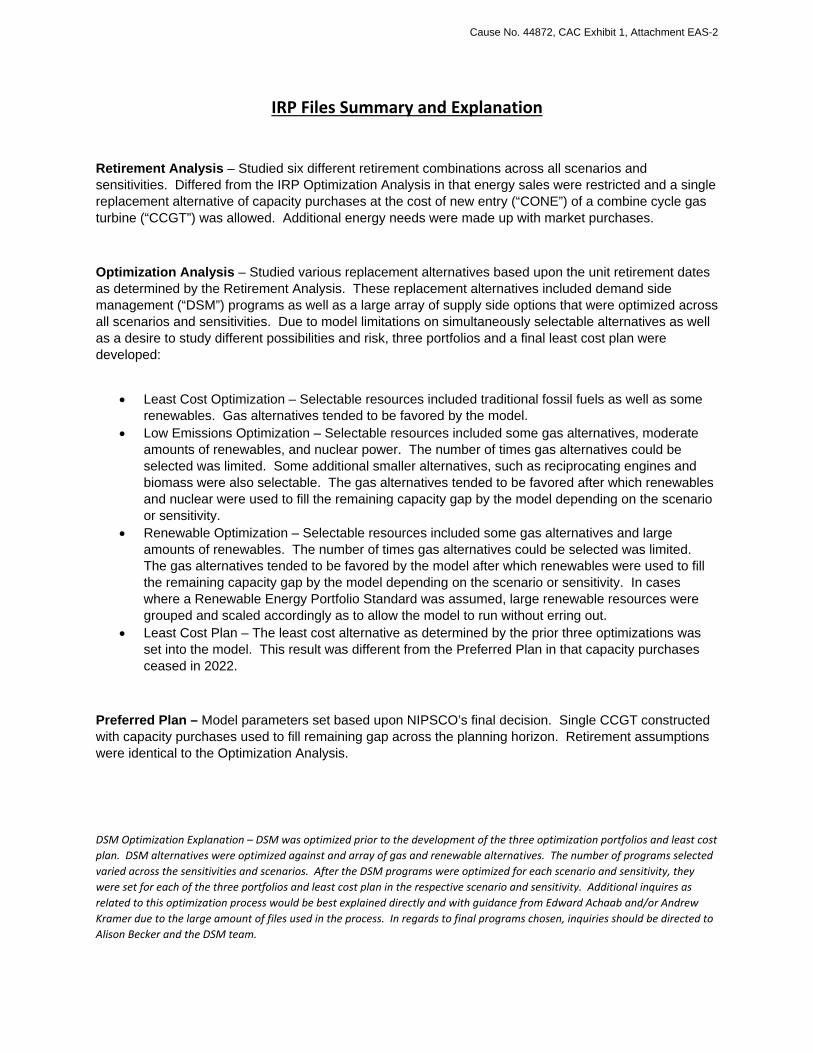
IRP Files Summary and Explanation
Retirement Analysis – Studied six different retirement combinations across all scenarios and sensitivities. Differed from the IRP Optimization Analysis in that energy sales were restricted and a single replacement alternative of capacity purchases at the cost of new entry (“CONE”) of a combine cycle gas turbine (“CCGT”) was allowed. Additional energy needs were made up with market purchases.
Optimization Analysis – Studied various replacement alternatives based upon the unit retirement dates as determined by the Retirement Analysis. These replacement alternatives included demand side management (“DSM”) programs as well as a large array of supply side options that were optimized across all scenarios and sensitivities. Due to model limitations on simultaneously selectable alternatives as well as a desire to study different possibilities and risk, three portfolios and a final least cost plan were developed:
• Least Cost Optimization – Selectable resources included traditional fossil fuels as well as some
renewables. Gas alternatives tended to be favored by the model. • Low Emissions Optimization – Selectable resources included some gas alternatives, moderate
amounts of renewables, and nuclear power. The number of times gas alternatives could be selected was limited. Some additional smaller alternatives, such as reciprocating engines and biomass were also selectable. The gas alternatives tended to be favored after which renewables and nuclear were used to fill the remaining capacity gap by the model depending on the scenario or sensitivity.
• Renewable Optimization – Selectable resources included some gas alternatives and large amounts of renewables. The number of times gas alternatives could be selected was limited. The gas alternatives tended to be favored by the model after which renewables were used to fill the remaining capacity gap by the model depending on the scenario or sensitivity. In cases where a Renewable Energy Portfolio Standard was assumed, large renewable resources were grouped and scaled accordingly as to allow the model to run without erring out.
• Least Cost Plan – The least cost alternative as determined by the prior three optimizations was set into the model. This result was different from the Preferred Plan in that capacity purchases ceased in 2022.
Preferred Plan – Model parameters set based upon NIPSCO’s final decision. Single CCGT constructed with capacity purchases used to fill remaining gap across the planning horizon. Retirement assumptions were identical to the Optimization Analysis. DSM Optimization Explanation – DSM was optimized prior to the development of the three optimization portfolios and least cost plan. DSM alternatives were optimized against and array of gas and renewable alternatives. The number of programs selected varied across the sensitivities and scenarios. After the DSM programs were optimized for each scenario and sensitivity, they were set for each of the three portfolios and least cost plan in the respective scenario and sensitivity. Additional inquires as related to this optimization process would be best explained directly and with guidance from Edward Achaab and/or Andrew Kramer due to the large amount of files used in the process. In regards to final programs chosen, inquiries should be directed to Alison Becker and the DSM team.
Cause No. 44872, CAC Exhibit 1, Attachment EAS-2

EXHIBIT 6
Cause No. 44872, CAC Exhibit 1, Attachment EAS-2
2016 NIPSCO IRP Northern Indiana Public Service Company’s
Responses to Citizens Action Coalition’s Informal Data Request Set No. 2
CAC Informal Request 2-001:
Please provide the following:
1. Requested data items in Excel Format (SEE EXCEL DOCUMENT);
2. GAF System Report (at least one so that I can cross check against the information in request #1);
3. PRV System Cost Report;
4. Tunnel Report; and
5. Integrated Plan Report.
Response:
Attached, please find the Confidential Base Case Scenarios as requested in subparts (1) through (5).
Cause No. 44872, CAC Exhibit 1, Attachment EAS-2

EXHIBIT 7
Cause No. 44872, CAC Exhibit 1, Attachment EAS-2
2016 NIPSCO IRP Northern Indiana Public Service Company’s
Responses to Citizens Action Coalition’s Data Request Set No. 1
CAC Request 1-003:
Please provide a copy of NIPSCO’s 2016 submittal to the OMS-MISO survey with all formulas and links intact. Response:
Please see the file attached hereto as CAC Set 1-003 Confidential Attachment A for the OMS-MISO survey as submitted by NIPSCO which is being provided under the terms of the CONFIDENTIALITY AGREEMENT between Citizens Action Coalition and NIPSCO regarding NIPSCO’s 2016 IRP.
Cause No. 44872, CAC Exhibit 1, Attachment EAS-2

ATTACHMENT-EAS-2-CONFIDENTIAL