Embed Size (px)
Citation preview
i State of Environment Outlook Report for the Western Cape Province
State of Environment Outlook Report
for the Western Cape Province
Inland Water Chapter
September 2013

i State of Environment Outlook Report for the Western Cape Province
Document Title and Version:
Inland Water Chapter
Client:
Western Cape Department of Environmental Affairs & Development Planning
Project Name:
State of Environment Outlook Report for the Western Cape Province
Royal HaskoningDHV Reference Number:
E02.CPT.00330
Authority Reference:
EADP2/2013
Authors:
Tasneem Collins & Earl Herdien
Acknowledgements:
Western Cape Government Environmental Affairs & Development Planning
Karen Shippey, Joos Roelofse, Wouter Swart & Frances van der Merwe
Photo Credits:
Pages 1, 4, 20, 24, 25 – Earl Herdien
Pages 3, 4, 17 – Tasneem Collins
Page 14 – John Cronjé
Date:
September 2013
DOCUMENT DESCRIPTION
State of Environment Outlook Report for the Western Cape Province ii
1 INTRODUCTION 1
2 PRESSURES 1
2.1 AGRICULTURE 2
2.2 HUMAN SETTLEMENTS 3
2.2.1 Informal settlements 3 2.2.2 Urban and semi-urban settlements 4
2.3 INVASIVE ALIEN PLANTS 4
2.4 FORESTRY 5
2.5 AQUACULTURE 5
3 STATE 5
3.1 WATER AVAILABILITY 6
3.1.1 Surface water resources 7 3.1.2 Groundwater resources 8 3.1.3 High water yield areas 8 3.1.4 Water supply and consumption 11
3.2 FITNESS FOR USE 14
3.2.1 Surface water quality 14 3.2.2 Groundwater quality 16
3.3 FRESHWATER ECOSYSTEM HEALTH 16
3.3.1 River health indicators of ecological change 16 3.3.2 Wetlands 20
4 IMPACTS 22
5 RESPONSES 23
5.1 SUSTAINABLE WATER MANAGEMENT PLAN 23
5.2 BERG RIVER IMPROVEMENT PLAN 24
5.3 RECONCILIATION STRATEGIES 25
5.4 FRESHWATER ECOSYSTEM PRIORITY AREAS 27
5.5 INVASIVE ALIEN SPECIES 28
5.6 ADOPT-A-RIVER PROGRAMME 28
5.7 POLICY, TOOLS AND LEGISLATION 29
6 CONCLUSION 29
7 REFERENCES 32
TABLE OF CONTENTS
iii State of Environment Outlook Report for the Western Cape Province
Figure 1: WMA and provinces of South Africa (DWAF 2009) 6
Figure 2: High surface water yield areas, shown in m3/annum (Nel et al. 2011) 9
Figure 3: High groundwater recharge areas, shown in m3/annum (Nel et al. 2011) 10
Figure 4: Availability and consumption of water in the Berg WMA (DEADP 2012a) 11
Figure 5: Availability and consumption of water in the Breede WMA (DEADP 2012a) 12
Figure 6: Availability and consumption of water in the Gouritz WMA (DEADP 2012a) 12
Figure 7: Availability and consumption of water in the Olifants / Doorn WMA (DEADP 2012a) 13
Figure 8: Consolidated River Health Water Quality sampling results (RHP 2004, 2005, 2006, 2007 &
2011) 15
Figure 9: River Condition Map for the Western Cape (Nel et al. 2011) 18
Figure 10: Consolidated River Health EcoStatus Assessment Results reflecting PES of the Western
Province (RHP 2004, 2005, 2006, 2007 & 2011) 19
Figure 11: Wetland Condition Map for the Western Cape (Nel et al 2011) 21
Figure 12: Water Reconciliation Strategies and anticipated impacts for water availability (DWAF
2007) 27
TABLE OF FIGURES
State of Environment Outlook Report for the Western Cape Province iv
Table 1: The Water Management Areas and major rivers of the Western Cape 6
Table 2: Available surface water per water management area (million m³) (StatsSA 2010 & NWRS I
2004) 7
Table 3: Utilizable groundwater exploitable potential (UGEP) per WMA in the Western Cape (DWA
2010c) 8
Table 4: A comparison of the overall water resource supply and consumption between 2000 and
2005, per Water Management Area (DEADP 2005; DEADP 2012a) 13
Table 5: River health categories utilised in the assessment of surface water quality (DWAF 1999) 15
Table 6: Summarised river health monitoring survey results (RHP 2004, 2005, 2006, 2007 & 2011) 19
Table 7: Summary of policy, tools and legislation for this theme 29
Table 8: Summary of key aspects identified in the chapter 31
Table 9: Summary of the outlook for inland water based on the findings of the Western Cape State
of Environment Outlook Report 31
LIST OF TABLES

v State of Environment Outlook Report for the Western Cape Province
CMA Catchment Management Agency
DAFF Department of Agriculture, Forestry and Fisheries
DEADP Department of Environmental Affairs and Development Planning
DWA Department of Water Affairs
FEPAs Freshwater Ecosystem Priority Areas
FI Fish Index
GI Geomorphologic index
IHI Index of Habitat Integrity
NAEHMP National Aquatic Ecosystem Health Monitoring Programme
NEMP National Eutrophication Monitoring Programme
NWA National Water Act
PES Present Ecological State
RHP River Health Programme
RQO‟s Resource Quality Objectives
RVI Riparian Vegetation Index
SASS5 South African Scoring System version 5
StatsSA Statistics South Africa
UGEP Utilizable Groundwater Exploitable Potential
WAAS Water Availability Assessment Study
WCWSS Western Cape Water Supply System
WMA Water Management Areas
ABBREVIATIONS
State of Environment Outlook Report for the Western Cape Province vi
Biodiversity The diversity of animals, plants and other organisms found within and
between ecosystems, habitats, and the ecological complexes
Ecological
Water Reserve
The water that is necessary to protect the water ecosystems. The
ecological reserve specifies both the quantity and quality of water that
must remain unused in a water resource. The ecological reserve is
determined for all major water resources in the different water
management areas to ensure sustainable use
EcoStatus The totality of the features and characteristics of a river and its riparian
area that bear upon its ability to support an appropriate natural flora
and fauna and its capacity to provide a variety of goods and services
Ecosystem A dynamic system of plant, animal (including humans) and micro-
organism communities and their non-living physical environment
interacting as a functional unit. The basic structural unit of the biosphere,
ecosystems are characterised by interdependent interaction between
the component species and their physical surroundings. Each ecosystem
occupies a space in which macro-scale conditions and interactions are
relatively homogenous
Environment In terms of the National Environmental Management Act (NEMA) (No
107 of 1998)(as amended), “Environment” means the surroundings within
which humans exist and that are made up of: the land, water and
atmosphere of the earth;
Micro-organisms, plants and animal life; any part or combination of (i) of
(ii) and the interrelationships among and between them; and the
physical, chemical, aesthetic and cultural properties and conditions of
the foregoing that influence human health and wellbeing
Environmental
Impact
A change to the environment, whether adverse or beneficial, wholly or
partially, resulting from an organisations activities, products or services.
Integrated
Environmental
Management
A philosophy that prescribes a code of practice for ensuring that
environmental considerations are fully integrated into all stages of the
development and decision-making process. The IEM philosophy (and
principles) is interpreted as applying to the planning, assessment,
implementation and management of any proposal (project, plan,
programme or policy) or activity - at local, national and international
level - that has a potentially significant effect on the environment.
Implementation of this philosophy relies on the selection and application
of appropriate tools for a particular proposal or activity. These may
include environmental assessment tools (such as strategic environmental
assessment and risk assessment), environmental management tools
(such as monitoring, auditing and reporting) and decision-making tools
(such as multi-criteria decision support systems or advisory councils)
GLOSSARY
vii State of Environment Outlook Report for the Western Cape Province
Integrated
Water
Resource
Management
Is a process which promotes the co-ordinated development and
management of water, land and related resources, in order to maximise
the resultant economic and social welfare in an equitable manner
without compromising the sustainability of vital ecosystems. IWRM is
simultaneously a philosophy, a process, and an implementation strategy
to achieve equitable access to, and sustainable use of, water resources
by all stakeholders at catchment, regional, national, and international
levels, while maintaining the characteristics and integrity of water
resources at the catchment scale within agreed limits
Pollution Is the direct or indirect alteration of the physical, chemical or biological
properties of a water resource, so as to make it (inter alia)- less fit for any
beneficial purpose for which it may reasonably be expected to be used;
or harmful or potentially harmful to the welfare or human beings, to any
aquatic or non-aquatic organisms, or to the resource quality
Present
Ecological
State
The status quo estimate of environmental resources ecology. For a water
resources, system driver (Geomorph and Hydrology) and response
(Biological) components are measured in terms of the ecoclassification
whereby an index derived approach is used to measures representative
changes from a perceived natural reference state to its current
reference state
Water Quality The term water quality describes the physical, chemical, biological and
aesthetic properties of water which determine its fitness for a variety of
uses and for protecting the health and integrity of aquatic ecosystems.
Many of these properties are controlled or influenced by constituents
which are either dissolved or suspended in water
Water
Resource
includes a watercourse, surface water, estuary or aquifer
Water Use An activity which has an impact on a water resource and affects the:
amount of water in the resource; the quality of water in the resource; or
the environment depended on the status quo of the water resource
being used
Watercourse A river or spring; a natural channel or depression in which water flows
regularly or intermittently; a wetland, lake or dam into which, or from
which, water flows; and any collection of water which the Minister may,
by notice in the Gazette, declare to be a watercourse as defined in the
National Water Act, 1998 (Act No. 36 of 1998) and a reference to a
watercourse includes, where relevant, its bed and banks
Wetland Land which is transitional between terrestrial and aquatic systems where
the water table is usually at or near the surface, or the land is periodically
covered with shallow water, and which land in normal circumstances
supports or would support vegetation typically adapted to life in
saturated soil

1 State of Environment Outlook Report for the Western Cape Province
1 INTRODUCTION
South Africa is a water scarce country and the resource is unevenly distributed across the
country‟s landscape. The majority of the exploitable water is found in sparsely populated
mountain catchment areas and within the boundary of our neighbour Lesotho.
Nevertheless, as custodian of the country‟s water resources the South African government
has the responsibility to provide water for the entire population. It also has the obligation
to supply this resource in an ecologically sustainable manner (DWA 2009). As a result,
South Africa is faced with many complexities related to its water resources, therefore
making sound and comprehensive management a crucial requirement.
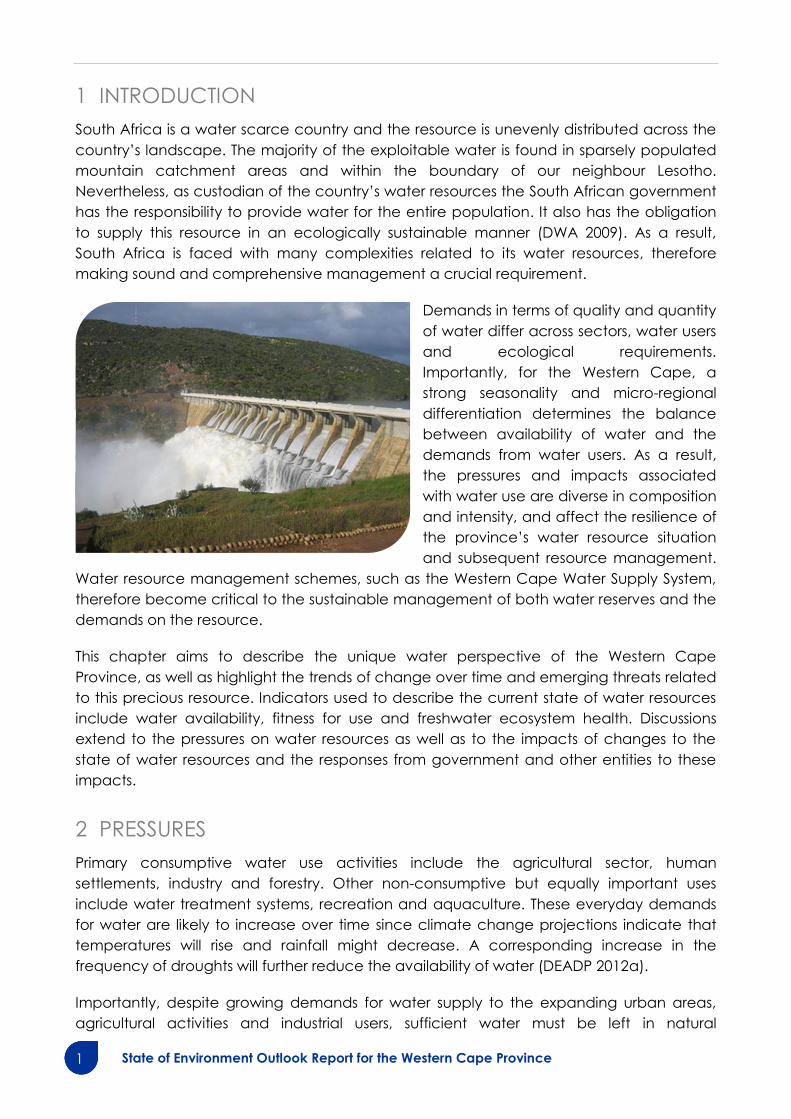
Demands in terms of quality and quantity
of water differ across sectors, water users
and ecological requirements.
Importantly, for the Western Cape, a
strong seasonality and micro-regional
differentiation determines the balance
between availability of water and the
demands from water users. As a result,
the pressures and impacts associated
with water use are diverse in composition
and intensity, and affect the resilience of
the province‟s water resource situation
and subsequent resource management.
Water resource management schemes, such as the Western Cape Water Supply System,
therefore become critical to the sustainable management of both water reserves and the
demands on the resource.
This chapter aims to describe the unique water perspective of the Western Cape
Province, as well as highlight the trends of change over time and emerging threats related
to this precious resource. Indicators used to describe the current state of water resources
include water availability, fitness for use and freshwater ecosystem health. Discussions
extend to the pressures on water resources as well as to the impacts of changes to the
state of water resources and the responses from government and other entities to these
impacts.
2 PRESSURES
Primary consumptive water use activities include the agricultural sector, human
settlements, industry and forestry. Other non-consumptive but equally important uses
include water treatment systems, recreation and aquaculture. These everyday demands
for water are likely to increase over time since climate change projections indicate that
temperatures will rise and rainfall might decrease. A corresponding increase in the
frequency of droughts will further reduce the availability of water (DEADP 2012a).
Importantly, despite growing demands for water supply to the expanding urban areas,
agricultural activities and industrial users, sufficient water must be left in natural

State of Environment Outlook Report for the Western Cape Province 2
watercourses to maintain their ecological integrity – the „ecological reserve‟. Furthermore,
the pollution of water resources leads to the degradation of ecosystems and the loss of
ecosystem services, health implications, increasing treatment costs and limits water use
based on quality requirements. These impacts are discussed under Section 4.
The resultant pressure on water resources will therefore require more investment in water
recovery, transfer schemes to balance water availability between catchments, the
intensification of irrigation schemes, as well as water conservation and demand
management. Increased utilisation of currently under-utilised groundwater reserves will
also become inevitable.
The primary activities associated with water use in the Western Cape are discussed in the
sub-sections below.
2.1 Agriculture
Agriculture, and in particular irrigated cultivation, is the country‟s largest water user,
utilising approximately 62% of the available water resources nationally (StatsSA 2010). The
state of the South African economy is strongly influenced by the state of the agricultural
sector and the country continues to have a very important role in regional food
Ecological Reserve
The National Water Act (36 of 1998) Chapter 3 Part 3 prescribes the calculation of a minimum
water reserve or ecological reserve as a mandatory requirement and benchmark for water use
management. In its most basic form, the reserve is defined as the amount of water required to
protect the aquatic ecosystem dependant on a particular water resource (river, stream, etc.) as
well as to supply basic human needs of water users.
Historically the Ecological Reserve was not considered in water resource management and
planning. Since 1998, it has been a legal requirement that the Reserve be determined for WMAs
and considered in all planning and management of water resources. In many cases setting an
ecological reserve as minimum requirement over and above the existing water uses effectively
took up any “spare” water use capacity, or in some cases even pushed the catchment into a
deficit situation. Such borderline or deficient balances indicate unsustainable abstraction
practise, which increases a dire need for management intervention and in possibly even water
use re-allocation. The Breede-Overberg region is a prime example, as it was always thought that
there was surplus water available in the system, and that additional large-scale irrigation
expansion or increased water transfers to the Berg WMA to supplement Cape Town‟s water
supply were possible. The latest draft of the Breede-Overberg Catchment Management
Agency‟s Catchment Management Strategy, however, found that based on current
information, a precautionary approach needs to be adopted in terms of the allocation of water
from the Breede. Until such time as the availability of water has been confirmed through an
updated Water Availability Assessment Study (WAAS), no further water allocations can be
made. This recommendation has been taken into consideration by DWA (National Water
Resource Planning), in terms of their programme for further studies on water availability
assessment.
Data source: NWA and DEADP 2012a

3 State of Environment Outlook Report for the Western Cape Province
production. This results in the availability of water resources for irrigation purposes being
extremely important.
The Western Cape mirrors this national norm, with agriculture as the most extensive land
use. Approximately 2.5 million ha are currently under cultivation, of which about 270 000ha
are under irrigation.
Agricultural potential can only be fully realised where climatic conditions are favourable
and water is available for irrigation. Where surface water is scarce, pressure is placed on
groundwater reserves to satisfy irrigation requirements. These groundwater reserves must
be pro-actively managed to ensure that recharge exceeds abstraction in order to realise
a sustainable level of utilisation of the resource.
Furthermore, agricultural activities rely heavily on pesticides and fertilisers. These contribute
to pollution of freshwater resources and soils through surface water runoff and seepage
containing high levels of phosphates and nitrates.
2.2 Human settlements
Water is one of the most basic requirements to sustain life. Human needs for water
resources relate to domestic use (e.g. drinking water, washing, cooking, recreation,
spiritual and aesthetic value), agriculture and industry. As such, access to water is a basic
human need. However, almost all human activities that require water results in the
degradation of this resource and associated ecosystems. This is a consequence of the
modification of natural surface water resources by channel and flow alterations, of
nutrient loading and of pollution.
2.2.1 Informal settlements
Informal settlements and backyard dwellers often have poor access to infrastructure and
services for electricity, water, solid waste and sanitation services. This lack of access to
services results in pollution of the surrounding environment, including nearby water courses
and stormwater systems, with solid waste, grey and black water. Polluted water is routed
into the stormwater drainage system in the absence of adequate drainage and sanitation
services, thereby creating a serious health risk. Natural dilution and ecological “scrubbing”
processes are not always sufficient to dilute the pollutant load and the polluted water

State of Environment Outlook Report for the Western Cape Province 4
then poses a risk to crop irrigation and a health risk to those making direct use of the river
water (e.g. for washing of clothes and other domestic chores). In addition, it becomes
difficult to service infrastructure where informal dwellings have been constructed above
access points to sewer lines (DEADP 2012a).
2.2.2 Urban and semi-urban settlements
The majority of the population in the Western Cape is found around the urban nodes. This
has resulted in landscape transformation that directly impacts on stream ecosystems. The
most noticeable impact is related to the increase of impervious surfaces within urban
catchments. It alters the hydrology and geomorphology of streams, resulting in increases
of runoff and pollution that reaches wetlands
and rivers, and ultimately the ocean, and limits
recharge of groundwater sources (DEADP
2005). Municipal and industrial discharges
further add to the levels of nutrients, metals,
pesticides and other contaminants entering
riparian systems. This nutrient loading results in
algal blooms, and alters water conditions
beyond their natural state, thereby
compromising the water dependant
ecological systems.
2.3 Invasive alien plants
Invasive alien plants are well known to use significant volumes of water, compared to
indigenous species. As a result, invasive alien plants also reduce the quantity of water
available for ecosystems and land-users. Invasive alien plants, both terrestrial and aquatic,
also impact on biodiversity by causing vegetation transformation and a reduction in
ecosystem services. This impacts on the economy as a result of management costs and
through losses to agriculture associated with reduced water resource availability and
quality (De Lange et al. 2012; Kotze, et al. 2010).
Invasive alien plants are thought to cover approximately 1.813 million condensed ha
nationally, with the highest concentrations found in the south-western, southern and
eastern coastal belts and the adjacent interior (Van Wilgen 2012). Therefore the impacts
of management and control of invasive alien plants on catchment water resources are
significant, and include native species loss,
increased biomass and fire intensity, increased
erosion, decreased river flows and detrimental
effects on water quality (Chamier 2012). The Breede
and Gouritz Water Management Area (WMA) are
identified as the worst affected areas in the Western
Cape. Priority areas include the upper reaches of
the Riviersonderend and Upper Breede in the Breede
WMA and the Goukou and Duiwenhoks catchments
in the Gouritz WMA (Le Maitre et al. 2000).
5 State of Environment Outlook Report for the Western Cape Province
For further information about the quantities of water utilised by alien invasive plants across
the province, refer to Section 3.1.4.
2.4 Forestry
Forestry covers approximately 88,000 ha of the province and accounts for a modest part
of the provincial economic base. Typically, small commercial plantations are located in
the mountainous catchment regions with high precipitation (>800mm)(DEADP 2012a).
According to the Berg, Breede, Gouritz and Olifants-Doorn Internal Strategic Perspectives
(2005) an estimated volume of 28 million m3/annum of water use is estimated to be
consumed for forestry activities. This is largely attributed to the use of non-indigenous
species for plantations. Species such as pines, gums and wattle require greater quantities
of water than indigenous afromontane type forests, and therefore result in stream flow
reductions greater than that which would be experienced from indigenous local species.
2.5 Aquaculture
Aquaculture is an emerging industry in the province, and production figures indicate a
significant growth between 2006 – 2010, recording an increase of 234.65 tons or 11.6%
(DAFF 2011). According to the Draft Western Cape Aquaculture Market Analysis and
Development Programme/Strategy (2012), the aquaculture sector in the Western Cape is
realistically projected to grow a hundredfold within the following ten to fifteen years. On
the one hand, this projection is good for trade and industry as job creation and sector
growth is stimulated, but on the other hand, various impacts related to aquaculture have
already proven to be problematic in affected catchments. For example, the impacts of
aquaculture species on indigenous biota are either on a primary competitor level
(competing for foods) and/or a predator level (preying on indigenous species).
Furthermore, species such as bass and carp impacts on water resource clarity when
promoting increased levels of turbidity and thereby degrading the natural habitat of
wetlands and rivers (RHP 2006).
Trout is the most cultured freshwater species in South Africa, followed by the culturing of
Ornamental species. The freshwater species cultured in 2010 included trout
(Oncorhynchus mykiss and Salmo trutta), tilapia (Oreochromis mossambicus), catfish
(Clarias gariepinus), carp (Cyprinus carpio and Ctenopharyngodon idella), mullet (Liza
richardsonii), largemouth bass (Micropterus salmoides), Marron crayfish (Cherax
tenuimanus), Atlantic salmon (Salmo salar) and a number of ornamental species (DAFF
2011).
3 STATE
To facilitate water resources management, South Africa
is divided into 19 Water Management Areas (WMAs), as
shown in Figure 1. In turn, these WMA‟s are managed by
9 catchment management agencies (CMAs) with the
goal of progressively decentralising national
management and realising the National Water Act‟s
Tracked indicators of status of Inland
Water:
Quantity of water available
Quality of the available water
resources
Health of freshwater ecosystems
State of Environment Outlook Report for the Western Cape Province 6
integrated water resource management ethos.
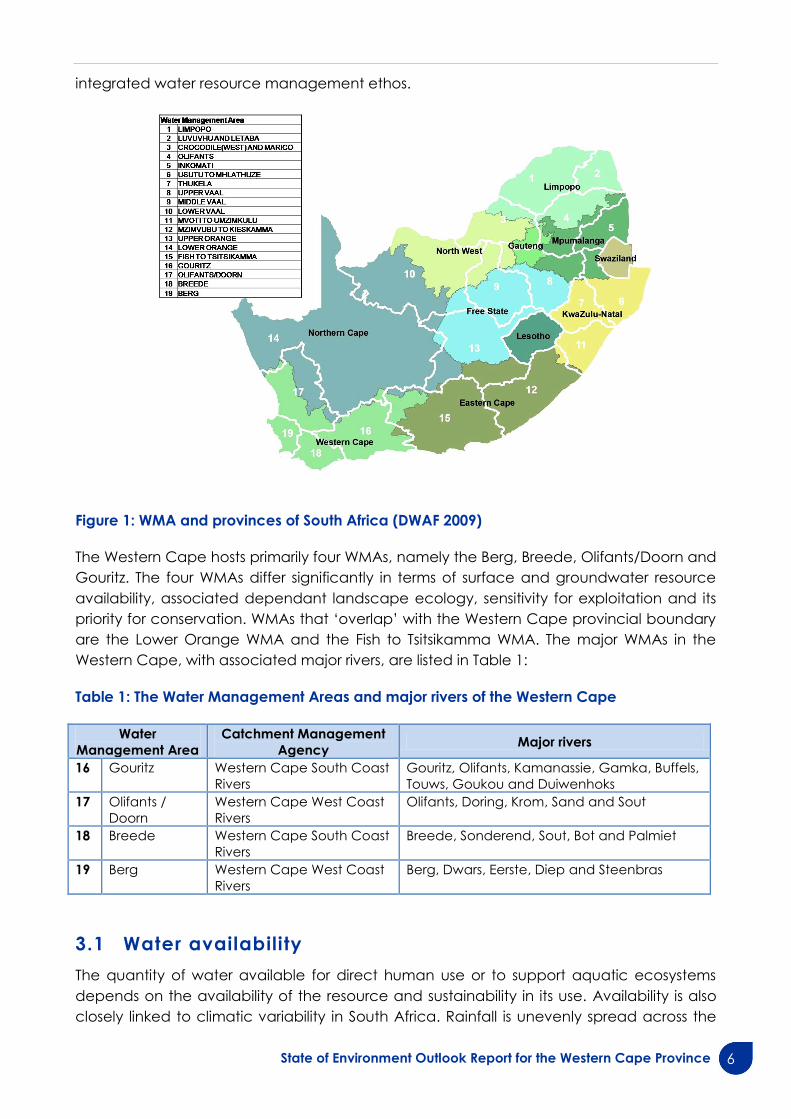
Figure 1: WMA and provinces of South Africa (DWAF 2009)
The Western Cape hosts primarily four WMAs, namely the Berg, Breede, Olifants/Doorn and
Gouritz. The four WMAs differ significantly in terms of surface and groundwater resource
availability, associated dependant landscape ecology, sensitivity for exploitation and its
priority for conservation. WMAs that „overlap‟ with the Western Cape provincial boundary
are the Lower Orange WMA and the Fish to Tsitsikamma WMA. The major WMAs in the
Western Cape, with associated major rivers, are listed in Table 1:
Table 1: The Water Management Areas and major rivers of the Western Cape
Water
Management Area
Catchment Management
Agency Major rivers
16 Gouritz Western Cape South Coast
Rivers
Gouritz, Olifants, Kamanassie, Gamka, Buffels,
Touws, Goukou and Duiwenhoks
17 Olifants /
Doorn
Western Cape West Coast
Rivers
Olifants, Doring, Krom, Sand and Sout
18 Breede Western Cape South Coast
Rivers
Breede, Sonderend, Sout, Bot and Palmiet
19 Berg Western Cape West Coast
Rivers
Berg, Dwars, Eerste, Diep and Steenbras
3.1 Water availability
The quantity of water available for direct human use or to support aquatic ecosystems
depends on the availability of the resource and sustainability in its use. Availability is also
closely linked to climatic variability in South Africa. Rainfall is unevenly spread across the
7 State of Environment Outlook Report for the Western Cape Province
country‟s catchments, with most of the northern and western regions of the country
receiving less rainfall. These areas are therefore semi-arid, including the north-western and
inland areas of the Western Cape. A further aspect that adds complexity to managing
South Africa‟s water resources is the seasonality of rainfall patterns and subsequent runoff,
particularly in the Western Cape where high winter rainfall is contrasted with much less
precipitation during summer.
3.1.1 Surface water resources
Surface water, originating mainly from rivers and dams, is our primary source of water. In
order to effectively manage and allocate this water for use, it is important to be able to
quantify how much is available. The Western Cape Water Supply System (WCWSS) serves
to manage surface water resources in order to supply the City of Cape Town, surrounding
urban centres and agricultural areas‟ water demands. The system consists of infrastructure
components owned and operated by the City of Cape Town, Trans Caledon Tunnel
Authority and the Department of Water Affairs.
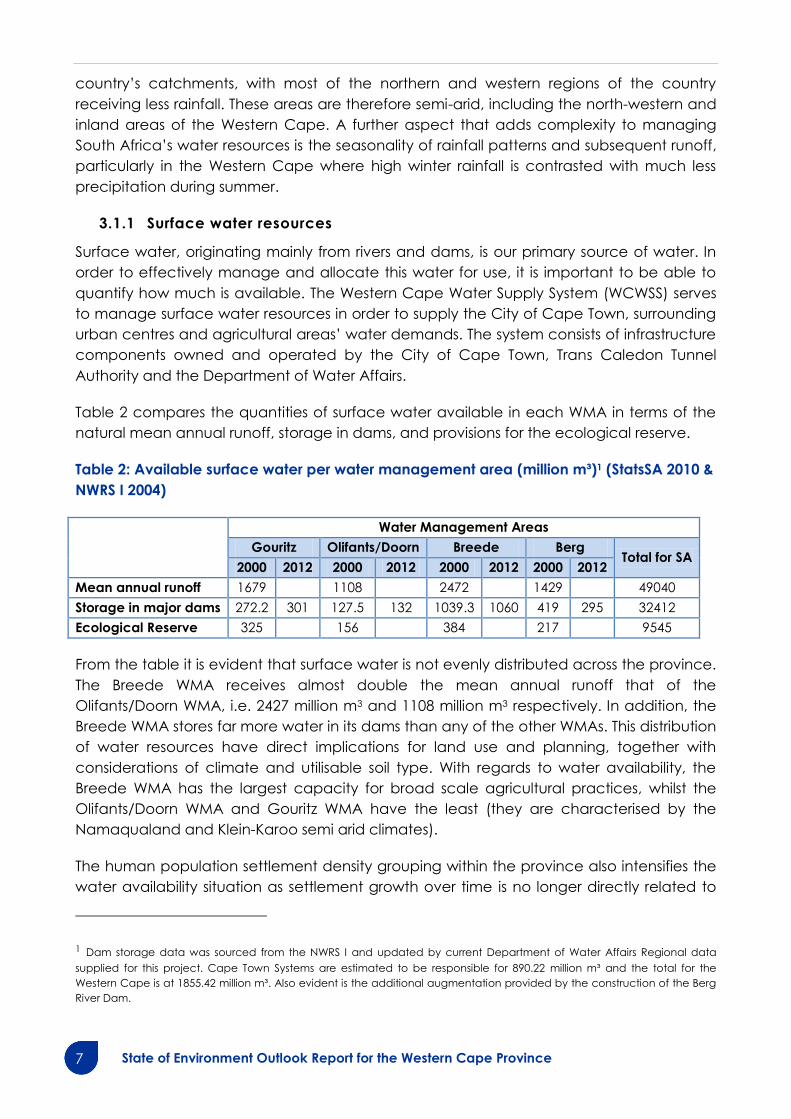
Table 2 compares the quantities of surface water available in each WMA in terms of the
natural mean annual runoff, storage in dams, and provisions for the ecological reserve.
Table 2: Available surface water per water management area (million m³)1 (StatsSA 2010 &
NWRS I 2004)
Water Management Areas
Gouritz Olifants/Doorn Breede Berg Total for SA
2000 2012 2000 2012 2000 2012 2000 2012
Mean annual runoff 1679 1108 2472 1429 49040
Storage in major dams 272.2 301 127.5 132 1039.3 1060 419 295 32412
Ecological Reserve 325 156 384 217 9545
From the table it is evident that surface water is not evenly distributed across the province.
The Breede WMA receives almost double the mean annual runoff that of the
Olifants/Doorn WMA, i.e. 2427 million m3 and 1108 million m3 respectively. In addition, the
Breede WMA stores far more water in its dams than any of the other WMAs. This distribution
of water resources have direct implications for land use and planning, together with
considerations of climate and utilisable soil type. With regards to water availability, the
Breede WMA has the largest capacity for broad scale agricultural practices, whilst the
Olifants/Doorn WMA and Gouritz WMA have the least (they are characterised by the
Namaqualand and Klein-Karoo semi arid climates).
The human population settlement density grouping within the province also intensifies the
water availability situation as settlement growth over time is no longer directly related to
1 Dam storage data was sourced from the NWRS I and updated by current Department of Water Affairs Regional data
supplied for this project. Cape Town Systems are estimated to be responsible for 890.22 million m³ and the total for the
Western Cape is at 1855.42 million m³. Also evident is the additional augmentation provided by the construction of the Berg
River Dam.
State of Environment Outlook Report for the Western Cape Province 8
the spatial distribution of available water. Most of the province‟s population is found within
the urban nodes, generally distributed around significant trade and port centres, and in
particular the Cape Town metropolitan area. The Cape Town water systems are estimated
to provide for only 890.22 million m³ of water resources, with inter-basin transfers from the
Breede WMA providing additional water to the area. Therefore careful consideration is
needed where water use is concerned.
It is also important to note that the limits to the development of surface water sources
have been reached in most places, and the opportunities for the economically feasible
placement of new dams are few (DWA 2010b). The costs of transfers to locations where
water is needed are also rising with increasing distances and rising costs of pumping and
associated infrastructure. Despite this, a new dam may need to be constructed in order to
meet water demands in the Western Cape region by 2019.
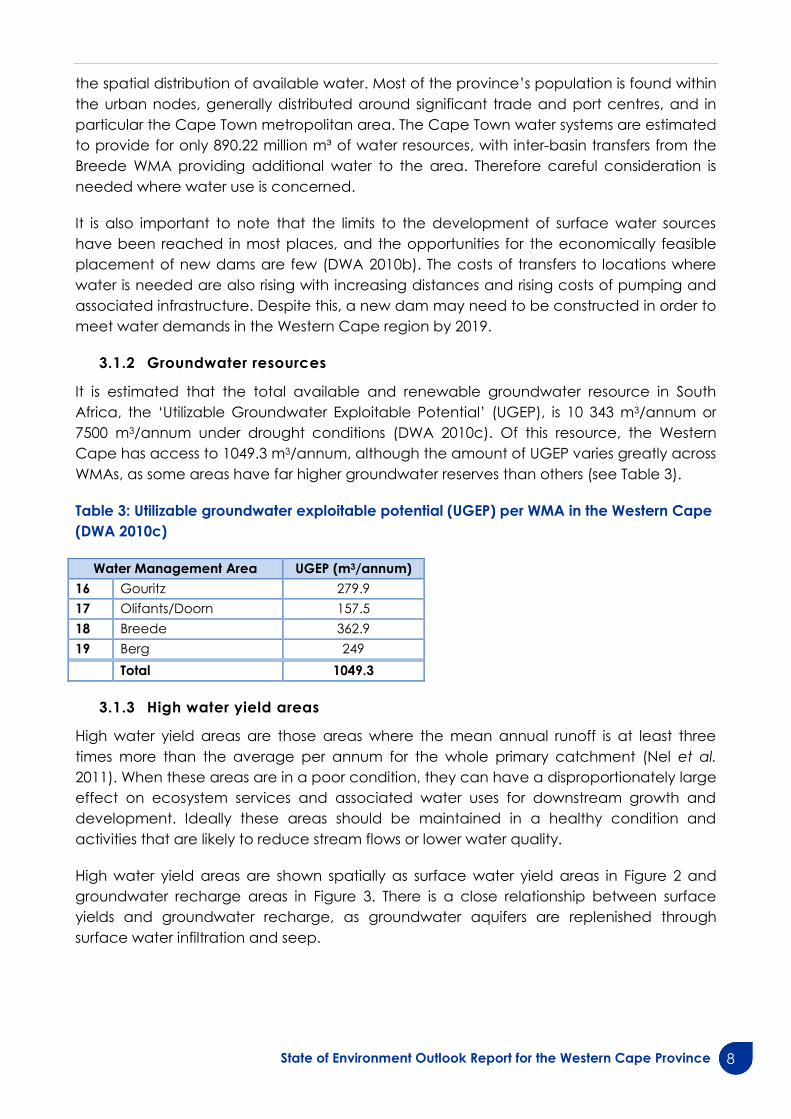
3.1.2 Groundwater resources
It is estimated that the total available and renewable groundwater resource in South
Africa, the „Utilizable Groundwater Exploitable Potential‟ (UGEP), is 10 343 m3/annum or
7500 m3/annum under drought conditions (DWA 2010c). Of this resource, the Western
Cape has access to 1049.3 m3/annum, although the amount of UGEP varies greatly across
WMAs, as some areas have far higher groundwater reserves than others (see Table 3).
Table 3: Utilizable groundwater exploitable potential (UGEP) per WMA in the Western Cape
(DWA 2010c)
Water Management Area UGEP (m3/annum)
16 Gouritz 279.9
17 Olifants/Doorn 157.5
18 Breede 362.9
19 Berg 249
Total 1049.3
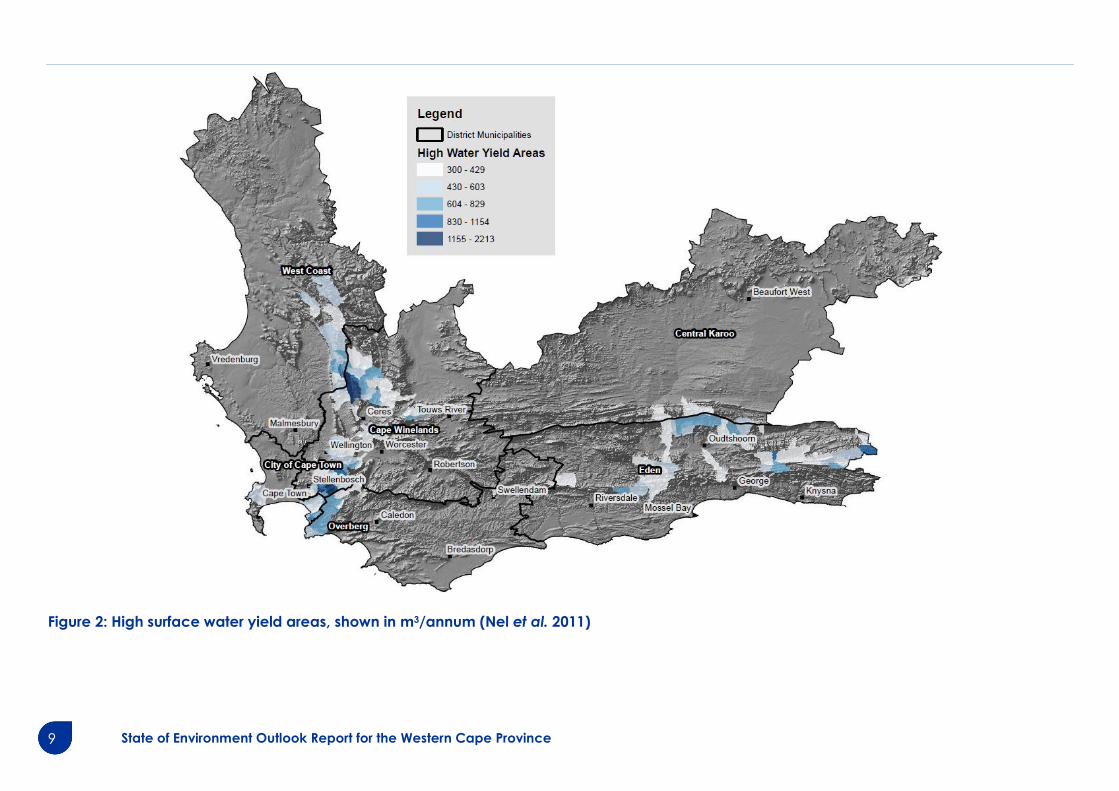
3.1.3 High water yield areas
High water yield areas are those areas where the mean annual runoff is at least three
times more than the average per annum for the whole primary catchment (Nel et al.
2011). When these areas are in a poor condition, they can have a disproportionately large
effect on ecosystem services and associated water uses for downstream growth and
development. Ideally these areas should be maintained in a healthy condition and
activities that are likely to reduce stream flows or lower water quality.
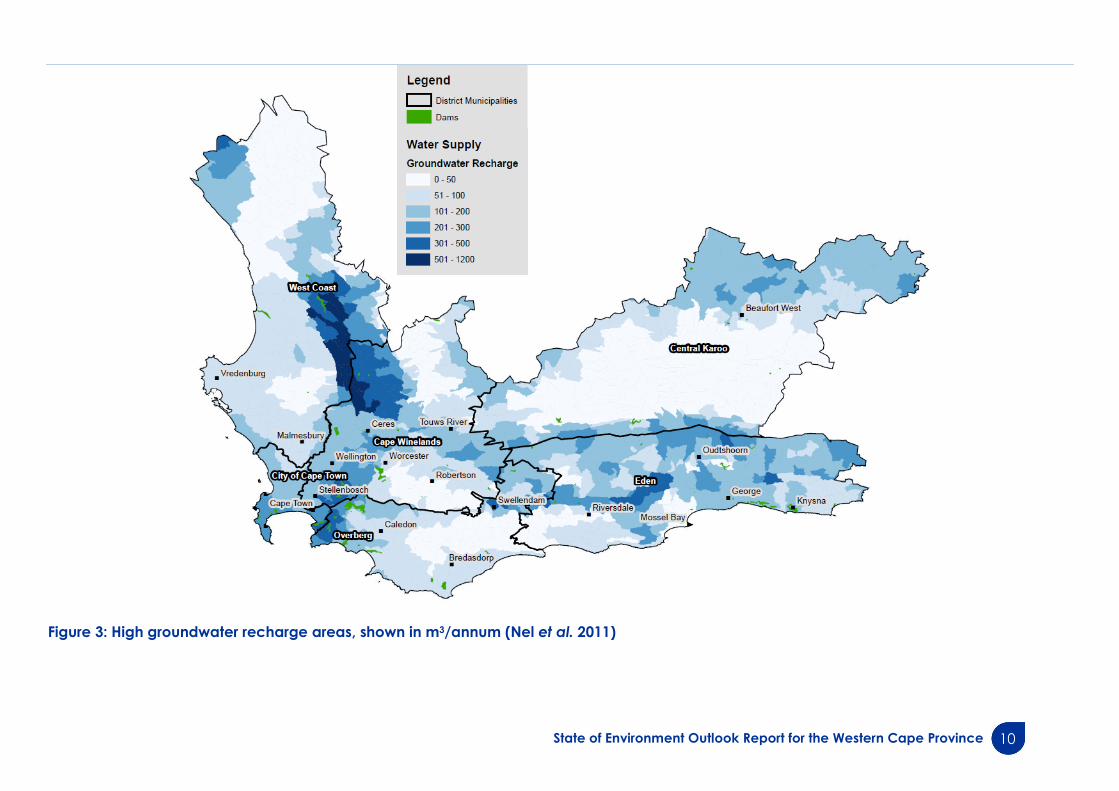
High water yield areas are shown spatially as surface water yield areas in Figure 2 and
groundwater recharge areas in Figure 3. There is a close relationship between surface
yields and groundwater recharge, as groundwater aquifers are replenished through
surface water infiltration and seep.
9 State of Environment Outlook Report for the Western Cape Province
Figure 2: High surface water yield areas, shown in m3/annum (Nel et al. 2011)
State of Environment Outlook Report for the Western Cape Province 10
Figure 3: High groundwater recharge areas, shown in m3/annum (Nel et al. 2011)
11 State of Environment Outlook Report for the Western Cape Province
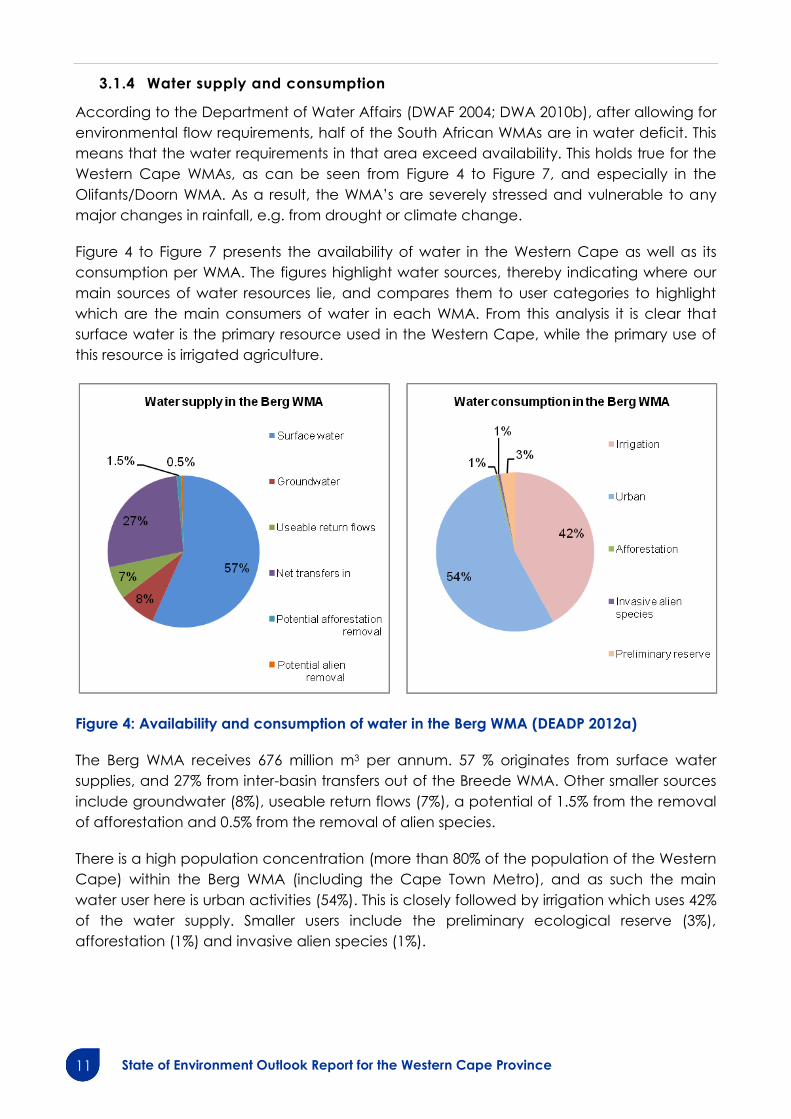
3.1.4 Water supply and consumption
According to the Department of Water Affairs (DWAF 2004; DWA 2010b), after allowing for
environmental flow requirements, half of the South African WMAs are in water deficit. This
means that the water requirements in that area exceed availability. This holds true for the
Western Cape WMAs, as can be seen from Figure 4 to Figure 7, and especially in the
Olifants/Doorn WMA. As a result, the WMA‟s are severely stressed and vulnerable to any
major changes in rainfall, e.g. from drought or climate change.
Figure 4 to Figure 7 presents the availability of water in the Western Cape as well as its
consumption per WMA. The figures highlight water sources, thereby indicating where our
main sources of water resources lie, and compares them to user categories to highlight
which are the main consumers of water in each WMA. From this analysis it is clear that
surface water is the primary resource used in the Western Cape, while the primary use of
this resource is irrigated agriculture.
Figure 4: Availability and consumption of water in the Berg WMA (DEADP 2012a)
The Berg WMA receives 676 million m3 per annum. 57 % originates from surface water
supplies, and 27% from inter-basin transfers out of the Breede WMA. Other smaller sources
include groundwater (8%), useable return flows (7%), a potential of 1.5% from the removal
of afforestation and 0.5% from the removal of alien species.
There is a high population concentration (more than 80% of the population of the Western
Cape) within the Berg WMA (including the Cape Town Metro), and as such the main
water user here is urban activities (54%). This is closely followed by irrigation which uses 42%
of the water supply. Smaller users include the preliminary ecological reserve (3%),
afforestation (1%) and invasive alien species (1%).
State of Environment Outlook Report for the Western Cape Province 12
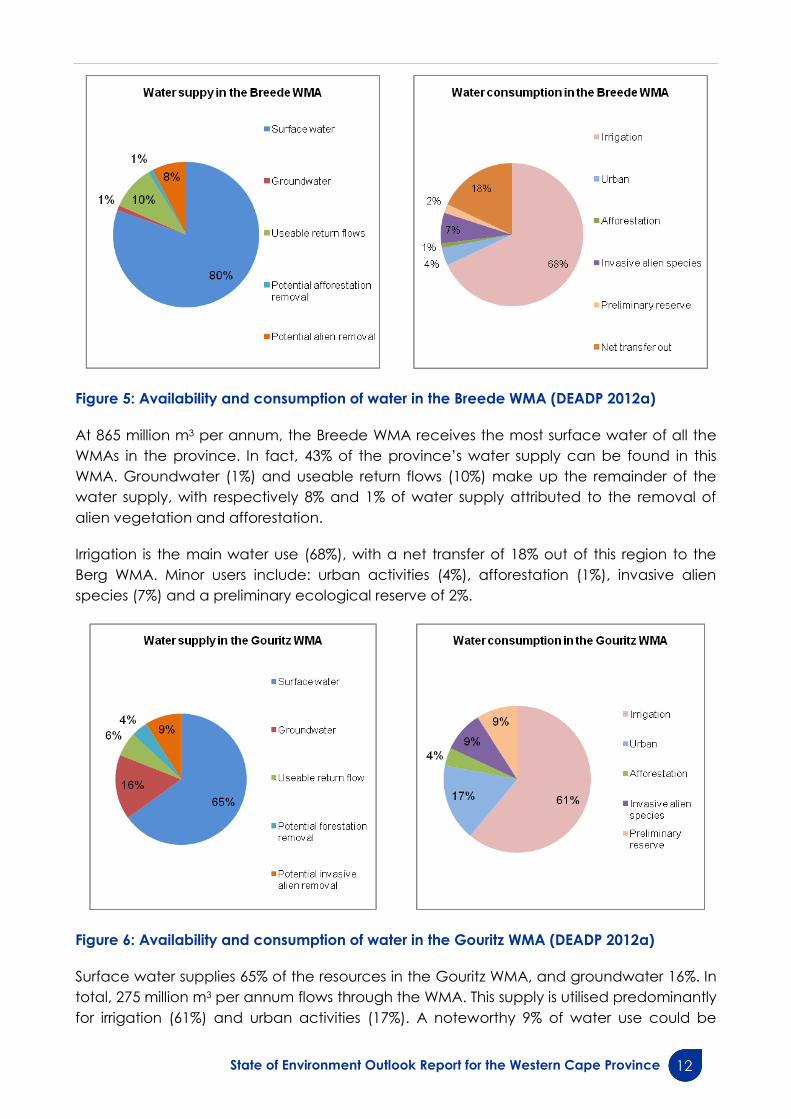
Figure 5: Availability and consumption of water in the Breede WMA (DEADP 2012a)
At 865 million m3 per annum, the Breede WMA receives the most surface water of all the
WMAs in the province. In fact, 43% of the province‟s water supply can be found in this
WMA. Groundwater (1%) and useable return flows (10%) make up the remainder of the
water supply, with respectively 8% and 1% of water supply attributed to the removal of
alien vegetation and afforestation.
Irrigation is the main water use (68%), with a net transfer of 18% out of this region to the
Berg WMA. Minor users include: urban activities (4%), afforestation (1%), invasive alien
species (7%) and a preliminary ecological reserve of 2%.
Figure 6: Availability and consumption of water in the Gouritz WMA (DEADP 2012a)
Surface water supplies 65% of the resources in the Gouritz WMA, and groundwater 16%. In
total, 275 million m3 per annum flows through the WMA. This supply is utilised predominantly
for irrigation (61%) and urban activities (17%). A noteworthy 9% of water use could be
13 State of Environment Outlook Report for the Western Cape Province
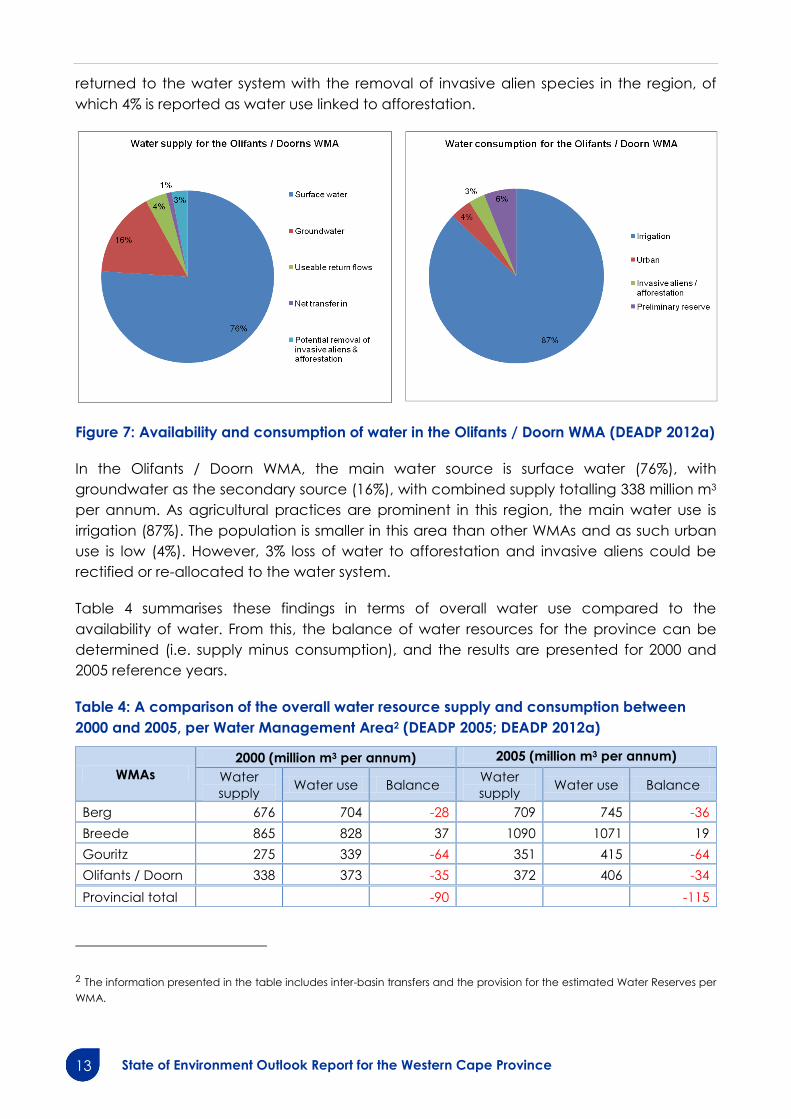
returned to the water system with the removal of invasive alien species in the region, of
which 4% is reported as water use linked to afforestation.
Figure 7: Availability and consumption of water in the Olifants / Doorn WMA (DEADP 2012a)
In the Olifants / Doorn WMA, the main water source is surface water (76%), with
groundwater as the secondary source (16%), with combined supply totalling 338 million m3
per annum. As agricultural practices are prominent in this region, the main water use is
irrigation (87%). The population is smaller in this area than other WMAs and as such urban
use is low (4%). However, 3% loss of water to afforestation and invasive aliens could be
rectified or re-allocated to the water system.
Table 4 summarises these findings in terms of overall water use compared to the
availability of water. From this, the balance of water resources for the province can be
determined (i.e. supply minus consumption), and the results are presented for 2000 and
2005 reference years.
Table 4: A comparison of the overall water resource supply and consumption between
2000 and 2005, per Water Management Area2 (DEADP 2005; DEADP 2012a)
WMAs
2000 (million m3 per annum) 2005 (million m3 per annum)
Water
supply Water use Balance
Water
supply Water use Balance
Berg 676 704 -28 709 745 -36
Breede 865 828 37 1090 1071 19
Gouritz 275 339 -64 351 415 -64
Olifants / Doorn 338 373 -35 372 406 -34
Provincial total
-90
-115
2 The information presented in the table includes inter-basin transfers and the provision for the estimated Water Reserves per
WMA.
State of Environment Outlook Report for the Western Cape Province 14
From the table it can be determined that despite the increase in water supply between
2000 and 2005, there are insufficient water resources available to meet the current
demands for the Province. All WMAs, except the Breede, are recorded with a negative
water balance as a result of overutilization.
3.2 Fitness for use
Water quality refers to the physical, chemical and biological characteristics of water with
regard to how suitable the water is for its intended use (DWA 2011b). According to the
NWA, water quality relates to all the aspects of a water resource, including in-stream flow
(quantity, pattern, timing, water level and assurance), natural water quality (physical,
chemical and biological characteristics), in-stream and riparian habitat (character and
condition) and aquatic biota (characteristics, condition and distribution).
Water resources that are rich in nutrients are referred to as eutrophic. This becomes a
problem in water bodies where the presence of excessive nutrients promotes the growth
of more algal plants than what can be accommodated by the rest of the ecological
system. This results in water quality deterioration, often to a level which cannot sustain
aquatic life. Eutrophication in South Africa is caused mainly by inadequately treated
sewerage effluents that are discharged into river systems. Other sources of high nutrient
loads resulting in eutrophication include industrial effluents, agriculture, households, and
urban and road surface runoff (Oberholster & Ashton 2008; Harding 2011).
It is important to note that not all water quality problems are from anthropogenic causes,
and in some areas of South Africa water quality is naturally unsuitable for human use.
There are some naturally saline river systems resulting from specific geological conditions,
for example the various „Sout‟ or „Brak‟ rivers in the Western Cape. These systems are
generally also associated with groundwater that has a salinity above the recommended
concentrations for human use. In these cases the salinity levels are natural and the
aquatic ecosystems adapted to the conditions.
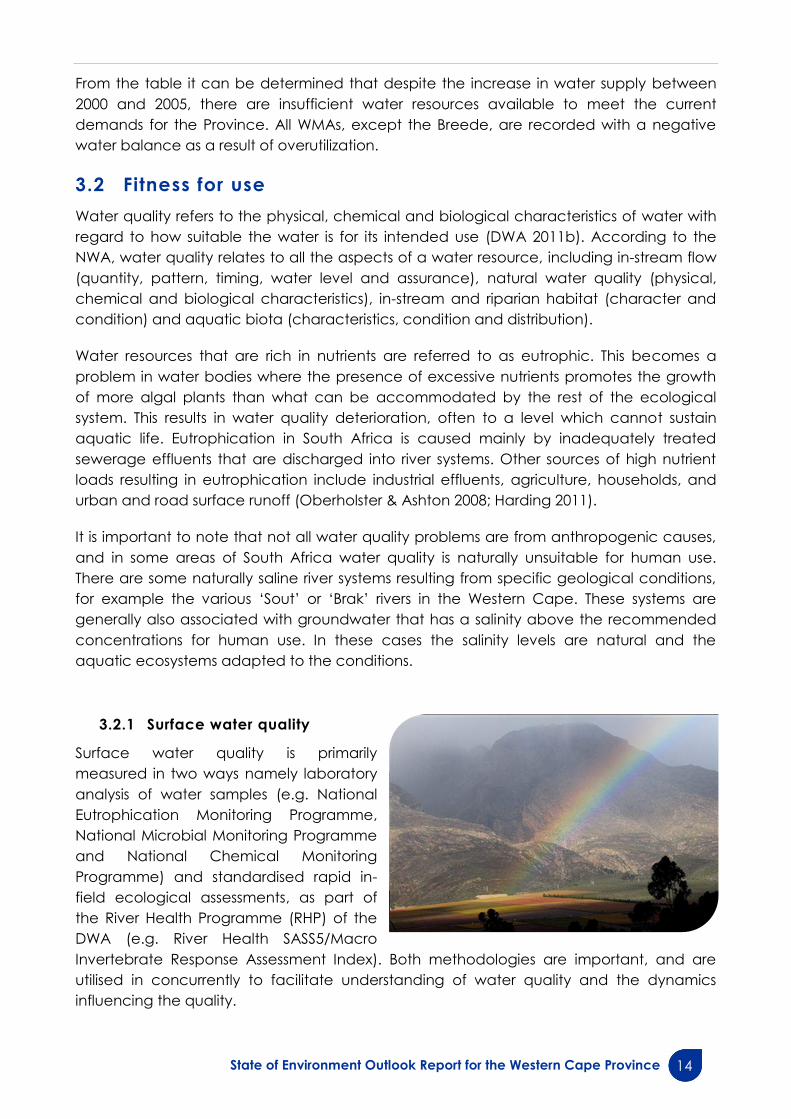
3.2.1 Surface water quality
Surface water quality is primarily
measured in two ways namely laboratory
analysis of water samples (e.g. National
Eutrophication Monitoring Programme,
National Microbial Monitoring Programme
and National Chemical Monitoring
Programme) and standardised rapid in-
field ecological assessments, as part of
the River Health Programme (RHP) of the
DWA (e.g. River Health SASS5/Macro
Invertebrate Response Assessment Index). Both methodologies are important, and are
utilised in concurrently to facilitate understanding of water quality and the dynamics
influencing the quality.
15 State of Environment Outlook Report for the Western Cape Province
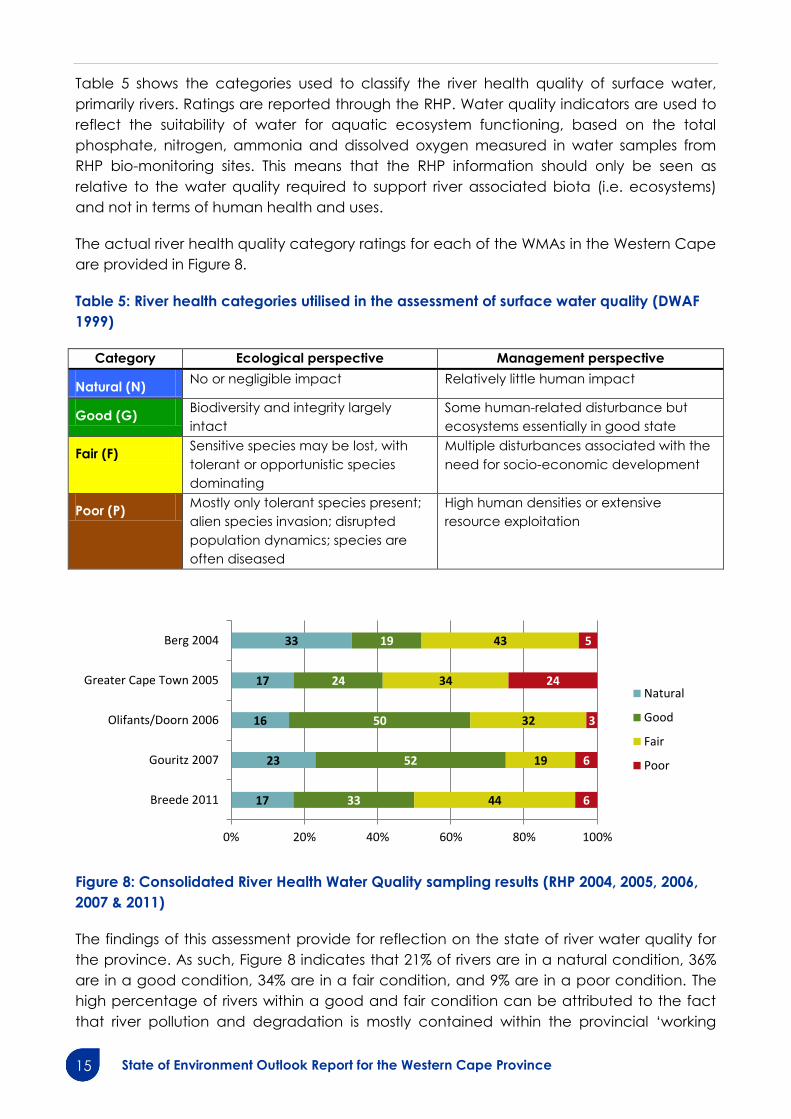
Table 5 shows the categories used to classify the river health quality of surface water,
primarily rivers. Ratings are reported through the RHP. Water quality indicators are used to
reflect the suitability of water for aquatic ecosystem functioning, based on the total
phosphate, nitrogen, ammonia and dissolved oxygen measured in water samples from
RHP bio-monitoring sites. This means that the RHP information should only be seen as
relative to the water quality required to support river associated biota (i.e. ecosystems)
and not in terms of human health and uses.
The actual river health quality category ratings for each of the WMAs in the Western Cape
are provided in Figure 8.
Table 5: River health categories utilised in the assessment of surface water quality (DWAF
1999)
Category Ecological perspective Management perspective
Natural (N) No or negligible impact Relatively little human impact
Good (G) Biodiversity and integrity largely
intact
Some human-related disturbance but
ecosystems essentially in good state
Fair (F) Sensitive species may be lost, with
tolerant or opportunistic species
dominating
Multiple disturbances associated with the
need for socio-economic development
Poor (P) Mostly only tolerant species present;
alien species invasion; disrupted
population dynamics; species are
often diseased
High human densities or extensive
resource exploitation
Figure 8: Consolidated River Health Water Quality sampling results (RHP 2004, 2005, 2006,
2007 & 2011)
The findings of this assessment provide for reflection on the state of river water quality for
the province. As such, Figure 8 indicates that 21% of rivers are in a natural condition, 36%
are in a good condition, 34% are in a fair condition, and 9% are in a poor condition. The
high percentage of rivers within a good and fair condition can be attributed to the fact
that river pollution and degradation is mostly contained within the provincial „working
17
23
16
17
33
33
52
50
24
19
44
19
32
34
43
6
6
3
24
5
0% 20% 40% 60% 80% 100%
Breede 2011
Gouritz 2007
Olifants/Doorn 2006
Greater Cape Town 2005
Berg 2004
Natural
Good
Fair
Poor

State of Environment Outlook Report for the Western Cape Province 16
rivers‟, and is not found to any great extent across the provincial riparian areas. Most rivers
found across the province are therefore found to be in an ecologically good state and as
a result can support diverse ecosystems with their integrity largely intact.
It should be noted that these results are not a complete reflection of water quality across
the province as condition can vary quite dramatically within catchments. It should be
considered in conjunction with the ecological status of rivers as displayed in Figure 10. A
case in point is the introduction of an „unacceptable‟ category in the State of Rivers
Report for the Greater Cape Town Rivers to highlight the poor state of certain sections of
highly transformed rivers.
The National Eutrophication Monitoring Programme by the DWA also collects data on the
trophic status of a number of large dams in South Africa. Of grave concern is that all the
dams have been classified with a serious (>0.13 mean annual TP mg/l) or significant
(0.047<x≥0.13 mean annual TP mg/l) risk of algal productivity. It includes the
Theewaterskloof Dam which is a major water source for the City of Cape Town. Typically
the risk is associated with high nutrient loads from contaminated surface runoff or water
discharges.
3.2.2 Groundwater quality
Despite groundwater pollution and over-abstraction being serious problems in certain
parts of South Africa, the Western Cape has only localised threats of over-abstraction,
predominantly in farming areas. There are also numerous areas where the quality of water
is not good enough for the water to be usable due natural salinisation processes. Further
causes of deteriorating groundwater quality can be attributed to diverse sources in
sectors such as industrial activities, effluent from municipal wastewater treatment works,
stormwater runoff from urban and especially informal settlements (where adequate
sanitation facilities are often lacking), return flows from irrigated areas, effluent discharge
from industries and various other sources (DWA 2010c).
3.3 Freshwater ecosystem health
Freshwater ecosystem health or aquatic ecosystem health refers to the condition or
„resource quality‟ of surface water resources. This includes its fauna and flora within the in-
stream, wetland and riparian habitats (Karr 1999). Aquatic ecosystem health status is
measured by its ecosystem state through a process termed EcoClassification, or bio-
monitoring in practice. Over the last 15 years, the development and refinement of the
National Ecosystem Health Monitoring Programme standardised bio-monitoring indices
(WET-Health, Estuary-Health and River-Health) has led to an ever more accurate
understanding of the dynamics and value of the economic, social and ecological needs
of water resources.
3.3.1 River health indicators of ecological change
The RHP aims to assess the health of rivers based on the response of biota (instream and
riparian) to human influences that change habitat integrity (e.g. hydrology,
geomorphology and chemical variables) (Kleynhans et al. 2005). These assessments are
scored in terms of Present Ecological State (PES) classes (A-F) which provides an

17 State of Environment Outlook Report for the Western Cape Province
ecological and management perspective of river health (Natural to Poor), although an
„unacceptable‟ category was added to report on water quality in the Greater Cape
Town rivers (RHP 2005).
The results of the RHP provide a very good indication of our human use impacts as well as
the value of our management actions to secure our water resources for future generations
(i.e. the Water Reserve).
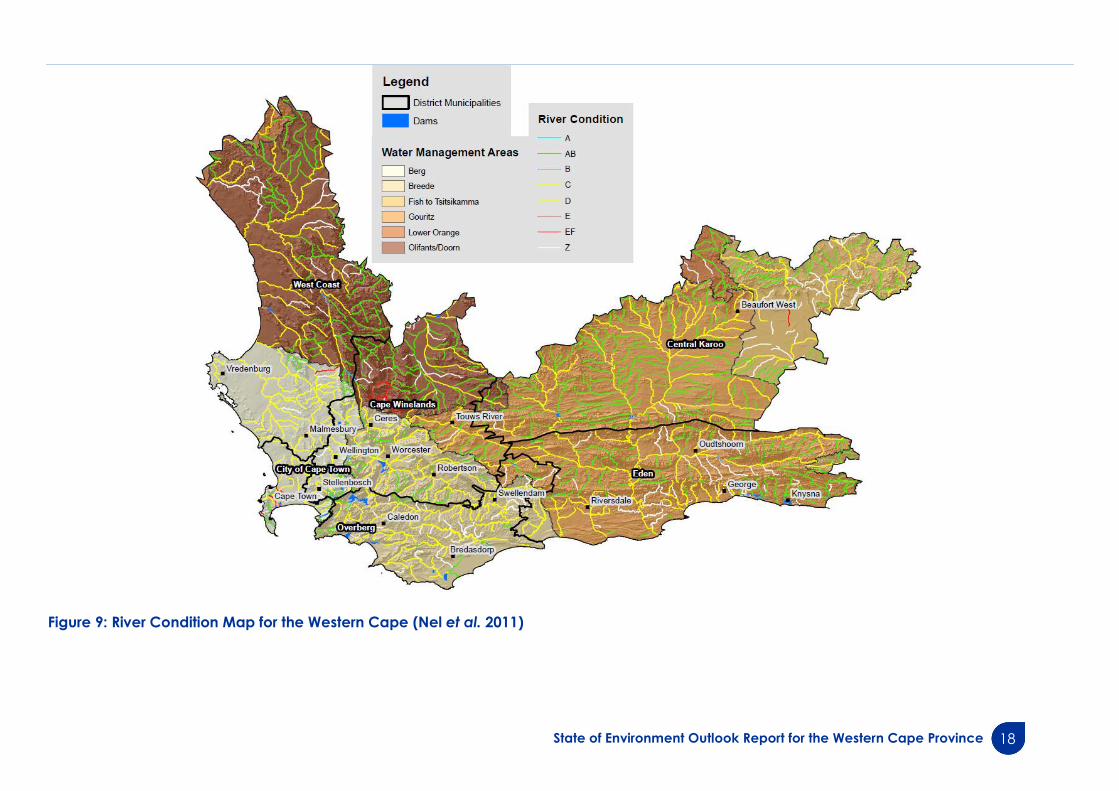
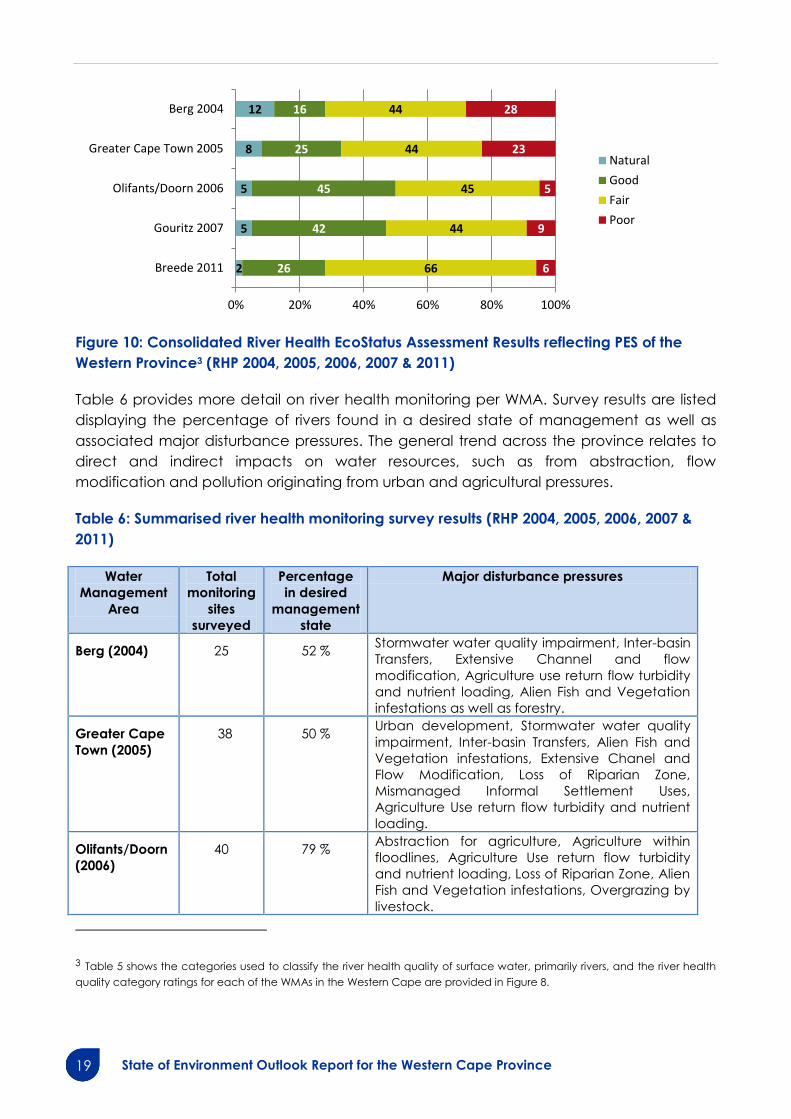
The EcoStatus bar graph for the Western Cape (Figure 10) combines all River Health
indices (SASS5, RVI, IHI, FI and GI) and is compiled from RHP assessments undertaken for
the four major WMA‟s of the Western Cape. The findings of this assessment provides a
reflection of the state of surface water resource health for the province where only 6% of
rivers are in a natural condition, 30% are in a good condition, 48% are in a fair condition
and where 14% are in a poor condition. The results are also shown in terms of spatial
distribution as Figure 9.
The findings are typical, as land-uses in the upper catchment areas are generally forestry
and conservation based which result in mountain catchment protection areas classed as
natural or good. Where rivers are used for agriculture and land development, a
cumulative impact progressively increases the deterioration status of surface water
resources as one gets closer to the coast. In addition, the influence of significant urban
development of the greater Cape Town area can be seen to reflect in the Berg River
assessment results that display a significantly poorer water resource quality.
State of Environment Outlook Report for the Western Cape Province 18
Figure 9: River Condition Map for the Western Cape (Nel et al. 2011)
19 State of Environment Outlook Report for the Western Cape Province
Figure 10: Consolidated River Health EcoStatus Assessment Results reflecting PES of the
Western Province3 (RHP 2004, 2005, 2006, 2007 & 2011)
Table 6 provides more detail on river health monitoring per WMA. Survey results are listed
displaying the percentage of rivers found in a desired state of management as well as
associated major disturbance pressures. The general trend across the province relates to
direct and indirect impacts on water resources, such as from abstraction, flow
modification and pollution originating from urban and agricultural pressures.
Table 6: Summarised river health monitoring survey results (RHP 2004, 2005, 2006, 2007 &
2011)
Water
Management
Area
Total
monitoring
sites
surveyed
Percentage
in desired
management
state
Major disturbance pressures
Berg (2004) 25 52 % Stormwater water quality impairment, Inter-basin
Transfers, Extensive Channel and flow
modification, Agriculture use return flow turbidity
and nutrient loading, Alien Fish and Vegetation
infestations as well as forestry.
Greater Cape
Town (2005)
38 50 % Urban development, Stormwater water quality
impairment, Inter-basin Transfers, Alien Fish and
Vegetation infestations, Extensive Chanel and
Flow Modification, Loss of Riparian Zone,
Mismanaged Informal Settlement Uses,
Agriculture Use return flow turbidity and nutrient
loading.
Olifants/Doorn
(2006)
40 79 % Abstraction for agriculture, Agriculture within
floodlines, Agriculture Use return flow turbidity
and nutrient loading, Loss of Riparian Zone, Alien
Fish and Vegetation infestations, Overgrazing by
livestock.
3 Table 5 shows the categories used to classify the river health quality of surface water, primarily rivers, and the river health
quality category ratings for each of the WMAs in the Western Cape are provided in Figure 8.
2
5
5
8
12
26
42
45
25
16
66
44
45
44
44
6
9
5
23
28
0% 20% 40% 60% 80% 100%
Breede 2011
Gouritz 2007
Olifants/Doorn 2006
Greater Cape Town 2005
Berg 2004
Natural
Good
Fair
Poor
State of Environment Outlook Report for the Western Cape Province 20
Water
Management
Area
Total
monitoring
sites
surveyed
Percentage
in desired
management
state
Major disturbance pressures
Gouritz (2007) 69 39 % Extensive abstraction use, Agriculture within
floodlines, Channel and flow modification,
Nutrient Enrichment from agriculture return flows.
Breede (2011) 82 68 % Inter-basin Transfers, Loss of Riparian Zone,
Channel and flow modification, Alien Fish and
Vegetation infestations, Alien tree induced
flooding, Agriculture use return flow turbidity and
nutrient loading.
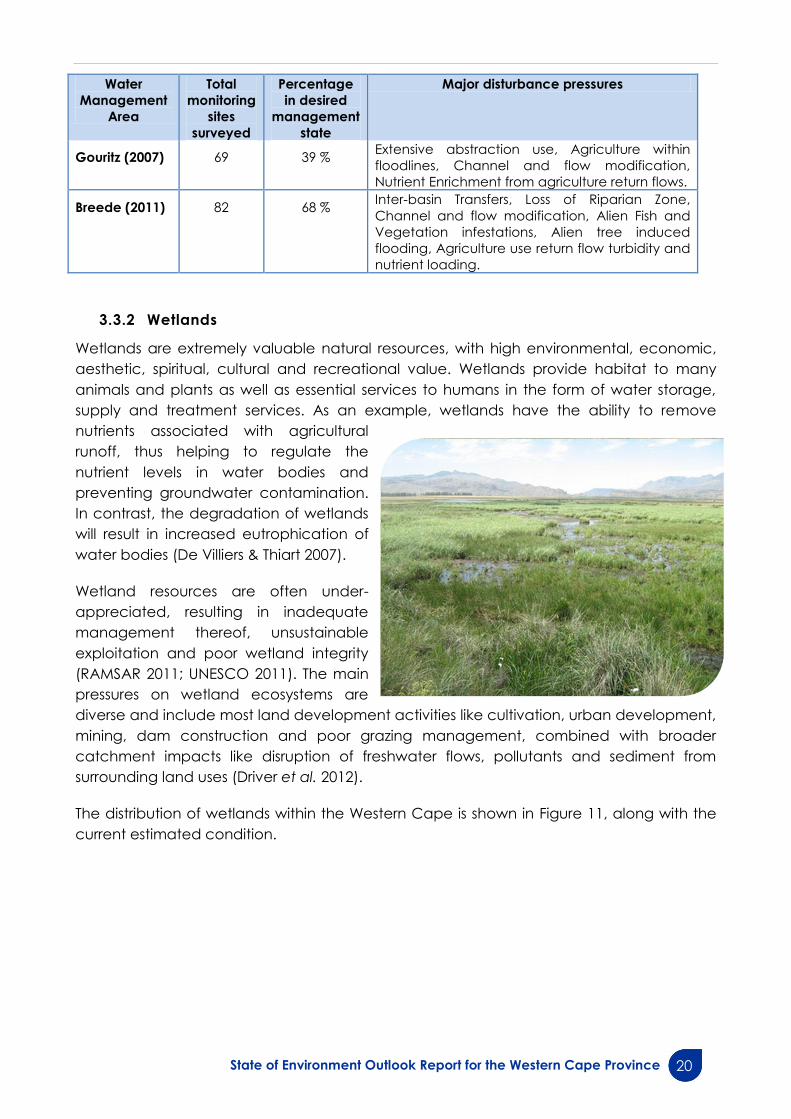
3.3.2 Wetlands
Wetlands are extremely valuable natural resources, with high environmental, economic,
aesthetic, spiritual, cultural and recreational value. Wetlands provide habitat to many
animals and plants as well as essential services to humans in the form of water storage,
supply and treatment services. As an example, wetlands have the ability to remove
nutrients associated with agricultural
runoff, thus helping to regulate the
nutrient levels in water bodies and
preventing groundwater contamination.
In contrast, the degradation of wetlands
will result in increased eutrophication of
water bodies (De Villiers & Thiart 2007).
Wetland resources are often under-
appreciated, resulting in inadequate
management thereof, unsustainable
exploitation and poor wetland integrity
(RAMSAR 2011; UNESCO 2011). The main
pressures on wetland ecosystems are
diverse and include most land development activities like cultivation, urban development,
mining, dam construction and poor grazing management, combined with broader
catchment impacts like disruption of freshwater flows, pollutants and sediment from
surrounding land uses (Driver et al. 2012).
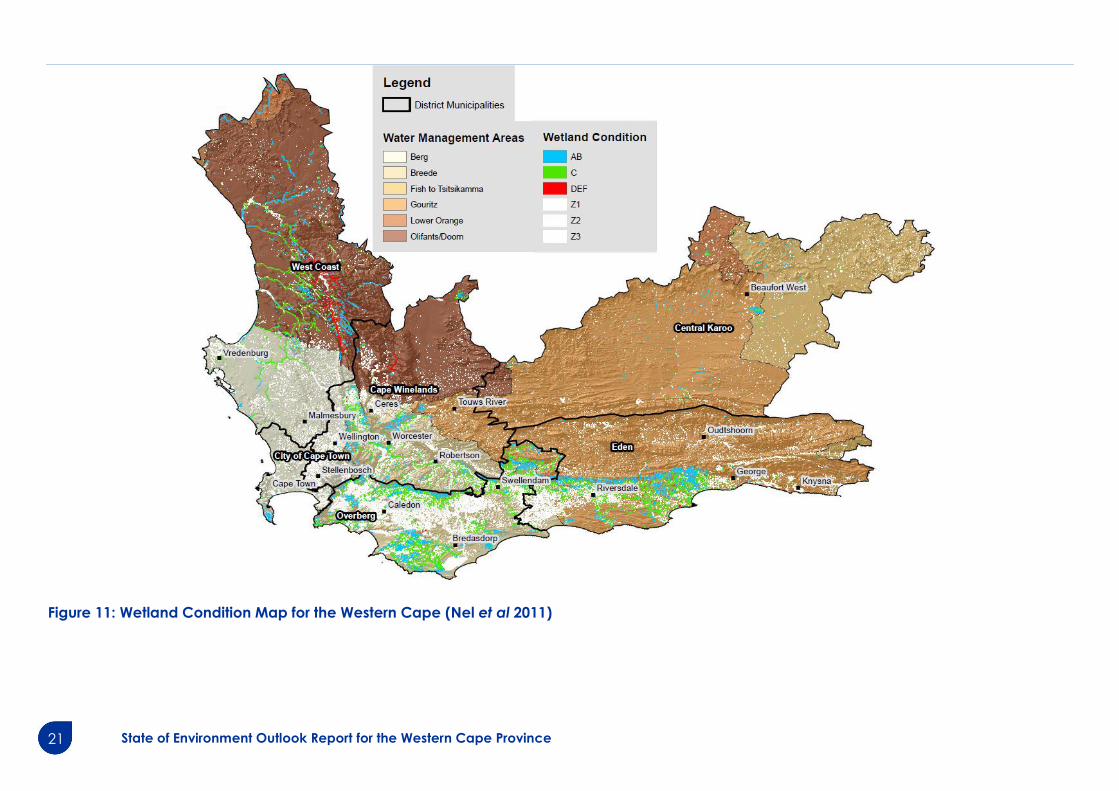
The distribution of wetlands within the Western Cape is shown in Figure 11, along with the
current estimated condition.
21 State of Environment Outlook Report for the Western Cape Province
Figure 11: Wetland Condition Map for the Western Cape (Nel et al 2011)
State of Environment Outlook Report for the Western Cape Province 22
The wetland condition classes shown in Figure 11 are as follows:
A B Natural
C Largely intact, some human related disturbance but generally in a good
state; Ecosystem functions essentially unchanged
DEF Multiple disturbances associated with the need for socio-economic
development and dense development; extensive resource exploitation
Z classes Condition unknown; wetland assigned a condition based on the lowest
percentage of natural land cover
Most wetlands in the Western Cape are classified as AB or C, with only a few within the
Olifants / Doorn classified as threatened. However, there are a large number of
unclassified wetlands. The land cover data for the province is outdated and this therefore
raises concerns about the true condition of the wetlands.
4 IMPACTS
Urban development and associated activities result in the alteration of the morphology of
rives. Most commonly the river‟s ability to attenuate floods and decompose pollutants is
reduced by canalisation, while levees intensify flood flows, disrupt the natural ability of the
floodplain to absorb flood water and increases siltation in the river. Canalisation is most
evident in densely populated urban areas surrounding the Black, Elsieskraal and Keysers
rivers in the City of Cape Town. The Big and Little Lotus rivers, which are largely artificial,
are canalised along most of their reaches (RHP 2005). Furthermore, dam walls and weirs
prevent the natural movement of fish and other aquatic species, while regulated flows
eliminate seasonal flow variations and have adverse impacts on the resilience of river
systems (RHP 2005).
Many of the urban rivers serve as conduits for discharging treated effluent to sea and
whilst these rivers cannot be returned to their natural state; their condition should at least
be maintained at levels that will not introduce adverse environmental health and social
impacts. Stormwater runoff from informal settlements and back-yard dwellings further
adds to the water quality impacts in downstream reaches. The resultant nutrient loading of
freshwater systems leads to multiple effects, including algal blooms, loss of biodiversity and
ecosystem services, health hazards most commonly experienced as diseases and illness,
and limitations on fitness for use (e.g. drinking water quality, irrigation, industry, etc).
Sustained eutrophication may lead to the presence of noxious forms of algae
(cyanobacteria) (Oberholster & Ashton 2008). The presence of algal toxins poses direct
threats to human and animal health via consumption or exposure. Consumption of
contaminated water takes place in the form of utilisation of water for cooking and
drinking as well as through consumption of fish that have been exposed to the algae.
Exposure may occur through direct contact with the water or using the water for laundry,
personal hygiene or cultural practices. The toxins cause reactions ranging from respiratory
difficulties, gastrointestinal symptoms, allergic reactions, ear pain and eye irritation to liver
and nerve damage (Oberholster et al. 2008; Harding 2011).
23 State of Environment Outlook Report for the Western Cape Province
Aquaculture often has negative consequences on freshwater ecosystems, including the
loss or alteration of natural habitats, the introduction of exotic species, threats to species
biodiversity, changes in water quality, the introduction and spread of disease to local fish
species (DAFF 2011). Unfortunately, some of the most invasive alien fish are also
economically valuable (for aquaculture and recreational angling) and are therefore
sometimes actively encouraged. As such, invasive alien fish have had a huge impact on
the biodiversity and ecological functioning of rivers in the Western Cape and are the
principal reason for the threatened status of all endemic species. However, with careful
management it is possible to support aquaculture farming without compromising the
conservation of indigenous fish species.
Most climate change forecasting for the Western Cape identifies a progressive drying of
the province towards the south-west. This will reduce surface runoff and slow down the
recharge rate of groundwater aquifers. Ultimately, this implies a reduced water yield from
both surface and groundwater sources. The water shortage is also likely to be
exacerbated by the expected increase in temperature and resultant increased
evaporation rates (DEADP 2012a). Changes to coastal rainfall patterns could also lead to
increased salt water intrusion into estuaries and coastal aquifers or raised groundwater
tables near the coast. This will have numerous knock-on effects for socio-economic
development, integrity of the wetlands, rivers and estuaries (Midgley et al. 2005).
5 RESPONSES
The Western Cape is serviced by aging water infrastructure, which leads to significant
system losses, yet has a high demand for basic services. An obligation nevertheless rests on
water management authorities to secure a sustainable water supply as the basis for a
developing country‟s economy and society, and at the same time an ecological need for
the sustainable implementation of the ecological reserve. This conundrum is being
addressed by government through implementation of a water resources reconciliation
strategy mandate which seeks to ensure a sustainable supply and equal access to water
for all current and future citizens of the country (DWA 2011a). This should be matched by a
plan for the maintenance of aging infrastructure, and development of new networks.
5.1 Sustainable Water Management Plan
The Western Cape Sustainable Water Management Plan (hereafter “Water Plan”) was
developed collaboratively by the Western Cape Government and DWA to guide
sustainable water management towards meeting the growth and development needs of
the region. Short (1-5 years), medium (6-15 years) and long term (+16 years) actions to
guide the implementation of projects / activities were developed, as a means towards
achieving integrated and sustainable management of water in the Western Cape. The
Water Plan focuses on water quality and water quantity in terms of Water Conservation /
Water Demand Management, while maintaining the ecological integrity of the Provinces‟
water resources.
The vision of the Water Plan is, “Sustainable water management for growth and
development in the Western Cape, without compromising ecological integrity”.

State of Environment Outlook Report for the Western Cape Province 24
The Water Plan has the following 4 Strategic Goals:
Goal 1: Ensure effective co-operative governance and institutional planning for
sustainable water management.
Goal 2: Ensure the sustainability of water resources for growth and development.
Goal 3: Ensure the integrity and sustainability of socio-ecological systems.
Goal 4: Ensure effective and appropriate information management, reporting and
awareness-raising of sustainable water management.
5.2 Berg River Improvement Plan
As part of implementing the Water Plan, a Berg River Improvement Plan was endorsed by
the Western Cape Government during January 2013 (DEADP 2012b). Under this plan, short
and long-term actions are currently being implemented and integrated across the various
Departments of the Western Cape Government towards a common outcome, viz. a
Water Stewardship Programme for the Berg River that facilitates the recognition of the
Berg River for its value for ecosystem services, and its natural resource state as it relates to
water quality and quantity returns, while promoting sustainable growth and development
in a green economy. In particular, the objectives of the Berg River Improvement Plan are
to:
i. Reduce the negative impact from Municipal urban areas, particularly informal
settlements and wastewater treatment works;
ii. Reduce the negative impact of agriculture on the Berg River‟s water quality to
acceptable levels;
iii. Ensure sustainable resource use efficiency and ecological integrity.
From the 3 objectives, 6 major tasks have been identified for implementation:
Task 1: Establish a Berg River Water Quality Monitoring Programme
Task 2: Upgrade Wastewater Treatment Works and Train Process Controllers
Task 3: Upgrade Informal Settlements
Task 4: Advocate Best Practice in Agricultural, Industrial and Domestic Land-use
Task 5: Riparian Zone Rehabilitation and Management (Buffer Zone)
Task 6: Pricing Water Management in the Berg River Catchment
This Berg River Improvement Plan is also
intended to complement the Business Plan
that is currently being drafted by CASIDRA, on
behalf of the Department of Water Affairs, as
well as link with the Berg River Water Quality
Task Team, as managed by DWA. The initial
focus and aim is to plant indigenous
vegetation in the riparian zone along
identified sections of the Berg River towards
naturally improving water quality and
ecological integrity in the catchment.

25 State of Environment Outlook Report for the Western Cape Province
5.3 Reconciliation strategies
The National Water Resource Strategy (2004) states that, “in general, sufficient water can
be made available at all significant urban and industrial growth points in the country for
water not to be a limiting factor to economic development. However, given the long lead
times for developing new supply schemes, co-operative planning will be required
between water users and water management institutions to ensure that water can be
made available when it is needed”. With this in mind the following reconciliation
interventions have been explored, or are in the process of being assessed for feasibility per
location and situation:
Demand management
Water resource management
Managing groundwater resources
Re-use of water
Control of invasive alien vegetation
Re-allocation of water
Development of surface water resources
Inter-catchment transfers
In response to the NWRS, the DWA has embarked on establishing Water Reconciliation
Strategies for all towns throughout the country, looking at water requirements (based on
use, estimated need and projected need), at water availability (ability to meet those
demands), and at the overall resource situation in terms of infrastructure and affordability -
to find ways of reducing demand and increasing availability. The approach to water
resource reconciliation is set out in a strategy that recommends actions to ensure sufficient
water. These strategies could vary from complex, in the case of major metropolitan areas
and systems and catchments, to simple strategies for smaller towns. The key objectives of
the reconciliation study are to develop future water requirement scenarios, investigate all
possible water sources and methods for reconciling, provide recommendations for
interventions and actions and offer a system for continuous updating in the future.
Currently, the areas in the Western Cape with highest water demand are managed and
serviced under the auspices of the WCWSS. The scheme provides water to the
communities of and around Cape Town, to towns on the West Coast and in the Swartland
region, as well as to irrigation areas in the
Cape Winelands and Overberg Districts.
Major infrastructure in the system includes
the Theewaterskloof and Voëlvlei dams
(owned and operated by the
Department of Water Affairs (DWA)), the
Berg River Dam (owned by the Trans
Caledon Tunnel Authority and operated
by the DWA) and the Wemmershoek,
Upper Steenbras and Lower Steenbras
dams (owned and operated by the City
of Cape Town). The water storage in the
system is evaluated towards the end of
State of Environment Outlook Report for the Western Cape Province 26
the wet season (no later than 1st November), to assess whether or not supplies must be
restricted for the following year, to ensure that sufficient water remains for the more
essential uses, were a drought to occur. The dams are operated as an integrated system
to minimise spillage and maximise storage during drought months (DWAF 2007).
The DWA planning work for the Western Cape Water Supply System has highlighted
development of the Voëlvlei dam as a surface water intervention which could be
undertaken by 2019, which is the time when the WCWSS will require additional storage
capacity. In addition to this, water re-use and desalination of seawater will need to be
explored further. The following surface water interventions were identified for further
feasibility and environmental studies for post- 2019 implementation depending on need
(refer to Figure 11):
Michell‟s Pass Diversion
Raising of Steenbras Upper Dam
Groundwater interventions for the WCWSS which focuses on Cape Town and surrounds
include the development of the Table Mountain Group Aquifer as well as the Newlands
and Cape Flats Aquifers. The Table Mountain Group Aquifer is a substantial aquifer
located under the Cape Fold Mountains and has been identified as a potentially
significant source of water for future supply to the WCWSS. The City of Cape Town is busy
with an on-going Feasibility Study and Pilot Project to test the viability of the exploitation of
the aquifer. The earliest implementation date for larger scale abstraction is currently
estimated as 2021. The City of Cape Town is committed to the prioritisation of water re-
use4 and desalination as their first priority though.
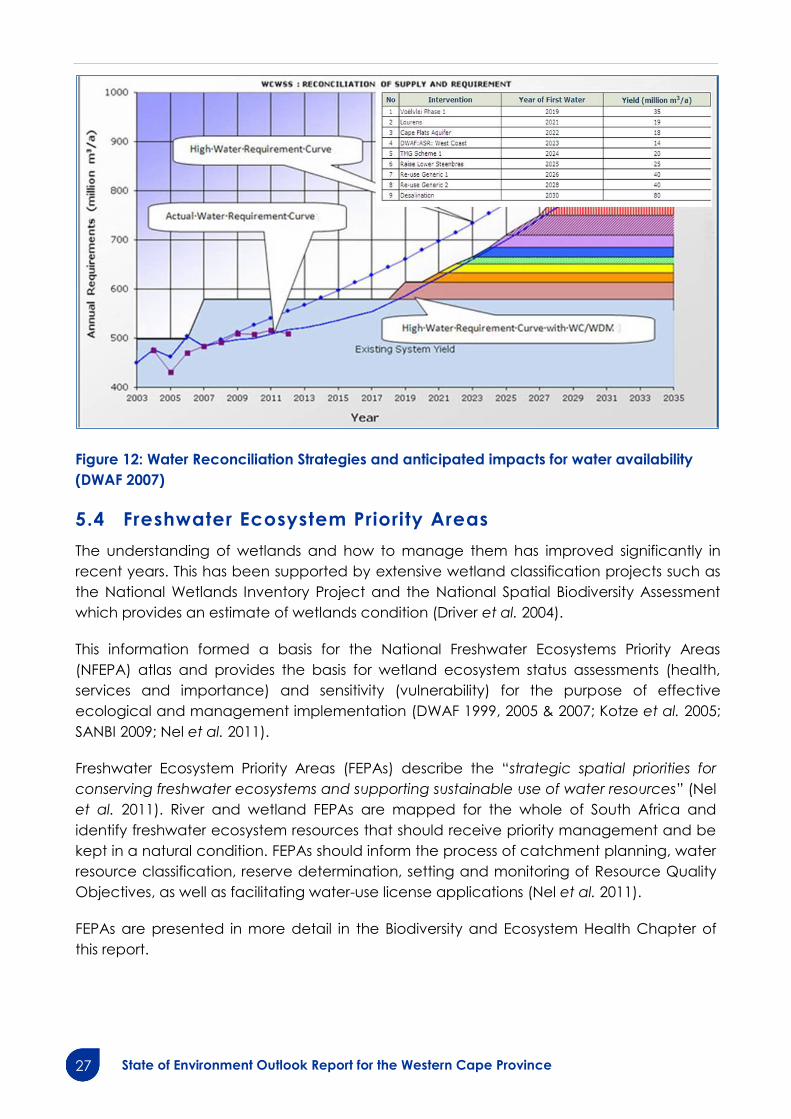
Figure 12 shows a comparison between available water sources and anticipated water
demand in order to determine when interventions would be required to ensure water
requirements can be met. It is clear that the anticipated growth in water requirements
requires a combination of several different interventions. The policy of DWA is that water
conservation demand management must be fully implemented before additional water is
sought.
During 2009 and 2010 severe droughts in the Southern and Eastern Cape helped to
concentrate the minds of planners anxious to find a way of providing water to towns. The
answer is generally seen to be recycling facilities and investment in desalination for
coastal areas. This is particularly evident in the popular Garden Route tourist region where
visitor numbers during the hottest part of the year put additional pressure on water
supplies. Inland areas are more reliant on accessing groundwater resources.
4 Treatment of waste water for the purpose of re-use.
27 State of Environment Outlook Report for the Western Cape Province
Figure 12: Water Reconciliation Strategies and anticipated impacts for water availability
(DWAF 2007)
5.4 Freshwater Ecosystem Priority Areas
The understanding of wetlands and how to manage them has improved significantly in
recent years. This has been supported by extensive wetland classification projects such as
the National Wetlands Inventory Project and the National Spatial Biodiversity Assessment
which provides an estimate of wetlands condition (Driver et al. 2004).
This information formed a basis for the National Freshwater Ecosystems Priority Areas
(NFEPA) atlas and provides the basis for wetland ecosystem status assessments (health,
services and importance) and sensitivity (vulnerability) for the purpose of effective
ecological and management implementation (DWAF 1999, 2005 & 2007; Kotze et al. 2005;
SANBI 2009; Nel et al. 2011).
Freshwater Ecosystem Priority Areas (FEPAs) describe the “strategic spatial priorities for
conserving freshwater ecosystems and supporting sustainable use of water resources” (Nel
et al. 2011). River and wetland FEPAs are mapped for the whole of South Africa and
identify freshwater ecosystem resources that should receive priority management and be
kept in a natural condition. FEPAs should inform the process of catchment planning, water
resource classification, reserve determination, setting and monitoring of Resource Quality
Objectives, as well as facilitating water-use license applications (Nel et al. 2011).
FEPAs are presented in more detail in the Biodiversity and Ecosystem Health Chapter of
this report.
State of Environment Outlook Report for the Western Cape Province 28
5.5 Invasive alien species
Targeted removal of invasive alien plants and maintenance of cleared areas should be a
leading priority so that further spread can be prevented. Through eradication of invasive
plants, the base flows of rivers would increase thereby augmenting the water supply. This is
especially effective where clearing takes place up stream of existing dams. A key strategy
should be targeted clearing with the aim of securing the ecological flow requirements of
the rivers and estuaries.
A quantification of the impacts of invasive alien plants, as well as an understanding of the
management needs, can only take place on the basis of ongoing and comprehensive
monitoring – both the mapping of the extent of invasions, and monitoring of the actual
benefits of rehabiltation. As there is an obligation under the Conservation of Agricultural
Resources Act, 1983, to manage invasive plants on one‟s own property, some farmers
have taken to clearing their catchments. The publication of their „success stories‟ could
encourage other farmers in the each WMA to take up similar responsibilities.
Problems identified in the Internal Strategic Perspectives for the different WMAs in relation
to clearing of Invasive Alien Plants include the following:
Maps are not up to date, which affect the effective monitoring of the alien invasive
problem.
The alien invasive vegetation is not of any economic value to the Western Cape
Province and is therefore using up unnecessary resources such as land space and
water.
The estimates of the actual extent of invasive alien plants in the Western Cape
Province, and the impact on water resources need to be improved. Estimates
should include species, location (key area, and position in the landscape), and
density.
Catchment management tariffs may not necessarily internalise or consider the
costs related to alien invasive clearing.
5.6 Adopt-a-River Programme
Moving beyond the civic and civil institutes, the National Aquatic Ecosystem Health
Monitoring Programme coordinates the implementation of the River Health and “Adopt-a-
River” programmes. These combine to provide a framework for public contributions to the
protection of inland water resources through local clean-up events, local monitoring
projects, capacity building of school learners and empowerment of women. The Adopt-a-
River Programme has been rolled out to regional and local government level with
implementation occurring at many of the pilot rivers in the country. This includes the Eerste
and Doring rivers in the Western Cape along with rivers in each of the other provinces. The
focus of the programme is now not only on awareness-building of school learners and the
public, but also capacity building (monitoring, river safety, health and skills development),
job creation (temporary employment during clean-up events and utilisation of locals by
local water boards as monitoring champions), as well as of women empowerment and
ownership.
29 State of Environment Outlook Report for the Western Cape Province
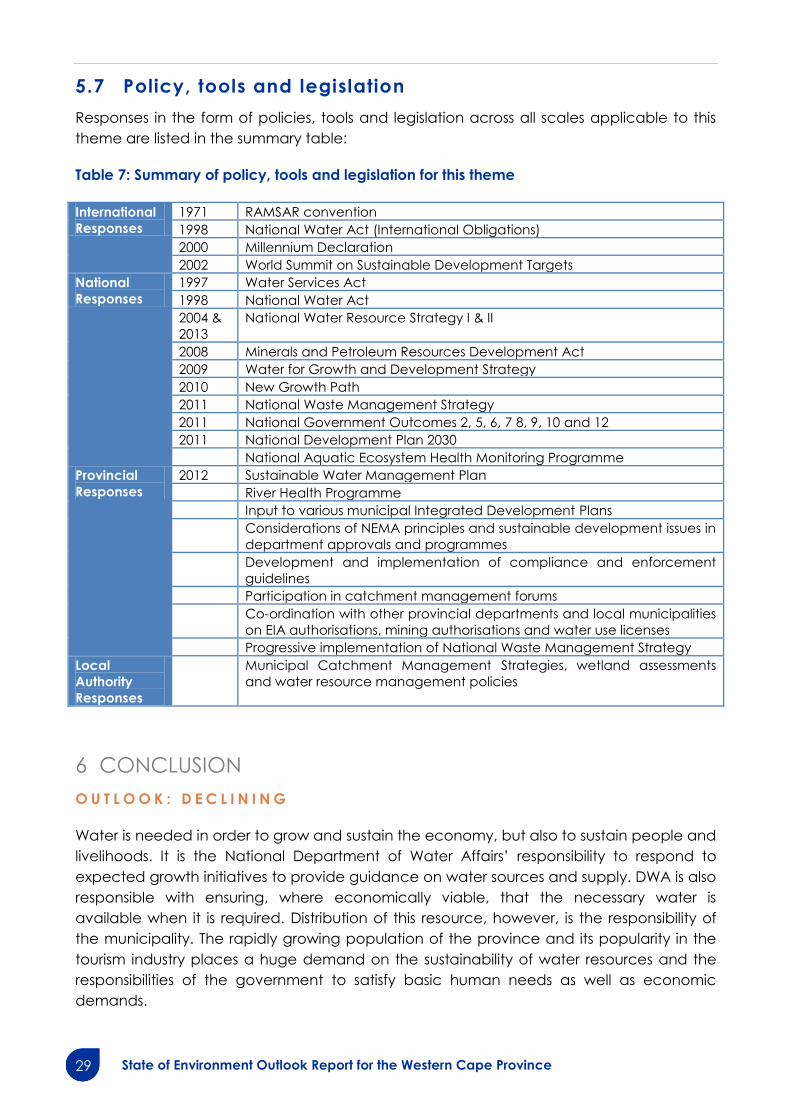
5.7 Policy, tools and legislation
Responses in the form of policies, tools and legislation across all scales applicable to this
theme are listed in the summary table:
Table 7: Summary of policy, tools and legislation for this theme
International
Responses
1971 RAMSAR convention
1998 National Water Act (International Obligations)
2000 Millennium Declaration
2002 World Summit on Sustainable Development Targets
National
Responses
1997 Water Services Act
1998 National Water Act
2004 &
2013
National Water Resource Strategy I & II
2008 Minerals and Petroleum Resources Development Act
2009 Water for Growth and Development Strategy
2010 New Growth Path
2011 National Waste Management Strategy
2011 National Government Outcomes 2, 5, 6, 7 8, 9, 10 and 12
2011 National Development Plan 2030
National Aquatic Ecosystem Health Monitoring Programme
Provincial
Responses
2012 Sustainable Water Management Plan
River Health Programme
Input to various municipal Integrated Development Plans
Considerations of NEMA principles and sustainable development issues in
department approvals and programmes
Development and implementation of compliance and enforcement
guidelines
Participation in catchment management forums
Co-ordination with other provincial departments and local municipalities
on EIA authorisations, mining authorisations and water use licenses
Progressive implementation of National Waste Management Strategy
Local
Authority
Responses
Municipal Catchment Management Strategies, wetland assessments
and water resource management policies
6 CONCLUSION
O U T L O O K : D E C L I N I N G
Water is needed in order to grow and sustain the economy, but also to sustain people and
livelihoods. It is the National Department of Water Affairs‟ responsibility to respond to
expected growth initiatives to provide guidance on water sources and supply. DWA is also
responsible with ensuring, where economically viable, that the necessary water is
available when it is required. Distribution of this resource, however, is the responsibility of
the municipality. The rapidly growing population of the province and its popularity in the
tourism industry places a huge demand on the sustainability of water resources and the
responsibilities of the government to satisfy basic human needs as well as economic
demands.
State of Environment Outlook Report for the Western Cape Province 30
The status quo for surface water availability is currently in a deficit for three of the Western
Cape‟s four water management areas. This often correlates with the ecological condition
of the systems being degraded. On the other hand, the status quo for groundwater
availability is optimistic in terms of potential for use on a small to medium scale, with much
focus on utilising the significant Table Mountain Group Aquifer. However, the resource
quality associated with the sustainable utilisation of inland resources will require much
investment in terms of comprehensive monitoring, in order to provide a broader
understanding of the resource availability. It can also be expected that treatment costs
associated with these often naturally saline resources will be high.
Further emphasis needs to be placed on the effective management of land use activities,
such as human settlement and development expansion, and agriculture. The allocation
and actual use of water (surface and groundwater) for agricultural uses must be
investigated properly and adjusted in the context of the resource availability in the
province. This is particularly important in order to provide food security for the future.
Although much focus has been given to invasive alien plants, the primary strategy through
which the problem of invasive alien plants should be addressed remains an approach
that prioritises prevention over rehabilitation. In addition, a stronger awareness with
regards to responsibility needs to be given on a civic and municipal level. Therefore the
aim should be to control further infestations by limiting new sources of feedstock such as
new forestry plantations or the encroachment of invasive plants into watercourses.
Remote, scattered and outlying invasive plants must also be cleared before they become
unmanageable.
The Sustainable Water Management Plan for the Western Cape Province aims to give
effect to the identified implementation shortcomings in the water sector, in particular
corporate governance (institution capacity and functioning). The verification and
validation processes currently underway, with a stronger regulation of water use, will be
vital in providing the basis for the sound implementation of water reconciliation strategies,
climate mitigation measures and support of the establishment of our second economy.
The further prioritisation of ecologically important catchments, the determination of
significant groundwater reserves and the protection of mountain catchment areas, are
essential into making strides into ensuring resource availability for our future generations.
The water situation of the Western Cape therefore remains complex. The implementation
of strategic policy and plans from all levels of government will give effect to much
needed pressure relief from a water use perspective. The functioning establishment of
Catchment Management Agencies; and the implementation of Resource Directed
Measures and Source Directed Controls for managing the significant water resources of
our water management areas is a fundamental step in the right direction. Yet the
implementation of the principles of integrated water resource management, shared
public responsibility and ownership, greater participation and involvement of all
stakeholders and corporative governance remains elusive.
The findings of the Inland Water chapter can be summarised as an overall declining
outlook. Table 8 contains a brief summary of the key pressures, impacts, challenges,
progress and recommended critical areas for action. Table 9 contains the anticipated
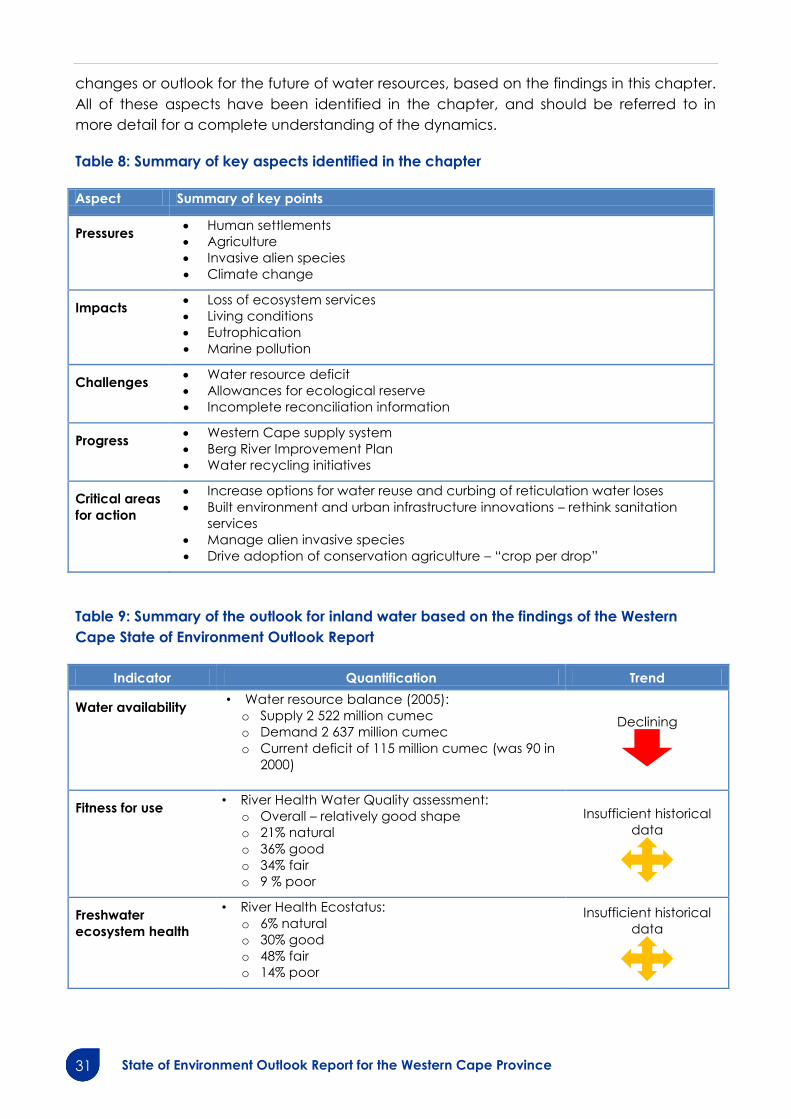
31 State of Environment Outlook Report for the Western Cape Province
changes or outlook for the future of water resources, based on the findings in this chapter.
All of these aspects have been identified in the chapter, and should be referred to in
more detail for a complete understanding of the dynamics.
Table 8: Summary of key aspects identified in the chapter
Aspect Summary of key points
Pressures
Human settlements
Agriculture
Invasive alien species
Climate change
Impacts Loss of ecosystem services
Living conditions
Eutrophication
Marine pollution
Challenges Water resource deficit
Allowances for ecological reserve
Incomplete reconciliation information
Progress Western Cape supply system
Berg River Improvement Plan
Water recycling initiatives
Critical areas
for action
Increase options for water reuse and curbing of reticulation water loses
Built environment and urban infrastructure innovations – rethink sanitation
services
Manage alien invasive species
Drive adoption of conservation agriculture – “crop per drop”
Table 9: Summary of the outlook for inland water based on the findings of the Western
Cape State of Environment Outlook Report
Indicator Quantification Trend
Water availability • Water resource balance (2005):
o Supply 2 522 million cumec
o Demand 2 637 million cumec
o Current deficit of 115 million cumec (was 90 in
2000)
Declining
Fitness for use • River Health Water Quality assessment:
o Overall – relatively good shape
o 21% natural
o 36% good
o 34% fair
o 9 % poor
Insufficient historical
data
Freshwater
ecosystem health
• River Health Ecostatus:
o 6% natural
o 30% good
o 48% fair
o 14% poor
Insufficient historical
data
State of Environment Outlook Report for the Western Cape Province 32
7 REFERENCES
Chamier J, Schachtschneider K, Le Maitre DC, Ashton PJ & Van Wilgen BW (2012). Impacts
of invasive alien plants on water quality, with particular emphasis on South Africa. Water
SA. Vol. 38 No. 2. April 2012.
DAFF (2011). A Profile of the South African Market Value Chain. Department of Agriculture,
Forestry and Fisheries. Pretoria. South Africa.
De Lange WJ, Stafford WHL, Forsyth GG & Le Maitre DC (2012). Incorporating stakeholder
preferences in the selection of technologies for using invasive alien plants as a bio-
energy feedstock: applying the analytical hierarchy process. J Environ Manage.
99(0):76e83.
De Villiers S & Thiart C (2007). The nutrient status of South African Rivers: concentrations,
trends and fluxes from the 1970s to 2005. South African Journal of Science. Vol. 103.
July/August.
DEADP (2005). Western Cape State of Environment Report 2005 (Year One). Department
of Environmental Affairs and Development Planning. Western Cape Government.
DEADP (2012a). Integrated Water Resource Management Action Plan: Status Quo.
Department of Environmental Affairs and Development Planning. Western Cape
Government.
DEADP (2012b). A Berg River Improvement Plan. Department of Environmental Affairs and
Development Planning. Western Cape Government.
Driver A, Maze K, Rouget M, Lombard AT, Nel J, Turpie JK, Cowling RM, Desmet P,
Goodman P, Harris J, Jonas Z, Reyers B, Sink K & Strauss T (2004). National Spatial
Biodiversity Assessment 2004: Priorities for Biodiversity Conservation in South Africa.
Strelitzia 17. South African National Biodiversity Institute. Pretoria. South Africa.
Driver A, Sink KJ, Nel JL, Holness S, Van Niekerk L, Daniels F, Jonas Z, Majiedt PA, Harris L &
Maze K (2012). National Biodiversity Assessment 2011: An assessment of South Africa’s
biodiversity and ecosystems. Synthesis Report. South African National Biodiversity
Institute and Department of Environmental Affairs. Pretoria. South Africa.
DWA (2009). Strategic planning for water resources in South Africa. A situation analysis.
Report No: P RSA 000/00/7809. Department of Water Affairs. Pretoria. South Africa.
DWA (2010a). National Desalination Strategy, Final Revision for Approval, October 2010.
Department of Water Affairs. Pretoria. South Africa.
DWA (2010b). Assessment of the Ultimate Potential and Future Marginal Costs of water
resources in South Africa. Project completed by BKS. Department of Water Affairs.
Pretoria. South Africa.

33 State of Environment Outlook Report for the Western Cape Province
DWA (2010c). Groundwater Strategy 2010. Water Resources Planning Systems.
Department of Water Affairs. Pretoria. South Africa.
DWA (2011a). Integrated Water Resource Planning for South Africa: A situation analysis.
Department of Water Affairs. Pretoria. South Africa.
DWA (2011b). Resource directed management of water quality: Planning Level Review of
Water Quality in South Africa. Department of Water Affairs. Pretoria. South Africa.
DWA (2012). Draft National Water Resource Strategy 2 (NWRS-2). Department of Water
Affairs. Pretoria. South Africa.
DWAF (1999). Resource Directed Measures for Protection of Water Resources. Volume 3:
River Ecosystems Version 1.0. Resource Directed Measures for Protection of Water
Resources. Department of Water Affairs and Forestry. Pretoria. South Africa.
DWAF (2002). National Eutrophication Monitoring Programme: Implementation Manual.
First Edition. South African National Water Quality Monitoring Programmes Series.
www.dwaf.gov.za/iwqs/eutrophication/NEMP/ (March 2013).
DWAF (2004). National Water Resource Strategy. First edition – September 2004.
Department of Water Affairs and Forestry. Pretoria. South Africa.
DWAF (2007). Western Cape Water Supply System: Reconciliation Strategy Study. Report
No: P WMA 19/000/00/0507. Department of Water Affairs and Forestry. Pretoria. South
Africa.
Harding B (2011). Why is eutrophication a problem? blog.dhec.co.za (November 2011).
Karr JR (1999). Defining and measuring river health. Freshwater Biology. 41:221-234.
Kotze D, Marneweck GC, Batchelor AL, Lindley DS & Collins NB (2005). WET‐Ecoservices: A
Technique for Rapidly Assessing Ecosystem Services Supplied by Wetlands. Free State
Department of Tourism, Environmental and Economic Affairs. South Africa.
Kotzé I, Beukes H, Van den Berg E & Newby T (2010). National Invasive Alien Plant Survey.
Department of Water Affairs.
Le Maitre DC, Versfeld DB and Chapman RA (2000). The impact of invading alien plants
on surface water resources in South Africa: A preliminary assessment. Water SA. 26, 397–
408
Nel JL, Driver A, Maherry A, Strydom W, Roux DJ, Van Deventer H & Petersen C (2011).
Atlas of Freshwater Ecosystem Priority Areas in South Africa: Maps to Support Sustainable
Development of Water Resources. Water Research Commission. Pretoria. South Africa.
Oberholser P & Ashton P (2008). State of the Nation Report. An Overview of the current
state of water quality and eutrophication in South African rivers and reservoirs.
Parliamentary Grant Deliverable.

State of Environment Outlook Report for the Western Cape Province 34
RAMSAR (2011). www.ramsar.org (March 2013).
RHP (2004). State of Rivers Report: Berg River System. Department of Water Affairs and
Forestry. Pretoria. South Africa.
RHP (2005). State of Rivers Report: Greater Cape Town’s Rivers. Department of Water
Affairs and Forestry. Pretoria. South Africa.
RHP (2006). State of Rivers Report: Olifants/Doorn and Sandveld Rivers. Department of
Water Affairs and Forestry. Pretoria. South Africa.
RHP (2007). State of Rivers Report: Gouritz Water Management Area Rivers. Department of
Water Affairs and Forestry. Pretoria. South Africa.
RHP (2011). State of Rivers Report: Breede Water Management Area. Department of Water
Affairs and Forestry. Pretoria. South Africa.
SAEON (2011). Combating change with change. South African Environmental Observation
Network. Pretoria. South Africa.
SANBI (2009). Further Development of a Proposed National Wetland Classification System
for South Africa. Primary Project Report. Prepared by the Freshwater Consulting Group
for the South African National Biodiversity Institute (SANBI).
StatsSA (2010). Water Management Areas in South Africa. Discussion document: D0405.8.
Statistics South Africa. www.statssa.gov.za (January 2013).
UNESCO (2011). www.unesco.org (January 2013).
Van Wilgen BW, Forsyth GG, Le MaitreDC, Wannenburgh A, Kotzé JDF, Van den Berg E &
Henderson L (2012). An assessment of the effectiveness of a large, national-scale
invasive alien plant control strategy in South Africa. Biological Conservation 148, 28-38.

State of Environment Outlook Report for the Western Cape Province 36
Department of Environmental Affairs and Development Planning
Leeusig Building, 3rd Floor, 1 Dorp Street, Cape Town, 8001
Private Bag X9086, Cape Town, 8000
Telephone: +27 (0)21 483 4091 / Facsimile: +27 (0)21 483 3016
Email: [email protected]