Embed Size (px)
Citation preview
Journal of Regulatory Economics; 4:379-404 (1992) 01992 Kluwer Academic Publishers
State Mandated Benefits and the Small Firm's Decision to Offer Insurance
GAIL A. JENSEN Wayne State University
Department of Economics, Detroit, MI 48202
JON R. GABEL KPMG Peat Marwick
Washington, DC 20036
Abstract In the last decade, the number of Americans without health insurance has grown, partly due to an erosion in employer-based coverage among workers. This paper examines the extent to which state-mandated benefit requirements and other state in surance regulations discourage small firms in the private sector from providing health benefits. Using data on 1320 firms observed in 1985 and 492 finns observed in 1988, we estimate two models of small f irms' decisions to offer health insurance (one for each data set), and then use them to assess the effects that mandates had on purchasing decisions in bc~h years. We estimate that 19 percent of noncoverage among sample businesses in 1985 and 43 percent of noncoverage in the 1988 sample was attributable to state-mandated benefits. State continuation-of-coverage requirements were particularly burdensome for firms. With continued growth in the number of state mandated benefit requirements, we should expect a steady rise in the small f irm's propensity to forgo insurance coverage.
1. Introduction
In the midst of a prolonged economic expansion, the number of Americans without health insurance has grown, up from 14.6 percent of the under-65 population in 1979 to 18.5 percent in 1989 (Kronick 1991). This seeming paradox is partly the result of an erosion in employer-based coverage over the period, the source of protection against the cost of illness for nearly 150 million Americans. Fewer employees now receive health insurance as part of compensation (Small Business Adminislration 1990; Kronick 1991). Yet about three- quarters of all uninsured persons live in families headed by a worker, typically employed by a firm with 25 or fewer workers. This was true in 1977 and was again the case in 1987 (Monheit et al. 1985; Short et al. 1989).
To expand coverage among the uninsured, elected officials have sponsored legislation to increase workers" access to employer-sponsored coverage. The Consolidated Omnibus
380 GAIL A. JENSEN AND JON R. GABEL
Budget Reconciliation Act (COBRA) of 1985 required firms with 20 or more workers to provide group coverage continuation rights to persons who might otherwise be uninsured due to separation from the firm. In 1986, Congress granted a 25 percent tax deduction to sell-employed workers and their families for their cost of health insurance. More recently, proposals to require that all firms provide insurance to employees and their dependents have received national attention.
At the state level, 28 states have passed legislation requiring firms to provide continua- tion-of coverage benefits to terminated workers or their dependents (Jensen 1992). Oregon and Kentucky have begun to subsidize small firms' new insurance purchases with state tax credits, and California will do so beginning in 1993 (The Alpha Center 1991). Hawaii and Massachusetts have passed legislation requiring that all employers provide health insurance coverage. In Massachusetts, however, the mandate has not yet taken effect.
Efforts to enhance the "quality" of employer-sponsored coverage, through state-man- dated minimum benefit requirements may thwart attempts to increase access. State man- dates are laws which prescribe the content of employer coverage purchased from Blue Cross Blue Shield and commercial insurers. Mandates typically stipulate that certain benefits be included in a group plan, if one is offered. By making insurance more expensive, minimum coverage rules may price some firms out of the insurance market. Especially vulnerable are small firms that face much higher premiums to begin with (loading charges for firms with fewer than 10 employees are typically 60 - 70 percent more than for very large firms). The 1974 Employee Retirement Income and Security Act (ERISA) grants self-insured benefit plans exemption from all state insurance laws and taxation. Small firms, however, cannot viably self-insure as a means of circumventing mandated benefit requirements. Ironically, it is these very firms where coverage needs to be encouraged if we are to reduce the number of employed uninsured.
The collective number of state-mandated benefits across all 50 states more than doubled over the period mentioned above, up from 399 in 1979 to 827 in 1989 (Jensen 1992). These include requirements on the services or providers covered under the plan (about 80 percent of all mandates now in effect), rules governing entitlement to participate in an employer's plan (15 percent), and the capability of separated workers and their dependents to convert former group coverage to self-paid individual coverage, regardless of health status (5 percent).
The public interest rationale for state-mandated benefits is that certain shortcomings exist in the market for employer health insurance, and to correct them the government must intervene. For example, insurers and purchasers may unknowingly undervalue the benefits of some types of care, such as chemical dependency treatment, resulting in a demand for coverage which is "too low" from a societal perspective. Also, without mandates, adverse selection might occur which drives up employers' cost of particular coverages. This happens if individuals with chronic conditions tend to enroll in plans offering more extensive coverage, such as mental health benefits, and healthier individuals opt for low-benefit plans. Although they would prefer more, lower risk groups are unable to purchase insurance except at rates which are unfair to them (Rothschild and Stiglitz 1976). In this sense, adverse selection creates a market shortcoming, which a mandate may be able partially to correct. 1
An alternative view is that these laws simply serve the political interests of state legislators (Peltzman 1976). They do it in several ways. First, in an era of strained state budgets,
STATE MANDATED BENEFITS AND THE SMALL FIRM 381
mandates enable legislators to seemingly extend the protection of society's safety net without having to raise constituents' taxes. In addition, mandates may actually reduce state expenditures for particular services, such as mental health, because they help shift treatment costs to the private sector (Lambert and McGuire 1990). Also, mandates tend to appease small but politically energized provider groups which may benefit enormously from the increased demand for their services. While there are costs associated with mandates, they tend to be borne mostly by employees in smaller businesses, who are clearly a politically diffuse and unorganized group.
This paper examines the effects of state insurance regulations on the small firm's decision to offer coverage. Using data from two separate surveys, one conducted in 1985 and the other in 1988, we model the effects of mandated benefits on a small fm-n's decision to offer insurance in each year. We then use the estimated models to evaluate the extent of noncoverage in each year attributable to mandates. A bootstrapping procedure is used to assess the reliability of our estimates.
The plan of the paper is as follows. Section 2 provides a simple theoretical model of the demand for group health benefits which illustrates how state regulations can cause some firms to forego coverage. Section 3 describes our econometric approach and data sources, and empirical results are presented in Section 4. Section 5 presents a summary and conclusions.
2. A Model of Employer Insurance Provision
We first examine insurance provision absent minimum coverage and entitlement require- ments and premium taxes, in order to set up the analytics of the firm's decision, and then show how such regulations may discourage providing coverage. Since the choice problem is discrete, i.e., either the firm offers insurance or does not, a simple graphical treatment best illustrates the effects of regulation on the fu'm's coverage decision.
2.1. Choice in the Absence of State Insurance Regulation We begin by introducing some assumptions. Each worker's utility depends solely on
after-tax wages (w), and insurance_ coverage (Z), with higher levels of Z (more generous coverage) providing higher utility, z Workers are skill homogeneous but may differ in terms of their preferences over possible wage-insurance bundles. Preference types are indexed by utility functions:
Uk=Uk(w,Z), k = a , b , c . . . . . K. (1)
The labor market is competitive, and each mobile worker decides which of M firms to work for (M >> K) on ~he basis of utility maximization.
In addition to wages, employers can offer insurance for compensation; however, when insurance is offered, the conditions of coverage entitlement and the quantity of insurance must be equal for all workers within a firm. 3 Stated most broadly, each firm's problem is to choose labor (L), the only input, and a compensation package to maximize profit, taking
output price (normalized to one) and the going utility levels for workers (--U a, ~ . . . . . ~/~) as given. These utility levels reflect each worker's evaluation of the wage-insurance

382 GAIL A. JENSEN AND JON R. GABEL
packages available on the market. With mobility, ~ will be the same across firms for workers of type k, since otherwise k-types would all migrate to the firm offering a package
with higher utility, b'/~, however, may differ across preference types. Firms may vary in their technology for producing output (Q), and insurance benefits may
improve worker productivity in some firms. Thus, the firm's production function is
a = Q(L, Z, o~), (2)
where the parameter o~ allows for firm-specific variations in technology. If the productivity effects of coverage vary across firms, they can be represented by different a-values. Offering a generous plan, which includes alcohol treatment coverage, for example, may positively enhance output if alcohol abuse is a problem among workers. The cost TC of offering Z may also vary across f'n-ms and is given by
TC = p(Z, L) L + t(~). (3)
The first term here is the variable premium cost of a policy with coverage Z. Its dependence on L accounts for obvious economies of scale in group purchasing. The second term t(13) is the transactions cost associated with offering a plan. For simplicity, we assume it is a fixed cost, i.e., independent of both Z and L, but it may nonetheless vary with 1~, a firm-specific parameter (like a). Different ~'s could arise from differences in firm location (e.g., urban versus rural), worker turnover, the experience of its benefits manager, or other factors to the extent that they influence the firm's cost of search or cost of managing the plan. Assume t = 0 for Z = 0 and t > 0 for Z > 0, with Ot/O~ > O.
Equilibrium in the labor market requires that (i) each worker maximize utility given all available employment opportunities and (ii) each fh'm maximize profit given its technology (a, 13) and each worker's utility requirements. As Goldstein and Panly (1976) first showed (for a similar fringe benefit model), in equilibrium, workers will tend to sort themselves across fin'ms into homogeneous groups, i.e., some firms will hire only a's (i.e., workers with
preferences given by ua(w, Z)), others only b's, and so on. Although type-k workers' utility
will be uniform across the set of firms S k that hire type-k workers, compensation packages
may differ across firms within S ~ if f'n-ms' technologies for producing output and providing
coverage (i.e., the a ' s and [~'s) vary for finns in Sk. 4 Those firms in S k that can more efficiently provide insurance (high a and]or low 13) will do so and generally provide higher levels of coverage, while those that find it difficult (low a and]or high 13) will tilt workers' compensation in favor of wage income. Finns choosing not to provide coverage will tend to hire workers who most prefer wages as compensation, while firms offering the most generous insurance plans will hire workers whose preferences lean heavily toward coverage. 5
Stated most simply, a firm offers insurance if the profit it can earn by doing so, n*(Z > 0), outweighs the profit it can earn, ~*(Z= 0), by not doing so. The firm computes the former as the maximum profit it can earn under each of k different scenarios: hiring type-a workers , type-b workers . . . . . or type-K workers . Tha t is, ~*(Z>0)
= max {nJt(Z > 0): k = a, b, c . . . . . K} where ~'k(Z > 0) is the profit associated with a solution to
STATE MANDATED BENEFITS AND THE SMALL FIRM 383
Problem 1: maximize rc = Q(Lk, Zk, c~) - [wk + p(Zk, Lk)] L k - t(13), subject to {Lk, w,,z,} U(wk, Zk) > -Uk and Lk, wk, Zk > O.
ft. I.
Likewise, ~*(Z = 0) = max l ~ ( Z = 0): k = a, b, c . . . . . K~, where 7ff'(Z = 0) is the profit as- sociated with a solution to
Problem 2: maximize re = Q(Lk, O, ~) - wkLk, subject to U(wk, O) > Uk and Lk, wk > O. {Lk, wk}
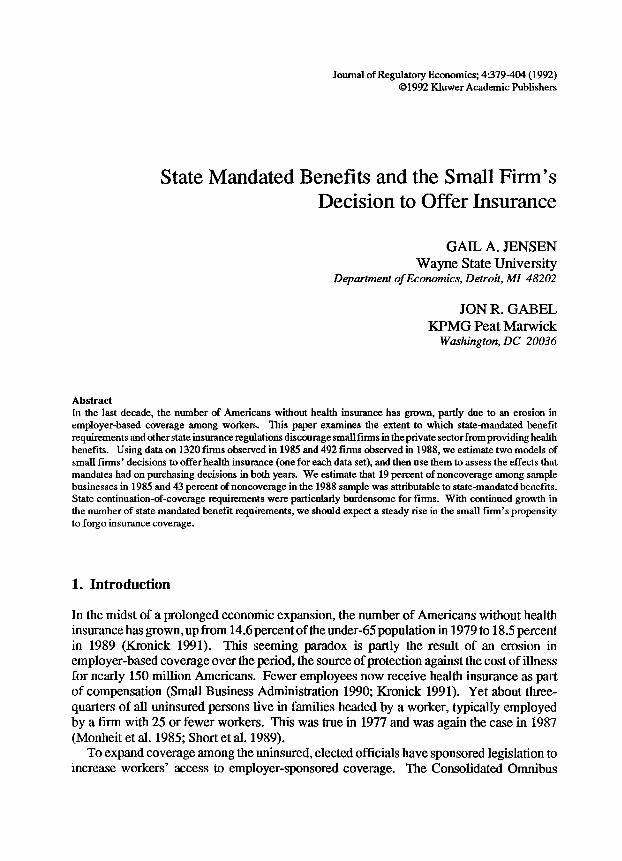
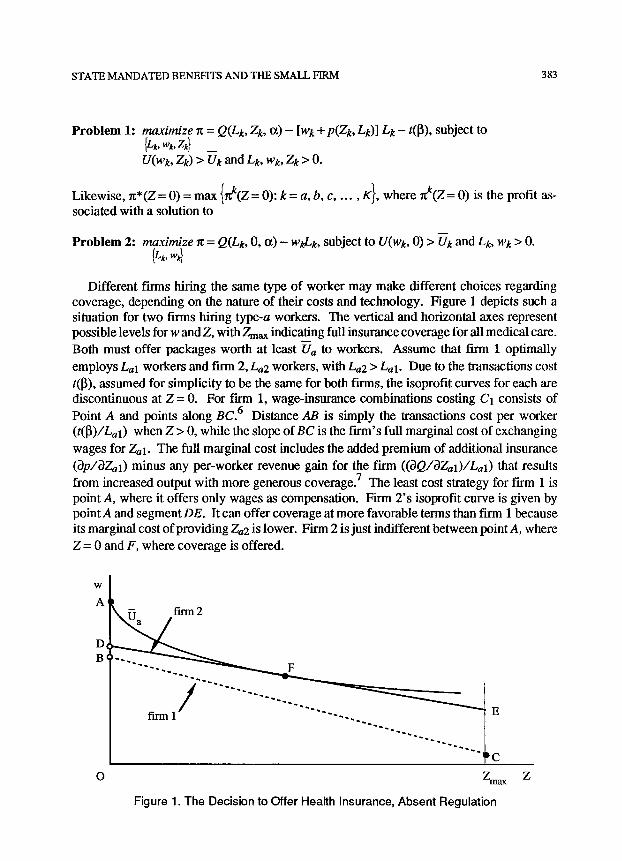
Different firms hiring the same type of worker may make different choices regarding coverage, depending on the nature of their costs and technology. Figure 1 depicts such a situation for two firms hiring type-a workers. The vertical and horizontal axes represent possible levels for w and Z, with Zmax indicating full insurance coverage for all medical care. Both must offer packages worth at least Ua to workers. Assume that firm 1 optimally
employs Lal workers and firm 2,La2 workers, with La2 > Lal. Due to the transactions cost t([~), assumed for simplicity to be the same for both firms, the isoprofit curves for each are discontinuous at Z = 0. For firm 1, wage-insurance combinations costing C1 consists of Point A and points along BC. 6 Distance AB is simply the transactions cost per worker (t(~)/Lal) when Z > 0, while the slope of BC is the firm's full marginal cost of exchanging
wages for Zal. The full marginal cost includes the added premium of additional insurance (3p/~Zal) minus any per-worker revenue gain for the firm (OQ/~Zal)/Lal) that results from increased output with more generous coverage. 7 The least cost strategy for firm 1 is point A, where it offers only wages as compensation. Firm 2 's isoprofit curve is given by pointA and segment DE. It can offer coverage at more favorable terms than firm 1 because its marginal cost of providing Za2 is lower. Firm 2 is just indifferent between point A, where Z = 0 and F, where coverage is offered.
W
A
D~
B'
O Z
F
Z m a x
Figure 1. The Decision to Offer Health Insurance, Absent Regulation
384 GAIL A. JENSEN AND JON R. GABEL
2.2 The Firm's Problem Under Regulation Most state insurance regulations affect the choice problem in one of three ways: they
require that Z must be at least ZR for any Z > 0, they increase t(~), or they increase the marginal cost of Z. For instance, a mandated coverage requirement (e.g., a law that states "if you offer insurance then it must cover inpatient mental health care") affects the firm's problem in the first wa~ because it restricts permissible coverage levels. A continuation-of- coverage requirement, on the other hand, raises t(I]) since employers must take on the burden of educating workers regarding their entitlement rights, collecting premiums from persons outside the current-worker pool, and monitoring the job status of persons with continuation coverage to ensure their continued eligibility. 1990 survey data suggest that transactions costs per continuation enrollee were about $150 to $240 in that year (Charles D. Spencer and Associates 1990).
State continuation-of-coverage requirements are also an example of the third variety of regulation, laws which increases the marginal cost of coverage for a firm (i.e., raise Op/3LO. Apparently, persons who elect such coverage are much higher risk than normal enrollees. Average claims of continuation enrollees have been found to be 40 to 50 percent higher than claims for normal plan participants (Charles D. Spencer and Associates 1990). State premium taxes levied on~roup plans are another example of regulations which raise the cost of each unit of insurance. It is worth noting that, since these taxes are nearly always imposed as a percent of premiums, firms facing higher per-unit costs of insurance (such as smaller firms) bear a greater absolute tax per unit of coverage.
Employers' responses vary with the type of regulation. A regulation which increases t(l~) lowers the intercept of each isoprofit curve, but leaves the slope of these curves unaffected. In terms of Figure 1, point A remains fixed but B and D shift down by amounts proportional to the increase in t(l~). 1~ Were this to occur, then clearly fLrm 2 would switch to point A, dropping coverage. A premium tax, on the other hand, makes a firm's isoprofit curves steeper. Again, firm 2 would drop coverage were its tax increased.
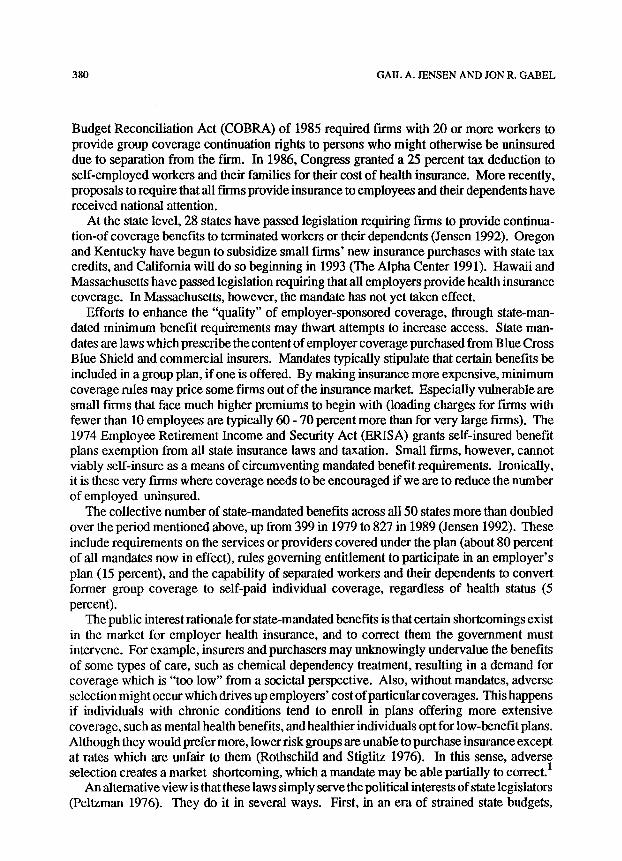
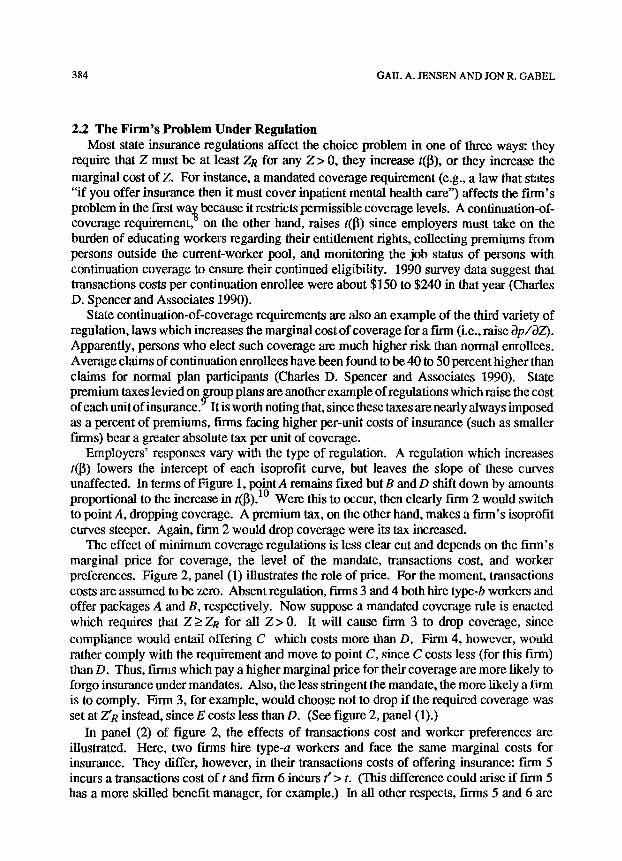
The effect of minimum coverage regulations is less clear cut and depends on the firm's marginal price for coverage, the level of the mandate, transactions cost, and worker preferences. Figure 2, panel (1) illustrates the role of price. For the moment, transactions costs are assumed to be zero. Absent regulation, firms 3 and 4 both hire type-b workers and offer packages A and B, respectively. Now suppose a mandated coverage rule is enacted which requires that Z > ZR for all Z > 0. It will cause firm 3 to drop coverage, since compliance would entail offering C which costs more than D. Firm 4, however, would rather comply with the requirement and move to point C, since C costs less (for this firm) than D. Thus, firms which pay a higher marginal price for their coverage are more likely to forgo insurance under mandates. Also, the less stringent the mandate, the more likely a firm is to comply. Firm 3, for example, would choose not to drop if the required coverage was set at Z'R instead, since E costs less than D. (See figure 2, panel (1).)
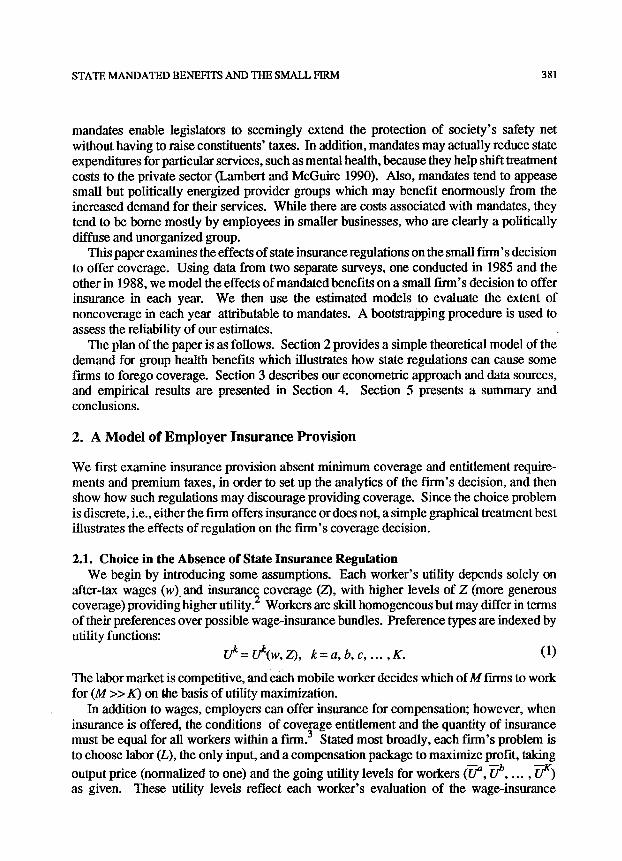
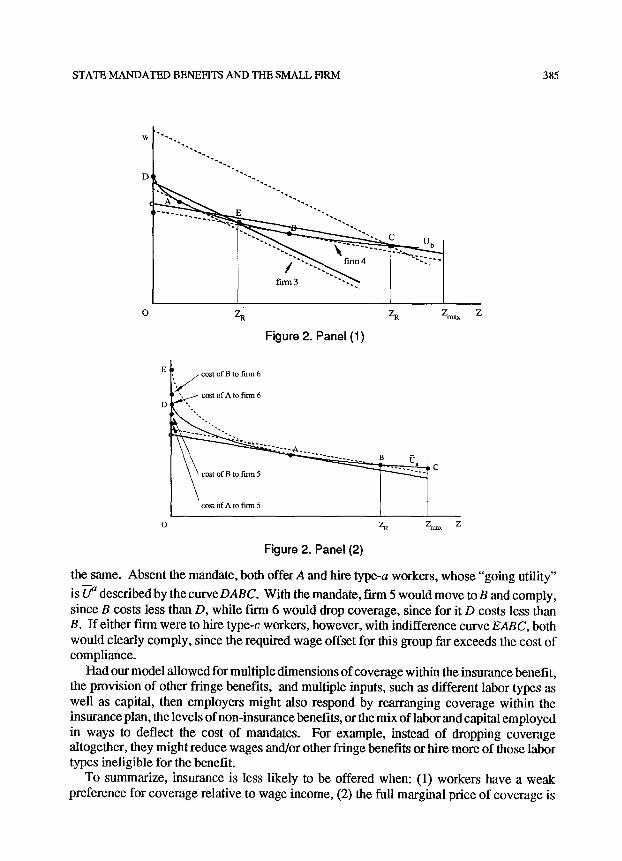
In panel (2) of figure 2, the effects of transactions cost and worker preferences are illustrated. Here, two firms hire type-a workers and face the same marginal costs for insurance. They differ, however, in their transactions costs of offering insurance: firm 5 incurs a transactions cost of t and firm 6 incurs t" > t. (This difference could arise if firm 5 has a more skilled benefit manager, for example.) In all other respects, firms 5 and 6 are
STATE MANDATED BENEFITS AND THE SMALL FIRM 385
o z~ z~ Zm~
Figure 2. Panel (1)
0 Z
/ cost of B to fn'm 6
, f " . ~ / c o s t of A to firm 6
z~ z
Figure 2. Panel (2)
the same. Absent the mandate, both offer A and hire type-a workers, whose "going utility"
is U a described by the curve DABC. With the mandate, firm 5 would move to B and comply, since B costs less than D, while firm 6 would drop coverage, since for it D costs less than B. If either firm were to hire type-c workers, however, with indifference curve EABC, both would clearly comply, since the required wage offset for this group far exceeds the cost of compliance.
Had our model allowed for multiple dimensions of coverage within the insurance benefit, the provision of other fringe benefits, and multiple inputs, such as different labor types as well as capital, then employers might also respond by rearranging coverage within the insurance plan, the levels of non-insurance benefits, or the mix of labor and capital employed in ways to deflect the cost of mandates. For example, instead of dropping coverage altogether, they might reduce wages and/or other fringe benefits or hire more of those labor types ineligible for the benefit.
To summarize, insurance is less likely to be offered when: (1) workers have a weak preference for coverage relative to wage income, (2) the full marginal price of coverage is

386 GAlL A. JENSEN AND JON R. GABEL
high, (3) transactions costs are large, and (4) minimum coverage rules, such as state mandated benefits, are sufficiently stringent. The effect of mandates will vary from one firm to the next, depending on its cost structure for health insurance and workers' preferen- ces. While some firms will drop coverage because of increased mandates, others will respond by increasing the coverage they offer to the minimums stipulated by law. In both instances, however, offsets in other aspects of compensation will occur.
3. Empirical Methodology
3.1. Econometric Approach The impact of mandates on the provision of insurance can be examined empirically using
data on firms' actual choices regarding coverage. Given a cross-section of firms, the
propensity of firm i in state s to offer insurance/~is should depend on worker preferences for coverage, measured by a vector of workers' characteristics, Dis; the marginal price it must pay for insurance, MPis; the firm's transactions cost of plan administration, Tis; and state insurance regulations, Rs:
Fiis = ,y] + ~2Di ~ + ~/3MPis + ,Y4Ti s + ~/sRs + ei s (4)
where, if ~ > 0 the firm offers insurance, otherwise not. MPis is generally unobservable; however, it should vary depending on worker demographics, Dis; the local price of medical care, Cis; firm size (a component ofEis, a vector of fn-m characteristics), and some aspects of Rs, such as premium taxes. All of these influence either the total claims or the loading charge associated with a plan, controlling for coverage. Tis is also unobservable, but should depend on fn-m characteristics Eis and possibly some components of Rs, such as whether the state requires continuation-of-coverage privileges for terminated workers. Knowing that MPis and Tis depend on Rs, Dis, Cis, and Eis, however, which are observable, we can estimate the parameters of a reduced form model for coverage:
l~is = [~1 + ~2Dis + ~3gs + ~4Eis + ~5Cis + uis. (5)
Define for each firm the indicatorlis as follows: lis = 1 i f f ~ > 0 (the firm offers insurance)
and lis = 0 iff fis < 0 (the firm does not offer insurance), lis is observable in our data, but
is not. The probability that the finn offers insurance, P(lis = 1), is
P(l~i s > O) = P(uis < 91 + ~2Dis + [J3Rs + ~4Eis + [~5Cis)
= F([~ 1 + ~2Dis + ~3Rs + ~4Eis + [~5Cis), (6)
where F is the distribution function of uis. We assume uis follows a logistic distribution and estimate the parameters of the function in (6) for each sample by the method of maximum likelihood. 11
It was noted in Section 2 that the effect of a mandate may depend on the firm's cost

STATE M A N D A T E D BENEFITS AND THE S M A L L FIRM 387
structure and worker preferences, which suggests that the function in (6) ought to allow for a full set of interactions between the vector Rs and all other variables in the model. We have not adopted such a specification because neither of our data sets are very large, and we doubt that they are strong enough to support such a generalized functional form. Thus, our estimated models should properly be interpreted as first-order approximations to the more general functions.
3.2 Simulation and Bootstrapping Upon estimating these models, we address the following question: How many firms in
each sample did not offer insurance because of the presence of state-mandated benefits? An answer requires predicting the number of firms that would offer insurance, first given actual state-mandated benefits in each year, and then given the absence of those mandates.
Conditional on the ~'s and assigned values for the explanatory variables, the aggregate proportion rj of firms offering insurance, among all firms in a set Gj, has the following asymptotic distribution (Amemiya 1985, 285):
i,s (7) A
where the summation is over all nj firms in G). Let Fis be the predicted probability of A
coverage for firm i,s given its actual values for Dis, Rs, Cis, and Eis, and Fis [ Rhs yp, the
probability conditional on the absence of state mandated benefits. 12 (The vector R hyp describes state regulation absent the mandates.) It follows from (7) that we can estimate the
change in the number of firms offering insurance ifRhs yp had applied by
Atlj l ghyP=nj[(~ ~is ] Rhyp - ~-~is~tlj] ~ (~is I hyp-- A = R s Fi s (8)
i,s J I " J
where again the summation is over all firms in Gy. Let Oj equal the proportion of t-n-ms not offering insurance in Gj that would offer it were
it not for the presence of mandates. An estimate of ej is given by
Oj= (AnjIRhs yp ~njo, (9)
~,here njo equals the number of firms in G i not offering insurance. Stated slightly differently, 0y estimates theproportion of noncove~age in Gy attributable to state-mandated benefits. For each of our two samples, we evaluate 0j first for G i equal the entire sample and then for Gj's defined on the basis of f'Lrm size and industry (and ownership with the NFIB sample). In so doing, we are able to characterize which classes of firms would have been most and least affected by changes in the ma),adated benefit laws.
What is the distribution of 0j? We need to know this in order to test statistically whether marAdates, when taken together, actually depressed fh'rn offerings of insurance. The formula for 0j is sufficiently complicated to make the derivation of its theoretical distribution far too intractable. We can, however, evaluate it empirically using the "bootstrap procedure." (See
388 GAIL A. JENSEN AND JON R. GABEL
Efron (1982) or Efron and Gong (1983).) The bootstrap is a nonpammetric statistical technique, which permits an assessment of the distribution of any sample statistic using just the data at hand. It is particularly helpful when the theoretical distribution of the statistic is unknown. ^
Specifically, we generate the empirical distribution of 0j, when Gjequals the entire sample of size n, by first drawing 100 random 'resamples' of size n from our data set, each drawn with replacement. For eacl~of these samples, the Logit model given by (6) is estimated by maximum likelihood and 0j is then computed using (9). This generates 100 bootslrap estimates of 0j, enough to calculate the standard error of this estimator and test for its statistical significance.
3.3 Data Sources and Variable Measurement We use data on the actual fringe benefit offerings of small businesses to examine the
effects of mandates and premium taxes on the provision of insurance. Our primary data are from a mail survey of small finns conducted by the National Federation of Independent Businesses (NFIB) in September 1985. NFIB represents over 500,000 small businesses (average size, around 8 employees) located throughout the country and drawn from all major industry groups. The survey gathered information on what fringe benefits were provided to full-time employees, the major features of health insurance for firms that offered it, and the characteristics of the firm and its employees, including the fn'm's location. 13 7750 member businesses of NFIB were randomly selected and sent the questionnaire, and 1439 responded. This response rate (19 percent) is typical of mail surveys of employers (Dillman 1978). 1320 firms provided data on the survey items relevant to our model. We use this set to estimate it. Thus, no imputations of missing values were made.
The low response rate to the NFIB's survey raises a question of the credibility of this sample. Might our findings simply be attributable to a peculiar sample draw? 14 For example, very small finns are notorious for not completing mail surveys. 15 Recognizing this possibility, we also estimate the model with data from a second survey, one with a much higher response rate, although not nearly as rich in terms of the information it gathered. 16 If mandates and premium taxes have their predicted effects in this second sample as well, then it is unlikely that the NFIB findings reflect any sample selection bias.
The additional data are from a 1988 survey of employer health insurance benefits conducted by the Health Insurance Association of America (HIAA). The HIAA survey, conducted in the spring of 1988, was a random sample telephone survey of 1,938 firms. The sample included large, midsized, and small firms, ranging in size from two to hundreds of thousands of employees. The sampling frame came from two sources. The f'wst was the Dun and Bradstreet (D&B) current list of firms which had applied for a loan at some point, and on whom a credit check had been conducted. Over three-quarters of the finns surveyed, including all but nine of those which did not offer insurance, came from this D&B list. The rest were drawn from a list of employers maintained by the Health Care Financing Adminislration. The response rate was 70 pereent. 17
Unlike the NFIB sample, which overwhelmingly consists of very small firms, the HIAA sample included fh-ms in all size ranges. Large firms, however, face a substantively different decision problem with regard to health insurance: they can self-insure, thereby circumvent-
STATE MANDATED BENEFITS AND THE SMALL FIRM 389
ing state mandates and premium taxes entirely. Their choice is among three alternatives: offer purchased coverage subject to state regulation, do not offer coverage, or offer self-insured coverage free from state regulation but which entails claims risk for the firm. Since our interest in this paper is the small fhxn's problem, we restrict the HIAA sample to firms with fewer than 50 workers that reported all relevant survey variables. (Most In'ms in this range cannot viably self-insure because their claims are too variable due to small enrollment.) The restriction gives us a sample of 492 small firms in 1988.18
Appendix table A.1 contains sample statistics for the specific variables used to estimate each of the two models and a brief definition of each variable. Differences in the two questionnaires preclude pooling the data sets or using an identical model specification in both years. Although we control for the same set of insurance regulations in each model, our measures of worker and firm characteristics are constrained by the questions asked on each survey.
In each model, we measure state regulations affecting insurance plans with three sets of variables. First, we control for the total number of state-mandated coverages required at the time the firm was surveyed (i.e., in 1985 for NFIB respondents and in 1988 for HIAA respondents), as well as the number newly required within the prior two years. 19 The latter allows for the possibility that a firm's reaction to new mandates was less than immediate, conceivably due to lags in learning or incurred Wansactions costs in changing its compen- sation package.
Second, five dummies measure the presence or absence (at the time the firm was surveyed) of specific mandates for: (1) psychologists' clinical services, (2) inpatient mental health coverage, (3) alcoholism trealment coverage, (4) drug abuse trealment coverage, and (5) continuation rights for terminated and laid off workers. The last specifically refers to the presence of a state law that allowed workers separated from the firm (but not necessarily dependents or separated spouses) to remain in the company plan for an established period after leaving the f'm'n (usually six months or a year), provided they paid the group rate themselves. The In'st four are controlled for individually because employers have often singled out mental health and chemical dependency mandates as being especially troublesome andcostly (Horwitz 1985; Stipp 1988; A. Foster Higgins and Co. 1990). Their concerns center on the difficulty of controlling costs in these coverage areas. The last is considered separately because of its similarity to COBRA. 2~ We expect that the presence of any of these coverage rules will decrease the probability of insurance.
Third, we control for state taxation ofinsuredplans with two variables, the state's average premium tax rate and an indicator of whether the state taxed insured plans to help finance a risk pool for "uninsurables," i.e., persons without access to 2~rou p or Medicaid coverage and whose applications for individual coverage were denied. The average premium tax is calculated as the weighted sum of the rate paid by Blue Cross Blue Shield (BCBS) and the rate paid by foreign commercial insurers at the time the firm was surveyed. 22 The appropriate weights are the relative market shares in each state for the two types of insurers, i.e., the share of group premiums paid for BCBS coverage and for commercial coverage, respectively. 23
In the 1985 sample, worker characteristics are proxied by the proportion of teenagers in the t-n-m, the proportion of women, the proportion of blacks, the proportion of part-time workers, the average income of workers (measured at the industry-state level), and an
390 GAIL A. JENSEN AND JON R. GABEL
instrumental variable for the size of the 1985 tax subsidy for employer contributions for health insurance (described below). The 1988 sample, however, contained much less information on workers. The sole demographic measure available was the proportion of women employees. To proxy preferences in our 1988 model, we enter this variable, the average income of workers (again measured at the industry-state level), and an instrument for the size of the 1988 tax subsidy for coverage. Worker income was measured at the industry-state level because neither survey contained wage information. Although measur- ing income at an aggregate level fails to account for intra industry-state wage variation, it does have an advantage. The industry-state wage is not endogenous to an individual firm. We treat it as exogenous in our estimation. 24
Our tax rate variable requires discussion. In percentage terms, the tax subsidy in a given year equals a worker's marginal tax rate in that year (the sum of the marginal federal income and FICA rates and state marginal rate). Higher tax rates lower the effective price of coverage from workers' perspective, and in terms of the indirect utility function (over wage-insurance combinations), they lower the marginal rate at which workers are willing to substitute insurance for wages. All else constant, labor pools with high marginal tax rates have a stronger preference for insurance than labor pools with low rates, because the former pay lower net prices.
There is a potential problem, however, in simply entering workers' marginal tax rate as another explanatory variable. Due to the nonlinear dependence between tax rates and income, 25 parameter estimates of the effect of either variable could be biased, and the direction of bias cannot be signed apriori. 26 We adopt an approach similar to one used by Feenberg (1987) to address this problem. For each sample we construct a variable correlated with workers' marginal lax rates but independent of income, and use it as a proxy variable for the size of the tax subsidy in those years. Our proxies for 1985 and 1988 are the state's marginal tax rate in 1984 and 1987, respectively, (the closest years for which data could be obtained) for a household with earned income of $25,000 and taking the standard deduction. Each of these variables takes on one of several values depending on the tax code in the state where the firm was located. It is income independent by construction but should be correlated with the tax subsidy in each year nonetheless. Although our use of this proxy assures us an asymptotically unbiased estimate of the effect of the tax subsidy on coverage (i.e., free of any nonlinear income effects), the fact that it is measured with some error implies that the estimated coefficient is less than efficient. The actual loss in efficiency depends on the unknown correlation between the proxy and the tax subsidies in those years.
Two local area characteristics which might influence the presence of insurance benefits are the area's unemployment rate and the price of medical services. In areas of high unemployment, workers may be more willing to work for less and take jobs without insurance benefits. The price of medical care services should be positively correlated with the premium of a least cost plan, and thus inversely related to the probability of offer. We control for both of these area variables in our models. Our medical care price index is the statewide average cost of hospital room and board at the time the firm was surveyed.
For 1985, firm size, measured by the natural logarithm of employment, and its ownership status, i.e., whether a proprietorship, partnership, or a corporation, are available to conlIol for the firm's transactions cost of offering coverage. Size also controls for differences in the price of insurance since loading charges decrease with plan size. Ownership may partially
STATE MANDATED BENEFITS AND THE SMALL FIRM 391
conlxol for the firm's age---presumably many new businesses get their start as sole proprietorships. Corporate status may indicate less employer distaste for administrative and record keeping tasks, since incorporation requires more of this (e.g., filing quarterly tax forms, a separate firm income tax return, and various documents with other government agencies). If so, the employer might feel less burdened with the duties of administering a group plan. Owners of sole proprietorships and partnerships also were also not entitled to any tax deduction for their own health insurance coverage in 1985, although aplan sponsored for employees (other than themselves) and their dependents would have qualified. Since owners often comprise a large fraction of the employees in these firms, the lesser tax advantage may have implied less willingness to sponsor insurance.
For 1988, information on firm size was available but ownership data was not. Age of the firm was available, however, and this was entered in logarithmic form. We expect older, more established firms to be more likely to offer health insurance.
4. F ind ings
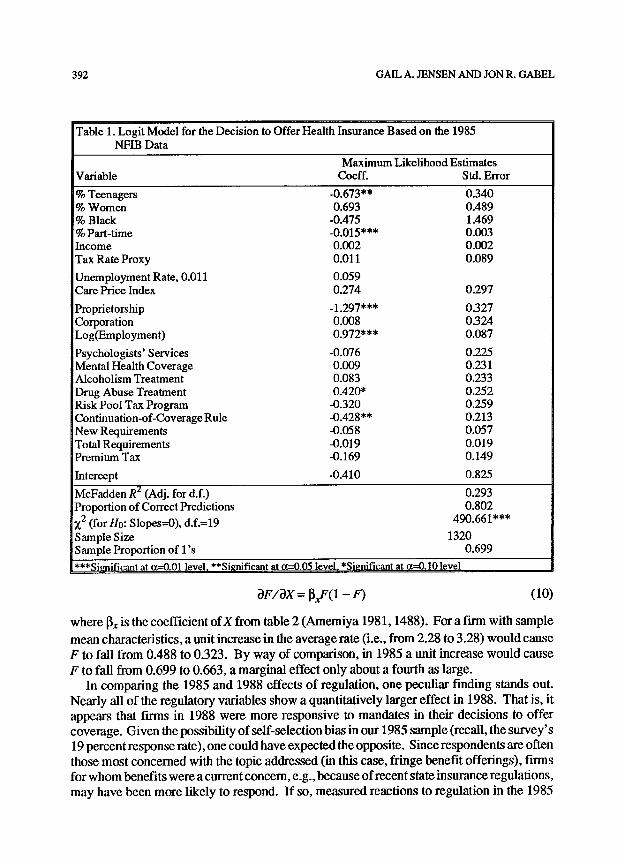
4.1. The Estimated Models Tables 1 and 2 present estimates for the parameters of the Logit choice equations, table
1 for the 1985 data and table 2 for the 1988 data. The 1988 model has a slightly better fit than the 1985 model, as indicated by the McFadden R-squares of 0.345 and 0.293, respectively.
Increased state insurance regulation has a mixed effect on a firm's offer decision. In the 1985 model, two aspects of regulation have statistically significant effects on the probability of insurance the presence of a state continuation-of-coverage option for terminated workers and the presence of a mandate for drug abuse treatment. While the former has the expected effect of depressing the likelihood of coverage, the latter has a positive effect on that likelihood. 27 Most other state regulations tend to make it less likely that coverage is offered, as one would expect, but their individual coefficients uniformly lack statistical significance. The influence of the entire group of regulatory variables was examined via a
likelihood ratio test (Amemiya 1985, 142) and the appropriate X 2 statistic (of 15.06 with 8 degrees of freedom) reveals statistical significance at the 10 percent level. Thus, when considered collectively in 1985, state-mandated benefits did decrease the probability that a small firm offered insurance.
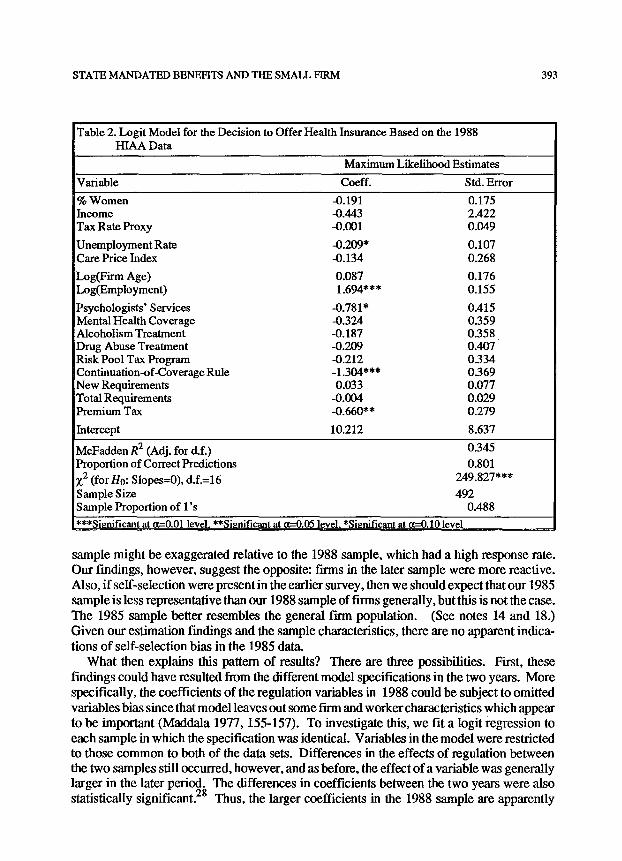
In 1988, all of the regulatory variables with one exception (new requirements) have expected negative coefficients, but here, as in 1985, only a few are statistically significant when examined individually. The significant ones are a mandate for the coverage of psychologists' clinical services, a state continuation-of-coverage requirement for terminated workers, and the average premium tax rate in the state. As a group, however, the regulatory
variables are highly significant; the associated X 2 statistic is 21.24 with 8 degrees of freedom. Thus, in 1988 as well, the collective effect of mandates was to decrease the probability that the firm offered insurance.
The probability of coverage is extremely sensitive to the premium tax rate in 1988. For the logit model, the marginal effect of a unit increase in the rate (X) on the probability (F) is given by
392 GAlL A. JENSEN AND JON R. GABEL
Table 1. Logit Model for the Decision to Offer Health Insurance Based on the 1985 NFIB Data
Maximum Likelihood Estimates Variable Coeff. Std. Error
% Teenagers -0.673** % Women 0.693 % Black -0.475 % Part-time -0.015"** Income 0.002 Tax Rate Proxy 0.011
Unemployment Rate, 0.011 0.059 Care Price Index 0.274
Proprietorship -1.297"** Corporation 0.008 Log(Employment) 0.972***
Psychologists' Services -0.076 Mental Health Coverage 0.009 Alcoholism Treatment 0.083 Drug Abuse Treatment 0.420* Risk Pool Tax Program -0.320 Continuation-of-Coverage Rule -0.428** New Requirements -0.058 Total Requirements -0.019 Premium Tax -0.169
Intercept -0.410
McFadden R 2 (Adj. for d.f.) Proportion of Correct Predictions %2 (for H0: Slopes=0), d.f.=19 Sample Size Sample Proportion of l 's
0.340 0.489 1.469 0.003 0.002 0.089
0.297
0.327 0.324 0.087
0.225 0.231 0.233 0.252 0.259 0.213 0.057 0.019 0.149
0.825
0.293 0.802
490.661"**
1320 0.699
***Significant at ~---0.01 level, **Significant at it=0.05 level I *Significant at tx=0.10 level
~F/OX = ~xF(1 - F) (10)
where I~x is the coefficient of X from table 2 (Amemiya 1981, 1488). For a firm with sample
mean characteristics, a unit increase in the average rate (i.e., from 2.28 to 3.28) would cause F to fall from 0.488 to 0.323. By way of comparison, in 1985 a unit increase would cause F to fall from 0.699 to 0.663, a marginal effect only about a fottrth as large.
In comparing the 1985 and 1988 effects of regulation, one peculiar finding stands out. Nearly all of the regulatory variables show a quantitatively larger effect in 1988. That is, it appears that firms in 1988 were more responsive to mandates in their decisions to offer coverage. Given the possibility of self-selection bias in our 1985 sample (recall, the survey's 19 percent response rate), one could have expected the opposite. Since respondents are often those most concerned with the topic addressed (in this case, fringe benefit offerings), fin'ms for whom benefits were a current concern, e.g., because of recent state insurance regulations, may have been more likely to respond. If so, measured reactions to regulation in the 1985
STATE MANDATED BENEFITS AND THE SMALL FIRM 393
Table 2. Logit Model for the Decision to Offer Health Insurance Based on the 1988 HIAA Data
Maximum Likelihood Estimates
Variable Coeff. Std. Error
% Women -0.191 0.175 Income -0.443 2.422 Tax Rate Proxy -0.001 0.049
Unemployment Rate -0.209" 0.107 Care Price Index 4). 134 0.268
Log(Firm Age) 0.087 0.176 Log(Employment) 1.694"** 0.155
Psychologists' Services -0.781" 0.415 Mental Health Coverage -0.324 0.359 Alcoholism Treatment -0.187 0.358 Drug Abuse Treatment -0.209 0.407 Risk Pool Tax Program -0.212 0.334 Continuation-of-Coverage Rule -1.304*** 0.369 New Requirements 0.033 0.077 Total Requirements -0.004 0.029 Premium Tax -0.660** 0.279
Intercept 10.212 8.637
McFadden R 2 (Adj. for elf.) Proportion of Correct Predictions Z 2 (for Ho: Slopes=0), d.f.=16 Sample Size Sample Proportion of l ' s
0.345 0.801
249.827*** 492
0.488 ***Significant at t~=0.01 level 1 **Significant at o.---0.05 level 1 *Significant at t~---0.10 level
sample might be exaggerated relative to the 1988 sample, which had a high response rate. Our findings, however, suggest the opposite: firms in the later sample were more reactive. Also, if sell-selection were present in the earlier survey, then we should expect that our 1985 sample is less representative than our 1988 sample of In'ms generally, but this is not the case. The 1985 sample better resembles the general fn-m population. (See notes 14 and 18.) Given our estimation findings and the sample characteristics, there are no apparent indica- tions of self-selection bias in the 1985 data.
What then explains this pattern of results? There are three possibilities. First, these findings could have resulted from the different model specifications in the two years. More specifically, the coefficients of the regulation variables in 1988 could be subject to omitted variables bias since that model leaves out some fn'm and worker characteristics which appear to be important (Maddala 1977, 155-157). To investigate this, we fit a logit regression to each sample in which the specification was identical. Variables in the model were restricted to those common to both of the data sets. Differences in the effects of regulation between the two samples still occurred, however, and as before, the effect of a variable was generally larger in the later period. The differences in coefficients between the two years were also statistically significant. 28 Thus, the larger coefficients in the 1988 sample are apparently
394 GAIL A. JENSEN AND JON R. GABEL
not due to the different specifications in each year. Another possibility is that the larger coefficients stem from some systematic difference
between the two samples, aside from their different response rates. If 1988 firms were closer to their "margin of offer" by virtue of their different characteristics relative to 1985 firms, then perhaps the stronger effects of regulation in 1988 can be understood. As noted earlier, our 1988 firms are larger on average than the 1985 firms. Clearly, this would have placed them closer to their margin of offer because they would have faced lower prices for health insurance. It is possible that firms in the 1988 sample were also more often incorporated, in which case their tax break for employer-sponsored coverage would have been larger. Our 1988 data does not identify the firm's corporate status, however, there are some reasons to suspect that these firms were incorporated more often than firms in the 1985 sample. First, they are larger and corporate status is known to increase with size of the f'nan. Second, over three-quarters of all sole proprietorships are in construction, retail trade, and the services sector (Small Business Administration 1986), but only half of our 1988 sample is in these induslries. Third, the D&B employer registry from which most of the 1988 sample was drawn consists of firms applying for credit on which a credit check was conducted. If a business desires a loan it is better off from a risk standpoint to be incorporated, because then the lender cannot seize the personal possessions of the entrepreneur (e.g., his or her home) in the event of default. Firms on the registry may have had a good reason to incorporate. Thus, firm size and corporate-status differences between the two samples may partly explain the stronger effects of regulation in 1988.
Finally, it is possible that the model itself changed between the two years because of shifts in both the demand and supply of small group coverage. For example, demand may have increased due to the generally improved health of small firms in 1988. As gauged by the federal government's "Small Business Health Index," 1988 was a much better year for small businesses than 1985 (Small Business Administration 1990). There were fewer firm bankruptcies than in 1985 and small firm employment was rising. With firms faring better, their demand for insurance may well have been greater in 1988 than in 1985. Important aspects of supply also differed in the two years. In 1985, the number of insurance company suppliers was large and premiums were stable. For example, premium increases averaged less than 4 percent over 1984 levels (Gabel and Jensen 1992). In 1988, however, there were many fewer companies selling coverage (Formisano 1989), and premium increases were at near-record levels. The average premium increase was about 12 percent over 1987 levels. The net effect of these combined market-wide changes is unclear, but it is possible that they too account for part of the observed differences in the effects of regulation between the years.
Turning to other variables in the models, worker characteristics that significantly lower the probability of insurance are the percent of teenage workers and the percent of part-time workers in 1985. (See table 1.) Since employees in either category are more likely to already have coverage under a spouse's or parent's policy (Chollet 1988), their preference for insurance as an-own fringe benefit is naturally weakened. Also, worker turnover is probably higher in firms employing more teens or part-timers, which would serve to raise the transactions cost of offering a plan. The percent of Blacks in 1985 is unimportant. The percent of women employees and average worker income in both years are also insignificant. These last findings may partly be an artifact of measurement error, since both variables were appended at an industry-state level in both years. Measurement error may have biased their
STATE MANDATED BENEFITS AND THE SMALL FIRM 395
coefficients towards zero (Maddala 1977, 293-294). At least the 1988 model, which has a better fit overall and which qualitatively accords with expectations, shows a negative effect for both women and income on the likelihood of coverage. This is consistent with prior studies which were able to incorporate firm-specific sex and income measures (e.g., Sloan and Adamache (1986) and Jensen (1986)).
Our marginal tax rate proxy is statistically insignificant in both years but has the expected positive coefficient only in 1985. In theory, a unit decrease in the marginal tax rate should have nearly the same effect on coverage as a unit increase in the premium tax. Both changes raise workers' net price of insurance by approximately one percent (assuming insurers' supply of policies is elastic). In other words, if x equals the premium tax, t the marginal tax rate, and p the net price of insurance, then
~F/ (~p /p ) -- ~ F / ~ and ~F / (~p /p ) = - ~F/~t. (11)
This implies that the coefficient of the tax rate variable should be roughly equal to minus the coefficient of the premium tax. This is not the case in either year.
The formulas in (11) suggest that we can indirectly estimate the price elasticity of the small firm's probability-of-offer in a number of ways: using our estimate of (OF/bx), our estimate of ( - OF/Ot), or by using both of these, e.g., we could simply average the two elasticity estimates implied by (OF/~r) and ( - bF/Ot), respectively. Using this last ap- proach, which has the advantage of using both sources of information, we estimate that a one percent premium subsidy would have increased the proportion of sample firms offering coverage by 0.018 in 1985 (from 0.699 to 0.717) and by 0.089 in 1988 (from 0.488 to 0.577) in 1988. 29 Both estimates suggests that the rate of employer coverage is, indeed, very sensitive to the price of a plan. We are inclined to give more weight to the 1985 estimate, because its model is more thoroughly specified.
Area unemployment is insignificant in 1985 but has a significant negative effect on provision in 1988. Our medical care price index (the cost of a day's hospital room and board in the area) is insignificant in both years.
Most previous studies have shown that larger firms are more likely to provide insurance and our findings here strongly concur. The probability of coverage increases sharply with firm size in both years. In 1985, the average predicted probability is 0.56 for firms with under 10 employees, 0.87 for firms with 10-19 employees, 0.95 for firms with 20-49 employees, and 0.98 for finns with 50 or more workers. The average predictions for 1988 are 0.25 (firms with under 10 employees), 0.71 (10-19 employees), and 0.89 (20-49 employees).
Proprietorships are about half as likely as corporations to offer coverage, and significantly less likely than partnerships (our omitted category). As noted earlier, this may be due to a greater distaste for administrative paperwork among sole proprietors, or the less generous tax subsidy for insurance purchases in such firms. In 1985, a self-employed person could not claim as a business expense the cost of his own health insurance even if that coverage was provided through the firm's plan. In a corporation, the deduction was far more generous; the cost of covering all employees, including the owner if also an employee, was an allowable business cost, therefore exempt from both corporate and personal income tax. Firm age, available only in the 1988 model, is insignificant.
396 GAIL A. JENSEN AND JON R. GABEL
4.2 Simulation of the Effects of Mandates How many more firms in each year would have offered insurance were it not for the
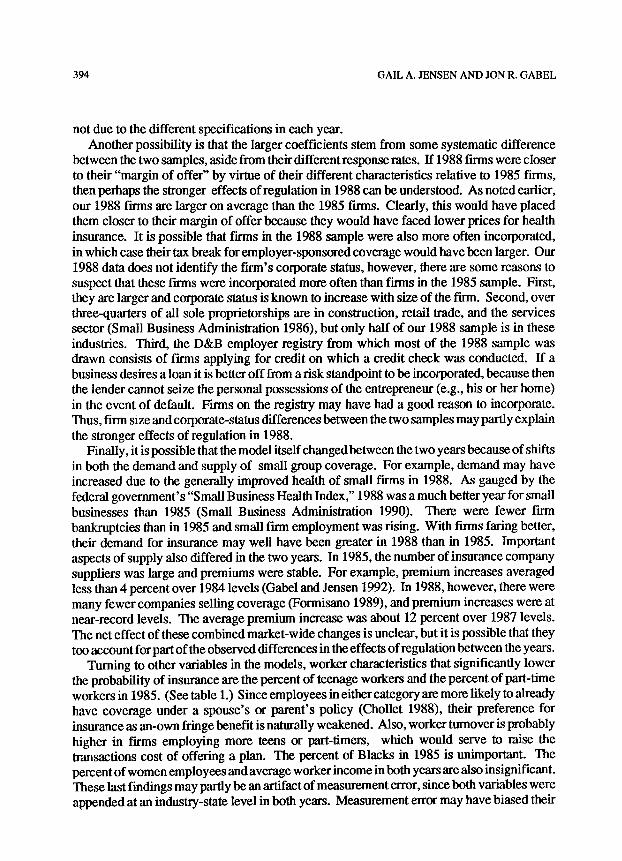
presence of state-mandated coverages? Table 3, consa'ucted using the bootstrap methods described in Section 3, provides an answer. In 1985, 397 of the 1320 firms did not offer coverage. Among the firms not offering, 19.7 percent (nearly one in five) would have if all state-mandated benefits had been absent. In 1988, the effects are even larger. In that sample, 252 of the 492 firms (with under 50 workers) chose not to offer coverage. 43.4 percent, or just over two in five, of those not offering would have were it not for state-mandated benefits. These amounts of noncoverage attributable to mandates are significantly different from zero in both samples.
Table 3. Bootstrap Estimates of Noncoverage Attributable to Mandated Coverage Requirements
1985 1988 NFIB HIAA
Sample Sample 01 = proportion of noncoverage due to all mandates
A
mean of 100 bootstrap estimates 01 of 01 0.197 0.434 standard error of ~1 0.108 0.122 minimum ~1 -0.076 0.083 maximum ~1 0.501 0.717
two-tailed t-test of H0:01 = 0 F Ha: 01 ~ 0 1.824" 3.557***
02 = proportion of noncoverage due solely to continuation-of-coverage requirements for
terminated workers mean of 100 bootstrap estimates ~2 of 0 2 0.035 0.193 standard error of ~2 0.016 0.047 minimum ~2 -0.001 0.074 maximum ~2 0.063 0.294
two-tailed t-test of Ho: the~ = O, Ha: 02 ~ 0 2.189** 4.106*** ***Si,qnificant at ~=0.01 level, **Si,qnificant at ~=0.05 level, *Si,qnificant at ~=0.10 level
Given the significant effects of a state continuation-of-coverage option for terminated workers discussed earlier, it was of interest to evaluate noncoverage attributable to this mandate alone. Table 3 reports our findings. In 1985, 3.5 percent of the "non-offerors" would have been "offerors" in a world free of state continuation-of-coverage requirements, while, in 1988, 19.3 percent would have been offerors. Both attributed amounts are statistically significant.
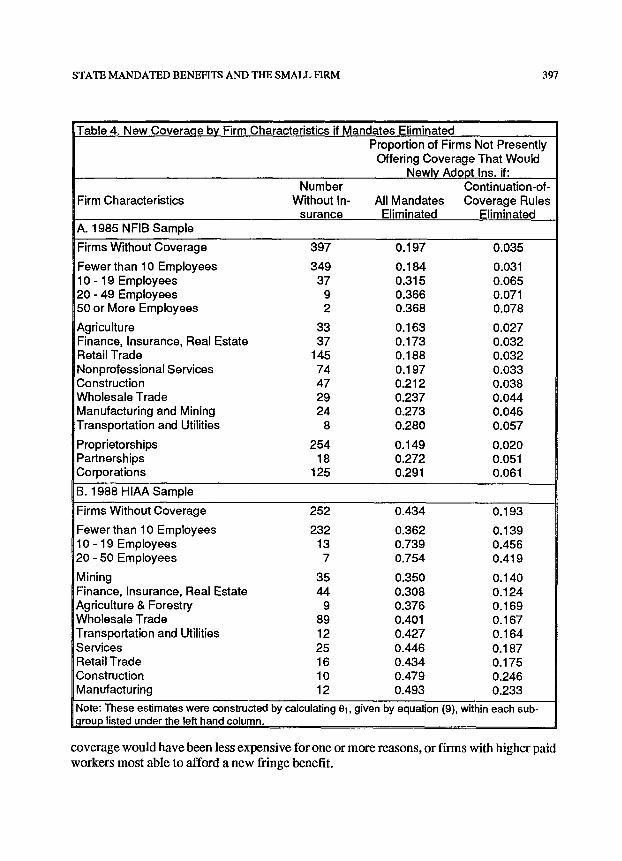
As table 4 shows, the potential gains in coverage associated with the absence of state-mandated benefits would have occurred for all size classes, industries, and ownership categories of firms, with the largest gains occurring for those firm classes which most likely were closest to the "margin of offer:" larger firms that did not already offer coverage, industries employing somewhat higher paid labor (wholesale trade, transportation, utilities, and manufacturing), and corporations. These categories describe either firms for which
STATE MANDATED BENEFITS AND THE SMALL FIRM 397
Firm Characteristics
A. 1985 NFIB Sample
Table 4. New Covera.qe by Firm Characteristics if Mandates Eliminated Proportion of Firms Not Presently
Offering Coverage That Would Newly Adopt Ins. if:
Number Continuation-of- Without In- All Mandates Coverage Rules
surance Eliminated Eliminated
Firms Without Coverage 397 0.197 0.035
Fewer than 10 Employees 349 0.184 0.031 10 - 19 Employees 37 0.315 0.065 20 - 49 Employees 9 0.366 0.071 50 or More Employees 2 0.368 0.078
Agriculture 33 0.163 0.027 Finance, Insurance, Real Estate 37 0.173 0.032 Retail Trade 145 0.188 0.032 Nonprofessional Services 74 0.197 0.033 Construction 47 0.212 0.038 Wholesale Trade 29 0.237 0.044 Manufacturing and Mining 24 0.273 0.046 Transportation and Utilities 8 0.280 0.057
Proprietorships 254 0.149 0.020 Partnerships 18 0.272 0.051 Corporations 125 0.291 0.061
B. 1988 HIAA Sample
Firms Without Coverage 252 0.434 0.193
Fewer than 10 Employees 232 0.362 0.139 10 - 19 Employees 13 0.739 0.456 20 - 50 Employees 7 0.754 0.419
i
i Mining 35 0.350 0.140 Finance, Insurance, Real Estate 44 0.308 0.124 Agriculture & Forestry 9 0.376 0.169 Wholesale Trade 89 0.401 0.167 Transportation and Utilities 12 0.427 0.164 Services 25 0.446 0.187 Retail Trade 16 0.434 0.175 Construction 10 0.479 0.246 Manufacturing 12 0.493 0.233
Note: These estimates were constructed by calculating 01, given by equation (9), within each sub- ,qroup listed under the left hand column.
coverage would have been less expensive for one or more reasons, or firms with higher paid workers most able to afford a new fringe benefit.
398 GAIL A. JENSEN AND JON R. GABEL
5. Conclusion
This paper has investigated the extent to which state-mandated benefit requirements and state premium taxes discourage small firms in the private sector from providing health benefits by raising the price of a least-cost plan and/or by making coverage more difficult for these firms to administer. An analysis of data from two separate surveys revealed that most individual mandates did not significantly lower the probability of insurance provision among sample employers, but taken collectively they did. In their totality state-mandated benefits caused a significant drop in the small firm's propensity to offer insurance.
Altogether mandates accounted for 19.7 percent of noncoverage among firms in the 1985 NFIB sample and 43.4 percent of noncoverage among firms in the 1988 HIAA sample. A bootstrapping procedure showed that these cumulative effects of mandates in both years were statistically significant. State continuation-of-coverage requirements were found to be particularly troublesome, and by themselves accounted for 3.5 percent of the noncoverage in the 1985 sample and 19.6 percent in the 1988 sample. Administrative costs associated with continuation rules were apparently quite high for some businesses and weighed heavily in their offer decisions.
The much greater effects of mandates in the 1988 sample are somewhat enigmatic. Perhaps the most plausible explanation is that there indeed are substantial differences in firms' corporate status between the two samples, such that the 1988 firms were much closer to their "margin of offer." In any case, we attach more credence to the 1985 simulations because that year's model was more completely specified, and other estimates from it, such as its implied price elasticity of demand, also are more reasonable.
The general problems with surveys of small businesses, which we encountered here, call for regarding our findings as tentative. Specifically, we cannot completely rule out the possibility that our 1985 results merely stem from sampling response bias, and our 1988 results, from specification bias. The fact that the simulated effects are qualitatively the same, however, does make it less likely.
Also, our findings probably do not generalize to all small firms. The 1985 sample was drawn from NFIB members, which presumably are older, more stable, and profitable than most small businesses. The 1988 sample was drawn largely from the D&B list of firms which had gone into the capital markets at some time. Arguably, finns applying for loans are more stable and profitable, and more likely to be corporations rather than sole proprietor- ships. There is evidence that D&B's registry also underrepresents very young firms (Malholtra et al. 1980). These features suggest that fh'ms in both samples may have been closer to the "margin of offering coverage," in which case our findings may be overstating the effects of mandates. A large nationwide random survey of small firms in which participation was high and detailed data was gathered would undoubtedly provide the opportunity for a more accurate analysis. Unfortunately, data like this do not exist at this time. Nonetheless, our findings strongly suggest that mandates do discourage some firms from offering insurance.
We have not addressed other possible consequences of mandates, such as decreases in wages and/or other fringe benefits for firms that do not drop coverage, reductions in workers eligible to participate in an employer's plan, and conversions to self-insurance among firms large enough to do so. Regarding the last of these, recent research by one of the authors
STATE MANDATED BENEFITS AND THE SMALL FIRM 399
suggests that mandates were not a very important factor in employers' moves to self-in- surance in the 1980s. 3~
Elected officials are considering two strategies to expand employment-based coverage: the first, an all-employer mandate to offer coverage, 31 the second, public policies that might encourage more firms to voluntarily sponsor coverage. This study bears on the second. Our results suggest that exempting very small firms from mandated benefit requirements may increase coverage. Alternatively, provi~ng stronger incentives through a premium subsidy would also stimulate greater coverage. ~ Our indirect estimate of a premium elasticity based on the NFIB data, for example, suggests that the rate of voluntary coverage among sample firms would have risen by about 9 percentage points (i.e., from 69.9 to 78.9) given only a five percent discount on price.
In 1991, the United States again entered a period of recession. Historically, during such times employment growth is concentrated among smaller firms, where the decision to offer health insurance hinges on the extent of state mandated benefits. If employment growth over the next few years indeed occurs within this sector, and if the number of state-mandated benefits continues to grow, we should expect a growing proportion of small firms to forgo coverage, further swelling the ranks of our nation's uninsured.
Notes
This research began while Gail Jensen was employed at the University of Illinois at Chicago (UIC) and Jon Gabel was employed at the Health Insurance Association of America. We thank Michael Morrisey, Li Way Lee, Randy Ellis, Joseph Newhouse, Allen Goodman, Stephen Spurt, and Philip Grossman for providing useful comments on an earlier draft, Zhou Zhiyuan for his excellent research assistance, and Denny Dennis for making the NFIB data available to us.
1. It is possible to show theoretically that, if chosen correctly, a mandate can improve on the competitive market outcome. That is, in the presence of adverse selection mandating a particular level of coverage would raise the well being of both low and high risk purchasers.
2. This function is an "indirect" utility function in the sense that wages only improve well-being by allowing a greater consumption of goods that provide direct utility, and insurance coverage only by reducing the risk of financial loss in the event of illness. The indirect utility function might be, say, the maximand for a worker maximizing expected utility over possible states of illness and spending wage income on the purchase of medical care and other consumption goods. For simplicity, the tax treatment of employer health insurance contributions will not be made explicit in this model. To do so would require rewriting the indirect utility function as
U k= Ut((1 - ~) wg,~,ss- (1 -~.)p(Z, l),Z), where ~ is the tax rate on wage income, Wgross the pretax wage, ~, the share of the premium paid by the employer, and p(Z,/) the per enrollee group rate. The model here would predict that Z = 1 for all f inns that offer insurance. Also, for simplicity Z is assumed to be one dimensional. An extension of this model is contained in Jensen (1986) in which Z is multidimensional, taxes are modeled explicitly, and which allows for heterogeneous preferences within finns to generate situations in which ~, < 1.
3. Thus, we nile out multiple plan offerings by assumption. Jensen (1986) provides a model where multiple plan offerings can arise. Even there, the predicted effects of minimum coverage requirements would be similar to those suggested by this model.
4. For a proof, see Result 3 in Jensen (1986). 5. As Danzon (1989) has noted for a similar insurance provision model, this description of labor market
equilibrium may be inconsistent with competitive equilibrium in the product market, since it implies potentially differing costs across f inns for the same type of labor. Firms with higher labor costs, presumably the smaller firms, can survive only if they (i) operate in a different product market, (ii) possess some advantage over lower cost firms, such as a better capability to provide other desirable job attributes, (iii) employ ales s mobile factor, e.g., the "owner" of the finn, who is willing to bear the higher cost of labor, or (iv) they can draw on a pool of workers who prefer compensation as wages only for one reason or another.
400 GAIL A. JENSEN AND JON R. GABEL
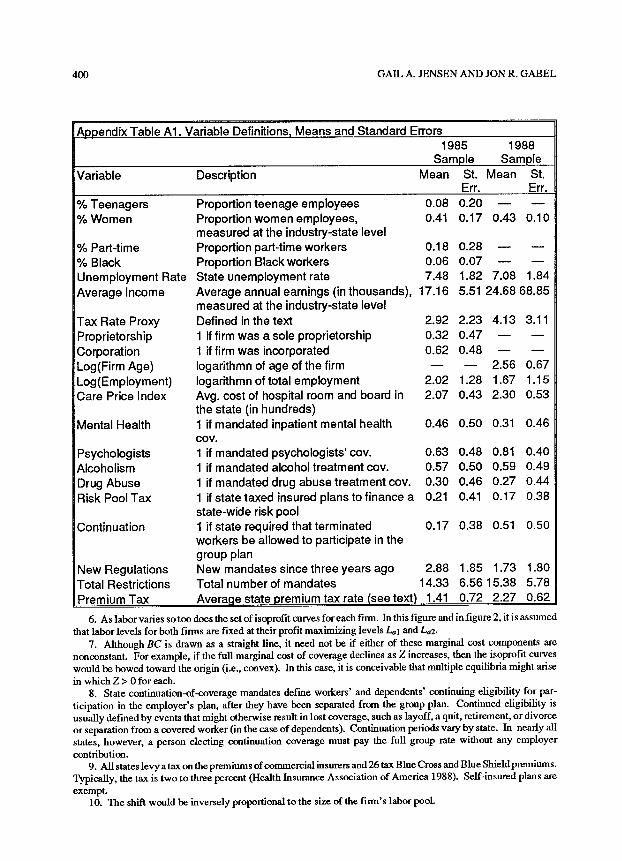
Appendix Table A1. Variable Definitions, Means and Standard Errors 1985 1988
Sample Sample Variable Description Mean St. Mean St.
Err. Err. % Teenagers Proportion teenage employees 0.08 0.20 - - w
%Women Proportion women employees, 0.41 0.17 0.43 0.10 measured at the industry-state level
% Part-time Proportion part-time workers 0.18 0.28 - - - - % Black Proportion Black workers 0.06 0.07 - - - - Unemployment Rate State unemployment rate 7.48 1.82 7.08 1.84 Average Income Average annual earnings (in thousands), 17.16 5.51 24.68 68.85
measured at the industry-state level Tax Rate Proxy Defined in the text 2.92 2.23 4.13 3.11 Proprietorship 1 if firm was asole proprietorship 0.32 0.47 - - - - Corporation 1 if firm was incorporated 0.62 0.48 - - Log(Firm Age) Iogarithmn of age of the firm - - - - 2.56 0.67 Log(Employment) Iogarithmn of total employment 2.02 1.28 1.67 1.15 Care Price Index Avg. cost of hospital room and board in 2.07 0.43 2.30 0.53
the state (in hundreds) Mental Health 1 if mandated inpatient mental health 0.46 0.50 0.31 0.46
coy. Psychologists 1 if mandated psychologists'coy. 0.63 0.48 0.81 0.40 Alcoholism 1 if mandated alcoholtreatment coy. 0.57 0.50 0.59 0.49 Drug Abuse 1 if mandated drug abuse treatment cov. 0.30 0.46 0.27 0.44 RiskPoolTax l i fstatetaxedinsuredplanstof inancea 0.21 0.41 0.17 0.38
state-wide risk pool Continuation 1 if state required that terminated 0.17 0.38 0.51 0.50
workers be allowed to participate in the group plan
New Regulations New mandates since three years ago 2.88 1.85 1.73 1.80 Total Restrictions Total number of mandates 14.33 6.56 15.38 5.78 Premium Tax Average state premium tax rate (seetext) 1.41 0.72 2.27 0.62
6. As labor varies so too does the set of isoprofit curves for each finn. In this figure and in figure 2, it is assumed that labor levels for both finns are fixed at their profit maximizing levels La 1 and La2.
7. Although BC is drawn as a straight line, it need not be if either of these marginal cost components are nonconstant. For example, if the full marginal cost of coverage declines as Z increases, then the isoprofit curves would be bowed toward the origin (i.e., convex). In this case, it is conceivable that multiple equilibria might arise in which Z > 0 for each.
8. State continuation-of-coverage mandates define workers' and dependents' continuing eligibility for par- ticipation in the employer's plan, after they have been separated from the group plan. Continued eligibility is usually defined by events that might otherwise result in lost coverage, such as layoff, a quit, retirement, or divorce or separation from a covered worker (in the case of dependents). Continuation periods vary by state. In nearly all states, however, a person electing continuation coverage must pay the full group rate without any employer contribution.
9. All states levy a tax on the premiums of commercial insurers and 26 tax Blue Cross and Blue Shield premiums. Typically, the tax is two to three percent (Health Insurance Association of America 1988). Self-insured plans are exempt.
10. The shift would be inversely propoitional to the size of the f inn 's labor pooL
STATE MANDATED BENEFITS AND THE SMALL FIRM 401
11. Specifically, we maximize the log likelihood function:
r;~ log F(I~I + I~O~ + I ~ , + Ihe;~ + ISsC~) + ~ <1 - r~) log (1 - P<I~I + 1~20~, + 13~, + Ihe;, + 1~5C,'~). A A A
12. This second probability F~ I R ~ p is given by~i , [ R~n'= exp (li~)/(1 + exp (I/s)), where A A A A A �9 A �9
Ii, = 61 + f3zDi~ + f33R~ t' + ~4Ei, + ~35Ci~ 13. For descriptive statistics from the NFIB survey, such as the characteristics of firms that do and do not offer
coverage and the reasons reported for not offering, see Dennis (1985). 14. A simple comparison of the size and industry distributions for this sample to those for all United States
employers reveals no biases along either dimension. The distribution of all United States f inns by size is: fewer than 10 employees, 0.75; 10 - 19 employees�9 0.12; 20 - 49 employees�9 0.08; and 50 or more employees, 0.05. The comparable proportions for the NFIB sample of 1320 are 0.61,0.18, 0.12, and 0.08, respectively. By industry the distribution of all United States firms is: transportation, 0.04, agriculture, 0.03�9 manufacturing and mining, 0.10, construction, 0.14, financial services, 0.07�9 and trade and services 0.62. The comparable proportions for the NFIB sample are 0.04, 0.06, 0.14, 0.13, 0.09, and 0.54. The statistics for all United States firms are from Small Business Administration (1990, 74-75).
15. For example, the Small Business Administration's 1986 mail survey of employer health insurance coverage achieved only a 19.3 percent response rate after making numerons phone calls to nonrespondents requesting participation (ICF Incorporated 1987). For firms with fewer than 25 workers, the response rate was 16.2 percent.
16. Certainly, the best situation would be to have very detailed data from a high-response-rate survey, representative of all small businesses�9 but data like this simply do not exist to our knowledge.
17. Descriptive findings from the 1988 HIAA survey are reported in Gabel et al. (1989). 18. The distribution of these 492 firms by firm size is: fewer than 10 employees, 0.69; 10 - 19 employees, 0.12;
and 20 - 49 employees, 0.19. For all United States firms with under 50 workers the comparable distribution i s :
fewer than 10, 0.79; 10 - 19 employees, 0.13; and 20 - 49 employees, 0.08 (Small Business Administration 1990). The distribution of the sample by industry is: transportation, 0.05; agriculture, 0.09; manufacturing and mining, 0.17; construction, 0.10; financial services, 0.09; retail trade, 0.09; wholesale trade 0.18; and services, 0.29. (See note 14 for the industry distribution of all United States firms.) Thus, our 1988 sample nnderrepresents firms in the smallest size category. We retum to this point later.
19. These two variables and the dummies for whether or not particular mandates were present (to be discussed shortly) were constructed from information reported in Blue Cross and Blue Shield Association (1989). A requirement that a coverage be offered for sale was not connted as a mandate, rather the regulation had to require that the coverage be included in the purchased plan.
20. Unlike COBRA, however, the state coutinuation-of-coverage laws usually do not exempt the smallest of firms from compliance. For details on the state laws see Hewitt Associates (1985).
21. A few states finance the subsidy for a risk pool by other means, e.g., with a tax on hospital stays (FL and NY) or through general state revenues (IL). Unless the method was through a premium surtax, the risk pool tax indicator took the value zero. These data were from Health Insurance Association of America (1988).
22. Foreign commercial insurers are insurance companies whose headquarters are outside the state. 23. The data on premium taxes were taken from the National Association of Life Underwriters (1985) for the
1985 sample and from Health Insurance Association of America (1988) for the 1988 sample. The data on relative market shares in the state from Health Insurance Association of America (1981). More recent reliable data on state market shares is simply nnavailable.
24. If a finn-specific wage variable were used�9 it would have to be treated as endogenous in estimation.
25. The marginaltax rate ~ is apparently well approximated by ~ = flow al where the degree of progressivity in the tax code is reflected by 0q (Sloan and Adamache 1986).
26. A nonlinear dependence among two explanatory variables in a linear regression is not a source of bias provided a linear functional form is indeed the correct specification. If, however, the true functional form for the model is not known a priori, then it is possible that one of the variables is simply proxying the effect of improperly excluded polynomials of the other variable or interactions of the two. Unfortunately, entering nonlinear terms for both variables cannot satisfactorily solve this identification problem, because to do so invites the problem of multicollinearity.
27. It is conceivable that certain expenditures, such as for drag abuse treatment, could reduce outlays for other types of medical care to such an extent that offering insurance for the former, e.g., drug abuse treatment coverage, would actually lower a plan's premium. If this were indeed the case, but firms were unknowledgeable about it, then mandating such coverage might make a firm more likely to purchase insurance.
28. We tested for differences in both individual coefficients between 1985 and 1988, and differences in the
402 GAlL A. JENSEN AND JON R. GABEL
entire specification between the two years. Mandates with statistically significantly differences in their coefficients between 1985 and 1988 (at the .10 percent level or higher) included continuation-of-coverage rights, dmg abuse treatment coverage, and psychologists' coverage. A likelihood ratio test for overall differences between the two years also indicated significant differences at the 0.01 percent level. The associated ~2 statistic (Amemiya 1985, 142) was 39.72 with 15 degrees of freedom.
29. These estimates of firm price responsiveness are statistically different from zero at the 10 percent level in 1985 and at the one percent level in 1988, using a one-tailed asymptotic t-test. The standard error of the estimate of the absolute change in probability is 0.14 in 1985 and 0.044 in 1988.
30. See Jensen et al. (1992) on the effects of state regulation on the decision to self-insure. 3 I. Danzon (1989) provides a good theoretical treatment of the effects of mandating that all employers provide
coverage. Also see Chollet (1987b; 1988) and Morrisey (1991) for an assessment of options to reduce the number of uninsured.
32. The recent Oregon program is an example of the second. The state offers a tax credit to businesses with fewer than 25 employees who have not offered health insurance during the past two years. The credit, which equals the lesser of $25 per month per employee or 50 percent of total insurance costs for all employees, is phased out over a five-year period.
References
A. Foster Higgins and Co., Inc. 1990. Mental Health and Substance Abuse Benefits. Princeton, NJ: Foster Higgins ' Survey and Research Services.
The Alpha Center. 1991. Health Care for the Uninsured: State Initiatives. Washington, DC: The Apha Center.
Amemiya, Takeshi. 1981. "Qualitative Response Models: A Survey." Journal of Economic Literature 19(4): 1483-1536.
Amemiya, Takeshi. 1986. Advanced Econometrics. Cambridge, MA: Harvard University Press. Blue Cross and Blue Shield (BCBS) Association. 1989. Mandated Coverage Laws Enacted through
1988. Washington, DC: BCBS Association. Charles D. Spencer and Associates. 1990. Spencer Research Reports on Employee Benefits (July
Report). Washington, DC: Charles D. Spencer and Associates. Chollet, Deborah J. 1987. "Public Policy Options to Expand Health Insurance Coverage Among the
Nonelderly Population." In Government Mandating of Employee Benefits. Washington, DC: Employee Benefit Research Institute.
ChoUet, Deborah J. 1988. "Uninsured Workers: Sources and Dimensions of the Problem." Working Paper, Employee Benefit Research Institute, Washington, DC.
Danzon, Patrieia M. 1989. "Mandated Employment-B ased Health Insurance: Incidence and Efficiency Effects." Working Paper, University of Pennsylvania, Philadelphia, PA.
Demkovich, Linda. 1986. "ERISA and the States." In lntergovernmentalHealthPolicy Project: Focus On. Washington, DC: George Washington University.
Dennis, William J. Jr. 1985. SmallBusiness Employee Benefits. Washington, DC: National Federation of Independent Business.
Dillman, Den. 1978. TotalDesign Method. Seattle, WA: University of Washington Press. Efron, Bradley and Gail Gong. 1983. "A Leisurely Look at the Bootstrap, the Jackknife and
Cross-Validation." American Statistician 37(1 ): 36-48. Efron, Bradley. 1982. The Jackknife, the Bootstrap and Other Resarnpling Plans. Philadelphia, PA:
Society for Industrial and Applied Mathematics. Feenberg, Daniel. 1987. "Identification in Tax-Price Regression Models: The Case of Charitable
Giving." National Tax Journal40(4): 629-633. Freedman, David A. and Stephen C. Peters. 1984. "Bootstrapping a Regression Equation: Some
Empirical Results." Journal of the American Statistical Association 79(385): 97-106.
STATE MANDATED BENEFITS AND THE SMALL FIRM 403
Formisano, Roger, 1989. "Cyclic Behavior of Health Insurance Results: An Exploratory Analysis." Benefits Quarterly 5(3): 51-57.
Gabel, Jon R. and Gail A. Jensen. 1992. "Can a Universal Coverage System Temper the Underwriting Cycle?" Inquiry 29(2): 249-262.
Gabel, Jon R., Steven DiCarlo, Steven Fink, and Gregory de Lissovoy. 1989. "Employer Sponsored Health Insurance in America." Health Affairs 8(2): 117-122.
Goldstein, Gerald S. and Mark V. Pauly. 1976. "Group Health Insurance as a Local Public Good." In The Role of Health Insurance in the Health Services Sector, edited by Richard N. Rosett. New York: National Bureau of Economic Research.
Health Insurance Association of America (HIAA). 1981. Source Book of Health Insurance Data. Washington, DC: HIAA.
Health Insurance Association of America ( I - I ) . 1988. Information on State Insurance Regulations, Unpublished Document, HIAA, Washington, DC.
Hewitt Associates. 1985. Continuation of Group Medical Coverage: A Study of State Laws. Lin- colnshire, IL: Hewitt Associates.
Horwitz, Sad. 1985. "Mandatory Health Benefits Debated."The Washington Post (August 19th): B 1. ICF Incorporated. 1987. Health Care Coverage and Costs in Small andLarge Businesses, Final Report
Prepared for the U.S. Small Business Administration. Washington, DC: ICF Incorporated. Jensen, Gall A. 1986. Employer Choice of Health Insurance Benefits. Unpublished Ph.D. Dissertation,
University of Minnesota, Minneapolis, MN. Jensen, Gall A. 1992. "Regulating the Content of Health Plans." In American Health Policy: Critical
Issues for Reform, edited by Robert Helmes. Washington, DC: AEI Press. Jensen, Gail A., Michael A. Morrisey, and Kevin D. Cotter 1992. "State Mandated Benefits and the
Decision to Self-Fund," Working Paper, Wayne State University, Detroit, MI. Kronick, Richard. 1991. "Health Insurance, 1979-1989: The Frayed Connection Between Employment
and Insurance." Inquiry 28(4): 318-332. Lambert, David A. and Thomas G. McGuire. 1990."Political andEconomic Determinants of Insurance
Regulation in Mental Health." Journal of Health Politics, Policy andLaw 15(1): 169-189. Maddala, G.S. 1977. Econometrics. New York: McGraw Hill. Malhotra, Suresh, Kenneth M. McCaffree, John M. Wills, and Jean Baker. 1980. Employment Related
Health Benefits in Private Nonfarm Business Establishments in the United States. Vol.llI- Sampling and Survey Strategy, Final Report Prepared for the Department of Labor. Seattle, WA" Battelle Human Affairs Research Centers.
Monheit, Alan C., Mark M. Hagan, Mark L. Berk, and Pamela L Farley. 1985. "The Employed Uninsured and the Role of Public Policy." Inquiry 22(4): 348-364.
Morrisey, Michael A. 1991. "Health Care Reform: A Review of Five Generic Proposals." In An EBRI Special Report: Winners and Losers in Reforming the Health Care System. Washington, DC: Employee Benefit Research Institute.
National Association of Life Underwriters (NALU). 1985. Survey of the Extent of Regulation and Taxation of Blue Cross-Blue Shield Plans. Washington, DC: NALU.
Peltzman, Samuel. 1976. "Toward a More General Theory of Regulation." Journal of Law and Economics 19(2): 211-240.
Short, Pamela, Alan Monheit and Karen Beauregard. 1989.A Profile of UninsuredAmericans. National Medical Care Expenditure Survey Research Findings 1, DHHS Publ. # PHS-89-343. Rockville, MD: National Center for Health Services Research and Health Care Technology Assessment.
Sloan, Frank A. and Killard W. Adamache. 1986. "Taxation and the Growth of Nonwage Compensa- tion." National Tax Journal (14): 115-137.
Small Business Adminislration. 1986. The State of Small Business, 1985: Report to the President. Washington, DC: U.S. Government Printing Office.

404 GAIL A. JENSEN AND JON R. GABEL
Small Business Administration. 1990. The State of Small Business, 1990: Report to the President. Washington, DC: U.S. Government Printing Office.
Stipp, David. 1988. "Laws on Health Benefits Raise Firms' Ire." The Wall Street Journal (December 28th): B 1.