Embed Size (px)
Citation preview
ONTARIO ENERGY BOARD
Staff Discussion Paper
Electricity Distribution System Reliability Measures and Targets EB-2014-0189 July 15, 2014
System Reliability Measures and Targets
- 2 -
A. INTRODUCTION .............................................................................................. - 3 - A.1 – System Reliability Initiative ............................................................................................. - 4 -
B. PERFORMANCE TARGETS – SAIDI & SAIFI ................................................ - 5 - B.1 – Background ....................................................................................................................... - 5 - B.2 – Working Group Comments .............................................................................................. - 9 - B.3 – Staff Review of Reliability Data .....................................................................................- 12 - B.4 – Board Staff Proposals ....................................................................................................- 15 -
C. CUSTOMER SPECIFIC RELIABILITY MEASURES ..................................... - 20 - C.1 – Background .....................................................................................................................- 20 - C.2 – Working Group Comments ............................................................................................- 22 - C.3 – Board Staff Proposals ....................................................................................................- 26 -
D. RESPONDING TO MOMENTARY OUTAGES .............................................. - 27 - D.1 – Background .....................................................................................................................- 27 - D.2 – Working Group Comments ............................................................................................- 28 - D.3 – Board Staff Proposals ....................................................................................................- 29 -
ATTACHMENT A ...................................................................................................... - 31 -
System Reliability Measures and Targets
- 3 -
A. INTRODUCTION On September 18, 2013, Ontario Energy Board (the “Board”) issued a letter announcing the commencement of the electricity distribution reliability standards initiative. The objectives announced in the letter were to:
• Establish specific performance targets for the existing system reliability measures. (System Average Interruption Duration Index, and System Average Interruption Frequency Index1)
• Consider development of customer specific reliability measures (e.g. customers
experiencing multiple interruptions), and the mechanisms for monitoring of momentary outages.
The Board’s Renewed Regulatory Framework is a comprehensive performance-based approach to regulation that promotes the achievement of four performance outcomes to the benefit of existing and future customers: customer focus, operational effectiveness, public policy responsiveness, and financial performance. The framework aims to align customer and distributor interests, continues to support the achievement of important public policy objectives, and places a greater focus on delivering long term value for money. As described in the Report of the Board Performance Measurement for Electricity Distributors: A Scorecard Approach, issued on March 5, 2014 (the ”Scorecard Report”), in order to facilitate performance monitoring and eventually distributor benchmarking, the Board will use a scorecard approach to effectively translate the four outcomes of the renewed regulatory framework into a coherent set of performance measures. This approach effectively organizes performance information in a manner that facilitates evaluations and meaningful comparisons. Distribution system reliability performance measures and targets are one of the keys to measuring distributors’ performance and assessing the achievement of the Operational Effectiveness outcome. The Scorecard will include two of the Board’s existing system reliability indicators: System Average Interruption Duration Index (Loss of Supply) and 1 SAIDI and SAIFI respectively
System Reliability Measures and Targets
- 4 -
System Average Interruption Frequency Index (Loss of Supply)). To improve understandability and transparency for customers, these measures will be named on the Scorecard as: Average Number of Hours that Power to a Customer is Interrupted and Average Number of Times that Power to a Customer is Interrupted, respectively. As stated in the Scorecard Report, each measure included on the Scorecard will have an established minimum level of performance that a distributor is expected to achieve2. The current performance levels associated with the two reliability indicators are that a distributor will remain within the range of its historical performance. These are the performance levels that will initially be used on the Scorecard as distributor-specific targets. The purpose of the Board’s system reliability policy initiative is to consider the establishment of different and/or revised specific performance targets for the current reliability measures and to examine the potential to establish new customer specific reliability measures. Upon completion of this consultation, the Board will make its determinations on these matters, and reflect them as appropriate on the Scorecard3. This Board staff Discussion Paper provides background related to objectives of this initiative (i.e.: setting targets for current reliability measures; considering new customer specific reliability measures; and the response to momentary outages.). The paper will also summarize the feedback received from a Stakeholder Working Group on the issues, and will offer Board staff’s initial proposals with respect to the objectives of this policy initiative. Information relating to this initiative is available at the following link on the Board’s web site, Electricity Distribution Reliability Standards A.1 – System Reliability Initiative This initiative is intended to support the Board’s renewed regulatory framework and the implementation of the performance Scorecard. As previously noted, one of the outcomes of the renewed framework is Operational Effectiveness, which requires continuous improvement in productivity and cost performance; and that utilities deliver on system reliability and quality objectives. The establishment of specific performance targets for SAIDI and SAIFI will assist in the monitoring of a distributor’s ability to meet system reliability objectives.
2 Scorecard Report, Page iii 3 Scorecard Report, Page 22
System Reliability Measures and Targets
- 5 -
Customer focus is another outcome established by the Board, and to support this outcome, the Board stated that it intends to develop and implement new customer specific reliability indicators. (E.g. measuring the number of customers experiencing multiple interruptions.) To facilitate discussion of the objectives of this initiative, the Board retained the services of Pacific Economics Group Research LLC (“PEG”) to prepare reports on two topics. The first report (the “Reliability Standards Report”) was an analysis of historical Ontario distributor reliability performance data that has been filed with the Board. This analysis considered how distributor specific performance targets should be set. The second report (the Customer Specific Measures Report) was an analysis of the issues related to establishing customer specific reliability measures. This analysis included a review of the use of such measures in other jurisdictions and any technical/engineering issues that have been experienced by those who implemented these types of measures. To assist in the achievement of the objectives of this initiative, Board staff reunited the previous System Reliability Working Group (the “WG”) to assist and advise staff in regards to issues related to the initiative. In addition to the original members of the previous WG, the Board staff also invited two new consumer representatives to join the discussions in recognition of the relevance of the objectives to the interests of consumers. The membership of the Working Group is provided in Attachment A. Board staff met with the WG on four occasions from September to December 2013. Board staff with the assistance of the WG also conducted an informal survey of distributors in November 2013, to gain insight into their technical capabilities to monitor system outages at a customer specific level.
B. PERFORMANCE TARGETS – SAIDI & SAIFI B.1 – Background The current performance levels associated with SAIDI and SAIFI are that a distributor will remain within the range of its historical performance. Distributors report their yearly performance for these measures on an annual basis through the Board’s Electricity
System Reliability Measures and Targets
- 6 -
Reporting and Record Keeping Requirements (the “RRRs”). The results are published in the Board’s Yearbook of Electricity Distributors. These reported results are an important part of the Board’s review of distributor performance during rate proceedings, and each distributor’s Distribution System Plans. These current performance levels will initially be displayed on the Scorecard as distributor-specific targets. The Board has stated in its letter announcing this policy initiative that intends to establish more specific system reliability performance targets. The establishment of specific system reliability performance targets requires the consideration of a number of issues:
• How will the performance targets be set? (e.g. based on individual distributor performance, regional performance or province wide performance)
• What data will be used to establish the targets? (E.g. existing RRR data,
distributor internal data)?
• How long will the targets be in effect?
• How will over or under performance be addressed by the Board? The remainder of this section will offer an analysis of these issues and concerns. PEG Report PEG’s work included an analysis of the Ontario electricity distributors’ existing reported reliability data to provide a recommended approach to setting performance targets which each distributor would be expected to meet. PEG was asked to provide advice as to whether these targets should be established on an individual distributor, regional, or province-wide basis. It is PEG’s view that one of the key principles to setting performance targets is that the targets should reflect the external business conditions in a distributor’s service territory. These business conditions can include weather events, the amount of underground assets mandated by the local authority, the mix of customer base, etc. A failure to control for these business conditions in a regulatory target can expose utilities to arbitrary and unfair performance evaluations For example, a plan where a utility is
System Reliability Measures and Targets
- 7 -
rewarded or penalized depending on how its measured reliability compares to that of another utility would lead to unreasonable penalties or rewards if one utility had a more demanding territory (e.g. more severe weather). Not controlling for the effect of business conditions in that service territory would tend to handicap the utility serving that territory4. All else being equal, performance targets should also be as stable as possible during the regulatory plan. Predictable and stable targets give utility managers more certainty over the resources they must devote to providing adequate system reliability. It is harder for managers to hit a ‘moving target,’ particularly if operational changes can only be implemented over longer periods. Predictable targets therefore promote more effective, longer–term service quality programs5. PEG presented three main options for setting service reliability benchmarks:
1. Distributor-specific targets for SAIFI and SAIDI based on the distributor’s historical average results for the respective indicators. PEG reported that historical performance based targets are the most common basis for reliability performance standards, and are used in a number of North American jurisdictions. In these jurisdictions, reliability assessments would then depend on measured reliability levels that differ either positively or negatively from recent historical experience6.
2. Peer group averages, where average SAIFI and SAIDI values, for distributors in
designated regional or provincial peer groups, establish benchmarks for the respective indicators for all distributors within the peer group.
Peer–based benchmarks may be attractive conceptually since they are consistent with the operation and outcomes of competitive markets, where firms are penalized or rewarded for their price and quality performance relative to their competitors. Relying on the performance of peer utilities in the industry can therefore provide a more objective basis for establishing reliability benchmarks7.
4 Reliability Standards Report, Page 6 5 Ibid, Page 6 6 Ibid, Page 7 7 Ibid, Page 7
System Reliability Measures and Targets
- 8 -
3. Statistically-based SAIFI and SAIDI benchmarks, where statistical models using SAIFI and SAIDI data, respectively, for the entire Ontario electricity distribution industry are used to generate predictions for each distributor’s SAIFI and SAIDI given external business conditions.
Statistical methods can generate reliability benchmarks that are tailored to the precise business conditions faced by a particular distributor. Such statistical models will ‘control’ for the impact of specific business conditions faced by the distributor on that distributor’s measured reliability. For example, econometric methods can be used to quantify the impact of business conditions such as customer density, the degree of undergrounding, the share of deliveries to large customers and similar “drivers” of measured reliability on the SAIFI and SAIDI values reported by distributors in a given electricity distribution industry8.
PEG reported that its analysis of Ontario distributors’ data does not lend support for using either the peer-based or statistical approach to set reliability performance targets in Ontario. PEG reviewed the available data from 2002 through 2012 and noted that there is too much variability and apparent randomness in Ontario distributors’ underlying SAIFI and SAIDI data for these approaches to be effective. This data variability results, at least in part, from the fact that distributors have historically not normalized their reported reliability metrics to eliminate the impact of severe storms and other random factors that can have a substantial impact on measured SAIFI and SAIDI. The randomness in the current reliability data makes it difficult to identify statistically significant ‘drivers’ of measured SAIFI and SAIDI and use these econometric reliability driver models to predict average SAIFI and SAIDI values for Ontario electricity distributors9. PEG does believe that distributor-specific SAIFI and SAIDI benchmarks can be appropriate in Ontario. This is the most common method for setting benchmarks in reliability regulation and in PEG’s view the benchmarks that would emerge from this approach appear generally reasonable10. Historical benchmarks reflect a company’s own operating circumstances and will reflect the typical external factors faced by the
8 Reliability Standards Report, Page 8 9 Ibid, Page 40 10 Ibid, Page 3
System Reliability Measures and Targets
- 9 -
distributor if the period used to set benchmarks is long enough to reflect the expected temporal variations in these factors. Although historical averages of company performance will reflect typical external factors faced by a company, they will not control for shorter–term fluctuations in external factors around their norms. As noted, some business conditions that can affect measured quality are quite volatile from year to year. Weather is the salient example. One way to accommodate year–to–year fluctuations in external factors is by measuring indicators on a multi-year basis. For example, a regulatory plan could target a three-year moving average of SAIFI and SAIDI rather than the SAIFI and SAIDI values registered each year. Measuring indicators over multiple years will tend to smooth out the impact of random factors on indicator values and lead to a more reasonable measure of the company’s underlying service quality performance. PEG’s analysis indicates that average values for SAIFI and SAIDI over the five most recent years (2008-2012) would be the most appropriate historical basis for setting distributor-specific reliability benchmarks. Five years, in PEG’s expert view, is long enough to capture the impact of a distributor’s external business conditions on its measured reliability data, but recent enough to reflect the current methods that are used to collect data on interruptions11. B.2 – Working Group Comments The following summarizes the comments from the WG on the issue of setting system reliability performance targets.
• The WG supported the idea of setting specific performance targets for SAIDI and SAIFI. However, the WG did express concerns related to how those targets would be set.
• The distributors in the WG suggested that distributors should be able to present the Board with their suggestion of what a reasonable performance target would be, rather than use the historical data reported to the Board.
11 Reliability Standards Report, Page 3
System Reliability Measures and Targets
- 10 -
• The WG proposed that initially a distributor’s performance targets could be based
on its historical data. Those distributors who believed a historical based target was appropriate would use that target. However, those distributors who felt a target based on historical performance would not be appropriate in their circumstances could apply to the Board for a different target.
• To support a target different than one based on historical data; the WG
suggested that distributors would provide the Board with a rationale for the different target that would take into consideration factors that were unique to each distributor. The Board could then review that proposal and accept or deny the application.
• In its discussions, the WG identified what type of evidence a distributor could
provide to justify a target different than one based on historical data. These included: − The drivers of the reliability trend (e.g. age of system, weather events) and
establishing how an inability to address this driver will impact on performance.
− Changes in recording systems (or the introduction of more system automation), whether planned for the near future, or done within the last five years. Improved recording and monitoring systems will, in the WG’s view, lead to the accumulation of more accurate data. It is believed that more accurate data will allow distributors to better identify the number of outages and more precise information about each outage (e.g. the length of time the outage occurred.) These new systems are simply identifying events that have been occurring but were not identified previously. Therefore, this more precise data may result in the calculation of lower performance numbers but not necessarily actual reduced performance.
− Providing information comparing their performance to that of “peer group”
distributors.
System Reliability Measures and Targets
- 11 -
• The WG also expressed the view that distributors would need to know how the performance targets will be used by the Board (i.e. what are the consequences of not meeting the target), and how long the established target will be in place, before they would be able to advise what a reasonable target would be.
• One of the concerns raised regarding the use of a five year average, as
suggested by PEG, was the fact that, by the very nature of an average, half the time the distributor would be under target and half the time it would be over target. As a result, the WG suggested there should be dead-bands applied to the performance targets. The dead-bands could be based on the standard deviation in reported results.
• The WG members indicated a concern that if steps are not taken to acknowledge
the effect of using an historical average number, distributors may be driven to invest so that their performance will at least meet the five year average number, every year. This is, in the WG’s view, likely not possible to do without significant costs.
• There was a view among some members of the WG that any performance target
should be based on data that excludes “loss of supply” events because these are out of a distributor’s control.
• Other members of the WG suggested that it is not important to the customer why
the outage happened, only that it happened. Customers expect distributors and transmitters to be working together to reduce incidents of loss of supply. As a result it would be appropriate to include “loss of supply” events when calculating a target, so that the impact of these events is known.
• Regarding the time period for implementing the performance targets, it was
discussed that the Board should wait to set a target until all distributors have gone through at least one “Cost of Service” rate hearing and had been required to file a Distribution System Plan as part of their application. The WG suggested that this will allow all distributors the time necessary to develop a comprehensive approach to system improvements and allow for a more accurate prediction of the performance levels that will be provided to customers.
System Reliability Measures and Targets
- 12 -
B.3 – Staff Review of Reliability Data The data that PEG used in its review was based on SAIDI and SAIFI results that were not adjusted to exclude the impact of “loss of supply” events. As outlined in the Scorecard Report, the reliability measures used on the Scorecard will be results that do exclude “loss of supply” events12. Reliability results that have been adjusted to exclude “loss of supply” events have been reported to the Board under sections 2.1.4.2.2 and 2.1.4.2.4 of the RRRs since 2008. In an effort to get a picture of these performance results, Board staff has completed the following high level review of the adjusted performance results. SAIDI (Loss of Supply) Results:
• The best (lowest) 5 year avg. of SAIDI (Loss of Supply) is 0.18 hours. • The worst (highest) 5 year avg. of SAIDI (Loss of Supply) is 14.1 hours. • The avg. SAIDI (Loss of Supply) performance of all distributors over 5 years is
1.94 hours. • 26% of distributors had a 5 year avg. of SAIDI (Loss of Supply) of 1 hour or
lower. • 45% of distributors had a 5 year avg. of SAIDI (Loss of Supply) greater than 1
hour, but less than 2 hrs. • 25% of distributors had a 5 year avg. of SAIDI (Loss of Supply) greater than 2
hours, but less than 5 hrs. • 4% of distributors had a 5 year avg. of SAIDI (Loss of Supply) greater than 10
hrs. In an effort to map the SAIDI (Loss of Supply) performance of a typical distributor, and to demonstrate the variance in year to year performance, Board staff reviewed the results of the majority of distributors (the 45% of distributors who had a five year average of SAIDI (Loss of Supply) of greater than one but less than two hours) and looked for the performance pattern that was similar among all the distributors in that
12 Scorecard Report, Page 21
System Reliability Measures and Targets
- 13 -
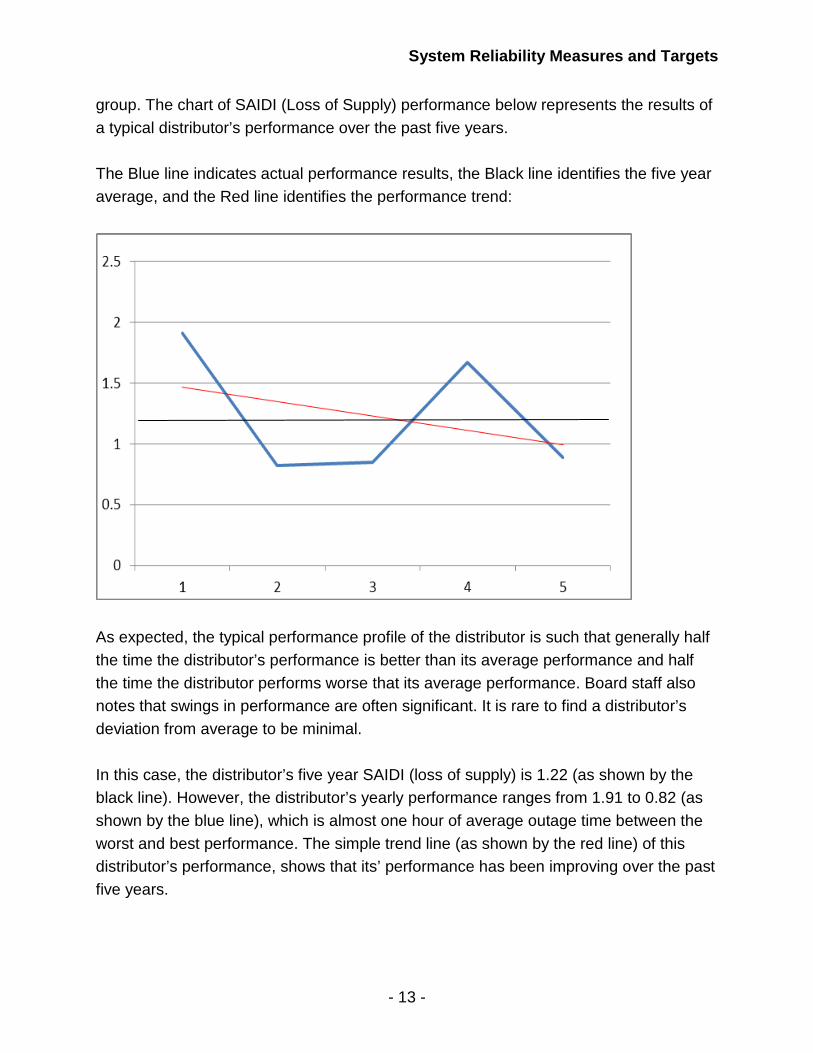
group. The chart of SAIDI (Loss of Supply) performance below represents the results of a typical distributor’s performance over the past five years. The Blue line indicates actual performance results, the Black line identifies the five year average, and the Red line identifies the performance trend:
As expected, the typical performance profile of the distributor is such that generally half the time the distributor’s performance is better than its average performance and half the time the distributor performs worse that its average performance. Board staff also notes that swings in performance are often significant. It is rare to find a distributor’s deviation from average to be minimal. In this case, the distributor’s five year SAIDI (loss of supply) is 1.22 (as shown by the black line). However, the distributor’s yearly performance ranges from 1.91 to 0.82 (as shown by the blue line), which is almost one hour of average outage time between the worst and best performance. The simple trend line (as shown by the red line) of this distributor’s performance, shows that its’ performance has been improving over the past five years.
System Reliability Measures and Targets
- 14 -
SAIFI (Loss of Supply) Results:
• The best (lowest) 5 year avg. of SAIFI (Loss of Supply) is 0.09 events • The worst (highest) 5 year avg. of SAIFI (Loss of Supply) is 3.87 events • The avg. SAIFI (Loss of Supply) performance of all distributors over 5 years is
1.30 events • 36% of distributors had a 5 year avg. of SAIFI (Loss of Supply) of 1 event or less. • 50% of distributors had a 5 year avg. of SAIFI (Loss of Supply) greater than 1
event, but less than 2 events. • 14% of distributors had a 5 year avg. of SAIFI (Loss of Supply) greater than 2
events, but less than 4 events. • No distributor reported a SAIFI (Loss of Supply) of higher than 4 events.
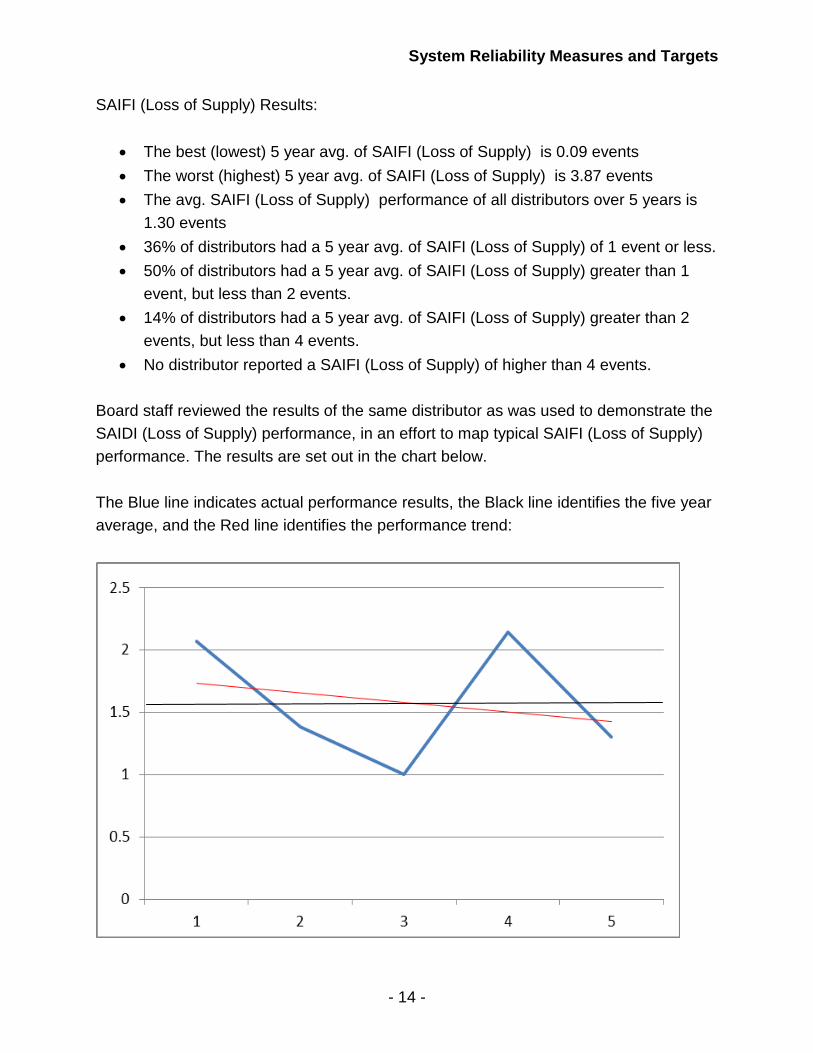
Board staff reviewed the results of the same distributor as was used to demonstrate the SAIDI (Loss of Supply) performance, in an effort to map typical SAIFI (Loss of Supply) performance. The results are set out in the chart below. The Blue line indicates actual performance results, the Black line identifies the five year average, and the Red line identifies the performance trend:
System Reliability Measures and Targets
- 15 -
As shown with the SAIDI (Loss of Supply) results, a typical performance profile for a distributor’s year to year SAIFI (Loss of Supply) performance also swings significantly above and below the five year average. In this case, the distributor’s five year SAIFI (loss of supply) is 1.57 (as shown by the black line). However, the distributor’s yearly performance ranges from 2.14 to 1.0 (as shown by the blue line), which is a difference over one outage event between the worst and best performance. The simple trend line (as shown by the red line) of this distributor’s performance, shows that its’ performance has been improving over the past five years. B.4 – Board Staff Proposals As set out in the Board’s Scorecard Report each measure included on the Scorecard will have an established minimum level of performance that a distributor is expected to achieve. Performance targets will take into consideration the level of service customers should reasonably be expected to receive from all distributors at rates the Board has determined are reasonable. Distributors are expected to meet the Board’s requirements and, achieve continuous improvements that reduce costs and deliver service levels that their customers value.13 PEG has recommended the Board implement distributor-specific performance targets, using a distributor’s past performance over a five year period. Their rationale is that historical benchmarks reflect a company’s own operating circumstances and the typical external factors faced by the distributor which is a key to setting a reasonable target. Using historical performance is also the most common method for setting benchmarks in reliability regulation and the targets that emerge from this approach appear generally reasonable. The WG agreed that setting specific performance targets for reliability would be beneficial. However, they did express concern as to how those targets would be set. The WG suggested that performance targets would be based on historical data, except where a distributor felt that such a target would not be appropriate, they could apply to the Board for a different target. 13 Scorecard Report, Page 10
System Reliability Measures and Targets
- 16 -
Board Staff’s analysis of the reported data shows a wide range of performance. There is a fourteen hour difference in the average interruption duration between the best and worst performing distributors in the province. The average frequency of interruptions customers across the province experience ranges from less than one to almost four events a year. The data also indicates that the range of performance is spread out among distributors. It is just not a case of a few outliers who have extreme high or low performance results. Twenty six percent (26%) of distributors report having an average of less than one hour of outage time experienced by customers. Yet, twenty five percent (25%) of distributors report that their customers can experience an average outage time of up to five hours. Forty six percent of distributors fall somewhere in between. The range of performance of the average frequency of outages among distributors is less dramatic but no less evident. Based on the WG’s input, PEG’s assessment, and a review of the historical data, Board Staff suggests there does not appear to be support for the introduction of reliability performance targets based on either one province-wide target for all distributors, or regional or other types of peer-group targets. As described in the PEG report, there is too much variability and apparent randomness in Ontario distributors’ underlying reliability data for these approaches to be effective. Board staff suggests, based on the data and input from the WG, that implementation of targets follow PEG’s recommendation to establish reliability performance targets for each distributor based on the distributor’s five year historical average results, as reported to the Board, for the respective indicators. This approach is consistent with the design of the Scorecard that has already been established by the Board. The system reliability measures used on the Scorecard are SAIDI (Loss of Supply) and SAIFI (Loss of supply). The current performance levels expected by distributors are distributor specific. As with the other measures on the Scorecard, Board staff’s proposal relies on the use of the previous five years of performance results and on data that has already been reported through the Board’s RRR filings. Additionally, as all distributors have reported reliability results over the last five years, this data and associated performance targets can be established and utilized immediately, as expected by the Board.
System Reliability Measures and Targets
- 17 -
Board staff notes that using historical results to set the performance target ensures that customers will at a minimum continue to receive the level of service that they have come to expect from the distributor. It also establishes a reasonable benchmark that can be used to monitor a distributors’ improvement in its operational effectiveness, which is a key outcome of the renewed regulatory framework. To provide distributor management with sufficient certainty in order to devote appropriate resources to maintaining reliability, Boards staff suggests that one alternative is that once a target is established, the target could remain in effect for five years. This five year period is consistent with the planning time frame the Board has established under the new regulatory framework. After five years of new performance results, the distributors’ targets can be reset to reflect the average operating levels from those new results. Another alternative to consider is updating the performance target, every year, based on the most recent five years of data. This would result in the target being based on a rolling five year average. The benefit of this approach would be that improvements in performance would be recognized in the updated target. The yearly results would also demonstrate the distributors’ effectiveness in implementing its asset management plan. The key to either approach is that the performance results be in keeping with the Board’s expectation that distributors achieve continuous improvements that reduce costs and deliver service levels that their customer’s value. As an option to Board staff’s suggestion that performance targets be based on the historical data, the WG proposed that distributors be allowed to apply to the Board for performance targets different than those based on historical results. The proposal would not replace the historical data based targets as they would be the default for a distributor unless it applied for a different target. This option is based on the view of some of the members of the WG that the operation of distribution systems will be changing in the near future, due to limits in capital budgets and the implementation of smart grid technology. These members of the WG suggested that these changes may significantly impact future reliability performance in comparison to historical performance.
System Reliability Measures and Targets
- 18 -
Board staff offers the following observations on the WG’s concerns:
• The Board’s renewed regulatory framework has set the expectation that all distributors should be working towards improved operational efficiency. Allowing distributors to establish performance targets that are less than those historically experienced by customers would seem to not be aligned with this objective of the framework.
• The renewed regulatory framework has also set as an outcome for distributors
that they provide services in a manner that responds to identified customer preferences. In demonstrating that outcome, the Board has established as part of the Scorecard an expectation that distributors undertake customer satisfaction surveys. Therefore, any proposed reliability targets, should be based on discussions with customers and an understanding of their expectations.
• The Board has established a reporting requirement (section 2.1.4.2.6 of the RRRs) which requires distributors report any new system reliability measuring and reporting practices, or any new distribution system technologies that impacted its reported performance results for the current year in comparison to previous years. Board staff suggests that this requirement provides the opportunity for distributors to report how the introduction of new technology affects performance results.
Board staff invites stakeholders’ views on the proposal that distributor reliability targets be based on historical performance. Stakeholder views are also requested on the option of distributors seeking specific performance targets on the basis of information relating to their system and what a reasonable performance level would be. Views are also invited as to whether the performance targets should be set for five years or be determined based on a rolling five year average of performance. During the WG sessions, there were also questions as to how reliability performance targets will be used by the Board, and the consequences of under or over performing. One of the concerns raised by the WG regarding the use of a five year average of historical performance to set targets was the implication that the distributor will be always over or under performing. As a result, the WG suggested there should be dead bands applied to the performance targets.
System Reliability Measures and Targets
- 19 -
PEG stated that dead-bands are a common way to accommodate year-to-year fluctuations in external factors. If the value of a reliability indicator is known to fluctuate in a certain range due to external factors, the mean value of this indicator over a suitable historical period would reflect the typical long run external business conditions faced by the utility. Variation in the company’s performance around this historical mean will, at least in part, reflect short run fluctuations in those business conditions. Dead bands should therefore reflect the observed variability in measured system reliability. One measure of this year–to–year variability is the standard deviation of the reliability indicator around its mean14. The Board in the Scorecard Report discussed the concept of setting a range for performance targets in order to provide some certainty to distributors as to when the Board may take the view that corrective action is necessary15. As we have seen, an analysis of the reliability data reported to the Board indicates that the typical distributor’s reliability performance varies significantly from the average on a year to year basis. This is the nature of reliability performance in an environment that is greatly impacted by weather and other “major events”. While exclusion of the impact of major events could reduce volatility, the Board has found that the various ways to define a “major event” on a province-wide basis all have their flaws, and therefore reliability data would not be adjusted. Board staff are of the view that it is reasonable to accept that a distributor’s yearly reliability performance will vary significantly from a five year average, but that these results do not necessarily indicate that a distributor’s reliability performance is deteriorating. Board staff suggests, that rather than be concerned with yearly fluctuations of performance, the important indicator to monitor on a regular basis is the overall trend in the performance results. This concept is consistent use of the directional trend symbol on the Scorecard.16 Board staff has some concern that reviewing reliability performance of distributor within a target range is less precise and more difficult to determine if a distributor is making real gains in performance. When operating in a range, a distributor may be able operate
14 Reliability Standards Report, Page 10 15 Scorecard Report, Page 7 16 Ibid, Page 36
System Reliability Measures and Targets
- 20 -
at the poorer end of the scale, yet still stay within the range and be considered to be performing successfully. Board staff also has some concerns that attempting to set dead bands, using the standard deviation from the mean, based on five data points that show the volatility that exists in the reliability data, may not be very meaningful. Board staff invites input from stakeholders on the issue of whether or not the Board should implement reliability performance targets that are based on a target range rather than a specific target. Stakeholder views are also invited on the issue of the variability of year to year performance and how this may be addressed on the Scorecard.
C. CUSTOMER SPECIFIC RELIABILITY MEASURES
C.1 – Background The reliability measures used by the Board, SAIDI and SAIFI, measure system reliability, in other words the indicators measure the average length of time that an average customer goes without power or the average number of times, an average customer experiences goes without power. These reliability measures do not show the extent to which specific customers may experience significantly below average reliability performance. In past consultations both customers and distributors suggested there should be a move towards indicators that are focused on the impact of outages on individual customers rather than just system wide impacts. The Board has announced that this initiative will consider the development and implementation of customer specific reliability measures. Specifically, the Board is considering the use of two measures:
• Customers Experiencing Multiple Interruptions (beyond a certain threshold); and
• Customers Experiencing Long Duration Interruptions (interruptions longer than a certain time period)
System Reliability Measures and Targets
- 21 -
PEG Report To understand how customer specific measures have been implemented in other jurisdictions PEG prepared a report on the issues related to establishing customer specific reliability measures. PEG’s report included a review of the use of such measures in other jurisdictions and any technical/engineering issues that have been experienced by those who implemented these types of measures. PEG’s review indicated that regulatory reporting of customer-specific reliability metrics is rare, but interest in the measures is growing. Some key examples that PEG identified17:
• Florida, which has a long experience with customer-specific reliability measurement. In that state, there was a need for some utilities to upgrade their measurement systems to comply with the reporting mandate.
• Sweden, which has relevant experience because like Ontario, Sweden has a
diverse range of distributors operating under varying business conditions. Even a large number of small Swedish distributors are currently providing reliability information on their particular customers.
• Massachusetts is currently undertaking a comprehensive review of its service
quality regulatory framework, and issues related to customer-specific reliability metrics are playing an important role in its debates.
• BC Hydro is the only Canadian electric utility that reports customer-specific
reliability information to its regulator. As part of an incentive regulation plan, the utility provides information on the service reliability indices that include CEMI-4 (Customers experiencing more than 4 interruptions).
In most jurisdictions PEG examined, PEG found that few distributors encountered engineering or technical problems in complying with the mandate to report customer specific outage statistics. However, there have been instances of problems with the quality of the data provided to regulators. 17 Customer Specific Measures Report, Section 3, Page 10
System Reliability Measures and Targets
- 22 -
PEG also noted that there appears to be a disparity between large and small distributors’ capacity to measure reliability at a customer-specific level18. C.2 – Working Group Comments The following summarizes the comments provided by the WG on the issue of establishing customer specific performance targets.
• The WG agreed that system-wide reliability performance measures may be a good judge of the effectiveness of a distributor’s asset management plan. However, they also agreed such measures are not a direct link to the customer experience, and that it is important that a distributor work to ensure that groups of certain customers do not receive less reliable service than other customers.
• The WG expressed the view that most distributors do not currently have the technology in place to effectively measure outages on an individual customer level. The distributors on the WG report that systems are being developed and should be in place in the coming years, but there is no wide spread use of these systems yet.
• The technology to monitor reliability at the customer level is still in its infancy.
Even those distributors on the WG who have been making advances in reliability monitoring, indicated they do not believe they are ready to formally report accurate data at the customer level.
• In November 2013, a survey developed by Board staff and the WG was sent to
distributors to gain a better understanding of distributors abilities to monitor reliability on a customer level. The results were:
− Of the 48 distributors who responded, 20 (42%) stated they had the systems
in place to measure the number of outages on an individual customer level. These 20 distributors provide service to 48% of the total residential customer base.
18 Customer Specific Measures Report, Page 2
System Reliability Measures and Targets
- 23 -
− Of those 20, only 2 distributors said they currently use the available technology to measure outages on an individual customer level. Staff notes that these two distributors are among the smallest size distributors in the province.
• The WG suggests that the survey results indicate that some distributors may
have the capability to monitor reliability at customer level, but they are not putting this capability into practice. It was suggested that some distributors may be using customer level information informally, for operational decisions, but they have not put processes in place to report the data formally.
• The distributor members of the WG provided some thoughts on the systems and
processes that would be required to monitoring customer specific outages: − What is needed to track customer specific outages is a robust Outage
Management System (“OMS”) with a full “connectivity model”. Such a connectivity model is one that uses geographical information systems, customer information systems, and SCADA systems to link distribution assets to customers.
− Not all distributors have such a robust OMS system. Such a system is not regarded as necessary to operate an efficient utility.
− It is not uncommon for it to take 5 to 10 years to develop and implement a connectivity model that functions correctly and accurately, even when the distributor is dedicated to implementing one.
− The successful implementation of customer level reliability monitoring requires maintaining and updating the OMS with the latest customer and system data.
− Some distributors have different models of OMS, some monitor down to transformer level, some to the customer level, and others only to feeder level. All distributors would have to move to customer level monitoring in order to introduce customer specific reliability measures.
− Smart meters can be an input into an OMS but that data needs to be reviewed, and matched with SCADA data, and real time knowledge (customer calls about outages, police reports, etc.). Smart meters can also signal many
System Reliability Measures and Targets
- 24 -
“false flags” indicating an “out of power” situation when there really is no system outage.
− Developing a connectivity model involves specific staffing skills and the implementation of new business processes. These requirements will likely lead to increased staffing costs. Therefore, some members of the WG asked whether the increased cost to deliver this extra reporting is worth the effort. Some in the group felt that distributors should not be forced to develop the technology if they don’t feel they need it to operate effectively.
− The OMS systems and technology are a fundamental part of the operation of the distributor. Outsourcing these functions would be like outsourcing the entire operation of the distributor to a 3rd party. Outside experts can be used to help a distributor help itself, but outside resources cannot operate the system for the distributor. Distributors still need the internal resources necessary to maintain the systems and to maintain accurate, real-time data necessary to efficiently operate an OMS.
• It would be impractical to implement systems to monitor customer level reliability
only to be used to report on CEMI. Rather a connectivity model should be used for other important purposes like planning, efficient restoration, and proper asset management.
• If the goal of the regulator is to understand the individual customer reliability
experience, then some on the WG suggested there may be better ways to achieve that goal than setting up system to monitor each individual customer outage.
• The WG distributors suggested that if Board wants distributors to invest in the
necessary technology, those that do make the investments should be incented by receiving forgiveness on their incentive rate-making “stretch factor”. There is a belief among the WG that increasing the OM&A expenses (to implement customer level monitoring) will negatively impact on a distributor’s revenue return in the IRM model.
• In response to the idea that distributors could consider working together to
implement the necessary technology, or obtain the service from another
System Reliability Measures and Targets
- 25 -
distributor, the WG suggested there could be some opportunity for reducing costs through the sharing of resources with other distributors. However, each distribution system is unique, so an “off the shelf” technology could not be utilized.
• The WG stressed that no performance targets (like BC Hydro’s CEMI-4) should
be established for Ontario distributors at the current time, because there is none of the history or data regarding a distributor’s current performance that is necessary to set an appropriate target.
• In the WG’s view Ontario could not simply implement the same measure as B.C
Hydro because B.C. is mostly serviced by one integrated utility, not 70+ distributors as in Ontario, so the circumstances are different.
• Distributors on the WG were not supportive of the idea that the Board begin with
voluntary reporting of these customer specific measures by those distributors who have the ability. It was their view that the Board should not ask for reporting, until all distributors can report. Their concern is that distributors, who do report, may be held up to higher scrutiny because they are providing data that other distributors are not.
• Instead, some members of the WG suggested that the Board could begin asking
for reporting voluntarily as an internal Board project (i.e. not public). This would allow time for more distributors to begin reporting, but also for Board staff to assess how distributors are reporting, and how accurate the information is.
• The WG discussed the idea of whether it would be useful for a distributor, (who
does not have technology to monitor performance on individual customer basis), to provide performance measurement information at a feeder level, as an indication on individual customer results.
− Some members of the WG thought reporting on feeder performance would be a good start, especially since larger circuit outages cause the greatest impact to reliability performance. Such reporting was also seen as something all distributors could do.
System Reliability Measures and Targets
- 26 -
− Others distributors on the WG believed that feeder performance information isn’t valuable, since feeder performance does not necessarily recognize efforts on the part of distributor to improve reliability. For example, a feeder could be on the list of the worst performers one year and not the next, even though the distributor did no work on it.
C.3 – Board Staff Proposals System reliability relates to two of the key objectives of the renewed regulatory framework are customer focus and operational effectiveness. Specifically that service is provided in a manner that responds to customer preferences and that distributors deliver on system reliability and quality objectives. The monitoring and reporting of reliability performance at the individual customer level is an ideal way to meet these two RRFE objectives. Taking action to implement customer specific reliability measures also demonstrates the commitment to continually improve services and processes that are valued by customers, that the Board expects distributors to achieve. PEG’s report indicates that that regulatory reporting of customer-specific reliability metrics is rare, but interest in the measures is growing. However, PEG also noted that there appears to be a disparity between large and small distributors’ capacity to measure reliability at a customer-specific level. Many distributors agreed there is value in monitoring reliability at the individual customer level and some are taking steps to implement such capability. However, the feedback from the WG and the survey of distributors indicates that the ability to monitor reliability performance at the customer specific level is not yet readily available among distributors in Ontario. Board staff suggests that more time will be needed before mandatory reporting of CEMI or CELDI can be implemented. However, given the value the stakeholders put on being able to measure customer specific reliability and the connection to the two RRFE outcomes, Board staff suggests there should be tangible efforts starting now, in order to achieve the goal of reporting CEMI and CELDI. One option to encourage such distributors’ efforts would be to set a deadline, for example, of three or five years by which distributors must be able to monitor and report on these measures.
System Reliability Measures and Targets
- 27 -
As a next step, Board staff is in agreement with the WG that it would useful to undertake a pilot project with a number of willing distributors to work towards the goal of implementing the monitoring of outages at the individual customer level. Board staff suggests that this project could begin by working with these distributors to review what systems and processes are readily available, or need to be available, to monitor individual customer outages and then begin testing the actual monitoring and reporting of such outages. Lessons learned from this pilot project would be communicated out to all distributors so that they can begin the implementation of similar processes. The results of such a pilot project could inform the Board as to an appropriate date for the implementation of customer-specific reliability measures by all distributors. Board staff invites stakeholders’ views on the proposal to initiate a pilot program with willing distributors to begin exploring the implementation of customer-specific reliability measures. Board staff also invites comment on whether and on what basis the Board should set a deadline for mandatory reporting of CEMI and CELDI.
D. RESPONDING TO MOMENTARY OUTAGES D.1 – Background Last year, the Board amended the Electricity Reporting and Record Keeping Requirements (RRRs) to remove the requirement to report to the Board a metric (MAIFI19) that monitored temporary outages. In proposing these changes, the Board noted that many distributors do not have the technical ability to monitor momentary outages and that such outages are part of the normal operation of the distribution system. It also acknowledged the concerns of some stakeholders, that momentary outages are not just a nuisance but result in real costs to customers. The Board later clarified what it saw as the key issue: momentary outage performance where it is critical to certain customers. In preparing this Discussion Paper, Board staff’s approach was to understand the current practices of distributors and develop a proposal for responding to customer concerns regarding momentary outages.
19 Momentary Average Interruption Frequency Index
System Reliability Measures and Targets
- 28 -
In the November 2013 WG survey, distributors were asked about monitoring of momentary outages. The feedback from distributors indicated:
• Of the 48 distributors who responded, 28 (58%) stated they have systems in place that can measure momentary outages. These 28 distributors provide service to 33.8% of the total Ontario customer base.
• Of the remaining 20 distributors, only 10 indicated they had plans to implement
systems to monitor such outages in the future. 4 of those 10 distributors predicted they would have systems implemented in five years or less. The other 6 could not provide an estimated time line for implementation.
• 16 of the 48 distributors (33%) stated they did not have formal processes in place
to respond to customers concerns over momentary outages. 32 (67%) reported that they did have processes in place.
D.2 – Working Group Comments The following is a summary of the discussion at the Working Group on the issue of responding to customer concerns related to responding to momentary outages. The members of the WG who represented consumer interests made the following comments on this issue:
• Large commercial customers would like to see a MAIFI standard developed. They understand that distributors respond to momentary outage concerns on a one-off basis. But the problem is there is no standard of performance a distributor must meet.
• The fact that many distributors do not having a formal process for responding to
customer complaints about momentary outages, is an underlying concern.
• Not many utilities help residential customers by telling them about the need to have protection equipment installed in the home.
System Reliability Measures and Targets
- 29 -
• Residential customers can suffer significant damage from power quality issues. But no one is helping them understand the actions they can take to protect themselves.
• Utilities should take a more active role in educating residential consumers about
how to protect themselves.
• One suggestion was that the Board could set a threshold on the number of momentary outages that would be considered acceptable by customer class.
The distributor members of the WG offered the following comments:
• Some distributors do not have auto re-closers. Therefore any momentary outages occur because of an upstream event. Should these distributors have to install systems to monitor and report on these events that are not within their control?
• Momentary interruptions are a key part of operating the distribution system
effectively. Auto re-closers, and the momentary interruptions their operation brings, protect the system from outage events that could cascade to include other parts of the distribution system. This would likely cause interruptions to a greater number of customers. So momentary interruptions could never be eliminated completely or else system performance will suffer.
• Distributors can talk to customers to inform them of their options for mitigating the
effects of momentary outages, but at a certain point, customers need to make their own investments to protect themselves from effects of such outages.
• Mitigating the effects of momentary outages is an important issue that distributors
should be discussing with their large customers. D.3 – Board Staff Proposals While distributors make an effort to respond to some of the concerns about momentary outages; consumer groups continue to express the view that distributors are not taking concerns about the impact of such outages seriously enough.
System Reliability Measures and Targets
- 30 -
Board staff understands from the WG discussions that there may today be limits to a distributor’s ability to reduce the number of momentary outages on its system. However, with the expectation that distributors will be implementing new technologies and systems as part of grid modernization20 it is expected that distributors’ ability to manage momentary events will improve. Board staff also understands that if the parties work together there are options that can be explored that can reduce the impact of these types of outages on customers. To promote the opportunity for increased communication between the parties, Board staff is suggesting that all distributors develop and implement written practices and procedures for responding to customers complaints about momentary outages, including investigating ways to minimize the effect of such outages. Board staff believes that having distributors develop and implement such practices and procedures will exhibit a distributor’s commitment to customer service and to providing service in a manner that responds to customer preferences therefore achieving the outcome of customer focus established by the Board as part of the renewed regulatory framework. One option for introducing this proposal could be to require that distributors include the written practices and procedures in their Conditions of Service. Board staff invites stakeholders’ views on the proposal to require distributors to develop and implement written practices and procedures for responding to customer complaints about momentary outages.
20 Report of the Board: Supplemental Report on Smart Grid EB-2011-0004, pp. 13-14, issued February 11, 2013.
System Reliability Measures and Targets
- 31 -
ATTACHMENT A
Members of the Reliability Working Group
• Algoma Power (FortisOntario) • Association of Major Power Consumers in Ontario • Energy Probe Research Foundation • Enersource Hydro Mississauga Inc. • Halton Hills Hydro Inc. • Horizon Utilities • Hydro One Networks Inc. • London Hydro • Orangeville Hydro (CHEC Group) • Power Worker’s Union • Toronto Hydro Electric System Limited • Veridian Connections Inc. • Vulnerable Energy Consumers Coalition