Embed Size (px)
Citation preview
Stability Design for the Crane Columns of the Wind Technology Testing Center
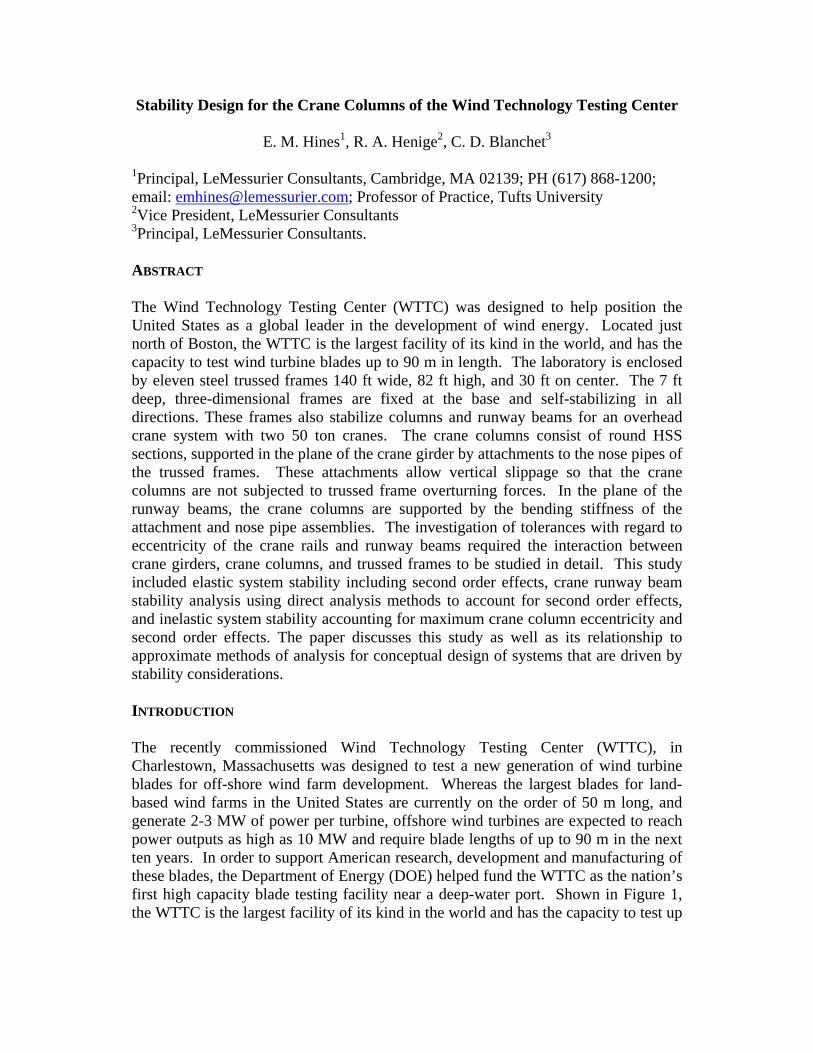
E. M. Hines1, R. A. Henige2, C. D. Blanchet3 1Principal, LeMessurier Consultants, Cambridge, MA 02139; PH (617) 868-1200; email: [email protected]; Professor of Practice, Tufts University 2Vice President, LeMessurier Consultants 3Principal, LeMessurier Consultants. ABSTRACT The Wind Technology Testing Center (WTTC) was designed to help position the United States as a global leader in the development of wind energy. Located just north of Boston, the WTTC is the largest facility of its kind in the world, and has the capacity to test wind turbine blades up to 90 m in length. The laboratory is enclosed by eleven steel trussed frames 140 ft wide, 82 ft high, and 30 ft on center. The 7 ft deep, three-dimensional frames are fixed at the base and self-stabilizing in all directions. These frames also stabilize columns and runway beams for an overhead crane system with two 50 ton cranes. The crane columns consist of round HSS sections, supported in the plane of the crane girder by attachments to the nose pipes of the trussed frames. These attachments allow vertical slippage so that the crane columns are not subjected to trussed frame overturning forces. In the plane of the runway beams, the crane columns are supported by the bending stiffness of the attachment and nose pipe assemblies. The investigation of tolerances with regard to eccentricity of the crane rails and runway beams required the interaction between crane girders, crane columns, and trussed frames to be studied in detail. This study included elastic system stability including second order effects, crane runway beam stability analysis using direct analysis methods to account for second order effects, and inelastic system stability accounting for maximum crane column eccentricity and second order effects. The paper discusses this study as well as its relationship to approximate methods of analysis for conceptual design of systems that are driven by stability considerations. INTRODUCTION The recently commissioned Wind Technology Testing Center (WTTC), in Charlestown, Massachusetts was designed to test a new generation of wind turbine blades for off-shore wind farm development. Whereas the largest blades for land-based wind farms in the United States are currently on the order of 50 m long, and generate 2-3 MW of power per turbine, offshore wind turbines are expected to reach power outputs as high as 10 MW and require blade lengths of up to 90 m in the next ten years. In order to support American research, development and manufacturing of these blades, the Department of Energy (DOE) helped fund the WTTC as the nation’s first high capacity blade testing facility near a deep-water port. Shown in Figure 1, the WTTC is the largest facility of its kind in the world and has the capacity to test up
to three 70 m long wind turbine blades simultaneously or a single blade up to 90 m in length (Hines & Ravindra 2011, Hines & Gibb 2011).
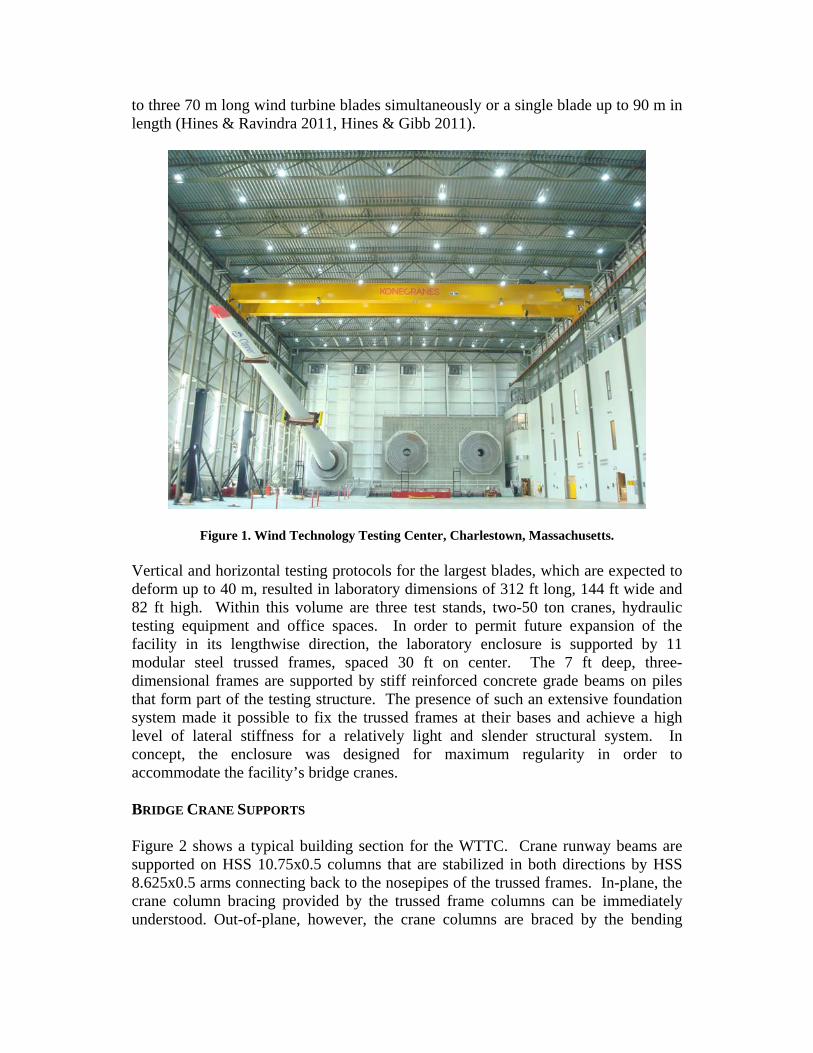
Figure 1. Wind Technology Testing Center, Charlestown, Massachusetts. Vertical and horizontal testing protocols for the largest blades, which are expected to deform up to 40 m, resulted in laboratory dimensions of 312 ft long, 144 ft wide and 82 ft high. Within this volume are three test stands, two-50 ton cranes, hydraulic testing equipment and office spaces. In order to permit future expansion of the facility in its lengthwise direction, the laboratory enclosure is supported by 11 modular steel trussed frames, spaced 30 ft on center. The 7 ft deep, three-dimensional frames are supported by stiff reinforced concrete grade beams on piles that form part of the testing structure. The presence of such an extensive foundation system made it possible to fix the trussed frames at their bases and achieve a high level of lateral stiffness for a relatively light and slender structural system. In concept, the enclosure was designed for maximum regularity in order to accommodate the facility’s bridge cranes. BRIDGE CRANE SUPPORTS Figure 2 shows a typical building section for the WTTC. Crane runway beams are supported on HSS 10.75x0.5 columns that are stabilized in both directions by HSS 8.625x0.5 arms connecting back to the nosepipes of the trussed frames. In-plane, the crane column bracing provided by the trussed frame columns can be immediately understood. Out-of-plane, however, the crane columns are braced by the bending
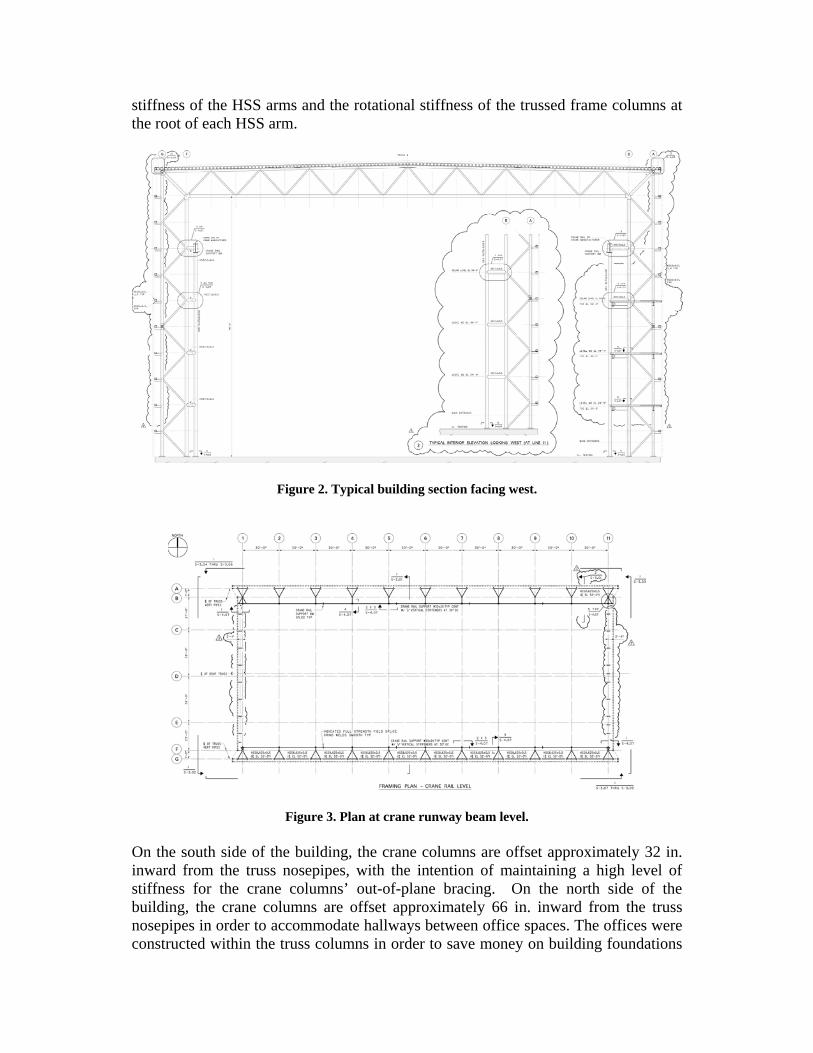
stiffness of the HSS arms and the rotational stiffness of the trussed frame columns at the root of each HSS arm.
Figure 2. Typical building section facing west.
Figure 3. Plan at crane runway beam level. On the south side of the building, the crane columns are offset approximately 32 in. inward from the truss nosepipes, with the intention of maintaining a high level of stiffness for the crane columns’ out-of-plane bracing. On the north side of the building, the crane columns are offset approximately 66 in. inward from the truss nosepipes in order to accommodate hallways between office spaces. The offices were constructed within the truss columns in order to save money on building foundations
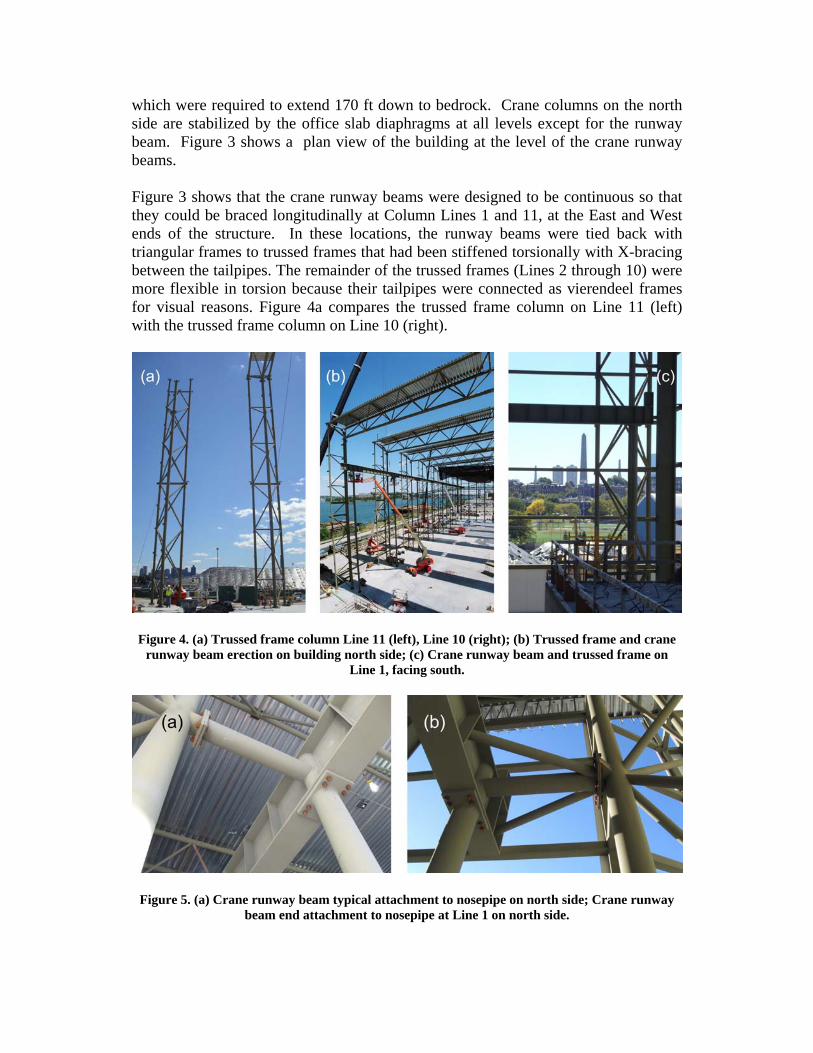
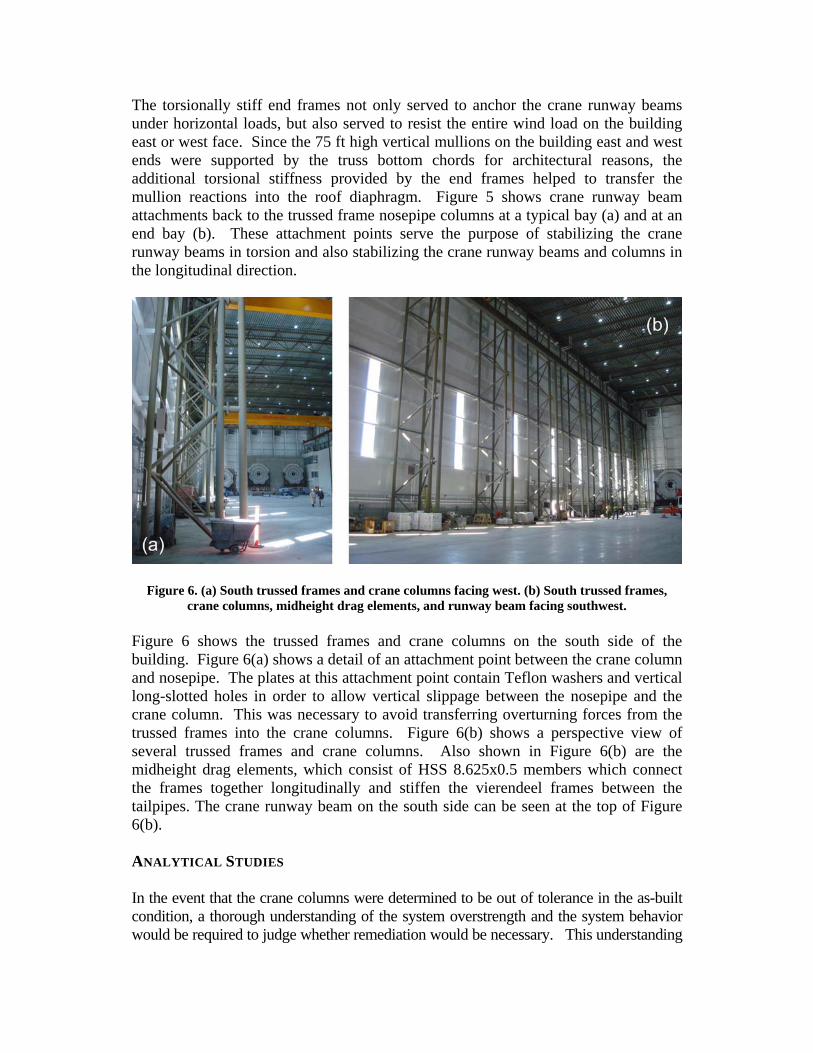
which were required to extend 170 ft down to bedrock. Crane columns on the north side are stabilized by the office slab diaphragms at all levels except for the runway beam. Figure 3 shows a plan view of the building at the level of the crane runway beams. Figure 3 shows that the crane runway beams were designed to be continuous so that they could be braced longitudinally at Column Lines 1 and 11, at the East and West ends of the structure. In these locations, the runway beams were tied back with triangular frames to trussed frames that had been stiffened torsionally with X-bracing between the tailpipes. The remainder of the trussed frames (Lines 2 through 10) were more flexible in torsion because their tailpipes were connected as vierendeel frames for visual reasons. Figure 4a compares the trussed frame column on Line 11 (left) with the trussed frame column on Line 10 (right).
Figure 4. (a) Trussed frame column Line 11 (left), Line 10 (right); (b) Trussed frame and crane
runway beam erection on building north side; (c) Crane runway beam and trussed frame on Line 1, facing south.
Figure 5. (a) Crane runway beam typical attachment to nosepipe on north side; Crane runway beam end attachment to nosepipe at Line 1 on north side.
The torsionally stiff end frames not only served to anchor the crane runway beams under horizontal loads, but also served to resist the entire wind load on the building east or west face. Since the 75 ft high vertical mullions on the building east and west ends were supported by the truss bottom chords for architectural reasons, the additional torsional stiffness provided by the end frames helped to transfer the mullion reactions into the roof diaphragm. Figure 5 shows crane runway beam attachments back to the trussed frame nosepipe columns at a typical bay (a) and at an end bay (b). These attachment points serve the purpose of stabilizing the crane runway beams in torsion and also stabilizing the crane runway beams and columns in the longitudinal direction.
Figure 6. (a) South trussed frames and crane columns facing west. (b) South trussed frames, crane columns, midheight drag elements, and runway beam facing southwest.
Figure 6 shows the trussed frames and crane columns on the south side of the building. Figure 6(a) shows a detail of an attachment point between the crane column and nosepipe. The plates at this attachment point contain Teflon washers and vertical long-slotted holes in order to allow vertical slippage between the nosepipe and the crane column. This was necessary to avoid transferring overturning forces from the trussed frames into the crane columns. Figure 6(b) shows a perspective view of several trussed frames and crane columns. Also shown in Figure 6(b) are the midheight drag elements, which consist of HSS 8.625x0.5 members which connect the frames together longitudinally and stiffen the vierendeel frames between the tailpipes. The crane runway beam on the south side can be seen at the top of Figure 6(b). ANALYTICAL STUDIES In the event that the crane columns were determined to be out of tolerance in the as-built condition, a thorough understanding of the system overstrength and the system behavior would be required to judge whether remediation would be necessary. This understanding
was developed in series of detailed analytical studies. In order to assess the system behavior in general, and its performance under the influence of crane girder eccentricities, the following analyses were conducted:
1. Elastic system stability including second order effects. 2. Crane runway beam stability analysis using direct analysis methods to account
for second order effects. 3. Inelastic system stability accounting for maximum crane column eccentricity
and second order effects. Analysis #1— Elastic system stability including second order effects.
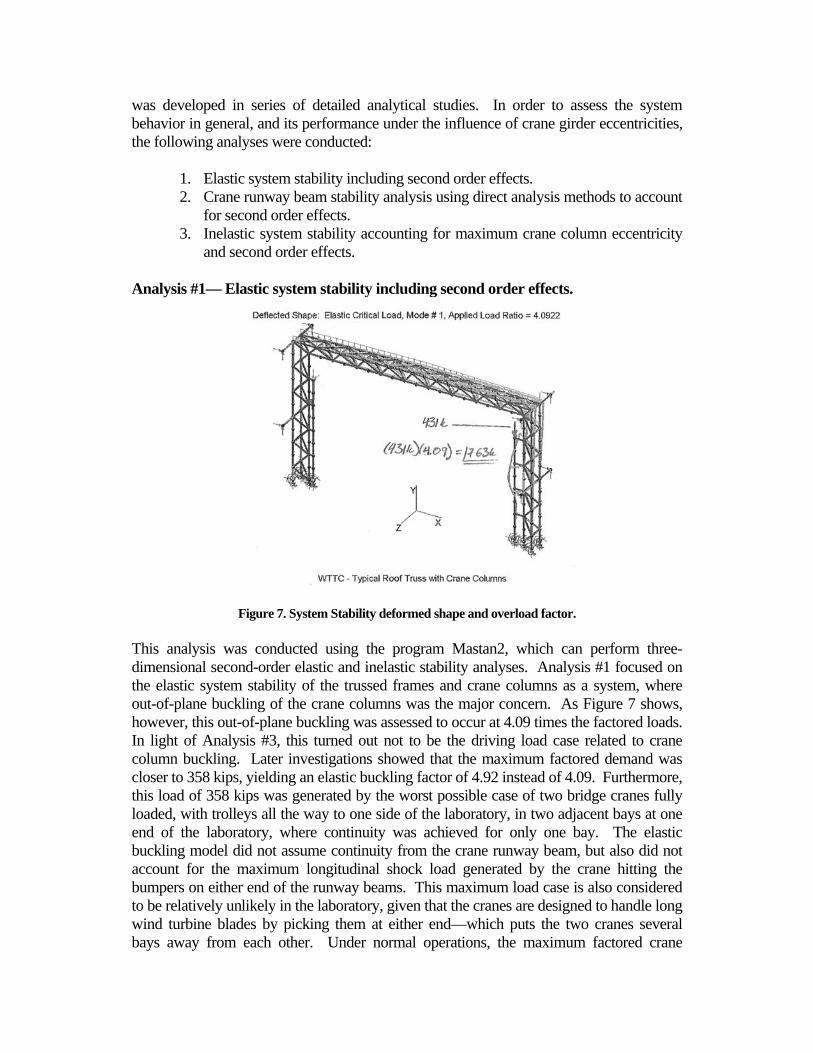
Figure 7. System Stability deformed shape and overload factor.
This analysis was conducted using the program Mastan2, which can perform three-dimensional second-order elastic and inelastic stability analyses. Analysis #1 focused on the elastic system stability of the trussed frames and crane columns as a system, where out-of-plane buckling of the crane columns was the major concern. As Figure 7 shows, however, this out-of-plane buckling was assessed to occur at 4.09 times the factored loads. In light of Analysis #3, this turned out not to be the driving load case related to crane column buckling. Later investigations showed that the maximum factored demand was closer to 358 kips, yielding an elastic buckling factor of 4.92 instead of 4.09. Furthermore, this load of 358 kips was generated by the worst possible case of two bridge cranes fully loaded, with trolleys all the way to one side of the laboratory, in two adjacent bays at one end of the laboratory, where continuity was achieved for only one bay. The elastic buckling model did not assume continuity from the crane runway beam, but also did not account for the maximum longitudinal shock load generated by the crane hitting the bumpers on either end of the runway beams. This maximum load case is also considered to be relatively unlikely in the laboratory, given that the cranes are designed to handle long wind turbine blades by picking them at either end—which puts the two cranes several bays away from each other. Under normal operations, the maximum factored crane
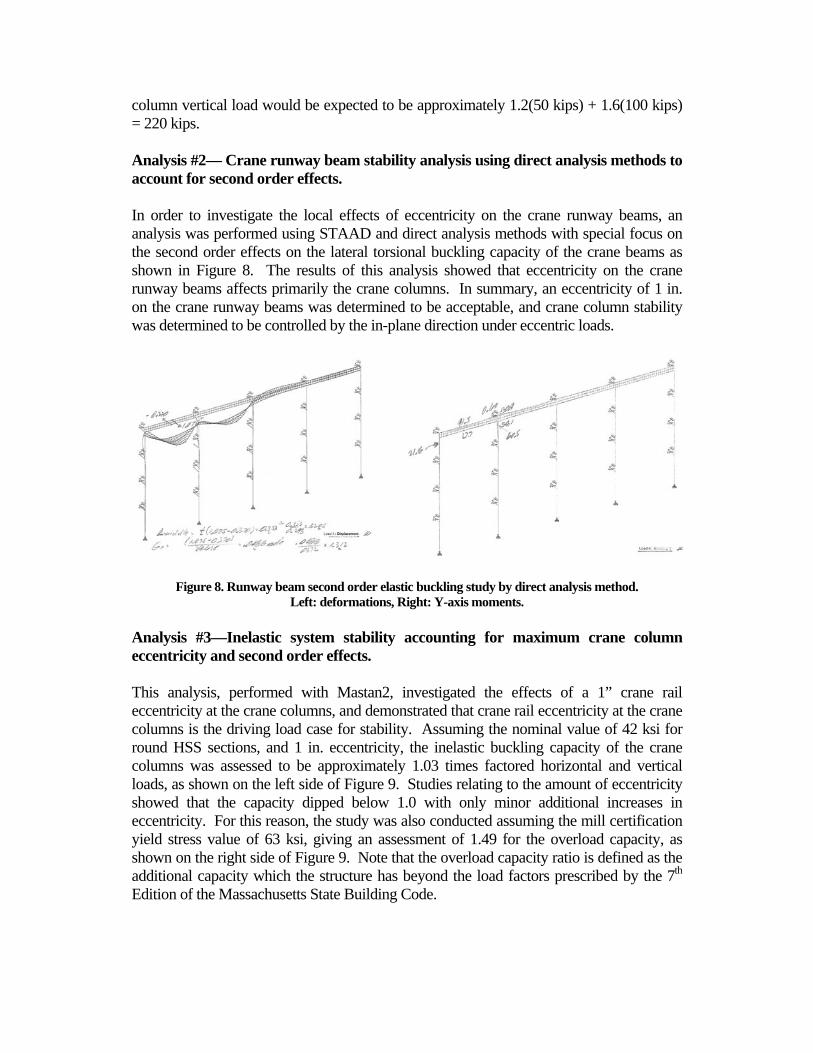
column vertical load would be expected to be approximately 1.2(50 kips) + 1.6(100 kips) = 220 kips. Analysis #2— Crane runway beam stability analysis using direct analysis methods to account for second order effects. In order to investigate the local effects of eccentricity on the crane runway beams, an analysis was performed using STAAD and direct analysis methods with special focus on the second order effects on the lateral torsional buckling capacity of the crane beams as shown in Figure 8. The results of this analysis showed that eccentricity on the crane runway beams affects primarily the crane columns. In summary, an eccentricity of 1 in. on the crane runway beams was determined to be acceptable, and crane column stability was determined to be controlled by the in-plane direction under eccentric loads.
Figure 8. Runway beam second order elastic buckling study by direct analysis method. Left: deformations, Right: Y-axis moments.
Analysis #3—Inelastic system stability accounting for maximum crane column eccentricity and second order effects. This analysis, performed with Mastan2, investigated the effects of a 1” crane rail eccentricity at the crane columns, and demonstrated that crane rail eccentricity at the crane columns is the driving load case for stability. Assuming the nominal value of 42 ksi for round HSS sections, and 1 in. eccentricity, the inelastic buckling capacity of the crane columns was assessed to be approximately 1.03 times factored horizontal and vertical loads, as shown on the left side of Figure 9. Studies relating to the amount of eccentricity showed that the capacity dipped below 1.0 with only minor additional increases in eccentricity. For this reason, the study was also conducted assuming the mill certification yield stress value of 63 ksi, giving an assessment of 1.49 for the overload capacity, as shown on the right side of Figure 9. Note that the overload capacity ratio is defined as the additional capacity which the structure has beyond the load factors prescribed by the 7th Edition of the Massachusetts State Building Code.
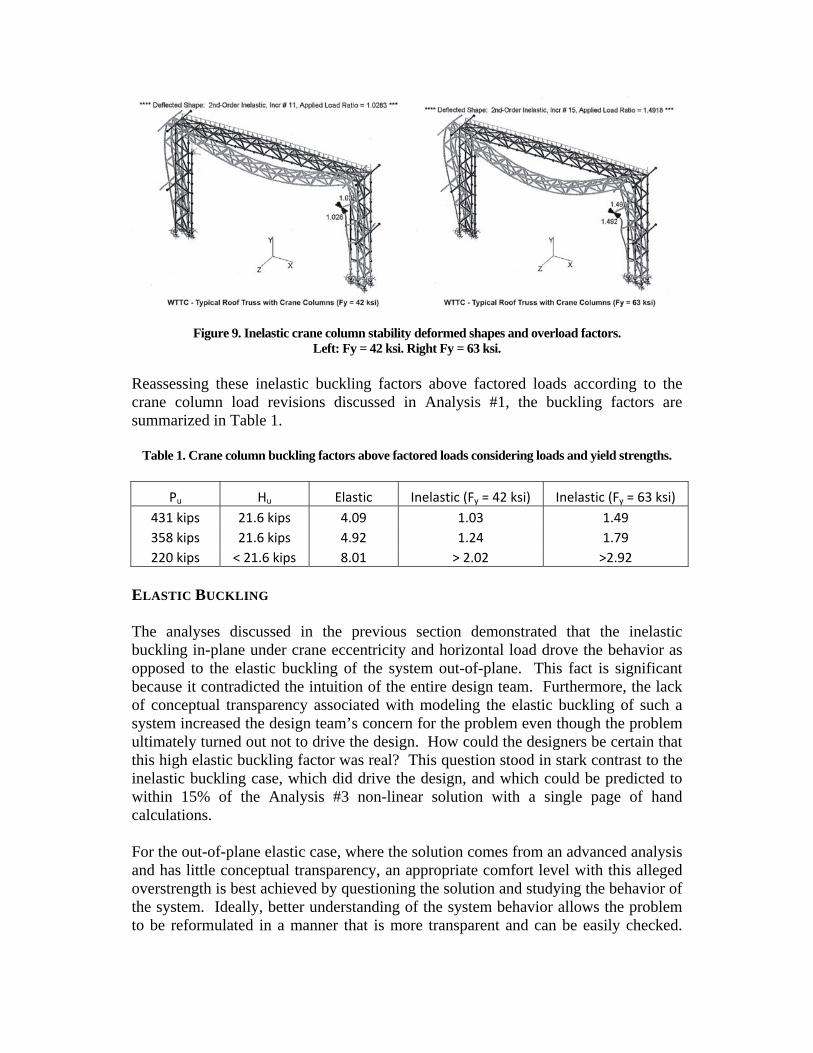
Figure 9. Inelastic crane column stability deformed shapes and overload factors. Left: Fy = 42 ksi. Right Fy = 63 ksi.
Reassessing these inelastic buckling factors above factored loads according to the crane column load revisions discussed in Analysis #1, the buckling factors are summarized in Table 1.
Table 1. Crane column buckling factors above factored loads considering loads and yield strengths.
Pu Hu Elastic Inelastic (Fy = 42 ksi) Inelastic (Fy = 63 ksi)
431 kips 21.6 kips 4.09 1.03 1.49
358 kips 21.6 kips 4.92 1.24 1.79
220 kips < 21.6 kips 8.01 > 2.02 >2.92
ELASTIC BUCKLING The analyses discussed in the previous section demonstrated that the inelastic buckling in-plane under crane eccentricity and horizontal load drove the behavior as opposed to the elastic buckling of the system out-of-plane. This fact is significant because it contradicted the intuition of the entire design team. Furthermore, the lack of conceptual transparency associated with modeling the elastic buckling of such a system increased the design team’s concern for the problem even though the problem ultimately turned out not to drive the design. How could the designers be certain that this high elastic buckling factor was real? This question stood in stark contrast to the inelastic buckling case, which did drive the design, and which could be predicted to within 15% of the Analysis #3 non-linear solution with a single page of hand calculations. For the out-of-plane elastic case, where the solution comes from an advanced analysis and has little conceptual transparency, an appropriate comfort level with this alleged overstrength is best achieved by questioning the solution and studying the behavior of the system. Ideally, better understanding of the system behavior allows the problem to be reformulated in a manner that is more transparent and can be easily checked.
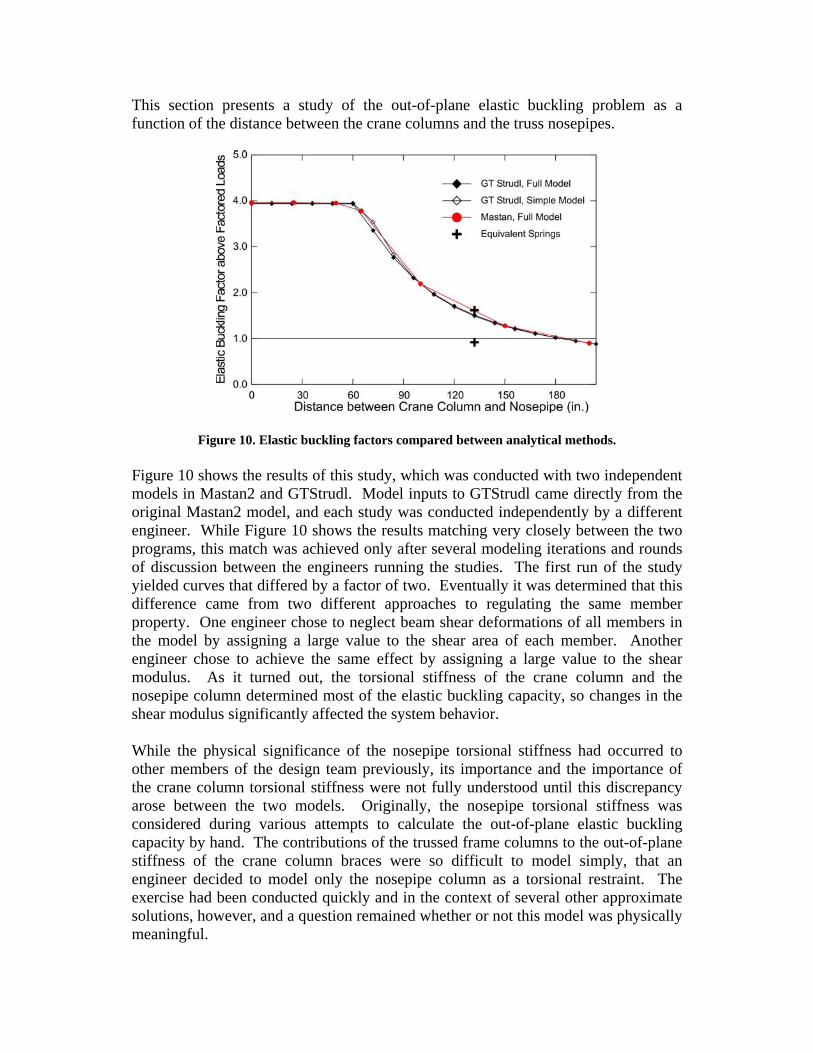
This section presents a study of the out-of-plane elastic buckling problem as a function of the distance between the crane columns and the truss nosepipes.
Figure 10. Elastic buckling factors compared between analytical methods. Figure 10 shows the results of this study, which was conducted with two independent models in Mastan2 and GTStrudl. Model inputs to GTStrudl came directly from the original Mastan2 model, and each study was conducted independently by a different engineer. While Figure 10 shows the results matching very closely between the two programs, this match was achieved only after several modeling iterations and rounds of discussion between the engineers running the studies. The first run of the study yielded curves that differed by a factor of two. Eventually it was determined that this difference came from two different approaches to regulating the same member property. One engineer chose to neglect beam shear deformations of all members in the model by assigning a large value to the shear area of each member. Another engineer chose to achieve the same effect by assigning a large value to the shear modulus. As it turned out, the torsional stiffness of the crane column and the nosepipe column determined most of the elastic buckling capacity, so changes in the shear modulus significantly affected the system behavior. While the physical significance of the nosepipe torsional stiffness had occurred to other members of the design team previously, its importance and the importance of the crane column torsional stiffness were not fully understood until this discrepancy arose between the two models. Originally, the nosepipe torsional stiffness was considered during various attempts to calculate the out-of-plane elastic buckling capacity by hand. The contributions of the trussed frame columns to the out-of-plane stiffness of the crane column braces were so difficult to model simply, that an engineer decided to model only the nosepipe column as a torsional restraint. The exercise had been conducted quickly and in the context of several other approximate solutions, however, and a question remained whether or not this model was physically meaningful.
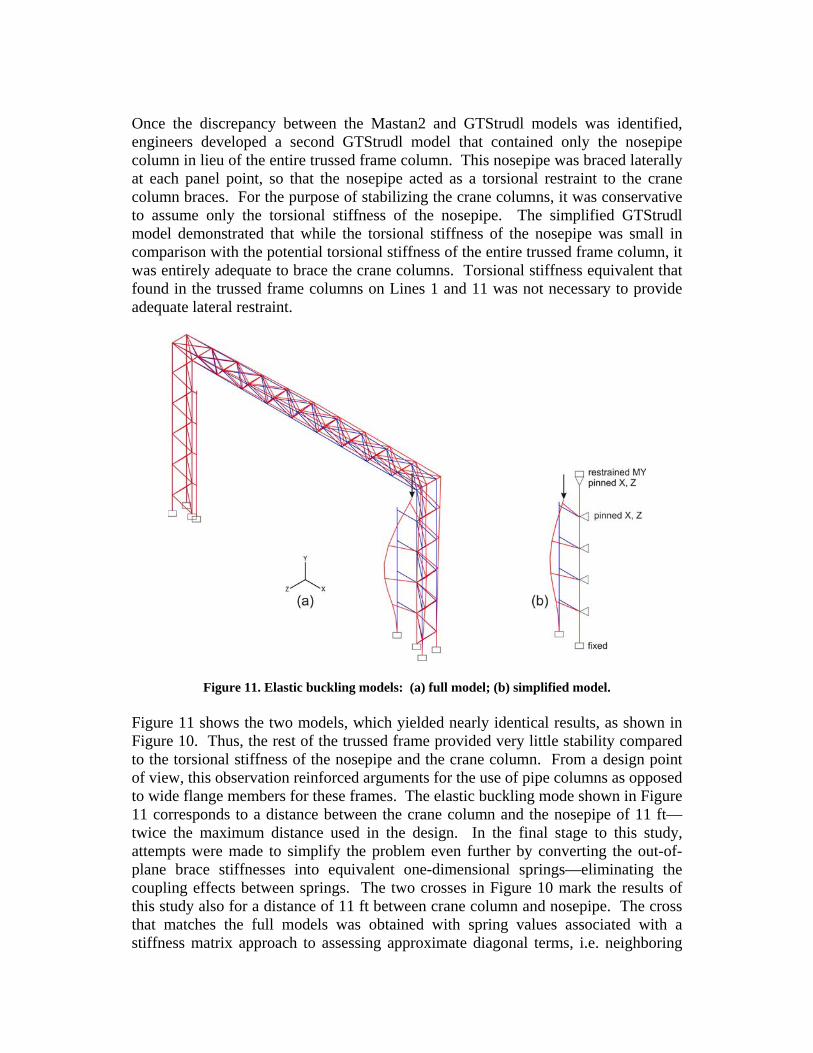
Once the discrepancy between the Mastan2 and GTStrudl models was identified, engineers developed a second GTStrudl model that contained only the nosepipe column in lieu of the entire trussed frame column. This nosepipe was braced laterally at each panel point, so that the nosepipe acted as a torsional restraint to the crane column braces. For the purpose of stabilizing the crane columns, it was conservative to assume only the torsional stiffness of the nosepipe. The simplified GTStrudl model demonstrated that while the torsional stiffness of the nosepipe was small in comparison with the potential torsional stiffness of the entire trussed frame column, it was entirely adequate to brace the crane columns. Torsional stiffness equivalent that found in the trussed frame columns on Lines 1 and 11 was not necessary to provide adequate lateral restraint.
Figure 11. Elastic buckling models: (a) full model; (b) simplified model. Figure 11 shows the two models, which yielded nearly identical results, as shown in Figure 10. Thus, the rest of the trussed frame provided very little stability compared to the torsional stiffness of the nosepipe and the crane column. From a design point of view, this observation reinforced arguments for the use of pipe columns as opposed to wide flange members for these frames. The elastic buckling mode shown in Figure 11 corresponds to a distance between the crane column and the nosepipe of 11 ft—twice the maximum distance used in the design. In the final stage to this study, attempts were made to simplify the problem even further by converting the out-of-plane brace stiffnesses into equivalent one-dimensional springs—eliminating the coupling effects between springs. The two crosses in Figure 10 mark the results of this study also for a distance of 11 ft between crane column and nosepipe. The cross that matches the full models was obtained with spring values associated with a stiffness matrix approach to assessing approximate diagonal terms, i.e. neighboring
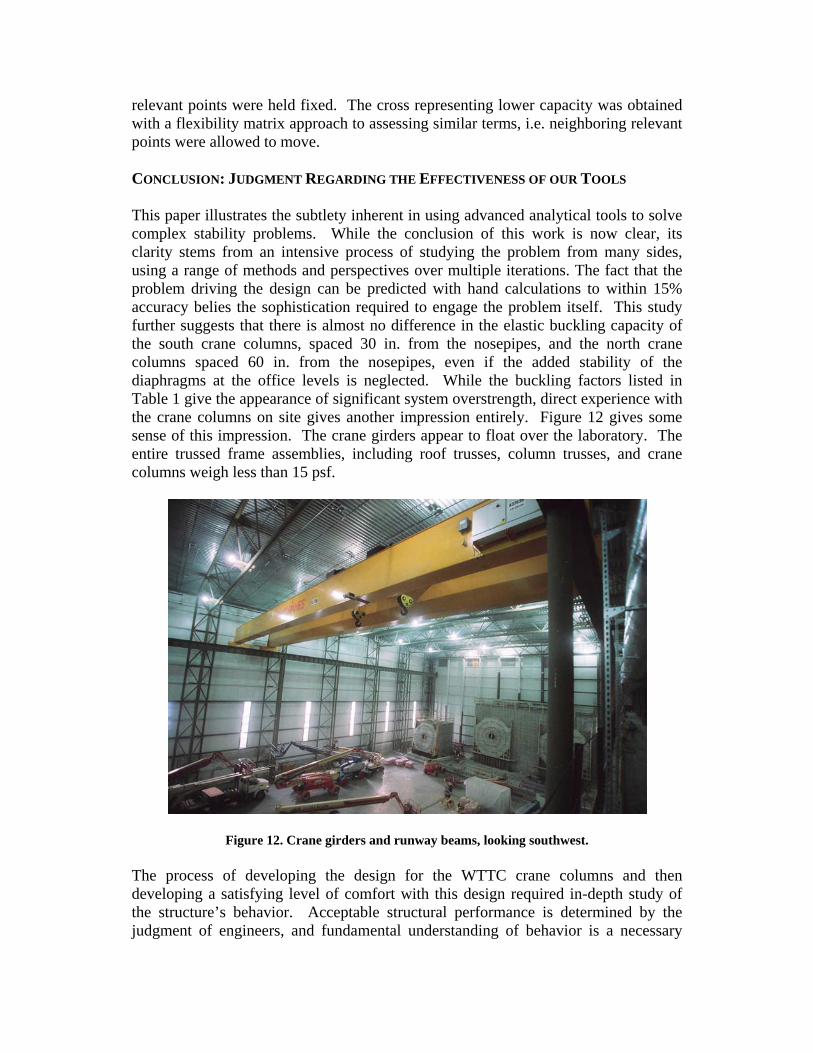
relevant points were held fixed. The cross representing lower capacity was obtained with a flexibility matrix approach to assessing similar terms, i.e. neighboring relevant points were allowed to move. CONCLUSION: JUDGMENT REGARDING THE EFFECTIVENESS OF OUR TOOLS This paper illustrates the subtlety inherent in using advanced analytical tools to solve complex stability problems. While the conclusion of this work is now clear, its clarity stems from an intensive process of studying the problem from many sides, using a range of methods and perspectives over multiple iterations. The fact that the problem driving the design can be predicted with hand calculations to within 15% accuracy belies the sophistication required to engage the problem itself. This study further suggests that there is almost no difference in the elastic buckling capacity of the south crane columns, spaced 30 in. from the nosepipes, and the north crane columns spaced 60 in. from the nosepipes, even if the added stability of the diaphragms at the office levels is neglected. While the buckling factors listed in Table 1 give the appearance of significant system overstrength, direct experience with the crane columns on site gives another impression entirely. Figure 12 gives some sense of this impression. The crane girders appear to float over the laboratory. The entire trussed frame assemblies, including roof trusses, column trusses, and crane columns weigh less than 15 psf.
Figure 12. Crane girders and runway beams, looking southwest. The process of developing the design for the WTTC crane columns and then developing a satisfying level of comfort with this design required in-depth study of the structure’s behavior. Acceptable structural performance is determined by the judgment of engineers, and fundamental understanding of behavior is a necessary
condition for such judgment. Fundamental understanding cannot be achieved in the context of a single answer, but rather requires convergence between multiple approaches to the same problem. The key physical insight that the torsional stiffnesses of the nosepipes and crane columns were critical to our understanding of the problem only acquired full significance in light of a mismatch between two independent models. Ironically, a “mistake” was critical to finding our path toward deeper understanding. For anyone familiar with the history of engineering, science, ethics or the arts, however, this “irony” is a common occurance (Hines and Billington 2004, Billington 1979, Dolnick 2010, Neiman 2009). Mistakes are not only a natural part of the creative process, they are critical to its success, because they provide contrasts that stimulate designers to think in new ways. The imperative for civil engineers to identify mistakes before they are constructed is often misinterpreted to mean that civil engineers must not make mistakes at any time. This naïve attitude obstructs engineers from assuming responsibility for their designs, and encourages them to rely too heavily on the “answers” that they get from spreadsheets and computational models. As we learned more about the behavior of the WTTC crane columns, our analyses grew more transparent. This transparency allowed us to make sense out of the design and its behavior. It formed the basis for our judgments regarding the structure—which were numerous and contained great variety as their context and meaning. Considering these observations, we measure the effectiveness of our tools not by their ability to supply answers but by their ability to support judgments. REFERENCES Billington, D.P. (1979) Robert Maillart’s Bridges, Princeton University Press, Princeton, New Jersey, 146 pp. Dolnick, E. (2011) The Clockwork Universe, Harper Collins, New York, New York, 378 pp. Hines, E.M. and Gibb, W.C. (2011) “Turning the Corner with Steel Castings,” AISC Modern Steel Construction, Dec., pp. 36-40. Hines, E.M. and Ravindra, M.V. (2011) “Testing Tomorrow’s Turbines,” ASCE Civil Engineering Magazine, Jul., pp. 65-71. Hines, E.M. and Billington, D.P. (2004) “Anton Tedesko and the Introduction of Thin Shell Concrete Roofs in the United States,” ASCE Journal of Structural Engineering, 130(11), Nov., pp. 1639-1650. Neiman, S. (2009) Moral Clarity, Princeton University Press, Princeton, New Jersey, 470 pp.