Embed Size (px)
Citation preview
1
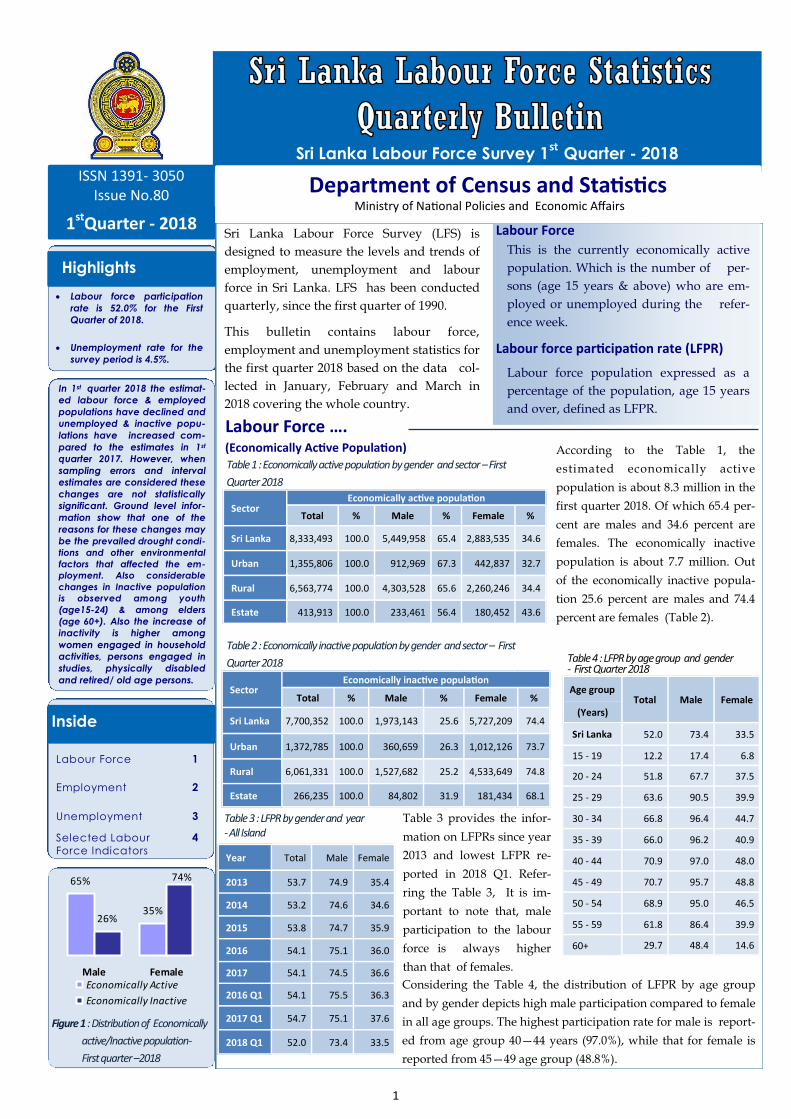
According to the Table 1, the
estimated economically active
population is about 8.3 million in the
first quarter 2018. Of which 65.4 per-
cent are males and 34.6 percent are
females. The economically inactive
population is about 7.7 million. Out
of the economically inactive popula-
tion 25.6 percent are males and 74.4
percent are females (Table 2).
Table 1 : Economically active population by gender and sector – First
Quarter 2018
Sri Lanka Labour Force Survey 1st
Quarter - 2018
Highlights
Department of Census and Statistics Ministry of National Policies and Economic Affairs
Labour Force ….
Sri Lanka Labour Force Survey (LFS) is
designed to measure the levels and trends of
employment, unemployment and labour
force in Sri Lanka. LFS has been conducted
quarterly, since the first quarter of 1990.
This bulletin contains labour force,
employment and unemployment statistics for
the first quarter 2018 based on the data col-
lected in January, February and March in
2018 covering the whole country.
Labour Force
This is the currently economically active
population. Which is the number of per-
sons (age 15 years & above) who are em-
ployed or unemployed during the refer-
ence week.
Labour force participation rate (LFPR)
Labour force population expressed as a
percentage of the population, age 15 years
and over, defined as LFPR.
Inside
Table 2 : Economically inactive population by gender and sector – First
Quarter 2018
Labour Force 1
Employment 2
Unemployment 3
Selected Labour
Force Indicators
4
1stQuarter - 2018
ISSN 1391- 3050 Issue No.80
Figure 1 : Distribution of Economically
active/Inactive population-
First quarter –2018
65%
35%26%
74%
Male FemaleEconomically Active
Economically Inactive
Sector Economically active population
Total % Male % Female %
Sri Lanka 8,333,493 100.0 5,449,958 65.4 2,883,535 34.6
Urban 1,355,806 100.0 912,969 67.3 442,837 32.7
Rural 6,563,774 100.0 4,303,528 65.6 2,260,246 34.4
Estate 413,913 100.0 233,461 56.4 180,452 43.6
Sector Economically inactive population
Total % Male % Female %
Sri Lanka 7,700,352 100.0 1,973,143 25.6 5,727,209 74.4
Urban 1,372,785 100.0 360,659 26.3 1,012,126 73.7
Rural 6,061,331 100.0 1,527,682 25.2 4,533,649 74.8
Estate 266,235 100.0 84,802 31.9 181,434 68.1
Table 4 : LFPR by age group and gender - First Quarter 2018
Considering the Table 4, the distribution of LFPR by age group
and by gender depicts high male participation compared to female
in all age groups. The highest participation rate for male is report-
ed from age group 40—44 years (97.0%), while that for female is
reported from 45—49 age group (48.8%).
Table 3 provides the infor-
mation on LFPRs since year
2013 and lowest LFPR re-
ported in 2018 Q1. Refer-
ring the Table 3, It is im-
portant to note that, male
participation to the labour
force is always higher
than that of females.
Labour force participation
rate is 52.0% for the First
Quarter of 2018.
Unemployment rate for the
survey period is 4.5%.
Table 3 : LFPR by gender and year - All Island
(Economically Active Population)
Age group Total Male Female
(Years)
Sri Lanka 52.0 73.4 33.5
15 - 19 12.2 17.4 6.8
20 - 24 51.8 67.7 37.5
25 - 29 63.6 90.5 39.9
30 - 34 66.8 96.4 44.7
35 - 39 66.0 96.2 40.9
40 - 44 70.9 97.0 48.0
45 - 49 70.7 95.7 48.8
50 - 54 68.9 95.0 46.5
55 - 59 61.8 86.4 39.9
60+ 29.7 48.4 14.6
Year Total Male Female
2013 53.7 74.9 35.4
2014 53.2 74.6 34.6
2015 53.8 74.7 35.9
2016 54.1 75.1 36.0
2017 54.1 74.5 36.6
2016 Q1 54.1 75.5 36.3
2017 Q1 54.7 75.1 37.6
2018 Q1 52.0 73.4 33.5
In 1st quarter 2018 the estimat-
ed labour force & employed
populations have declined and
unemployed & inactive popu-
lations have increased com-
pared to the estimates in 1st
quarter 2017. However, when
sampling errors and interval
estimates are considered these
changes are not statistically
significant. Ground level infor-
mation show that one of the
reasons for these changes may
be the prevailed drought condi-
tions and other environmental
factors that affected the em-
ployment. Also considerable
changes in Inactive population
is observed among youth
(age15-24) & among elders
(age 60+). Also the increase of
inactivity is higher among
women engaged in household
activities, persons engaged in
studies, physically disabled
and retired/ old age persons.
2
Employment ... Definition of ‘Employed’
Persons, who worked
at least one hour
during the reference
period, as paid
employees, employers,
own account workers
or contributing family
workers are said to be
employed. This also
includes persons with
a job but not at work
during the reference
period .
Reference Period :
Previous week of the survey week
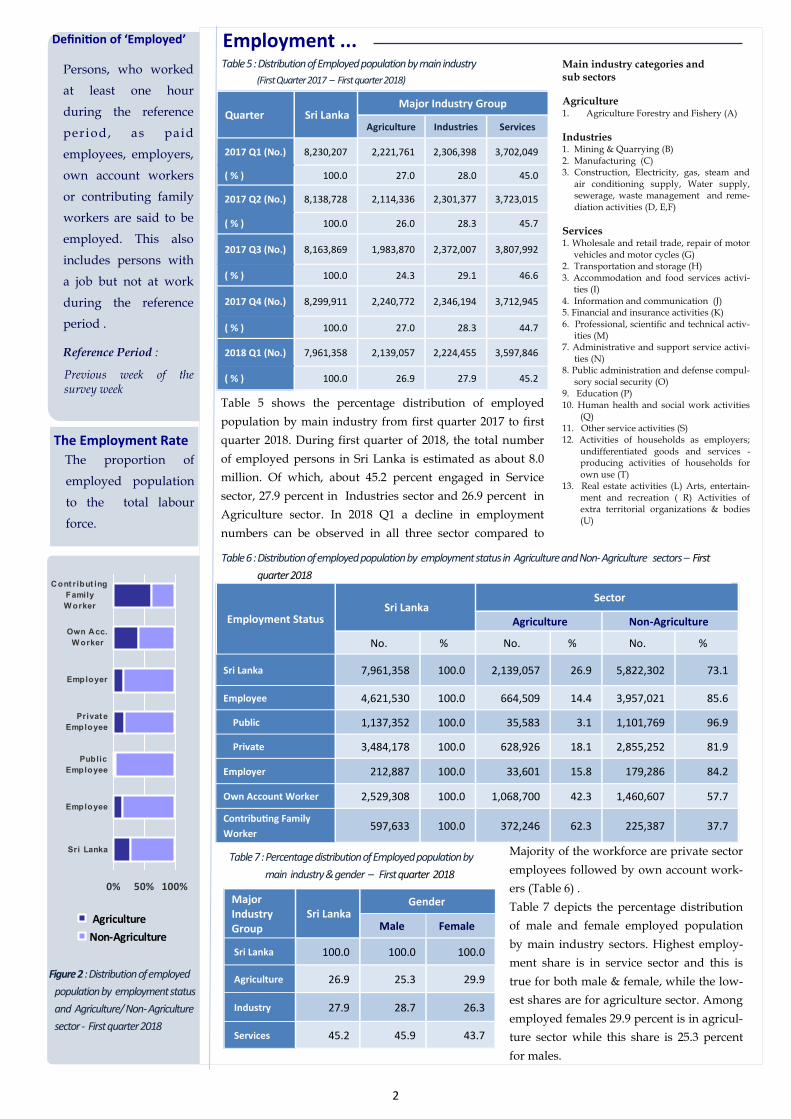
Employment Status Sri Lanka
Sector
Agriculture Non-Agriculture
No. % No. % No. %
Sri Lanka 7,961,358 100.0 2,139,057 26.9 5,822,302 73.1
Employee 4,621,530 100.0 664,509 14.4 3,957,021 85.6
Public 1,137,352 100.0 35,583 3.1 1,101,769 96.9
Private 3,484,178 100.0 628,926 18.1 2,855,252 81.9
Employer 212,887 100.0 33,601 15.8 179,286 84.2
Own Account Worker 2,529,308 100.0 1,068,700 42.3 1,460,607 57.7
Contributing Family
Worker 597,633 100.0 372,246 62.3 225,387 37.7
Table 5 shows the percentage distribution of employed
population by main industry from first quarter 2017 to first
quarter 2018. During first quarter of 2018, the total number
of employed persons in Sri Lanka is estimated as about 8.0
million. Of which, about 45.2 percent engaged in Service
sector, 27.9 percent in Industries sector and 26.9 percent in
Agriculture sector. In 2018 Q1 a decline in employment
numbers can be observed in all three sector compared to
Table 6 : Distribution of employed population by employment status in Agriculture and Non- Agriculture sectors – First
quarter 2018
Figure 2 : Distribution of employed
population by employment status
and Agriculture/ Non- Agriculture
sector - First quarter 2018
Major Industry Group
Sri Lanka Gender
Male Female
Sri Lanka 100.0 100.0 100.0
Agriculture 26.9 25.3 29.9
Industry 27.9 28.7 26.3
Services 45.2 45.9 43.7
Table 7 : Percentage distribution of Employed population by
main industry & gender – First quarter 2018
Majority of the workforce are private sector
employees followed by own account work-
ers (Table 6) .
Table 7 depicts the percentage distribution
of male and female employed population
by main industry sectors. Highest employ-
ment share is in service sector and this is
true for both male & female, while the low-
est shares are for agriculture sector. Among
employed females 29.9 percent is in agricul-
ture sector while this share is 25.3 percent
for males.
Table 5 : Distribution of Employed population by main industry
(First Quarter 2017 – First quarter 2018)
Quarter Sri Lanka Major Industry Group
Agriculture Industries Services
2017 Q1 (No.) 8,230,207 2,221,761 2,306,398 3,702,049
( % ) 100.0 27.0 28.0 45.0
2017 Q2 (No.) 8,138,728 2,114,336 2,301,377 3,723,015
( % ) 100.0 26.0 28.3 45.7
2017 Q3 (No.) 8,163,869 1,983,870 2,372,007 3,807,992
( % ) 100.0 24.3 29.1 46.6
2017 Q4 (No.) 8,299,911 2,240,772 2,346,194 3,712,945
( % ) 100.0 27.0 28.3 44.7
2018 Q1 (No.) 7,961,358 2,139,057 2,224,455 3,597,846
( % ) 100.0 26.9 27.9 45.2
Main industry categories and sub sectors
Agriculture
1. Agriculture Forestry and Fishery (A)
Industries 1. Mining & Quarrying (B) 2. Manufacturing (C) 3. Construction, Electricity, gas, steam and
air conditioning supply, Water supply, sewerage, waste management and reme-diation activities (D, E,F)
Services 1. Wholesale and retail trade, repair of motor
vehicles and motor cycles (G) 2. Transportation and storage (H) 3. Accommodation and food services activi-
ties (I) 4. Information and communication (J) 5. Financial and insurance activities (K) 6. Professional, scientific and technical activ-
ities (M) 7. Administrative and support service activi-
ties (N) 8. Public administration and defense compul-
sory social security (O) 9. Education (P) 10. Human health and social work activities
(Q) 11. Other service activities (S) 12. Activities of households as employers;
undifferentiated goods and services - producing activities of households for own use (T)
13. Real estate activities (L) Arts, entertain-ment and recreation ( R) Activities of extra territorial organizations & bodies (U)
0% 50% 100%
Sri Lanka
Employee
Public
Employee
Privat e
Employee
Employer
Own Acc.
W orker
Cont ribut ing
Family
W orker
Agriculture
Non-Agriculture
The Employment Rate
The proportion of
employed population
to the total labour
force.
3
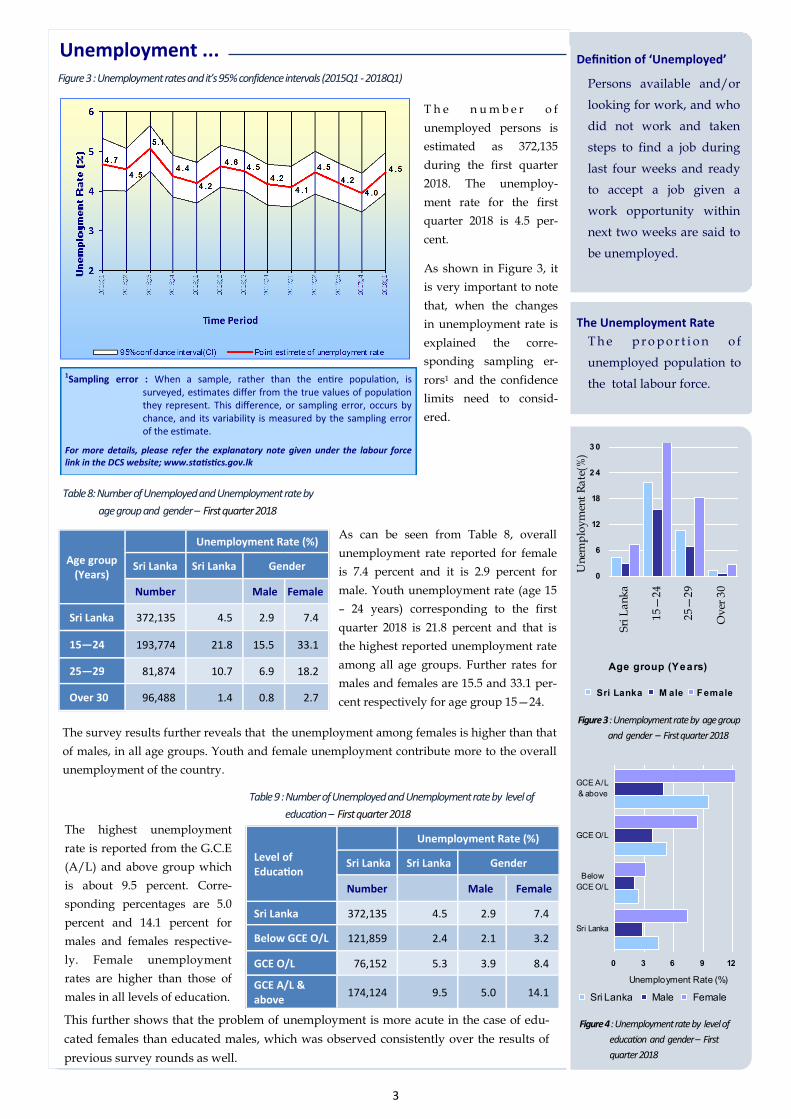
Figure 3 : Unemployment rates and it’s 95% confidence intervals (2015Q1 - 2018Q1)
Unemployment ... Definition of ‘Unemployed’
Persons available and/or
looking for work, and who
did not work and taken
steps to find a job during
last four weeks and ready
to accept a job given a
work opportunity within
next two weeks are said to
be unemployed.
The Unemployment Rate
T h e p r o p o r t i o n o f
unemployed population to
the total labour force.
T h e n u m b e r o f
unemployed persons is
estimated as 372,135
during the first quarter
2018. The unemploy-
ment rate for the first
quarter 2018 is 4.5 per-
cent.
As shown in Figure 3, it
is very important to note
that, when the changes
in unemployment rate is
explained the corre-
sponding sampling er-
rors1 and the confidence
limits need to consid-
ered.
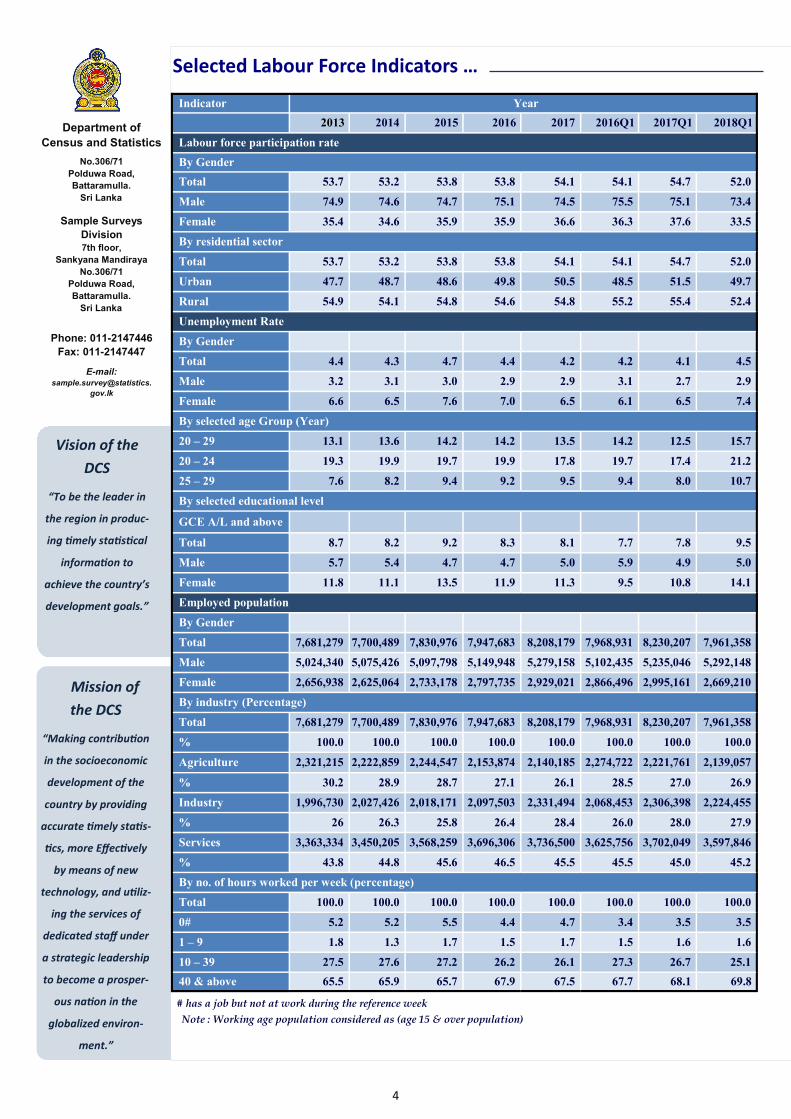
Age group (Years)
Unemployment Rate (%)
Sri Lanka Sri Lanka Gender
Number Male Female
Sri Lanka 372,135 4.5 2.9 7.4
15—24 193,774 21.8 15.5 33.1
25—29 81,874 10.7 6.9 18.2
Over 30 96,488 1.4 0.8 2.7
Table 8: Number of Unemployed and Unemployment rate by
age group and gender – First quarter 2018
Level of Education
Unemployment Rate (%)
Sri Lanka Sri Lanka Gender
Number Male Female
Sri Lanka 372,135 4.5 2.9 7.4
Below GCE O/L 121,859 2.4 2.1 3.2
GCE O/L 76,152 5.3 3.9 8.4
GCE A/L & above
174,124 9.5 5.0 14.1
Table 9 : Number of Unemployed and Unemployment rate by level of
education – First quarter 2018
This further shows that the problem of unemployment is more acute in the case of edu-
cated females than educated males, which was observed consistently over the results of
previous survey rounds as well.
As can be seen from Table 8, overall
unemployment rate reported for female
is 7.4 percent and it is 2.9 percent for
male. Youth unemployment rate (age 15
– 24 years) corresponding to the first
quarter 2018 is 21.8 percent and that is
the highest reported unemployment rate
among all age groups. Further rates for
males and females are 15.5 and 33.1 per-
cent respectively for age group 15—24.
Figure 4 : Unemployment rate by level of
education and gender – First
quarter 2018
1Sampling error : When a sample, rather than the entire population, is surveyed, estimates differ from the true values of population they represent. This difference, or sampling error, occurs by chance, and its variability is measured by the sampling error of the estimate.
For more details, please refer the explanatory note given under the labour force link in the DCS website; www.statistics.gov.lk
0 3 6 9 12
Sri Lanka
Below
GCE O/L
GCE O/L
GCE A/L
& above
Unemployment Rate (%)
Sri Lanka Male Female
Figure 3 : Unemployment rate by age group
and gender – First quarter 2018 The survey results further reveals that the unemployment among females is higher than that
of males, in all age groups. Youth and female unemployment contribute more to the overall
unemployment of the country.
The highest unemployment
rate is reported from the G.C.E
(A/L) and above group which
is about 9.5 percent. Corre-
sponding percentages are 5.0
percent and 14.1 percent for
males and females respective-
ly. Female unemployment
rates are higher than those of
males in all levels of education.
0
6
12
18
2 4
3 0
Sri
La
nk
a
15—24
25—29
Ov
er 3
0
Age group (Years)
Un
emp
loy
men
t R
ate
(%)
Sri Lanka M ale F emale
4
Department of
Census and Statistics
No.306/71
Polduwa Road,
Battaramulla.
Sri Lanka
Sample Surveys
Division
7th floor,
Sankyana Mandiraya
No.306/71
Polduwa Road,
Battaramulla.
Sri Lanka
Phone: 011-2147446
Fax: 011-2147447
E-mail: sample.survey@statistics.
gov.lk
Vision of the
DCS
“To be the leader in
the region in produc-
ing timely statistical
information to
achieve the country’s
development goals.”
Mission of
the DCS
“Making contribution
in the socioeconomic
development of the
country by providing
accurate timely statis-
tics, more Effectively
by means of new
technology, and utiliz-
ing the services of
dedicated staff under
a strategic leadership
to become a prosper-
ous nation in the
globalized environ-
ment.”
Selected Labour Force Indicators …
# has a job but not at work during the reference week
Note : Working age population considered as (age 15 & over population)
Indicator Year
2013 2014 2015 2016 2017 2016Q1 2017Q1 2018Q1
Labour force participation rate
By Gender
Total 53.7 53.2 53.8 53.8 54.1 54.1 54.7 52.0
Male 74.9 74.6 74.7 75.1 74.5 75.5 75.1 73.4
Female 35.4 34.6 35.9 35.9 36.6 36.3 37.6 33.5
By residential sector
Total 53.7 53.2 53.8 53.8 54.1 54.1 54.7 52.0
Urban 47.7 48.7 48.6 49.8 50.5 48.5 51.5 49.7
Rural 54.9 54.1 54.8 54.6 54.8 55.2 55.4 52.4
Unemployment Rate
By Gender
Total 4.4 4.3 4.7 4.4 4.2 4.2 4.1 4.5
Male 3.2 3.1 3.0 2.9 2.9 3.1 2.7 2.9
Female 6.6 6.5 7.6 7.0 6.5 6.1 6.5 7.4
By selected age Group (Year)
20 – 29 13.1 13.6 14.2 14.2 13.5 14.2 12.5 15.7
20 – 24 19.3 19.9 19.7 19.9 17.8 19.7 17.4 21.2
25 – 29 7.6 8.2 9.4 9.2 9.5 9.4 8.0 10.7
By selected educational level
GCE A/L and above
Total 8.7 8.2 9.2 8.3 8.1 7.7 7.8 9.5
Male 5.7 5.4 4.7 4.7 5.0 5.9 4.9 5.0
Female 11.8 11.1 13.5 11.9 11.3 9.5 10.8 14.1
Employed population
By Gender
Total 7,681,279 7,700,489 7,830,976 7,947,683 8,208,179 7,968,931 8,230,207 7,961,358
Male 5,024,340 5,075,426 5,097,798 5,149,948 5,279,158 5,102,435 5,235,046 5,292,148
Female 2,656,938 2,625,064 2,733,178 2,797,735 2,929,021 2,866,496 2,995,161 2,669,210
By industry (Percentage)
Total 7,681,279 7,700,489 7,830,976 7,947,683 8,208,179 7,968,931 8,230,207 7,961,358
% 100.0 100.0 100.0 100.0 100.0 100.0 100.0 100.0
Agriculture 2,321,215 2,222,859 2,244,547 2,153,874 2,140,185 2,274,722 2,221,761 2,139,057
% 30.2 28.9 28.7 27.1 26.1 28.5 27.0 26.9
Industry 1,996,730 2,027,426 2,018,171 2,097,503 2,331,494 2,068,453 2,306,398 2,224,455
% 26 26.3 25.8 26.4 28.4 26.0 28.0 27.9
Services 3,363,334 3,450,205 3,568,259 3,696,306 3,736,500 3,625,756 3,702,049 3,597,846
% 43.8 44.8 45.6 46.5 45.5 45.5 45.0 45.2
By no. of hours worked per week (percentage)
Total 100.0 100.0 100.0 100.0 100.0 100.0 100.0 100.0
0# 5.2 5.2 5.5 4.4 4.7 3.4 3.5 3.5
1 – 9 1.8 1.3 1.7 1.5 1.7 1.5 1.6 1.6
10 – 39 27.5 27.6 27.2 26.2 26.1 27.3 26.7 25.1
40 & above 65.5 65.9 65.7 67.9 67.5 67.7 68.1 69.8