Embed Size (px)
Citation preview
CA APM & Capacity Management for SOA-ESB IEHR for VA Sri Murthy, Sr Principal Consultant Brad Field, Sr Solution Strategist
Agenda
— Current Deployment of CA APM (Introscope) for SOA-ESB
— CA APM Capabilities
— CA Capacity Management
2 CA Application Performance Management Overview Copyright © 2010 CA. All rights reserved.
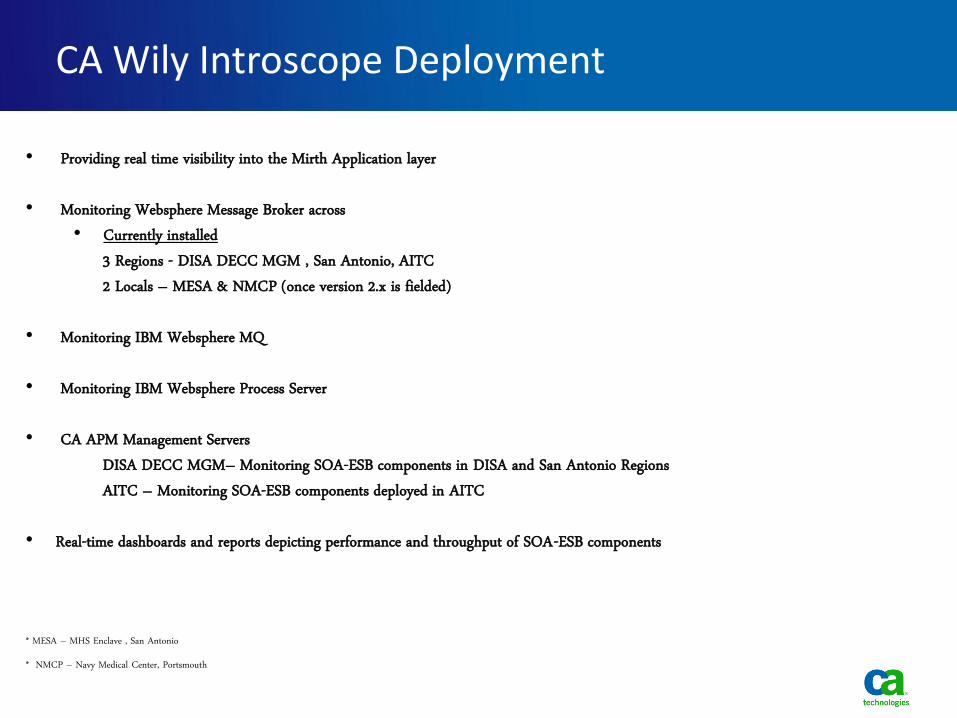
CA Wily Introscope Deployment
• Providing real time visibility into the Mirth Application layer • Monitoring Websphere Message Broker across
• Currently installed 3 Regions - DISA DECC MGM , San Antonio, AITC 2 Locals – MESA & NMCP (once version 2.x is fielded) • Monitoring IBM Websphere MQ • Monitoring IBM Websphere Process Server • CA APM Management Servers DISA DECC MGM– Monitoring SOA-ESB components in DISA and San Antonio Regions AITC – Monitoring SOA-ESB components deployed in AITC • Real-time dashboards and reports depicting performance and throughput of SOA-ESB components * MESA – MHS Enclave , San Antonio
* NMCP – Navy Medical Center, Portsmouth
CA APM for SOA – Monitors your SOA environment
— Proactively monitors SOA client and server performance, triage incidents, and analyze service-related problems.
— Extensive ESB support for IBM Websphere ESB, IBM Business Process Manager, Oracle, TIBCO, WebMethods Broker and more
— Provides visual representation of SOA dependencies.
— Provides correlated transaction tracing across SOA platforms.
— Provides detailed metrics that help you isolate problems to the web service, application, or back-end.
— Monitors SOAP faults for the web service transactions
4 August 2010 Introduction to Application Performance Management Copyright © 2010 CA
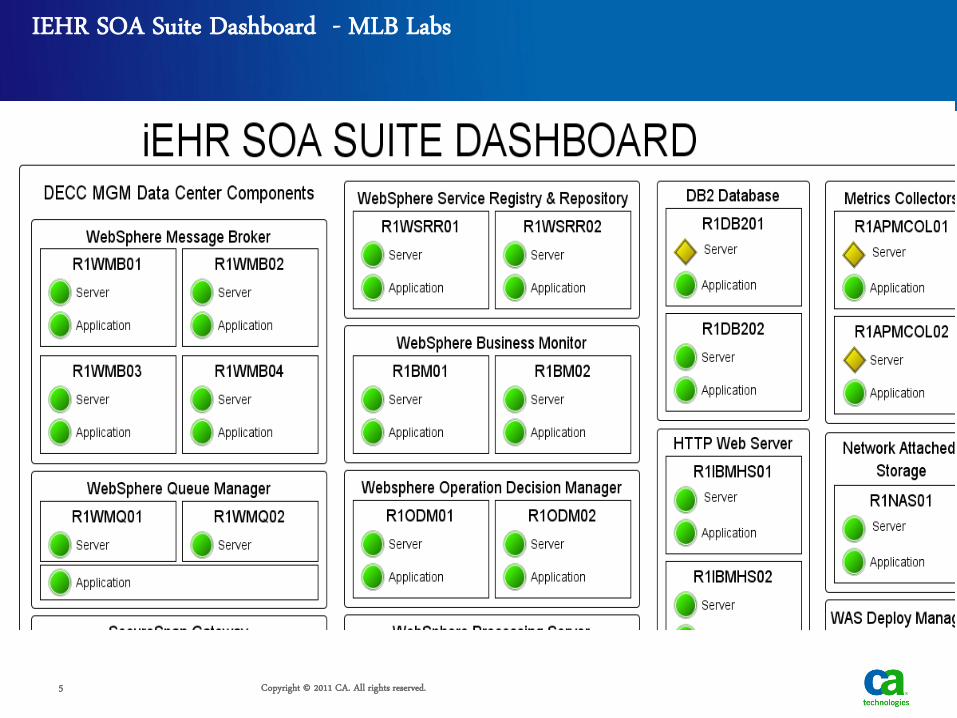
IEHR SOA Suite Dashboard - MLB Labs
5 Copyright © 2011 CA. All rights reserved.
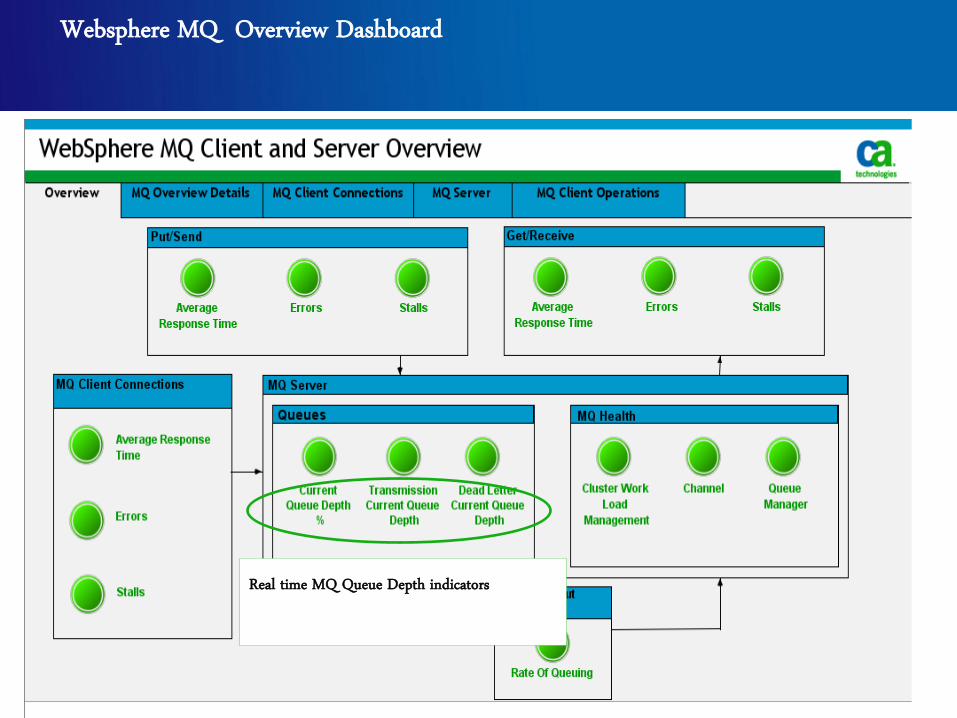
Websphere MQ Overview Dashboard
6 CA Application Performance Management Overview Copyright © 2010 CA. All rights reserved.
Real time MQ Queue Depth indicators
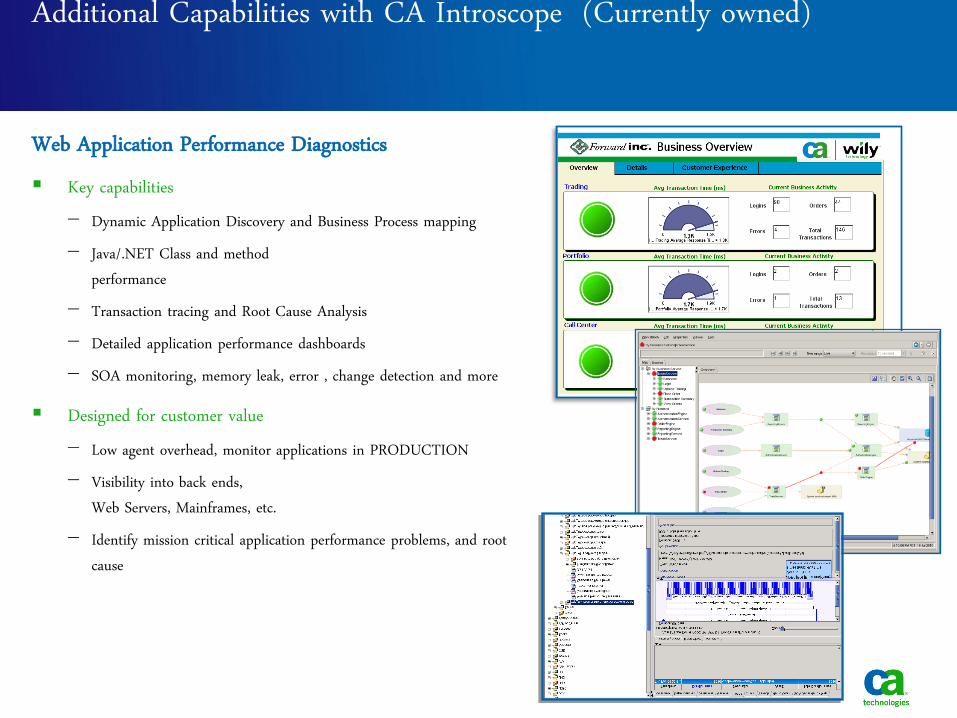
Key capabilities − Dynamic Application Discovery and Business Process mapping − Java/.NET Class and method
performance − Transaction tracing and Root Cause Analysis − Detailed application performance dashboards − SOA monitoring, memory leak, error , change detection and more
Designed for customer value − Low agent overhead, monitor applications in PRODUCTION − Visibility into back ends,
Web Servers, Mainframes, etc. − Identify mission critical application performance problems, and root
cause
Additional Capabilities with CA Introscope (Currently owned)
Web Application Performance Diagnostics

CA APM at Veteran Affairs
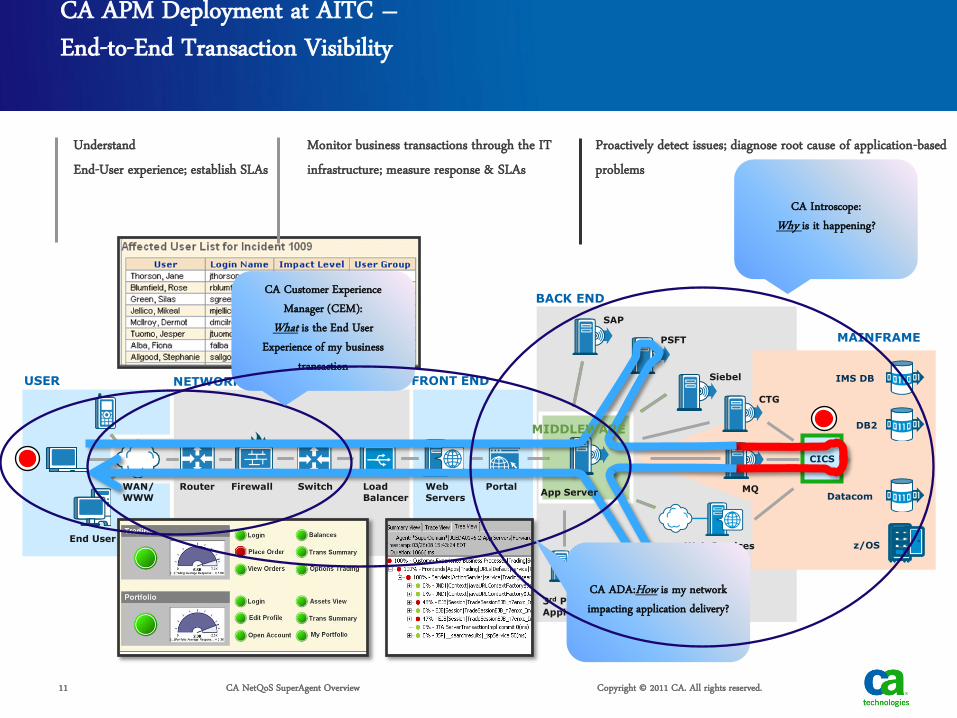
CA APM Deployment at AITC – End-to-End Transaction Visibility
11
WAN/ WWW
End User
Router Firewall Switch Web Servers
Load Balancer
Portal
SAP
Siebel
Web Services
3rd Party Applications
Databases
MAINFRAME PSFT
NETWORK USER
BACK END
FRONT END
MIDDLEWARE
App Server
CICS
Datacom
DB2
CTG
IMS DB
MQ
z/OS
Proactively detect issues; diagnose root cause of application-based problems
Monitor business transactions through the IT infrastructure; measure response & SLAs
Understand End-User experience; establish SLAs
CA NetQoS SuperAgent Overview Copyright © 2011 CA. All rights reserved.
CA Customer Experience Manager (CEM):
What is the End User Experience of my business
transaction
CA Introscope: Why is it happening?
CA ADA:How is my network impacting application delivery?
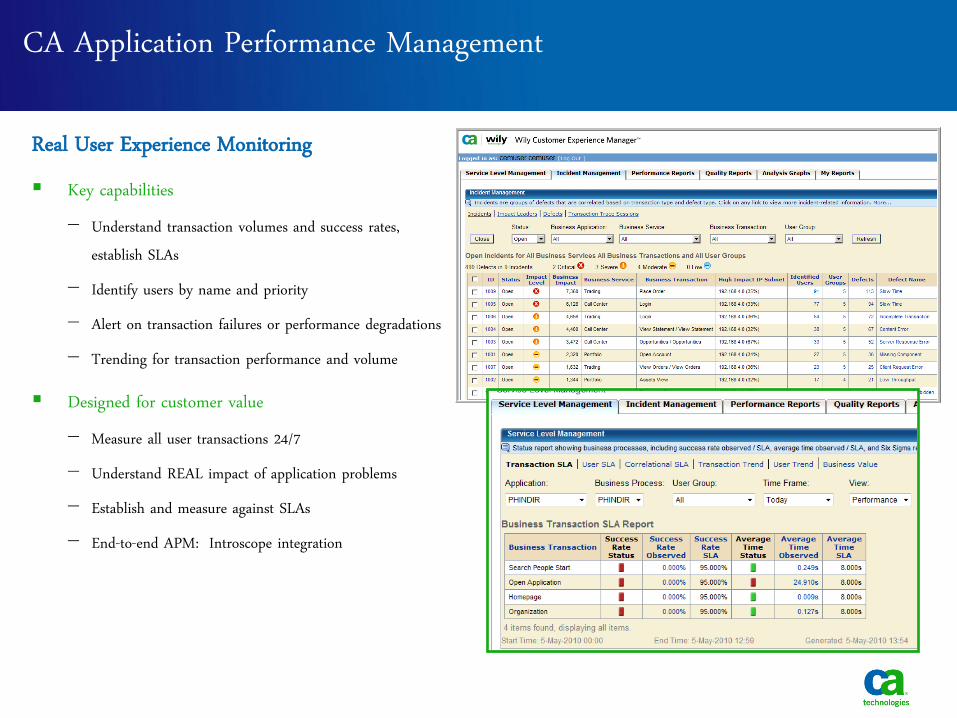
Key capabilities − Understand transaction volumes and success rates,
establish SLAs − Identify users by name and priority − Alert on transaction failures or performance degradations − Trending for transaction performance and volume
Designed for customer value − Measure all user transactions 24/7 − Understand REAL impact of application problems − Establish and measure against SLAs − End-to-end APM: Introscope integration
CA Application Performance Management Real User Experience Monitoring
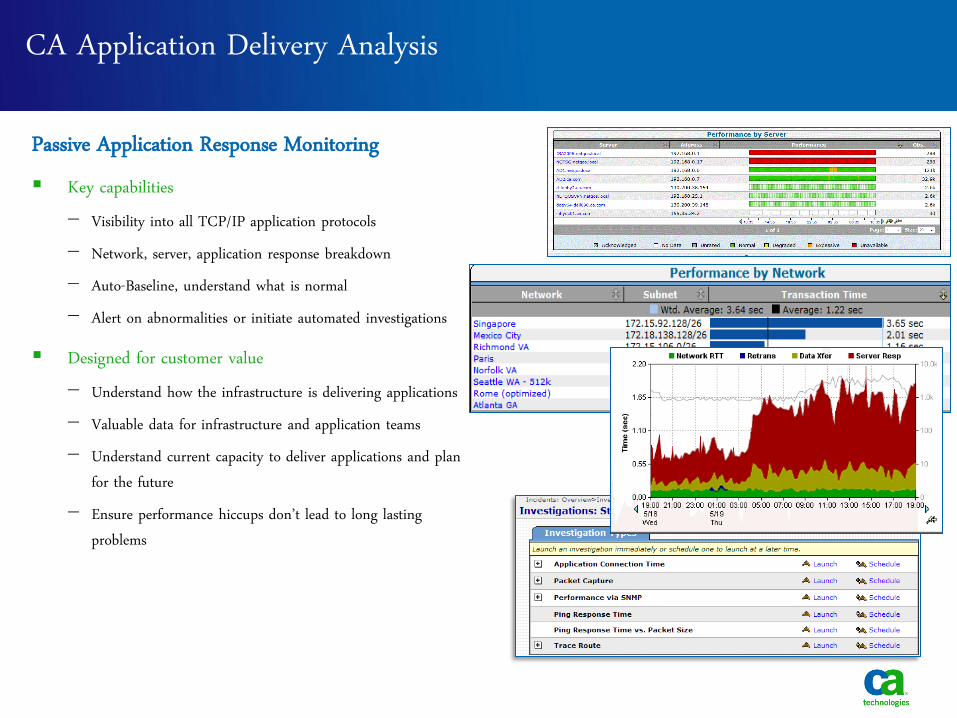
Key capabilities − Visibility into all TCP/IP application protocols − Network, server, application response breakdown − Auto-Baseline, understand what is normal − Alert on abnormalities or initiate automated investigations
Designed for customer value − Understand how the infrastructure is delivering applications − Valuable data for infrastructure and application teams − Understand current capacity to deliver applications and plan
for the future − Ensure performance hiccups don’t lead to long lasting
problems
CA Application Delivery Analysis
Passive Application Response Monitoring
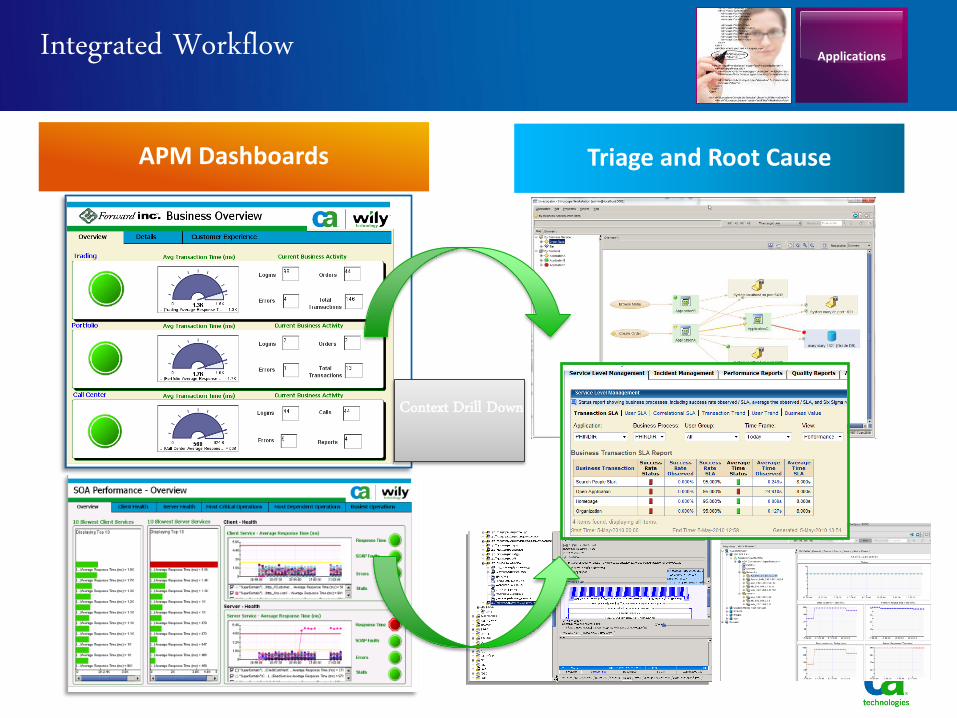
Integrated Workflow
APM Dashboards Triage and Root Cause
Context Drill Down
Applications
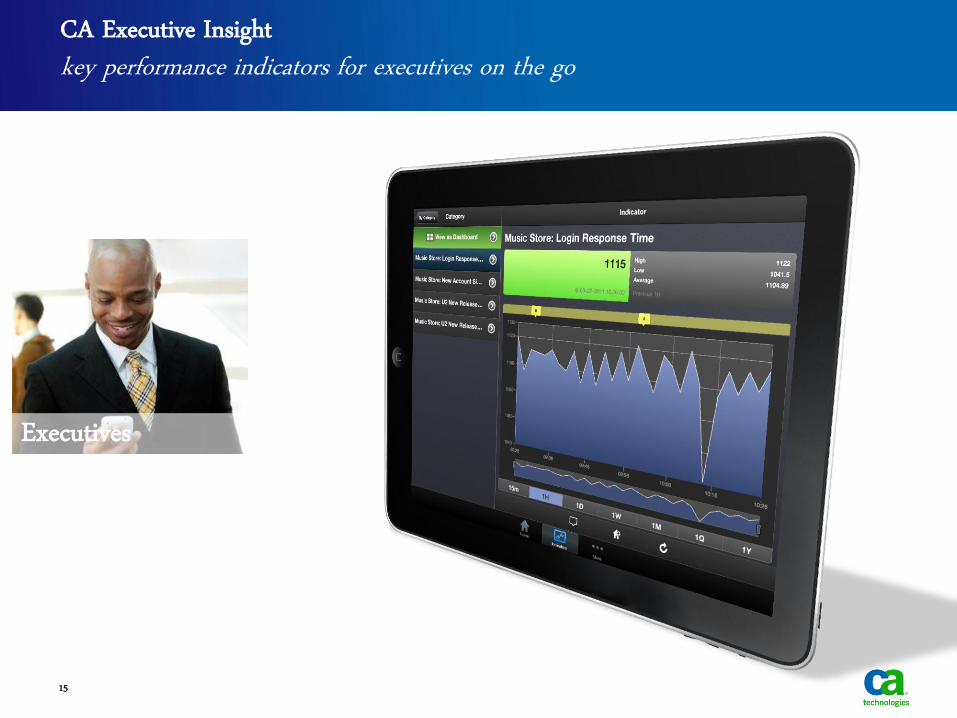
CA Executive Insight key performance indicators for executives on the go
15
Executives
CA Capacity Management Solution
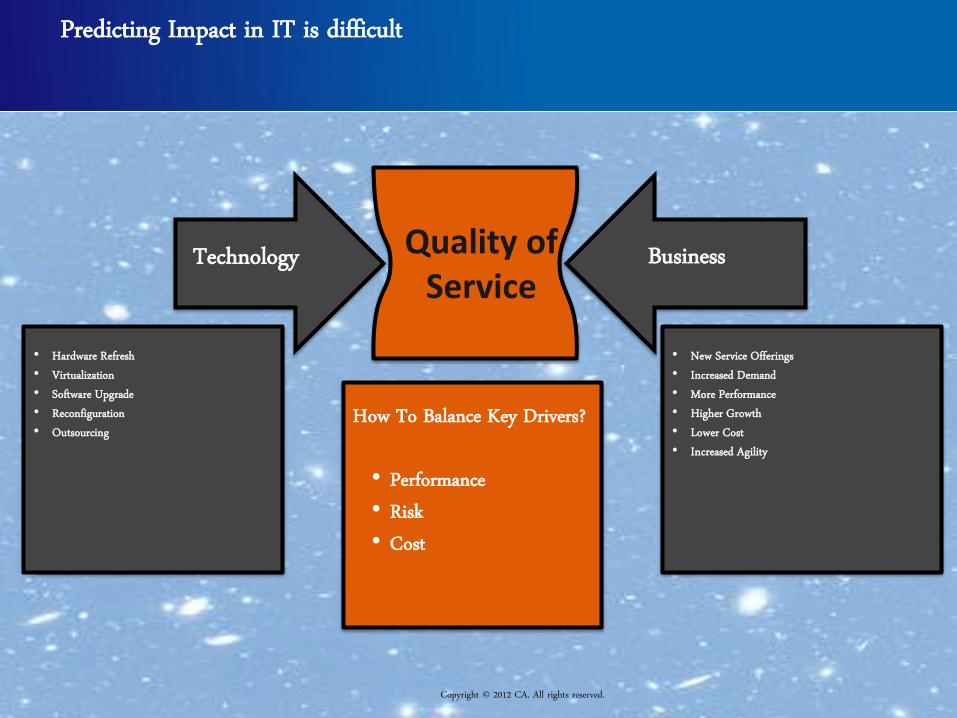
Predicting Impact in IT is difficult
Quality of Service
• Hardware Refresh • Virtualization • Software Upgrade • Reconfiguration • Outsourcing
Technology Business
• New Service Offerings • Increased Demand • More Performance • Higher Growth • Lower Cost • Increased Agility
How To Balance Key Drivers? • Performance • Risk • Cost
Copyright © 2012 CA. All rights reserved.
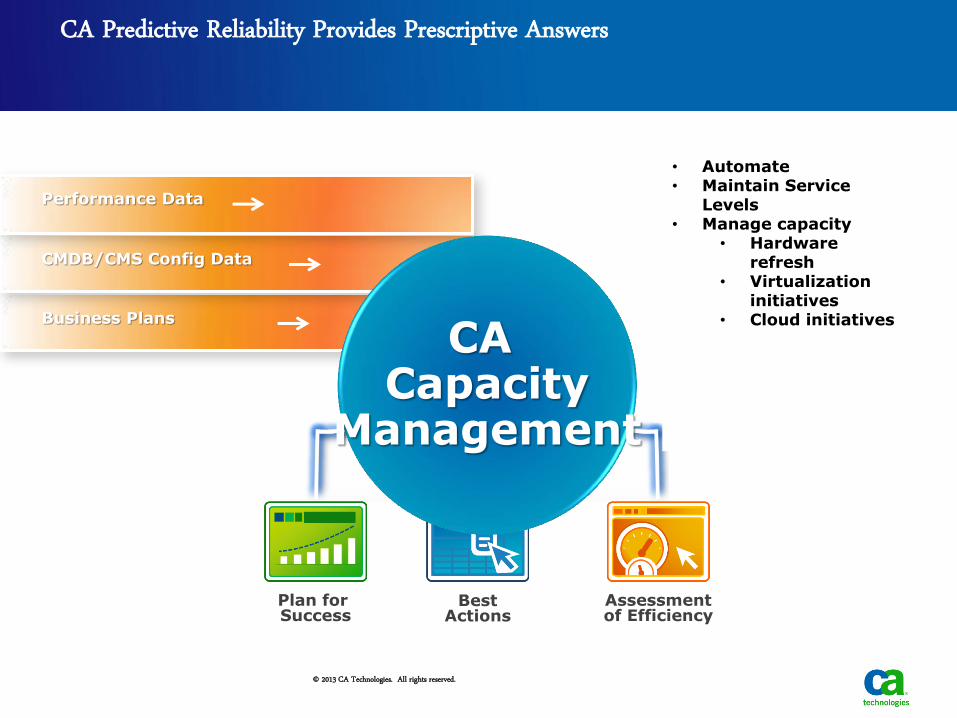
CA Predictive Reliability Provides Prescriptive Answers
© 2013 CA Technologies. All rights reserved.
Performance Data
CMDB/CMS Config Data
Business Plans
Plan for Success
Assessment of Efficiency
Best Actions
CA Capacity
Management
CA Capacity
Management
• CA eHeatlh • CA APM • Virtual Center • Tivoli • HP • BMC • Perfmon • Etc…
• BMC Atrium • HP uCMDB • CA CMDB
• Test to production • Seasonality • Organic growth • New service
deployment
• Automate • Maintain Service
Levels • Manage capacity
• Hardware refresh
• Virtualization initiatives
• Cloud initiatives
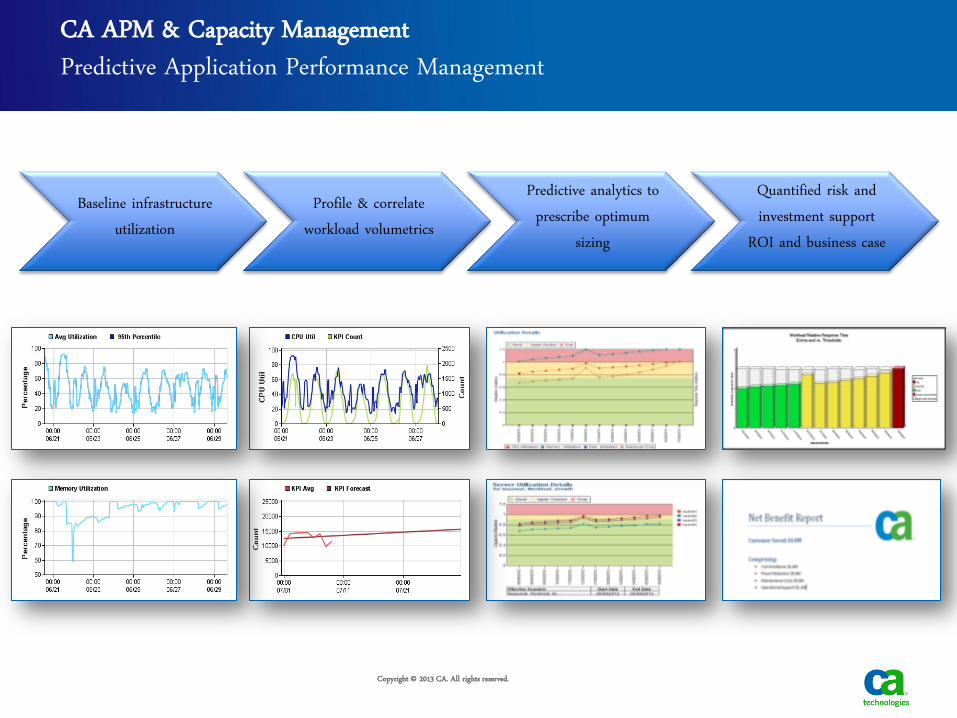
CA APM & Capacity Management Predictive Application Performance Management
Copyright © 2013 CA. All rights reserved.
Baseline infrastructure utilization
Profile & correlate workload volumetrics
Predictive analytics to prescribe optimum
sizing
Quantified risk and investment support
ROI and business case
20
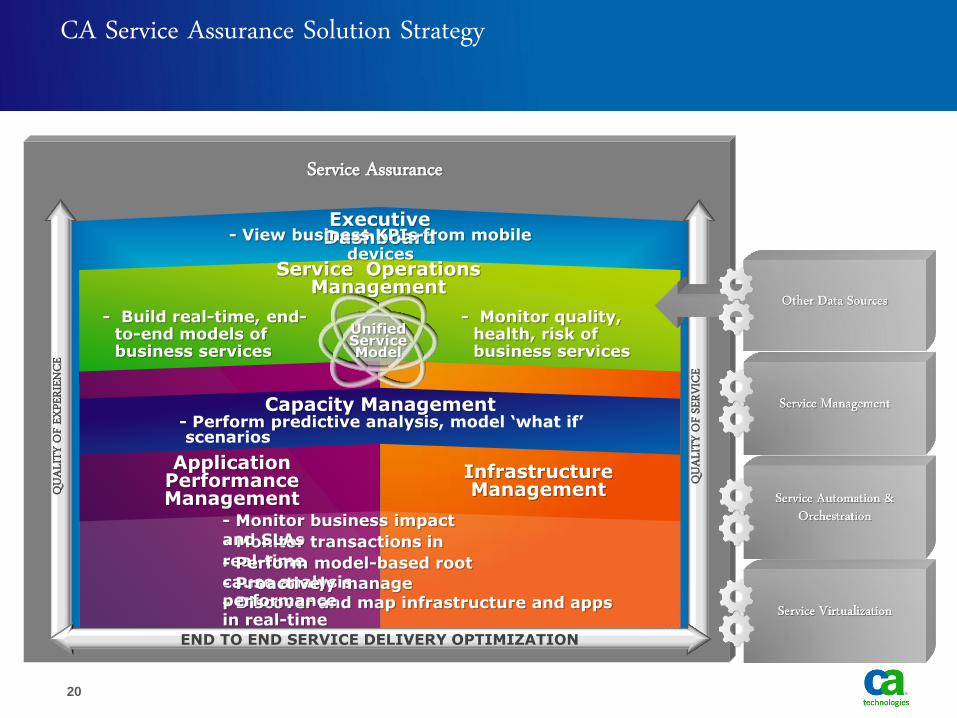
CA Service Assurance Solution Strategy
Service Assurance
QUAL
ITY O
F SER
VICE
QUAL
ITY O
F EXP
ERIEN
CE
END TO END SERVICE DELIVERY OPTIMIZATION
Application Performance Management
Infrastructure Management
- Monitor transactions in real-time - Perform model-based root cause analysis
- Discover and map infrastructure and apps in real-time
- Proactively manage performance
Capacity Management - Perform predictive analysis, model ‘what if’ scenarios
Service Operations Management
- Monitor quality, health, risk of business services
- Build real-time, end-to-end models of business services
- Monitor business impact and SLAs
Executive Dashboard - View business KPIs from mobile
devices
Unified Service Model

Backup slides