Embed Size (px)
Citation preview
Tab M. Heffernan
Rolls-Royce North American Technologies, Inc., Indianapolis, Indiana
Spin Testing of Superalloy Disks With DualGrain Structure
NASA/CR—2006-214338
May 2006
EDR–90712
https://ntrs.nasa.gov/search.jsp?R=20060017060 2018-08-05T22:46:53+00:00Z

NASA STI Program . . . in Profile
Since its founding, NASA has been dedicated to the
advancement of aeronautics and space science. The
NASA Scientific and Technical Information (STI)
program plays a key part in helping NASA maintain
this important role.
The NASA STI Program operates under the auspices
of the Agency Chief Information Officer. It collects,
organizes, provides for archiving, and disseminates
NASA’s STI. The NASA STI program provides access
to the NASA Aeronautics and Space Database and its
public interface, the NASA Technical Reports Server,
thus providing one of the largest collections of
aeronautical and space science STI in the world.
Results are published in both non-NASA channels and
by NASA in the NASA STI Report Series, which
includes the following report types:
• TECHNICAL PUBLICATION. Reports of
completed research or a major significant phase
of research that present the results of NASA
programs and include extensive data or theoretical
analysis. Includes compilations of significant
scientific and technical data and information
deemed to be of continuing reference value.
NASA counterpart of peer-reviewed formal
professional papers but has less stringent
limitations on manuscript length and extent of
graphic presentations.
• TECHNICAL MEMORANDUM. Scientific
and technical findings that are preliminary or
of specialized interest, e.g., quick release
reports, working papers, and bibliographies that
contain minimal annotation. Does not contain
extensive analysis.
• CONTRACTOR REPORT. Scientific and
technical findings by NASA-sponsored
contractors and grantees.
• CONFERENCE PUBLICATION. Collected
papers from scientific and technical
conferences, symposia, seminars, or other
meetings sponsored or cosponsored by NASA.
• SPECIAL PUBLICATION. Scientific,
technical, or historical information from
NASA programs, projects, and missions, often
concerned with subjects having substantial
public interest.
• TECHNICAL TRANSLATION. English-
language translations of foreign scientific and
technical material pertinent to NASA’s mission.
Specialized services also include creating custom
thesauri, building customized databases, organizing
and publishing research results.
For more information about the NASA STI
program, see the following:
• Access the NASA STI program home page at
http://www.sti.nasa.gov
• E-mail your question via the Internet to
• Fax your question to the NASA STI Help Desk
at 301–621–0134
• Telephone the NASA STI Help Desk at
301–621–0390
• Write to:
NASA STI Help Desk
NASA Center for AeroSpace Information
7121 Standard Drive
Hanover, MD 21076–1320
Tab M. Heffernan
Rolls-Royce North American Technologies, Inc., Indianapolis, Indiana
Spin Testing of Superalloy Disks With DualGrain Structure
NASA/CR—2006-214338
May 2006
National Aeronautics and
Space Administration
Glenn Research Center
Cleveland, Ohio 44135
Prepared under Contract NAS3–01143, Task 4
EDR–90712

Available from
NASA Center for Aerospace Information
7121 Standard Drive
Hanover, MD 21076–1320
National Technical Information Service
5285 Port Royal Road
Springfield, VA 22161
Available electronically at http://gltrs.grc.nasa.gov
Trade names and trademarks are used in this report for identification
only. Their usage does not constitute an official endorsement,
either expressed or implied, by the National Aeronautics and
Space Administration.
Level of Review: This material has been technically reviewed by NASA technical management.

Contents 1.0 Introduction............................................................................................................................... 1
1.1 Program Objectives............................................................................................................... 1 1.2 Program Plan......................................................................................................................... 1
2.0 Details of Work Accomplished................................................................................................. 3 2.1 WE 1—Define Disk Geometry, Alloy, and Heat Treat ........................................................ 3
2.1.1 Define Disk Geometry ................................................................................................... 3 2.1.2 Additional Analysis Due to Machining Error................................................................ 5 2.1.3 Alloy Selection and Heat Treat Definition .................................................................... 7
2.2 WE 2—Disk Machining, Instrumentation, and Spin Test Definition................................. 14 2.2.1 Disk Machining............................................................................................................ 14 2.2.2 Instrumentation ............................................................................................................ 14 2.2.3 Spin Test Definition..................................................................................................... 15
2.3 WE 3—Characterize Static and Cyclic Disk Behavior and Predict Spin Pit Behavior of Disks ......................................................................................................................................... 18
2.3.1 Characterize Static and Cyclic Disk Behavior............................................................. 18 2.3.2 Predict Spin Pit Behavior............................................................................................. 23
2.4 WE 4—Analyze Spin Test Data ......................................................................................... 27 2.4.1 Initial Analysis Predicted versus Actual Burst rpm..................................................... 27 2.4.2 Additional Analysis of Predicted versus Actual Burst rpm......................................... 30
3. Summary and Recommendations ............................................................................................. 33
NASA/CR—2006-214338 iii

List of Figures Figure Page 1. Disk Design............................................................................................................................. 4 2. Disk and Arbor Finite Element Analysis. ............................................................................... 5 3. Disk Strains with Instrumentation Hole.................................................................................. 6 4. Disk Stresses with Instrumentation Hole................................................................................ 7 5. DMHT Heating Setup; AE 2100, Stage 3 Disk. ..................................................................... 9 6. NASA’s Modeling Results for DMHT Processed Alloy 10 with Three Different Furnace
Hold Times. Final Disk Geometry and Square-Cut Outlines are Superimposed on the Isotherm Contour Plots. ........................................................................................................ 10
7. C-Scan Images of DMHT Processed Alloy 10 Forging. ...................................................... 11 8. Representative Photographs of DMHT Processed Alloy 10 Forging................................... 11 9. Macroetched Cross Section of a DMHT Processed Alloy 10 Forging................................. 12 10. A Closer View of the Transition Zone in the Forging Section Shown in Figure 9. ............. 12 11. Microstructure of DMHT Disk Showing Coarse Grain in Rim (Left), Medium Grain in
Transition Zone (Center), and Fine Grain in Web (Right). .................................................. 13 12. Disk Machining Geometry.................................................................................................... 14 13. Proposed Locations for Strain Gages.................................................................................... 15 14. Radial Displacement of DMHT Rim (No Hysteresis Effect Modeled). ............................... 16 15. Radial Displacement of Subsolvus Rim (No Hysteresis Effect Modeled). .......................... 17 16. Specimen Blanking Diagram for DMHT Alloy 10 Disk. ..................................................... 19 17. Calculated True Stress-True Strain Behavior for Smooth Tensile Specimen AF4 and
Best Fit Hyperbolic Tangent Curve. ..................................................................................... 20 18. Maximum Equivalent Plastic Strain in DMHT Wheel. ........................................................ 24 19. Maximum Equivalent Plastic Strain in Subsolvus Wheel. ................................................... 24 20. Smooth Tensile Specimen Data. ........................................................................................... 26 21. Calculated Maximum Plastic Strain in Disk......................................................................... 27 22. Evolution of Peak Equivalent Plastic Strain in DMHT Wheel............................................. 27 23. FEA Prediction of Strain Present in DMHT Wheel at Gage No. 1/1 Location—Bottom
of Through-hole. ................................................................................................................... 28 24. FEA Prediction of Strain Present in DMHT Wheel at Gage No. 2/2 Location—in
Transition Zone Area. ........................................................................................................... 29 25. FEA Prediction of Strain Present in DMHT Wheel at Gage No. 6/8 Location—Bore I.D. . 29 26. Location of Maximum Hoop Stress...................................................................................... 32 27. Von Mises stress contours without (left) and with (right) overlay of crack locations.......... 32
NASA/CR—2006-214338 iv
List of Tables Table Page 1. SUMMARY OF STRAINS/STRESSES AT CRITICAL AREAS AS A FUNCTION
OF WHEEL SPEED. .............................................................................................................. 7 2. STRAIN GAGE DESIGNATION AND LOCATION......................................................... 15 3. ROOM TEMPERATURE SMOOTH BAR TENSILE RESULTS...................................... 21 4. ROOM TEMPERATURE NOTCHED BAR TENSILE RESULTS.................................... 21 5. 1200°F R = 0 SMOOTH BAR LOW CYCLE FATIGUE RESULTS FROM DMHT
PROCESSED ALLOY 10 FORGING.................................................................................. 23 6. FEA PREDICTIONS OF MAXIMUM STRAINS PRESENT AT FAILURE IN
NOTCHED SPECIMENS. ................................................................................................... 25 7. FEA PREDICTIONS OF MAXIMUM STRESSES PRESENT AT FAILURE IN
NOTCHED SPECIMENS. ................................................................................................... 31 8. PREDICTED VERSUS ACTUAL BURST SPEED USING THREE BURST
CRITERIA. ........................................................................................................................... 31
NASA/CR—2006-214338 v


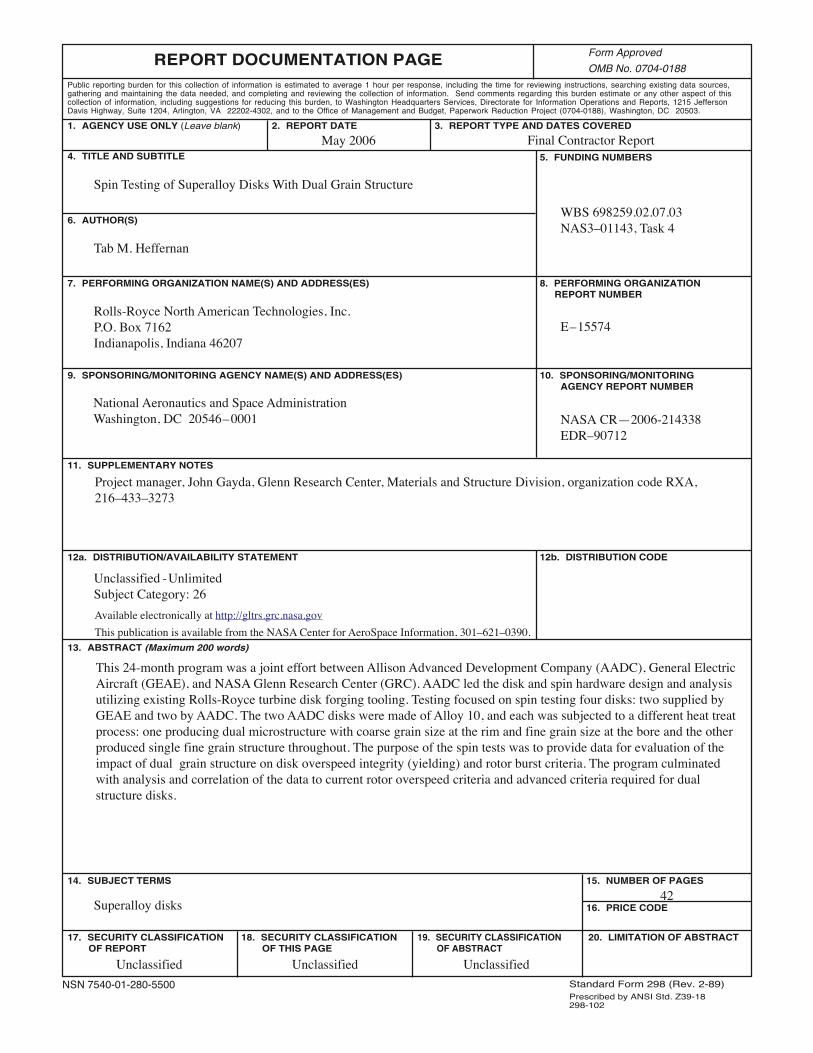
1.0 Introduction This 24-month program was a joint effort between Allison Advanced Development Company
(AADC), General Electric Aircraft Engines (GEAE), and NASA Glenn Research Center (GRC).
AADC led the disk and spin hardware design and analysis utilizing existing Rolls-Royce turbine
disk forging tooling. Testing focused on spin testing four disks: two supplied by GEAE and two
by AADC. The two AADC disks were made of Alloy 10, and each was subjected to a different
heat treat process: one producing dual microstructure with coarse grain size at the rim and fine
grain size at the bore and the other produced single fine grain structure throughout. The purpose
of the spin tests was to provide data for evaluation of the impact of dual grain structure on disk
overspeed integrity (yielding) and rotor burst criteria. The program culminated with analysis and
correlation of the data to current rotor overspeed criteria and advanced criteria required for dual
structure disks.
1.1 Program Objectives
The prime objective of this program was to demonstrate that yield and burst behavior of dual
structure disks can be predicted accurately. The program was organized into the following,
separately funded and evaluated, work elements (WE):
■ WE 1—Define disk geometry, alloy, and heat treat
■ WE 2—Disk machining, instrumentation, and spin test definition
■ WE 3—Characterize static and cyclic disk behavior and predict spin pit behavior of disks
■ WE 4—Analyze spin test data
NOTE: NASA GRC was responsible for all aspects of the actual spin test.
1.2 Program Plan
AADC and GEAE worked together to conduct the following orderly structured tasks to enable
spin testing of four superalloy disks with dual grain structure:
■ Design the configuration for the disks and the spin pit adaptive hardware and procure
uniform and dual grain structure disks
■ Provide baseline and dual heat treated Alloy 10 and René 104 forgings machined to the
identified spin test disk geometry
NASA/CR—2006-214338 1
■ Define, but not perform, spin test experiments to generate data permitting verification of
sizing methodologies pertinent to advanced subsonic turbine engines (spin test experiments
were separately funded by NASA at Test Devices, Inc.)
■ Predict spin pit behavior of four disks using GEAE and AADC/Rolls-Royce conventional
and advanced methodologies
■ Compare predicted versus demonstrated behavior of dual grain structure versus baseline
material
■ Prepare a final report documenting the results of all program tasks
NASA/CR—2006-214338 2

2.0 Details of Work Accomplished 2.1 WE 1—Define Disk Geometry, Alloy, and Heat Treat
2.1.1 Define Disk Geometry
AADC had the lead for disk sizing and design, but the effort was accomplished with GEAE
cooperation and concurrence. Existing tooling was used to forge the disk because it provided:
■ Convenient size for spin pit testing
■ Used in previous DMHT development projects funded by NASA, so processing relating to
the DMHT process was already available
■ Available for use at no cost
The spin test disk was designed to match the radial, tangential, and equivalent stress distribution
of the production turbine disk. The final design included 36 equally spaced holes in the wheel
rim (Figure 1). Through-cuts were placed top dead center on each rim hole, thus shifting the last
continuous fiber of the wheel from the outside diameter to the base of the rim holes. This isolated
the mass between each hole. This ‘dead weight’ was designed into the disk to simulate the effect
of a blade load for the spin test.
NASA/CR—2006-214338 3
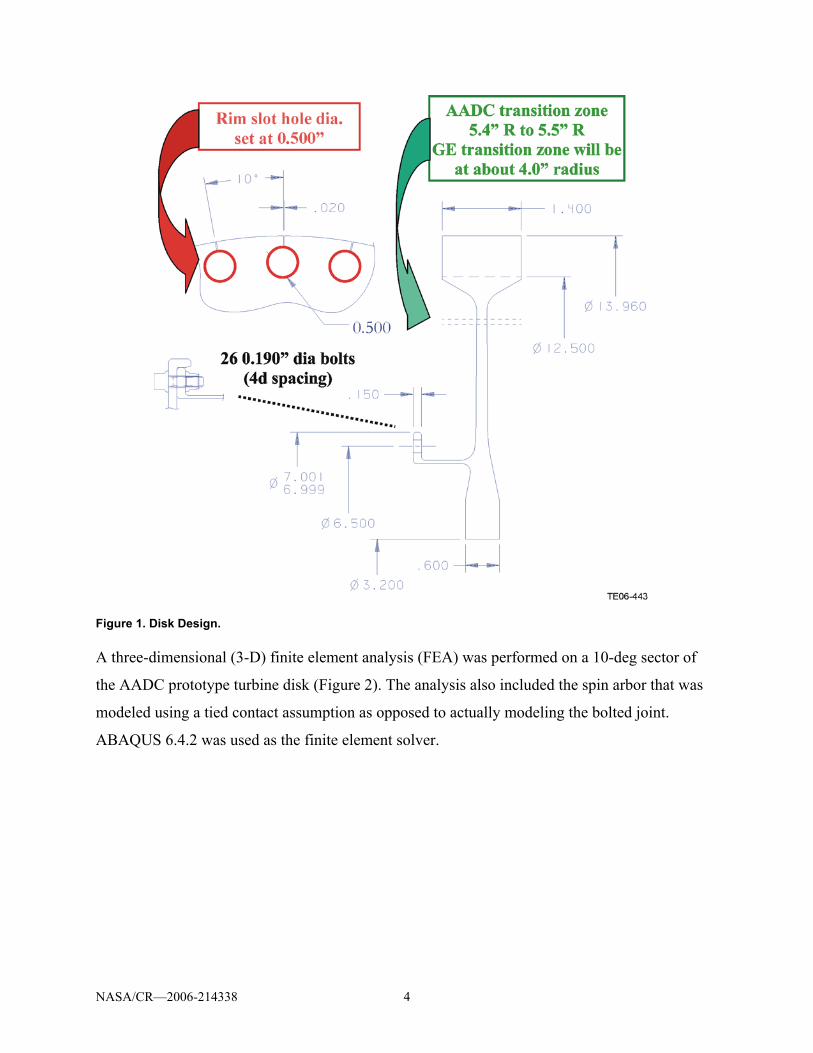
Figure 1. Disk Design.
A three-dimensional (3-D) finite element analysis (FEA) was performed on a 10-deg sector of
the AADC prototype turbine disk (Figure 2). The analysis also included the spin arbor that was
modeled using a tied contact assumption as opposed to actually modeling the bolted joint.
ABAQUS 6.4.2 was used as the finite element solver.
NASA/CR—2006-214338 4
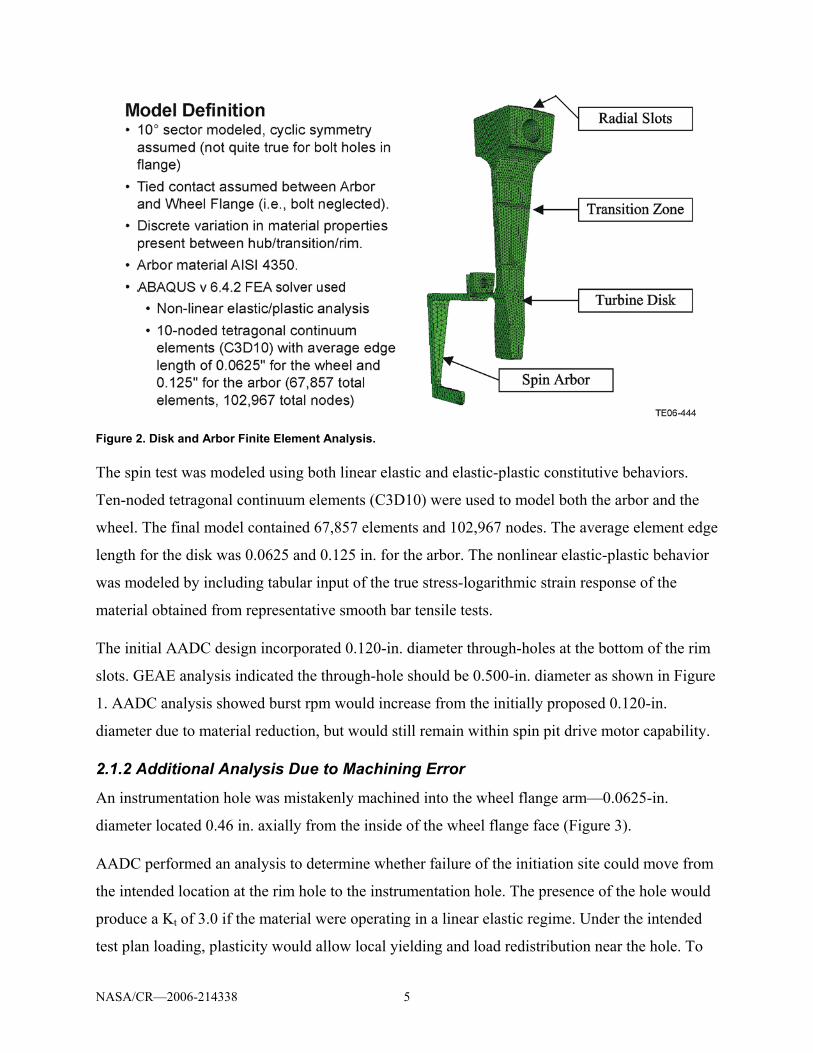
Figure 2. Disk and Arbor Finite Element Analysis.
The spin test was modeled using both linear elastic and elastic-plastic constitutive behaviors.
Ten-noded tetragonal continuum elements (C3D10) were used to model both the arbor and the
wheel. The final model contained 67,857 elements and 102,967 nodes. The average element edge
length for the disk was 0.0625 and 0.125 in. for the arbor. The nonlinear elastic-plastic behavior
was modeled by including tabular input of the true stress-logarithmic strain response of the
material obtained from representative smooth bar tensile tests.
The initial AADC design incorporated 0.120-in. diameter through-holes at the bottom of the rim
slots. GEAE analysis indicated the through-hole should be 0.500-in. diameter as shown in Figure
1. AADC analysis showed burst rpm would increase from the initially proposed 0.120-in.
diameter due to material reduction, but would still remain within spin pit drive motor capability.
2.1.2 Additional Analysis Due to Machining Error
An instrumentation hole was mistakenly machined into the wheel flange arm—0.0625-in.
diameter located 0.46 in. axially from the inside of the wheel flange face (Figure 3).
AADC performed an analysis to determine whether failure of the initiation site could move from
the intended location at the rim hole to the instrumentation hole. The presence of the hole would
produce a Kt of 3.0 if the material were operating in a linear elastic regime. Under the intended
test plan loading, plasticity would allow local yielding and load redistribution near the hole. To
NASA/CR—2006-214338 5
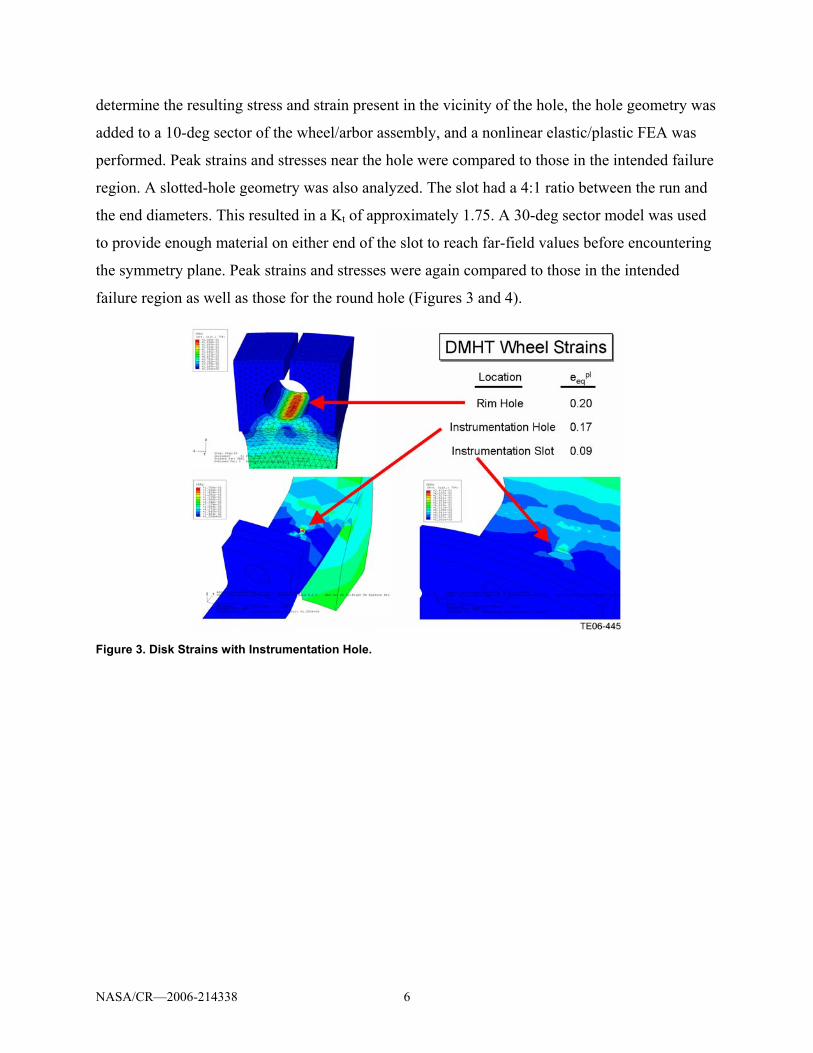
determine the resulting stress and strain present in the vicinity of the hole, the hole geometry was
added to a 10-deg sector of the wheel/arbor assembly, and a nonlinear elastic/plastic FEA was
performed. Peak strains and stresses near the hole were compared to those in the intended failure
region. A slotted-hole geometry was also analyzed. The slot had a 4:1 ratio between the run and
the end diameters. This resulted in a Kt of approximately 1.75. A 30-deg sector model was used
to provide enough material on either end of the slot to reach far-field values before encountering
the symmetry plane. Peak strains and stresses were again compared to those in the intended
failure region as well as those for the round hole (Figures 3 and 4).
Figure 3. Disk Strains with Instrumentation Hole.
NASA/CR—2006-214338 6
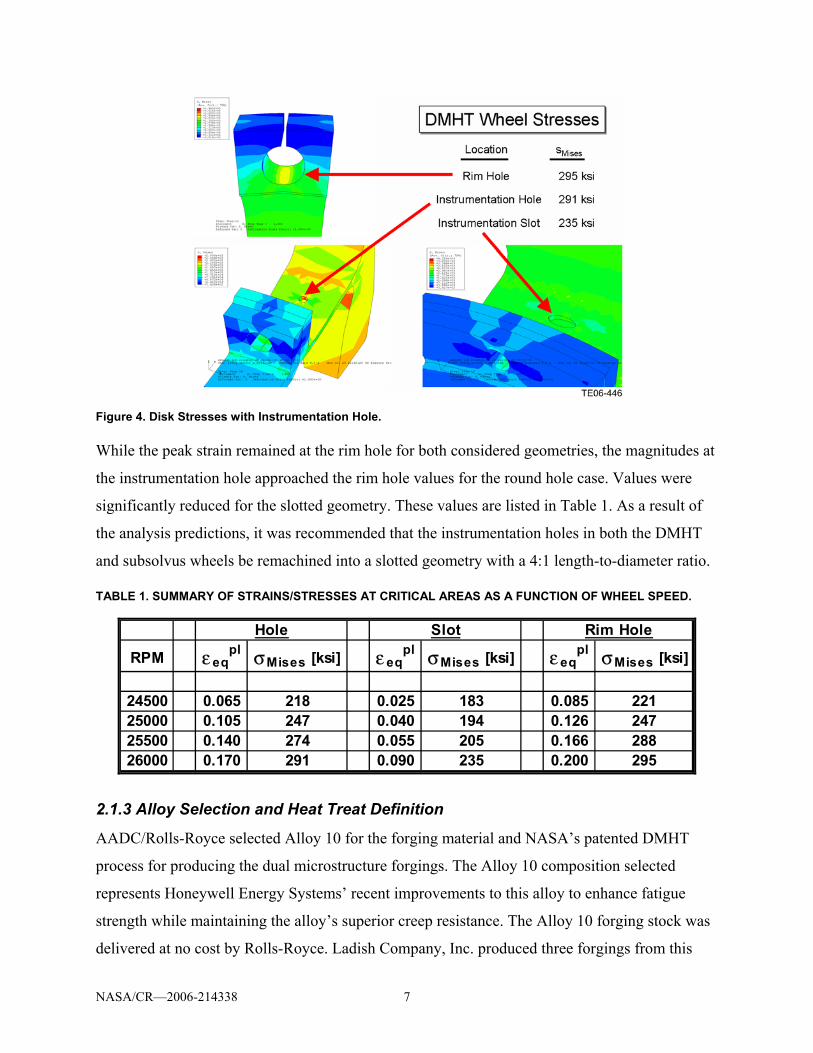
Figure 4. Disk Stresses with Instrumentation Hole.
While the peak strain remained at the rim hole for both considered geometries, the magnitudes at
the instrumentation hole approached the rim hole values for the round hole case. Values were
significantly reduced for the slotted geometry. These values are listed in Table 1. As a result of
the analysis predictions, it was recommended that the instrumentation holes in both the DMHT
and subsolvus wheels be remachined into a slotted geometry with a 4:1 length-to-diameter ratio.
TABLE 1. SUMMARY OF STRAINS/STRESSES AT CRITICAL AREAS AS A FUNCTION OF WHEEL SPEED.
RPM ε eqpl σMises [ksi] ε eq
pl σMises [ksi] ε eqpl σMises [ksi]
24500 0.065 218 0.025 183 0.085 22125000 0.105 247 0.040 194 0.126 24725500 0.140 274 0.055 205 0.166 28826000 0.170 291 0.090 235 0.200 295
Hole Slot Rim Hole
2.1.3 Alloy Selection and Heat Treat Definition
AADC/Rolls-Royce selected Alloy 10 for the forging material and NASA’s patented DMHT
process for producing the dual microstructure forgings. The Alloy 10 composition selected
represents Honeywell Energy Systems’ recent improvements to this alloy to enhance fatigue
strength while maintaining the alloy’s superior creep resistance. The Alloy 10 forging stock was
delivered at no cost by Rolls-Royce. Ladish Company, Inc. produced three forgings from this
NASA/CR—2006-214338 7

material using isothermal forging tooling for an existing Rolls-Royce turbine wheel. The
forgings were produced using parameters previously developed by Ladish and Rolls-Royce.
All three forgings were near-solvus solution heat treated to achieve a target grain size of ASTM
10-13. One forging was cooled from solution heat treatment using Ladish’s Supercool™ cooling
technology under controlled conditions to represent cooling rates typical for large civil engine
disk bores. Finite element modeling was conducted by Ladish on a parallel program funded by
Rolls-Royce plc. to determine the Supercooler parameter settings and validate achievement of
the target cooling rates. The other two forgings were conventionally fan air cooled in preparation
for DMHT processing.
The DMHT technique is a NASA patented method for the development of a dual microstructure
disk component. The DMHT specific setup employed for this disk shape and program effort is
shown in Figure 5. This DMHT tooling was the same tooling that was previously used to
produce Rolls-Royce production turbine wheel DMHT forgings using alloys ME209 and LSHR
under NASA funding. The disk component with the surrounding insulation packages was placed
into a furnace operating at a supersolvus temperature. This practice enabled the rim section to
heat above the gamma prime solvus and elicit a grain coarsened response, while the bore (inside
the insulation package) remained subsolvus and retained the original grain size.
NASA/CR—2006-214338 8
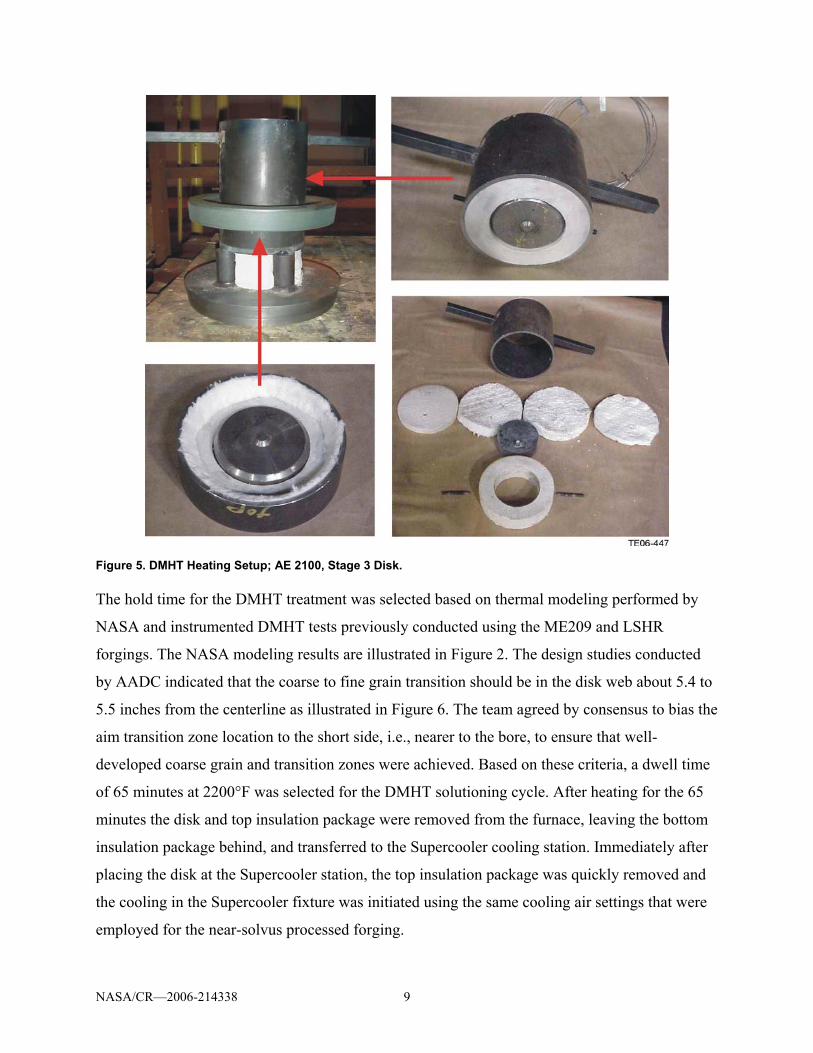
Figure 5. DMHT Heating Setup; AE 2100, Stage 3 Disk.
The hold time for the DMHT treatment was selected based on thermal modeling performed by
NASA and instrumented DMHT tests previously conducted using the ME209 and LSHR
forgings. The NASA modeling results are illustrated in Figure 2. The design studies conducted
by AADC indicated that the coarse to fine grain transition should be in the disk web about 5.4 to
5.5 inches from the centerline as illustrated in Figure 6. The team agreed by consensus to bias the
aim transition zone location to the short side, i.e., nearer to the bore, to ensure that well-
developed coarse grain and transition zones were achieved. Based on these criteria, a dwell time
of 65 minutes at 2200°F was selected for the DMHT solutioning cycle. After heating for the 65
minutes the disk and top insulation package were removed from the furnace, leaving the bottom
insulation package behind, and transferred to the Supercooler cooling station. Immediately after
placing the disk at the Supercooler station, the top insulation package was quickly removed and
the cooling in the Supercooler fixture was initiated using the same cooling air settings that were
employed for the near-solvus processed forging.
NASA/CR—2006-214338 9

Figure 6. NASA’s Modeling Results for DMHT Processed Alloy 10 with Three Different Furnace Hold Times.
Final Disk Geometry and Square-Cut Outlines are Superimposed on the Isotherm Contour Plots.
After solution heat treatment, all three forgings received a final age of 16 hours at 1400°F. The
subsolvus forging and one of the two DMHT forgings were machined and inspected in
accordance with drawing requirements. Both forgings met sonic inspection requirements. The
DMHT forging was again sonically inspected, using higher gain and altered near-surface gating
NASA/CR—2006-214338 10

to enable a vivid coarse-to-fine grain transition. These C-scan images are shown in Figure 7. The
fine-to-coarse grain transition occurred over a narrow distance and was centered approximately
5.25 inches from the bore. This is in excellent agreement with the 5.4 to 5.5-in. target transition
zone considering the intended bias towards the bore side. After ultrasonic testing, the two
forgings were etched and fluorescent penetrant inspection (FPI) examined in accordance with
drawing requirements. Figure 8 shows representative photographs of the etched dual
microstructure forging, serial 11. These two forgings were delivered to GEAE for machining to
the spin test configuration.
Figure 7. C-Scan Images of DMHT Processed Alloy 10 Forging.
Figure 8. Representative Photographs of DMHT Processed Alloy 10 Forging.
NASA/CR—2006-214338 11
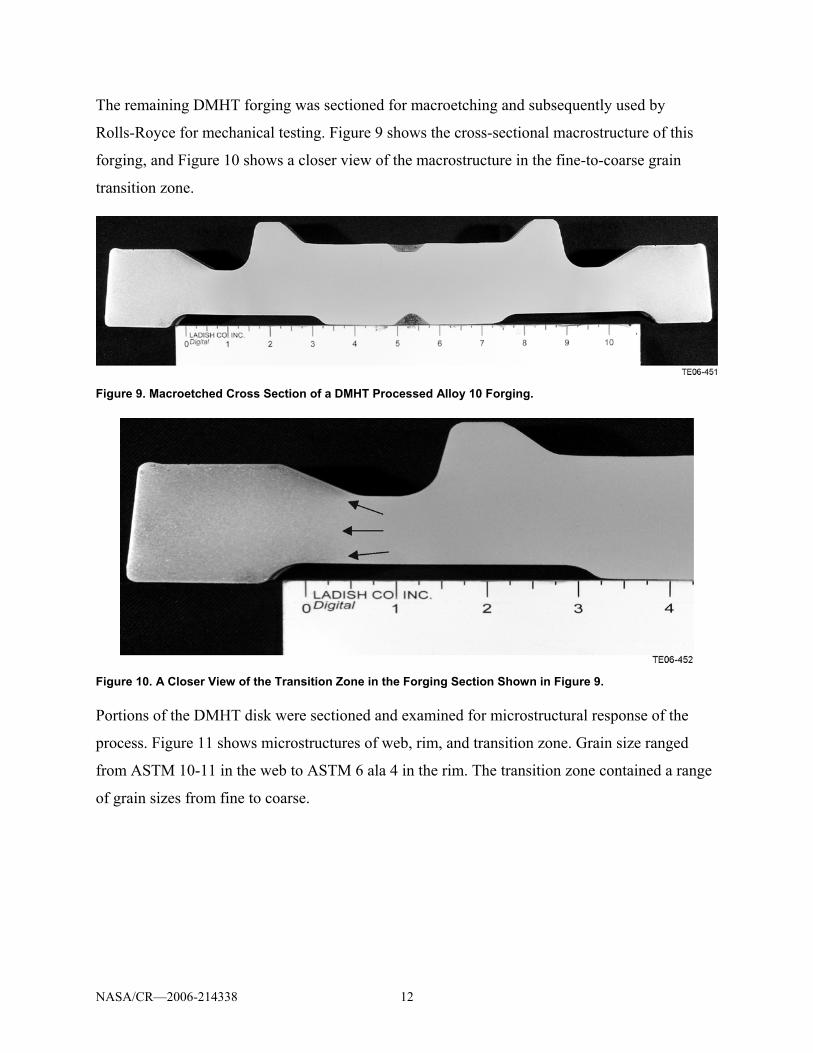
The remaining DMHT forging was sectioned for macroetching and subsequently used by
Rolls-Royce for mechanical testing. Figure 9 shows the cross-sectional macrostructure of this
forging, and Figure 10 shows a closer view of the macrostructure in the fine-to-coarse grain
transition zone.
Figure 9. Macroetched Cross Section of a DMHT Processed Alloy 10 Forging.
Figure 10. A Closer View of the Transition Zone in the Forging Section Shown in Figure 9.
Portions of the DMHT disk were sectioned and examined for microstructural response of the
process. Figure 11 shows microstructures of web, rim, and transition zone. Grain size ranged
from ASTM 10-11 in the web to ASTM 6 ala 4 in the rim. The transition zone contained a range
of grain sizes from fine to coarse.
NASA/CR—2006-214338 12

Figure 11. Microstructure of DMHT Disk Showing Coarse Grain in Rim (Left), Medium Grain in Transition
Zone (Center), and Fine Grain in Web (Right).
NASA/CR—2006-214338 13
2.2 WE 2—Disk Machining, Instrumentation, and Spin Test Definition
2.2.1 Disk Machining
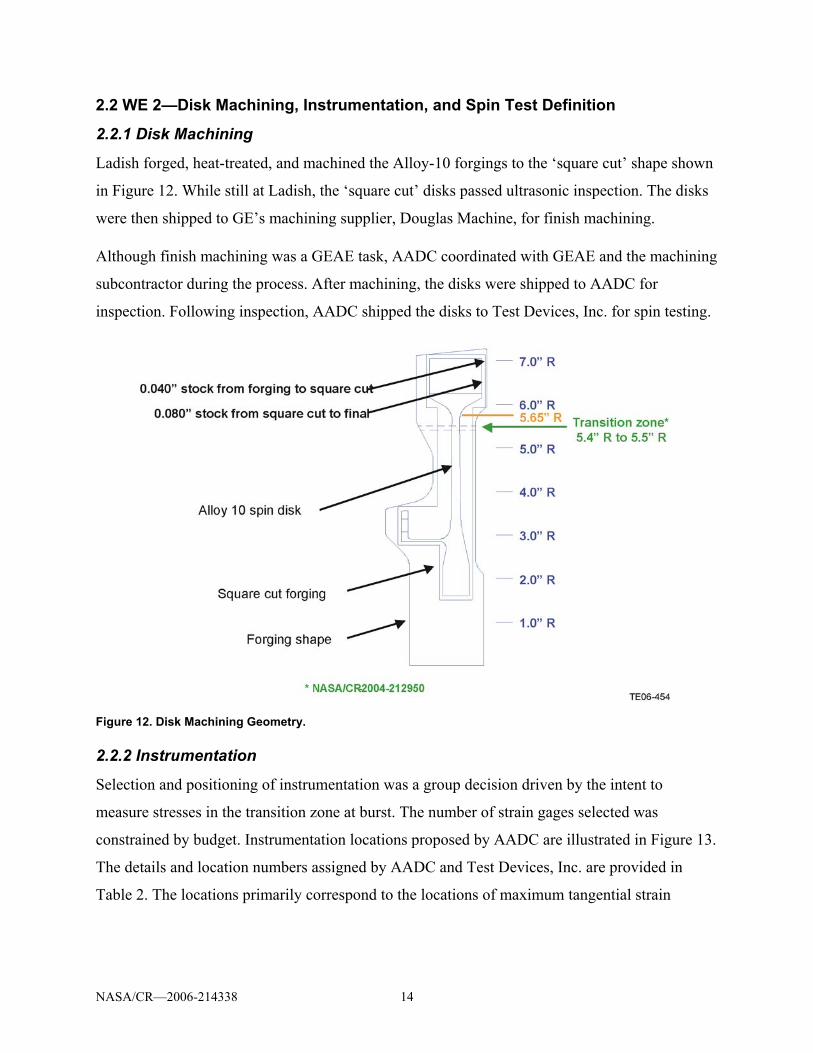
Ladish forged, heat-treated, and machined the Alloy-10 forgings to the ‘square cut’ shape shown
in Figure 12. While still at Ladish, the ‘square cut’ disks passed ultrasonic inspection. The disks
were then shipped to GE’s machining supplier, Douglas Machine, for finish machining.
Although finish machining was a GEAE task, AADC coordinated with GEAE and the machining
subcontractor during the process. After machining, the disks were shipped to AADC for
inspection. Following inspection, AADC shipped the disks to Test Devices, Inc. for spin testing.
Figure 12. Disk Machining Geometry.
2.2.2 Instrumentation
Selection and positioning of instrumentation was a group decision driven by the intent to
measure stresses in the transition zone at burst. The number of strain gages selected was
constrained by budget. Instrumentation locations proposed by AADC are illustrated in Figure 13.
The details and location numbers assigned by AADC and Test Devices, Inc. are provided in
Table 2. The locations primarily correspond to the locations of maximum tangential strain
NASA/CR—2006-214338 14
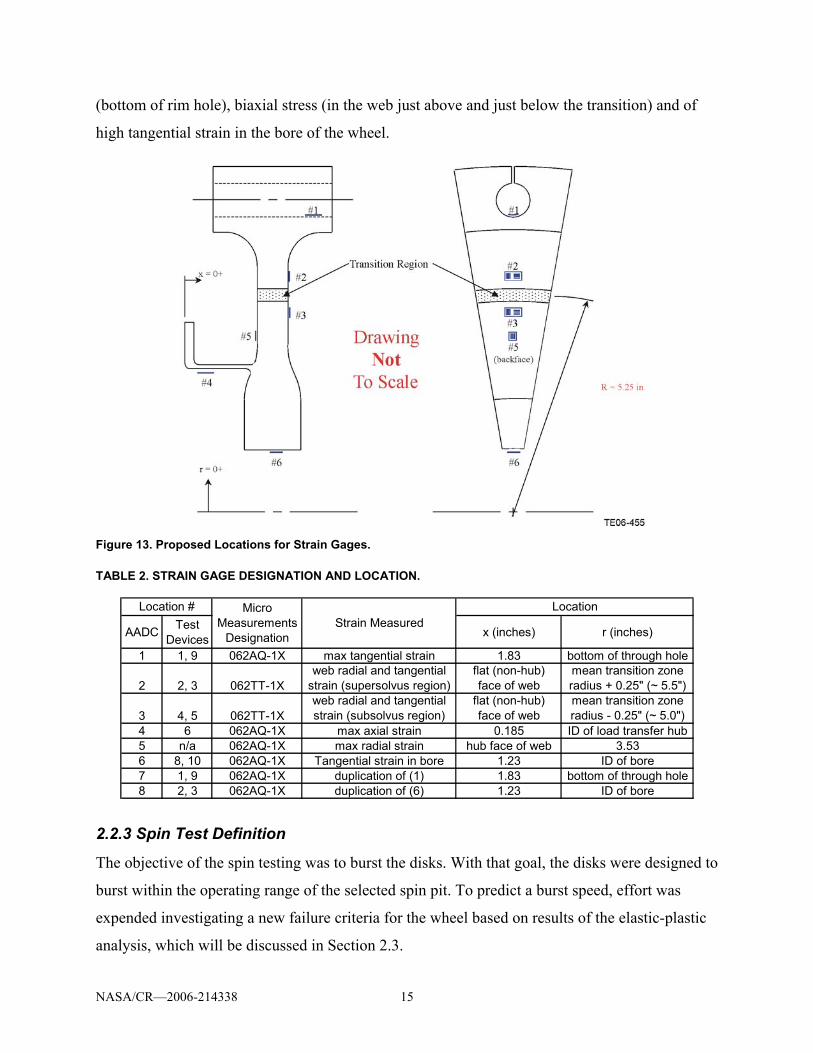
(bottom of rim hole), biaxial stress (in the web just above and just below the transition) and of
high tangential strain in the bore of the wheel.
Figure 13. Proposed Locations for Strain Gages.
TABLE 2. STRAIN GAGE DESIGNATION AND LOCATION.
AADC TestDevices x (inches) r (inches)
1 1, 9 062AQ-1X max tangential strain 1.83 bottom of through hole
2 2, 3 062TT-1Xweb radial and tangential
strain (supersolvus region)flat (non-hub) face of web
mean transition zone radius + 0.25" (~ 5.5")
3 4, 5 062TT-1Xweb radial and tangential strain (subsolvus region)
flat (non-hub) face of web
mean transition zone radius - 0.25" (~ 5.0")
4 6 062AQ-1X max axial strain 0.185 ID of load transfer hub5 n/a 062AQ-1X max radial strain hub face of web 3.536 8, 10 062AQ-1X Tangential strain in bore 1.23 ID of bore7 1, 9 062AQ-1X duplication of (1) 1.83 bottom of through hole8 2, 3 062AQ-1X duplication of (6) 1.23 ID of bore
LocationLocation # MicroMeasurements
DesignationStrain Measured
2.2.3 Spin Test Definition
The objective of the spin testing was to burst the disks. With that goal, the disks were designed to
burst within the operating range of the selected spin pit. To predict a burst speed, effort was
expended investigating a new failure criteria for the wheel based on results of the elastic-plastic
analysis, which will be discussed in Section 2.3.
NASA/CR—2006-214338 15

A three-cycle test procedure was developed and proposed. Cycle 1 called for ramping the speed
up to 20,000 rpm and back down to 0 rpm for both wheels. The 20,000 rpm speed, corresponding
to the end of the linear elastic regime, was intended to make sure all instrumentation was
working properly. The second cycle called for ramping up to 25,000 rpm for the DMHT wheel
and 25,500 rpm for the subsolvus wheel and then ramping back down to 0 rpm in both cases.
These speeds, corresponding to between 0.15 and 0.20 inches in total radial displacement, were
intended to take the wheel into the plastic regime. By decelerating back down to rest, the plastic
portion of the radial displacement could be measured. The predicted or expected radial rim
displacement is illustrated in Figures 14 and 15. The third cycle called for ramping the speed
back up until disk failure was achieved. This was predicted to be ~25,250 rpm for the DMHT
wheel and ~26,000 rpm for the subsolvus wheel.
Figure 14. Radial Displacement of DMHT Rim (No Hysteresis Effect Modeled).
NASA/CR—2006-214338 16

Figure 15. Radial Displacement of Subsolvus Rim (No Hysteresis Effect Modeled).
The actual test procedure run was modified slightly from what was originally proposed. The top
speed of cycle 1 was increased to 21,000 rpm to take the wheels slightly into the plastic regime.
The criteria for top speed in cycle 2 were changed to correspond to a strain gage reading of 0.03
(maximum the gage is certified for) at the base of the rim hole. The test plan is presented in a
step-by-step format in the following:
■ Final Spin Test Plan
Cycle 1
• Ramp speed to 21,000 rpm
• Decelerate speed to 0 rpm
• Measure permanent radial displacement
Cycle 2
• Ramp speed to achieve a strain gage reading of 0.03 at the base of the rim hole
• Decelerate speed to 0 rpm
• Measure permanent radial displacement
Cycle 3
NASA/CR—2006-214338 17
• Ramp speed until disk failure

2.3 WE 3—Characterize Static and Cyclic Disk Behavior and Predict Spin Pit Behavior of Disks
2.3.1 Characterize Static and Cyclic Disk Behavior
The mechanical test plan was designed to cover two needs:
Tensile testing to determine true stress—true strain response in the fine grain, coarse grain, and transition zone sections of the forging
■ Low cycle fatigue (LCF) testing to verify the transition zone does not represent a plane of
weakness in cyclic operation
The tensile test plan included smooth specimens to generate the stress-strain curves and notched
specimens that would be used to validate the deformation and fracture models using triplicate
testing for each configuration. Specimens were extracted from the fine grain bore, transition
zone, and coarse grain rim. These specimens all were taken from the chordal direction. The LCF
test plan constituted six tests each from the fine grain, transition zone, and grain regions. The
fine grain and coarse grain specimens were extracted from the chordal direction, while the
transition zone specimens were oriented radially with the transition zone designed to be in the
center of the gage section. Figure 16 shows the specimen blanking (cut-up) diagram employed
for the testing program. The specimen blanking was conducted using saw cutting, and it proved
to be quite difficult to maintain saw alignment. A lesson learned from this experience is that the
more expensive electrodischarge machining (EDM) wire blanking is required for this material
and thickness combination.
NASA/CR—2006-214338 18
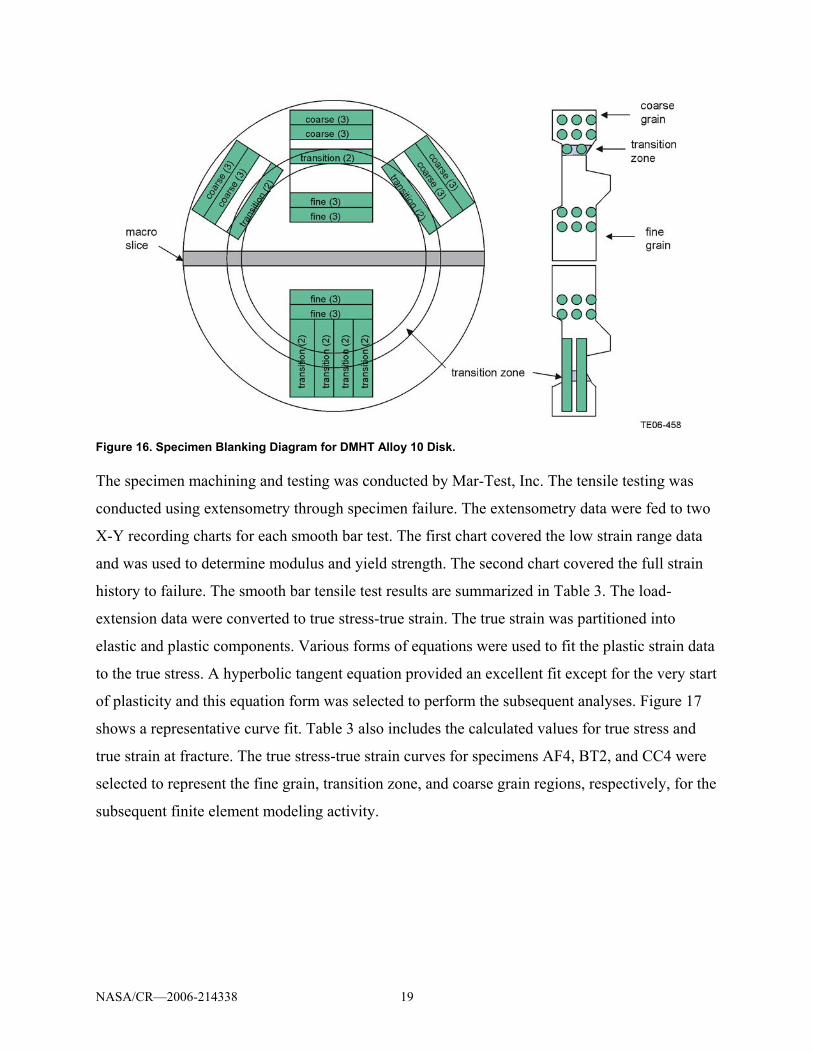
Figure 16. Specimen Blanking Diagram for DMHT Alloy 10 Disk.
The specimen machining and testing was conducted by Mar-Test, Inc. The tensile testing was
conducted using extensometry through specimen failure. The extensometry data were fed to two
X-Y recording charts for each smooth bar test. The first chart covered the low strain range data
and was used to determine modulus and yield strength. The second chart covered the full strain
history to failure. The smooth bar tensile test results are summarized in Table 3. The load-
extension data were converted to true stress-true strain. The true strain was partitioned into
elastic and plastic components. Various forms of equations were used to fit the plastic strain data
to the true stress. A hyperbolic tangent equation provided an excellent fit except for the very start
of plasticity and this equation form was selected to perform the subsequent analyses. Figure 17
shows a representative curve fit. Table 3 also includes the calculated values for true stress and
true strain at fracture. The true stress-true strain curves for specimens AF4, BT2, and CC4 were
selected to represent the fine grain, transition zone, and coarse grain regions, respectively, for the
subsequent finite element modeling activity.
NASA/CR—2006-214338 19

Figure 17. Calculated True Stress-True Strain Behavior for Smooth Tensile Specimen AF4 and Best Fit
Hyperbolic Tangent Curve.
The notched bar specimen configuration constituted a circumferentially notched round bar with a
0.25-in. nominal gage diameter, a 0.18-in. notch root diameter, and a theoretical stress
concentration factor of 3.45. A 0.5-in. long gage length extensometer was centered about the
notch to monitor elongation to specimen failure. The notch tensile test results are summarized in
Table 4. The load/extension data from these tests were furnished to the AADC structural analyst
to calibrate the Alloy 10 deformation behavior models and fracture criteria prior to conducting
the finite element model simulation of the disks.
A simplified elastic-plastic failure criteria was proposed wherein fracture occurs when the local
maximum principle true stress exceeds a critical value. It was recognized that this simplified
theory neglects short crack formation behavior such as stage 1 crystallographic cracking from
concentrated slip within favorably oriented grains, the slow growth and linkage of these cracks to
a critical size, and the geometric and external loading influences on these phenomenon.
NASA/CR—2006-214338 20

TABLE 3. ROOM TEMPERATURE SMOOTH BAR TENSILE RESULTS.
Specimen I.D.
Modulus 106 psi
0.2% yield
strength, ksi
Ultimatetensile
strength,ksi
Area reduction,
% Elongation,
%
True fracture strain,
%
True fracturestress,
ksi
FootNoteRef
Fine Grain AF4 32.7 163 240 23 25 22.03 301992 IX, 1 AF5 35.2 163 240 27 25 21.83 298331 IX, 1 BF4 30.1 164 240 23 24 22.90 302100 IX, 1 Average 32.7 163.3 240 24.3 24.7 22.25 300808
Transition Zone AT4 37.2 165 243 27 25 Extensometer slipped OX, 1
AT5 31.3 166 240 26 21 18.04 262646 OX, 1 BT2 31.2 160 233 26 26 21.33 289095 IX, 1 Average 33.2 163.7 238.7 26.3 24 19.69 275871
Coarse Grain CC4 27.8 159 227 26 25 23.14 284685 IX, 1 CC5 28.9 153 225 19 24 24.41 288232 OX, 2 DC4 27.6 160 226 20 18 18.14 270209 OX, 2 Average 28.1 157.3 226 21.7 22.3 21.9 281042 IX: Failed inside of extensometer probes OX: Failed outside of extensometer probe in the test section 1: Elongation calculated from change in length between gage marks = 1 inch 2: Elongation calculated from change in overall length, using adjusted gage length of 1.236 inches
TABLE 4. ROOM TEMPERATURE NOTCHED BAR TENSILE RESULTS.
Specimen I.D. Load deflection slope, KIPS/in.
Ultimate tensile strength, ksi
0.001 inch offset yield strength, ksi
Overall length change, in.
Fine Grain AF6 57.3 273 247 0.012 BF5 60.8 269 247 0.011 BF6 59.6 274 255 0.011 Average 59.2 272 249.7 0.0113
Transition Zone AT6 57.1 268 246 0.012 CT2 55.4 266 246 0.012 DT2 62.7 272 256 0.013 Average 58.4 268.7 249.3 0.0123
Coarse Grain CC6 56.4 265 243 0.012 DC5 56.0 257 235 0.013 DC6 59.0 261 243 0.012 Average 57.1 261 240.3 0.0123
NASA/CR—2006-214338 21
The LCF testing was conducted at 1200°F with smooth specimens (Kt = 1) under R = 0 (zero to
maximum) loading conditions. All tests were performed under load control. The stress levels
were selected to provide an aim life of approximately 20,000 cycles in the fine grain material. A
170-ksi stress range was selected for the first three specimens, which produced higher lives than
desired. The stress range was increased to 180 ksi and the remaining specimens were tested using
this range. The test results are provided in Table 5.
As expected, the coarse grain LCF capability is significantly lower than the fine grain material.
Contrary to expectations, the transition zone material was equal or superior to the fine grain
material. Past work by NASA showed that the transition zone LCF capability generally tracked
with the coarser grain lives. NASA performed metallographic and fractographic examinations on
the failed test specimens. It was concluded that some of the specimens with chordal orientation
that were intended for tensile testing were transposed with the radially oriented LCF specimens.
It was also shown that the radial specimens were somewhat biased towards the fine grain
material. The web material had a faster cooling rate from solution heat treatment than the thicker
bore section, and presumably, this provided sufficient fatigue life enhancement to offset the
somewhat coarser grain size in the specimens tested.
NASA/CR—2006-214338 22

TABLE 5. 1200°F R = 0 SMOOTH BAR LOW CYCLE FATIGUE RESULTS FROM DMHT PROCESSED
ALLOY 10 FORGING.
Specimen I.D. Stress range, ksi Cycles to crack initiation Cycles to failure Failure location Fine Grain
AF3 170 N/A >58524 Adaptor failure AF1 180 8531 8694 IX AF2 180 15026 15281 IX BF1 180 5628 6050 IX BF2 180 10963 11095 IX BF3 180 32187 32187 IX Average for 180 ksi tests 14467 14661
Transition Zone DT1 170 N/A >75580 Threads
AT1 180 12555 12774 IX AT2 180 17603 17889 IX AT3 180 18550 18680 OX BT1 180 13582 13916 IX CT1 180 27943 28352 IX Average for 180 ksi tests 18047 18332
Coarse Grain CC1 170 3788 4097 OX CC2 180 1235 1463 IX CC3 180 2498 2918 IX, MI DC1 180 2968 3148 IX DC2 180 2002 2415 IX DC3 180 1294 1740 IX Average for 180 ksi tests 1999 2337
N/A: Not available.
IX: Failed inside of extensometer probes. OX: Failed outside of extensometer probe in the test section. MI: Multiple initiations.
2.3.2 Predict Spin Pit Behavior
The initial predicted burst rpm were reported as:
■ 25,250 rpm for the DMHT wheel
■ 26,000 rpm for the subsolvus wheel
The burst speeds were calculated by equating the maximum plastic strain in the notched
specimen at failure to that occurring in the spinning wheel. The maximum plastic strain occurred
NASA/CR—2006-214338 23
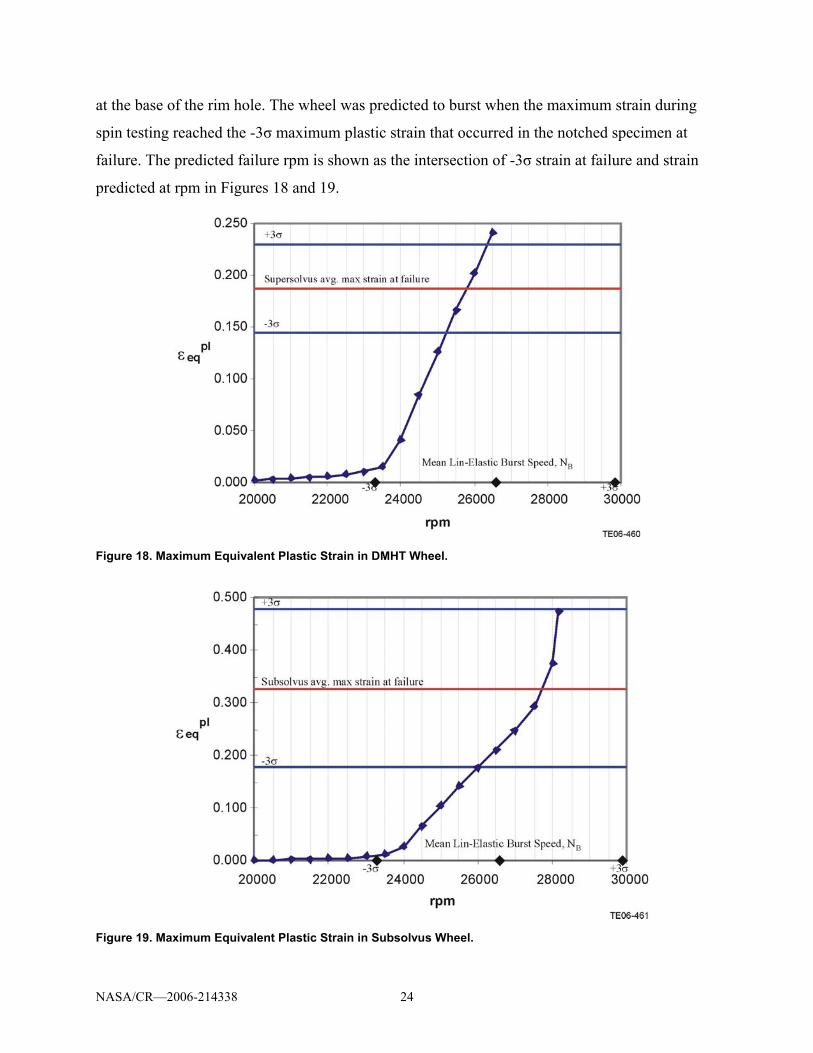
at the base of the rim hole. The wheel was predicted to burst when the maximum strain during
spin testing reached the -3σ maximum plastic strain that occurred in the notched specimen at
failure. The predicted failure rpm is shown as the intersection of -3σ strain at failure and strain
predicted at rpm in Figures 18 and 19.
Figure 18. Maximum Equivalent Plastic Strain in DMHT Wheel.
Figure 19. Maximum Equivalent Plastic Strain in Subsolvus Wheel.
NASA/CR—2006-214338 24

To predict a burst speed, effort was expended investigating a new failure criteria for the wheel
based on results of the elastic-plastic analysis. To support this work, notched specimens were
tested and analyzed. The smooth tensile specimen data used to calibrate the predicted elastic-
plastic strain versus stress are shown in Figure 20. The nonlinear elastic-plastic behavior was
modeled by including tabular input of the true stress-logarithmic strain response of the material
obtained from representative smooth bar tensile tests.
FEA predictions of the stress/strain state present in the notched tensile specimens at failure used
to postulate the failure state for the wheel are shown in Table 6.
TABLE 6. FEA PREDICTIONS OF MAXIMUM STRAINS PRESENT AT FAILURE IN NOTCHED SPECIMENS.
TestSpecimen
totalengineeringlongitudinal
strain,
(εL)eng
totallogarithmiclongitudinal
strain,
(εL)ln
plasticlongitudinalengineering
strain,
(εLpl)eng
plasticequivalent
strain,
εeqpl
AF6 0.3097 0.3098 0.3004 0.3368BF5 0.2542 0.2545 0.2449 0.2748BF6 0.3420 0.3422 0.3328 0.3738
Average 0.3020 0.3022 0.2927 0.3285St Dev 0.0444 0.0443 0.0445 0.0500C.O.V. 0.1471 0.1468 0.1519 0.1523
AT6 0.3098 0.3101 0.3005 0.3376CT2 0.2533 0.2536 0.2441 0.2739DT2 0.1332 0.1332 0.1249 0.1408
Average 0.2321 0.2323 0.2232 0.2508St Dev 0.0902 0.0904 0.0897 0.1004C.O.V. 0.3886 0.3889 0.4017 0.4004
CC6 0.1868 0.1874 0.1777 0.1998DC5 0.1612 0.1615 0.1524 0.1716DC6 0.1776 0.1781 0.1686 0.1897
Average 0.1752 0.1757 0.1662 0.1870St Dev 0.0130 0.0131 0.0128 0.0143C.O.V. 0.0740 0.0747 0.0771 0.0764
SU
BS
OLV
US
TRA
NS
ITIO
NS
UP
ER
SO
LVU
S
The initial failure hypothesis is based on equating the maximum plastic strain in the notched
specimen at failure to that occurring in the spinning wheel. FEA of the wheel was used to predict
the rotational speed necessary to achieve this failure state in the spinning wheel. Based on these
NASA/CR—2006-214338 25

analyses, the maximum plastic strain in the wheel was found to occur at the base of the rim hole
as designed (Figures 21 and 22).
Figure 20. Smooth Tensile Specimen Data.
NASA/CR—2006-214338 26

Figure 21. Calculated Maximum Plastic Strain in Disk.
Figure 22. Evolution of Peak Equivalent Plastic Strain in DMHT Wheel.
2.4 WE 4—Analyze Spin Test Data
2.4.1 Initial Analysis Predicted Versus Actual Burst rpm
Mixed results were achieved upon running the tests and comparing the actual results to the
predicted behavior. First, the burst speed was significantly overpredicted. The actual measured
NASA/CR—2006-214338 27

burst speeds for the two wheels were 24,005 (DMHT) and 24,228 rpm (subsolvus). However,
favorable results were found when comparing the predicted and measured strain response as a
function of rotational speed (Figures 23, 24, and 25). The burst crack initiation site also matched
the peak, model predicted strain location at the wheel’s last continuous fiber occurring at the
base of the rim hole. In light of this, it became obvious that while the current failure criterion was
in error, the fact that the material state could accurately be predicted into the plastic regime was
reason to believe that with a properly formulated failure criterion, accurate burst speed
predictions could be achieved.
Figure 23. FEA Prediction of Strain Present in DMHT Wheel at Gage No. 1/1 Location—Bottom of Through-
hole.
NASA/CR—2006-214338 28

Figure 24. FEA Prediction of Strain Present in DMHT Wheel at Gage No. 2/2 Location—in Transition Zone Area.
Figure 25. FEA Prediction of Strain Present in DMHT Wheel at Gage No. 6/8 Location—Bore I.D.
NASA/CR—2006-214338 29

2.4.2 Additional Analysis of Predicted Versus Actual Burst rpm
As a result of the previously sited, overpredicted burst speed, the material correlation and
prediction methodology were revisited. In initially modeling the failure state of the notched
specimen, the recorded load at failure had been applied to the finite element model, and the
resulting stress/strain state was utilized in formulating the failure criteria. During experimental
testing of the notched specimens, the extensometer elongation at failure had also been recorded.
Upon review, it was found the FEA prediction for the displacement corresponding to the
specified failure load exceeded the observed elongation. The slope of the force versus
displacement curve is very low as failure is approached. This leads to large changes in both the
observed and predicted displacements for very small changes in load. Therefore, to reduce the
sensitivity of the predicted stress/strain state at failure to possible experimental errors, it was
decided to recorrelate the failure of the notched specimen utilizing the recorded displacement at
failure rather than load at failure. Checking the resultant force in the FEA and comparing to the
experimentally observed failure load found only a slight discrepancy.
The change made to the prediction methodology was to base the failure upon stress rather than
plastic strain. In both the notched specimen and the wheel, plastic yielding occurred in isolated
regions surrounded by material behaving linear elastically. Consequently, the observed plastic
strain states at failure in both cases were not allowed to develop freely. The new criterion
proposed was to compare the maximum axial tensile stress in the notched specimen to the
maximum hoop stress in the wheel. This is effectively the maximum principal stress criterion
referenced in Section 2.3.1 (see Table 7 for listing of calculated stress by type). The axial stress
at fracture in the notched specimens from Table 7 correlates very well with the true fracture
stress in the smooth tensile specimens from Table 3, supporting the maximum principal stress
criterion.
NASA/CR—2006-214338 30
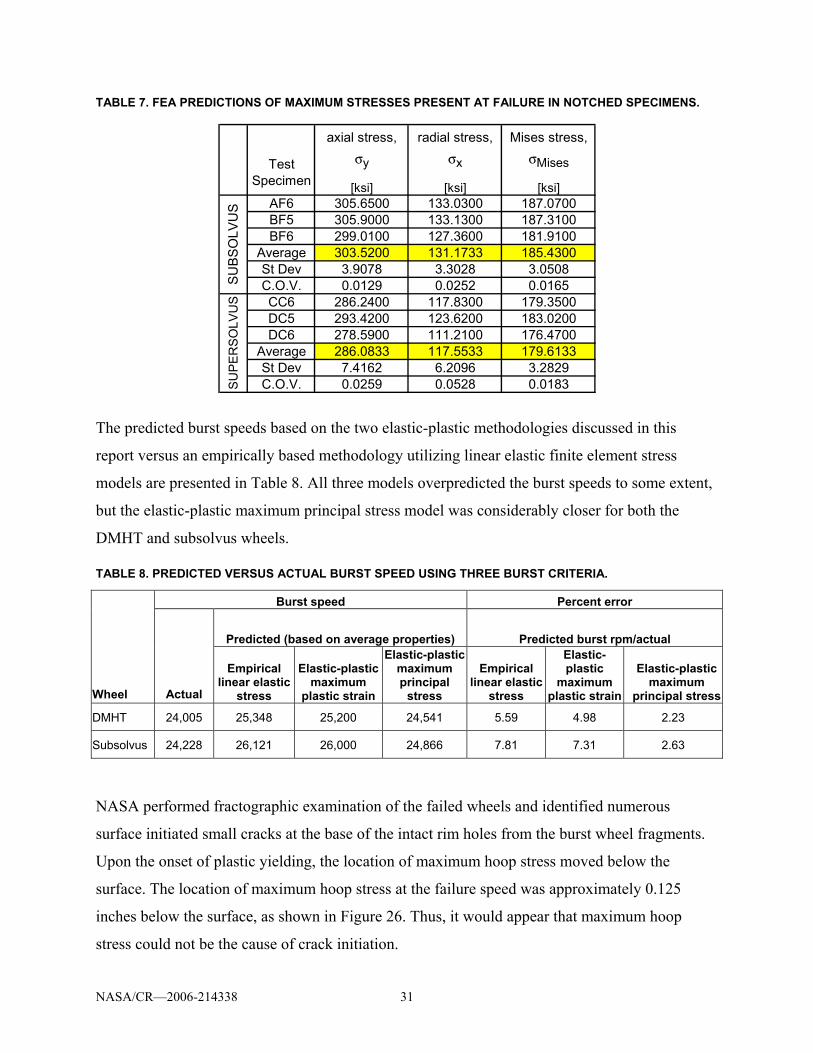
TABLE 7. FEA PREDICTIONS OF MAXIMUM STRESSES PRESENT AT FAILURE IN NOTCHED SPECIMENS.
TestSpecimen
axial stress, σy
[ksi]
radial stress, σx
[ksi]
Mises stress, σMises
[ksi]AF6 305.6500 133.0300 187.0700BF5 305.9000 133.1300 187.3100BF6 299.0100 127.3600 181.9100
Average 303.5200 131.1733 185.4300St Dev 3.9078 3.3028 3.0508C.O.V. 0.0129 0.0252 0.0165CC6 286.2400 117.8300 179.3500DC5 293.4200 123.6200 183.0200DC6 278.5900 111.2100 176.4700
Average 286.0833 117.5533 179.6133St Dev 7.4162 6.2096 3.2829C.O.V. 0.0259 0.0528 0.0183
SU
BS
OLV
US
SU
PE
RS
OLV
US
The predicted burst speeds based on the two elastic-plastic methodologies discussed in this
report versus an empirically based methodology utilizing linear elastic finite element stress
models are presented in Table 8. All three models overpredicted the burst speeds to some extent,
but the elastic-plastic maximum principal stress model was considerably closer for both the
DMHT and subsolvus wheels.
TABLE 8. PREDICTED VERSUS ACTUAL BURST SPEED USING THREE BURST CRITERIA.
Burst speed Percent error
Predicted (based on average properties) Predicted burst rpm/actual
Wheel Actual
Empirical linear elastic
stress
Elastic-plastic maximum
plastic strain
Elastic-plastic maximum principal
stress
Empirical linear elastic
stress
Elastic-plastic
maximum plastic strain
Elastic-plastic maximum
principal stress
DMHT 24,005 25,348 25,200 24,541 5.59 4.98 2.23
Subsolvus 24,228 26,121 26,000 24,866 7.81 7.31 2.63
NASA performed fractographic examination of the failed wheels and identified numerous
surface initiated small cracks at the base of the intact rim holes from the burst wheel fragments.
Upon the onset of plastic yielding, the location of maximum hoop stress moved below the
surface. The location of maximum hoop stress at the failure speed was approximately 0.125
inches below the surface, as shown in Figure 26. Thus, it would appear that maximum hoop
stress could not be the cause of crack initiation.
NASA/CR—2006-214338 31

Figure 26. Location of Maximum Hoop Stress.
Further examination of the results of the analysis found that the von Mises stress was, in fact, a
maximum in the regions where high surface crack densities occurred (Figure 27). These
observations suggest that concentrated slip behavior and crack formation mechanisms need to be
determined to develop an accurate physics based burst criterion.
Figure 27. Von Mises stress contours without (left) and with (right) overlay of crack locations.
NASA/CR—2006-214338 32
3. Summary and Recommendations This project enabled the validation of the design methodology to predict the behavior of dual
grain structure near the burst limit. This achievement is a critical milestone in the
implementation of DMHT technology into future turbine rotors.
While this project and previous research furthered the understanding of advanced nickel disk
alloys and processes, the technology must move forward on several fronts. The following
additional work is recommend to enable DMHT transition to the commercial sector:
■ DMHT rotor burst tests at high rim temperatures to further correlate analytical predictions.
■ Model and simulate the microstructural evolution using software codes such as PreciCalc™
and DEFORM™. This would provide a better understanding of the mechanical behavior
interactions in highly stressed disk features such as rim attachments.
■ Investigate material corrosion behavior at high rim temperatures.
■ Extension of probabilistic lifing methodologies to the DMHT processed powder metallurgy
alloys.
NASA/CR—2006-214338 33
This publication is available from the NASA Center for AeroSpace Information, 301–621–0390.
REPORT DOCUMENTATION PAGE
2. REPORT DATE
19. SECURITY CLASSIFICATION OF ABSTRACT
18. SECURITY CLASSIFICATION OF THIS PAGE
Public reporting burden for this collection of information is estimated to average 1 hour per response, including the time for reviewing instructions, searching existing data sources,gathering and maintaining the data needed, and completing and reviewing the collection of information. Send comments regarding this burden estimate or any other aspect of thiscollection of information, including suggestions for reducing this burden, to Washington Headquarters Services, Directorate for Information Operations and Reports, 1215 JeffersonDavis Highway, Suite 1204, Arlington, VA 22202-4302, and to the Office of Management and Budget, Paperwork Reduction Project (0704-0188), Washington, DC 20503.
NSN 7540-01-280-5500 Standard Form 298 (Rev. 2-89)Prescribed by ANSI Std. Z39-18298-102
Form Approved
OMB No. 0704-0188
12b. DISTRIBUTION CODE
8. PERFORMING ORGANIZATION REPORT NUMBER
5. FUNDING NUMBERS
3. REPORT TYPE AND DATES COVERED
4. TITLE AND SUBTITLE
6. AUTHOR(S)
7. PERFORMING ORGANIZATION NAME(S) AND ADDRESS(ES)
11. SUPPLEMENTARY NOTES
12a. DISTRIBUTION/AVAILABILITY STATEMENT
13. ABSTRACT (Maximum 200 words)
14. SUBJECT TERMS
17. SECURITY CLASSIFICATION OF REPORT
16. PRICE CODE
15. NUMBER OF PAGES
20. LIMITATION OF ABSTRACT
Unclassified Unclassified
Final Contractor Report
Unclassified
1. AGENCY USE ONLY (Leave blank)
10. SPONSORING/MONITORING AGENCY REPORT NUMBER
9. SPONSORING/MONITORING AGENCY NAME(S) AND ADDRESS(ES)
National Aeronautics and Space AdministrationWashington, DC 20546–0001
Available electronically at http://gltrs.grc.nasa.gov
May 2006
NASA CR—2006-214338EDR–90712
E–15574
WBS 698259.02.07.03NAS3–01143, Task 4
42
Spin Testing of Superalloy Disks With Dual Grain Structure
Tab M. Heffernan
Superalloy disks
Unclassified -UnlimitedSubject Category: 26
Rolls-Royce North American Technologies, Inc.P.O. Box 7162Indianapolis, Indiana 46207
Project manager, John Gayda, Glenn Research Center, Materials and Structure Division, organization code RXA,216–433–3273
This 24-month program was a joint effort between Allison Advanced Development Company (AADC), General ElectricAircraft (GEAE), and NASA Glenn Research Center (GRC). AADC led the disk and spin hardware design and analysisutilizing existing Rolls-Royce turbine disk forging tooling. Testing focused on spin testing four disks: two supplied byGEAE and two by AADC. The two AADC disks were made of Alloy 10, and each was subjected to a different heat treatprocess: one producing dual microstructure with coarse grain size at the rim and fine grain size at the bore and the otherproduced single fine grain structure throughout. The purpose of the spin tests was to provide data for evaluation of theimpact of dual grain structure on disk overspeed integrity (yielding) and rotor burst criteria. The program culminatedwith analysis and correlation of the data to current rotor overspeed criteria and advanced criteria required for dualstructure disks.