Embed Size (px)
Citation preview
Spending Habits of OSU Undergraduates:
A Data Analysis of Student Debt, Credit Cards, and
Employment
2002
The Ohio State University
The Office of Student Affairs Assessment
December 2002
i
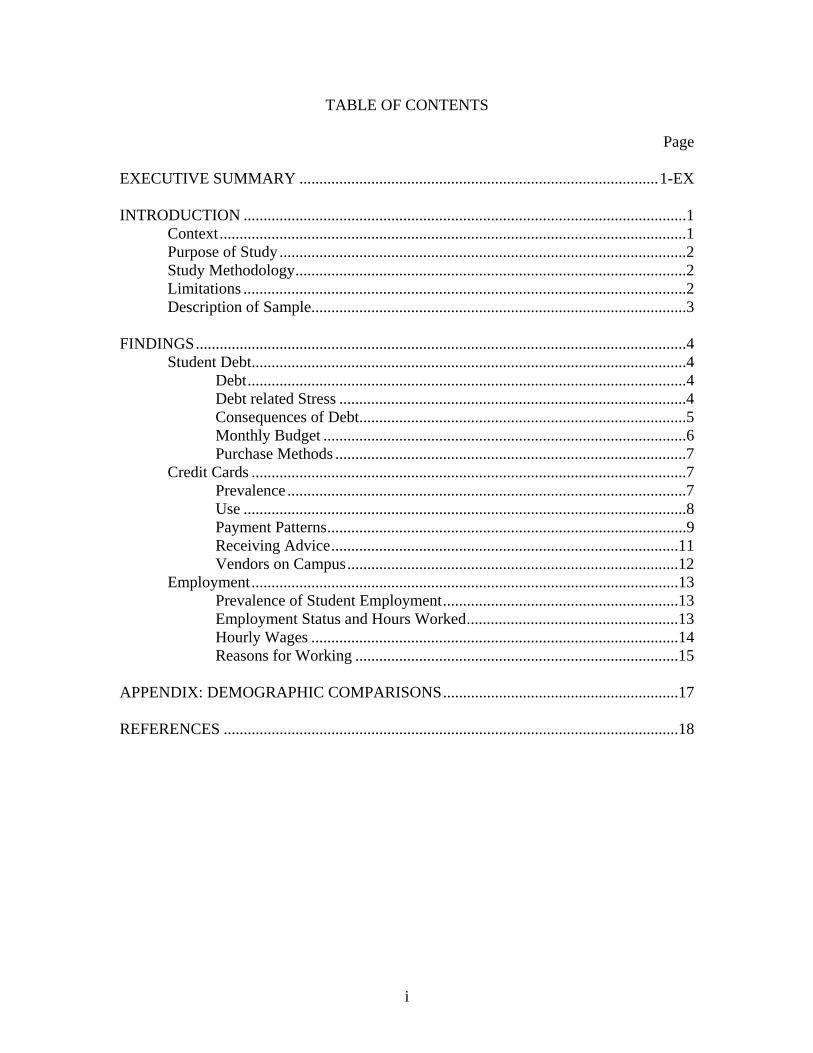
TABLE OF CONTENTS
Page
EXECUTIVE SUMMARY ..........................................................................................1-EX INTRODUCTION ...............................................................................................................1 Context.....................................................................................................................1 Purpose of Study ......................................................................................................2 Study Methodology..................................................................................................2 Limitations ...............................................................................................................2 Description of Sample..............................................................................................3 FINDINGS...........................................................................................................................4 Student Debt.............................................................................................................4 Debt..............................................................................................................4 Debt related Stress .......................................................................................4 Consequences of Debt..................................................................................5 Monthly Budget ...........................................................................................6 Purchase Methods ........................................................................................7 Credit Cards .............................................................................................................7 Prevalence ....................................................................................................7 Use ...............................................................................................................8 Payment Patterns..........................................................................................9 Receiving Advice.......................................................................................11 Vendors on Campus...................................................................................12 Employment...........................................................................................................13 Prevalence of Student Employment...........................................................13 Employment Status and Hours Worked.....................................................13 Hourly Wages ............................................................................................14 Reasons for Working .................................................................................15 APPENDIX: DEMOGRAPHIC COMPARISONS...........................................................17 REFERENCES ..................................................................................................................18
1-EX
Spending Habits of OSU Undergraduates: 2002
EXECUTIVE SUMMARY Student Affairs Assessment
The main goal of this study was to assess student-spending patterns as related to debt, credit card use, and employment at The Ohio State University. By understanding student spending habits and the financial atmosphere in which they live, university initiatives and policies can be implemented to assist students in managing their finances, establishing responsible credit card use, and finding employment that is conducive to achieving academic goals. This report presents comparative data from two similar surveys conducted in 2002 and 2000. Both surveys were sponsored by the Office of Student Affairs Assessment and administered through the OSU College of Social and Behavioral Sciences’ Center for Survey Research. Student responses were obtained through telephone interviews of OSU undergraduates. The 2002 survey randomly selected 1000 undergraduate students and received 613 responses for a response rate of 63% and a 3.9% margin of error. The 2000 survey randomly selected 785 undergraduate students and received 421 responses for a response rate of 54% and a 4.7% margin of error. The following conclusions were made from the data: Students in both 2002 and 2000 gave similar responses when asked about their indebtedness. Overall, students do not seem to be overly concerned or stressed about their debt.
• In both years, over 60% of students (63.8% in 2002 and 61.8% in 2000) did not consider themselves in debt.
• For those students in debt, a majority (59.6% in 2002 and 57.9% in 2000) responded that their debt would be only a small problem or no problem at all in the next five years.
• On the other hand, 20% of students in debt in 2002 and 2000 responded that they felt “a great deal” or “quite a bit” of stress regarding their debt.
A comparison between survey results in 2002 and 2000 depict a decline in debt-related consequences.
• There was a 11.3% decrease in students taking on an extra job or working extra hours as a result of their debt (from 64.5% in 2000 to 53.2% in 2002).
• A smaller percentage of students in 2002 (23.1% compared to 28.4% in 2000) considered using student loans to pay back other bills.
• In 2002, 17.6% of students responded that debt had caused them to neglect their academic work compared to 22.7% in 2000.
2-EX
The percent of student credit card holders has increased since 2000; students are coming to campus already possessing credit cards; and a greater percentage of these credit cards have been acquired through the assistance of parents.
• Precisely 67.0% of students surveyed in 2002 reported possessing a credit card compared to 57.3% in 2000 – an increase of almost 10%.
• Approximately 50% (50.2%) of students with at least one credit card in 2002 acquired a credit card prior to starting college compared to 41.0% in 2000.
• Almost 31% (30.9%) of students with a credit card(s) in 2002 said either a parent or guardian assisted them in acquiring a credit card compared to 14.2% in 2000.
Although a higher percentage of students possess credit cards, on the whole students seem to be managing their credit card debt more responsibly.
• Approximately 62% (62.4%) of students with credit cards in 2002 reported paying off their balance monthly while 55.5% replied this way in 2000.
• Of students with a credit card(s) the average monthly balance in 2002 was $592 with an average monthly payment of $211. This is an improvement from 2000 when the average monthly balance was $659 and the average monthly payment was $166.
• Over 84% (84.3%) of students in 2002 reported that they had not reached their credit limit on any credit card compared to 74.1% in 2000.
• Compared to 2000, students in 2002 were less likely to use credit cards because of a lack of money (27.0% in 2002 compared to 35.2% in 2000) and more likely to use them for convenience (38.7% in 2002 compared to 32.6% in 2000).
Students are considerably more interested in receiving information on credit card management, and they are much more inclined to follow a monthly budget.
• Almost 77% (76.7%) of students in 2002 responded that they would find it useful if the university gave advice on how to use and manage credit cards while only 30.6% responded this way in 2000.
• In 2002, 44.7% of students followed a monthly budget compared to 27.9% in 2000.
Employment data remained fairly constant between the two years. Paying for monthly expenses is the primary reason for working.
• Close to two thirds of students in both years (65.6% in 2002 and 63.5% in 2000) were employed.
• In 2002, students worked an average of 20.82 hours and made $8.73 compared to working an average of 22.62 hours and making $8.24 in 2000.
• A majority of students in 2002 (52.2%) held a job to pay for monthly expenses. Others worked for spending money (29.4%), to pay for college (10.1%), to pay credit card bills (5.6%), and to support a family (2.8%).
Spending Habits – 2002
Student Affairs Assessment 1
INTRODUCTION
Context Over the course of college life, many students accrue burdensome, and in some cases, unmanageable levels of debt. In a report released by the Higher Education Project of the State Public Interest Research Groups, it was estimated that 39 percent of student borrowers were graduating with “unmanageable levels” of student-loan debt. The report also showed that the average debt among student borrowers has doubled in the last eight years to $16,928 (Kellogg, 2002). High amounts of debt are likely to affect students in negative ways. In studies looking at the stressors students face on campus, students have identified financial matters as one of their biggest concerns (Murphy & Archer, 1996). The horror stories of student debt accumulation often begin with overextended credit card use. At the same time, there is a belief that the best opportunity to initiate a credit history is during the collegiate years. Many people also see credit cards as conveniences and as beneficial resources during emergencies. However, the convenience may tempt students to live beyond their means and the students may not understand the consequences of incurring excessive debt (D’Agostino, 2001). A recent survey of 55 colleges determined that 80 percent of students questioned had underestimated the total costs of their loans by an average of $4,846 (Burd, 2001).
Even though credit cards have the potential to dangerously burden students with debt, students continue to acquire them. According to a survey sponsored by the firm Student Monitor and based on 1,200 randomly selected students from 100 universities around the country, 63 percent of undergraduates reported possessing credit cards. Of these students, 42 percent carried a balance with an average debt of $577 (D’Agostino, 2001). In a survey of students who had applied for financial assistance through Nellie Mae, 83 percent possessed at least one credit card with an average balance of $2,327 (Nellie Mae, 2002). As a result of financial need, a greater number of students are working during their undergraduate years. Pinto, Parente, and Palmer (2001) have argued that, “the enhanced spending opportunities available through easy access to credit cards is likely to increase students’ need to work extended hours to pay off outstanding balances” (p. 49). Nationally, 8 out of 10 students work while pursuing an undergraduate degree. To finance their education, students are more likely to use earnings from jobs held during the academic year than they are other types of funding (including student aid or parental support) (King, 1998). Although much has been written about student indebtedness, a more serious problem may be found in students working longer hours to meet financial commitments. Research shows that the effect of employment on students’ education varies depending on where they work and how many hours they work. Working full-time or part-time off campus has been shown to have a negative effect on degree completion, college GPA, various areas of self-reported growth, and every aspect of college satisfaction except with facilities. Working part-time on campus, however, has the opposite effect. It is positively associated with degree attainment, virtually all areas of self-reported cognitive and affective growth, and all areas of satisfaction except facilities (Astin, 1993). Similarly, longitudinal research conducted by the
Spending Habits – 2002
Student Affairs Assessment 2
Department of Education on students who began college in 1989 shows that working more than 15 hours a week has a negative effect on students’ likelihood of staying in college. On the other hand, working less than 15 hours has a positive effect (King, 1998).
Purpose of Study The purpose of this study is to assess students’ financial status and spending patterns. Specifically, the study measures characteristics of student debt and consequences of debt, monthly budgets, purchase methods, credit card use and payment patterns, and student employment. Furthermore, comparisons are made between the surveys conducted in 2002 and 2000 to measure change over time. It is possible that by understanding the spending habits of students, university initiatives and policies may be implemented to assist students in managing their finances, in establishing responsible credit card use, and in finding employment that is conducive to achieving academic goals.
Study Methodology The 2002 survey was based on telephone interviews conducted from May 6 to May 27, 2002, of 613 Ohio State, Columbus campus students (Spring quarter, 2002). Students were randomly selected for participation from a database of all undergraduate students provided by the Office of the Registrar. Initial attempts to contact respondents were made to local telephone numbers. Respondents were called at home and, if necessary, at other phone numbers when such information was available. All telephone interviews were conducted by the OSU Center for Survey Research facilities. A total of 1,000 students were randomly selected to participate in the 2002 survey. In many cases, viable telephone numbers were called upwards of 10 times in attempt to reach a respondent at a convenient time. In 27 cases the student was ineligible to participate in the survey. The remaining 973 cases were presumed to be eligible cases with valid contact information. A total of 613 interviews were completed, for a response rate of 63 percent using the most conservative calculation suggested by the American Association for Public Opinion Research. The margin of error was 3.9%. This report compares data collected in 2002 with that of a similar survey conducted in 2000. The 2000 survey was also conducted by phone through the services of the OSU Center for Survey Research. The survey was administered to 785 students and received 421 responses for a response rate of 54% and a margin of error of 4.7%.
Limitations Inherent to survey research are limitations of imprecision and sampling error. Imprecision occurs in a number of different forms. Given the nature of phone surveys, the accuracy of the data is dependent upon the relationship between the interviewer and interviewee. Problems in question interpretation and/or interviewer interference are not uncommon. Also, surveys are subject to bias associated with the wording and/or ordering of questions.
Spending Habits – 2002
Student Affairs Assessment 3
Another limitation concerns potential sampling error. Although the sample was selected randomly, sampling error may interfere with the generalizability of the results. Given the nature of sampling, certain groups were slightly over-represented in the sample when compared to the population (e.g., White students and those under 21) while others were slightly under-represented (e.g., African Americans and those over 21) (see Appendix for further detail). These differences, however, were not large enough to warrant weighting the data. In some circumstances, comparing data between the 2002 and 2000 surveys proved difficult. In addition, minor changes to the wording and ordering of questions used in the 2002 survey made some responses incompatible with their counterparts in 2000. Irreconcilable differences between data sets affected only a small number of questions and where the integrity of the information was not altered by changes, comparisons are provided.
Description of the Sample The demographics of the students who participated in the survey conducted in 2002 were as follows: (See Appendix for comparisons with the student population)
GENDER: 48.3% were female; 51.7% were male RANK: 22.2% were first year; 23.2% were second year; 23.5% were third year;
31.2% were fourth year GPA: 48.0% had a GPA between 3.0 and 4.0; 40.6% between 2.0 and 2.99; 11.4%
less than 2.0 AGE: 49.6% were under 21 years of age; 50.4% were 21 or over RACE/ETHNICITY: 82.2% were White; 6.0% were African American/Black; 5.1%
were Asian/Pacific Islander; 2.9% were International; 2.1% were Hispanic/Latino(a); 0.2% were American Indian/Alaskan Native; 1.5% self-reported as “other”
RESIDENCE: 30.1% lived on-campus; 69.3% lived off-campus; 0.7% reported “other”
Spending Habits – 2002
Student Affairs Assessment 4
FINDINGS
The findings are organized into three sections: Student Debt, Credit Cards, and Employment. In the first section (Student Debt), the stress and consequences caused by debt and the factors that may influence indebtedness like budget adherence and purchase methods are presented. In the second section (Credit Cards), findings related to credit card possession, management, and use are presented. Student Employment is the last section presented. Information on employment rate, hours worked, wages, and reasons for working are examined. When applicable, comparisons are made between responses given to questions in the year 2000 survey.
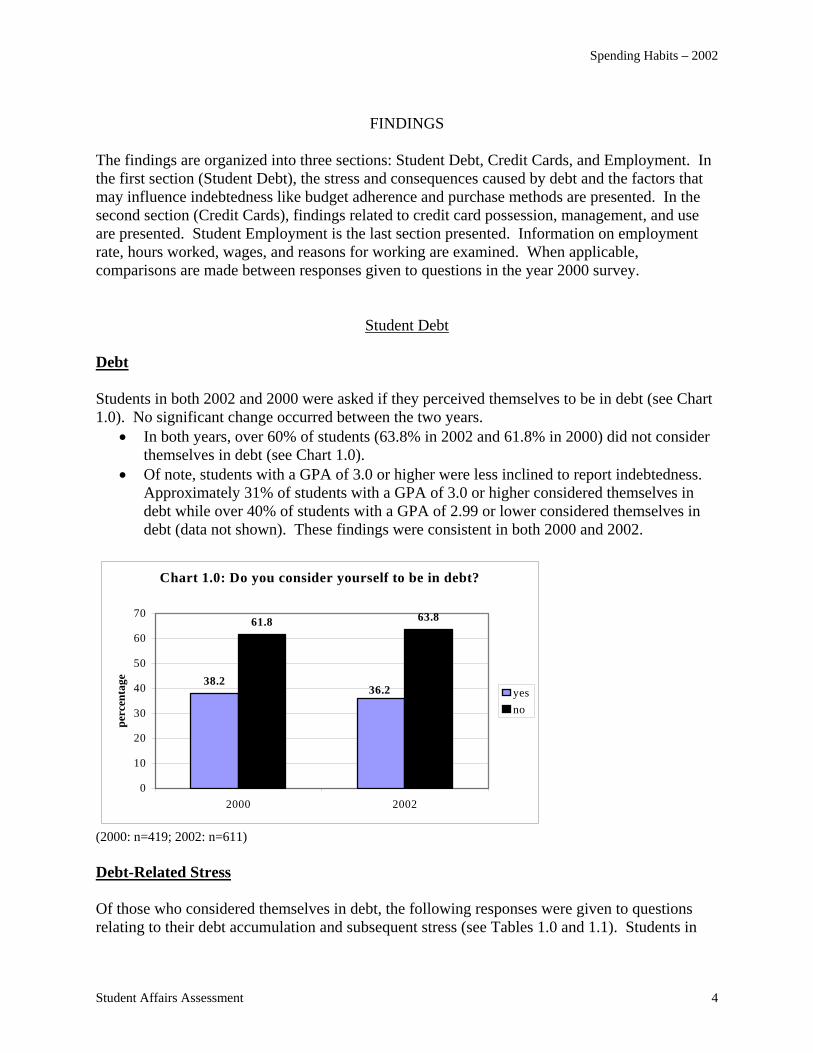
Student Debt Debt Students in both 2002 and 2000 were asked if they perceived themselves to be in debt (see Chart 1.0). No significant change occurred between the two years.
• In both years, over 60% of students (63.8% in 2002 and 61.8% in 2000) did not consider themselves in debt (see Chart 1.0).
• Of note, students with a GPA of 3.0 or higher were less inclined to report indebtedness. Approximately 31% of students with a GPA of 3.0 or higher considered themselves in debt while over 40% of students with a GPA of 2.99 or lower considered themselves in debt (data not shown). These findings were consistent in both 2000 and 2002.
Chart 1.0: Do you consider yourself to be in debt?
38.2
61.8 63.8
36.2
0
10
20
30
40
50
60
70
2000 2002
perc
enta
ge
yesno
(2000: n=419; 2002: n=611) Debt-Related Stress Of those who considered themselves in debt, the following responses were given to questions relating to their debt accumulation and subsequent stress (see Tables 1.0 and 1.1). Students in

Spending Habits – 2002
Student Affairs Assessment 5
both 2002 and 2000 expressed similar sentiments regarding the severity of future problems caused by their debt.
• In 2002, 9.5% of students who considered themselves in debt indicated that their debt would be a large or extreme problem compared to 8.5% in 2000.
• For both years, a majority of students who considered themselves in debt (59.6% in 2002 and 57.9% in 2000) responded that their debt would either be a small problem or no problem at all.
Table 1.0: Thinking ahead over the next five years, how much of a problem will the total amount of money you owe be for you?
By percent 2000 (n=140)
2002 (n=220)
An extreme problem 1.4 1.8 A large problem 7.1 7.7 A medium problem 33.6 30.9 A small problem 38.6 35.5 Not at all a problem 19.3 24.1
• Similar results were reported in both years concerning the amount of stress caused by debt. Twenty percent (20.0%) of students who considered themselves in debt in 2002 and 20.6% in 2000 responded that they had “a great deal” or “quite a bit” of stress regarding their debt.
• However, in 2002, 39.5% of students who considered themselves in debt responded that they experienced “not very much stress” or “no stress at all” compared to 44.7% in 2000. Students in 2002 were more likely to report that their debt caused “some stress.”
Table 1.1: How much stress does the total amount that you owe cause you?
By percent 2000 (n=140)
2002 (n=220)
A great deal of stress 7.1 6.4 Quite a bit of stress 13.5 13.6 Some stress 34.8 40.5 Not very much stress 29.8 30.0 No stress at all 14.9 9.5 Consequences of Debt In addition to measuring students’ concern and stress over their debt accumulation, students were asked a series of questions regarding the consequences they had experienced because of debt. These questions were based on their current debt, rather than projections of their debt after college (see Table 1.2). Overall, when comparing 2002 and 2000 data, evidence suggests that, out of students who considered themselves in debt, a smaller percentage of students experienced negative consequences as a result of their debt.
• In 2002, 53.2% (compared to 64.5% in 2000) had taken an extra job or worked extra hours as a result of their debt.
• Almost 53% (52.7%) of students who considered themselves in debt in 2002 had asked or considered asking family members for financial help compared to 58.2% in 2000.
Spending Habits – 2002
Student Affairs Assessment 6
• Approximately 23% (23.1%) of students who considered themselves in debt in 2002 had considered using student loans to pay other bills while 28.4% responded this way in 2000.
• In 2002, debt caused 17.6% of students who considered themselves in debt to neglect their academic work compared to 22.7% in 2000.
• In 2002, 10.0% had either considered dropping out of college or already had dropped out of college compared to 18.6% in 2000.
• Almost 16% (15.9) of students who considered themselves in debt in 2002 (compared to 19.1% in 2000) responded that their debt had caused them to take out a debt consolidation loan.
Table 1.2: Has the amount of money you owe caused you to…?
By percent 2000
(n=141) 2002
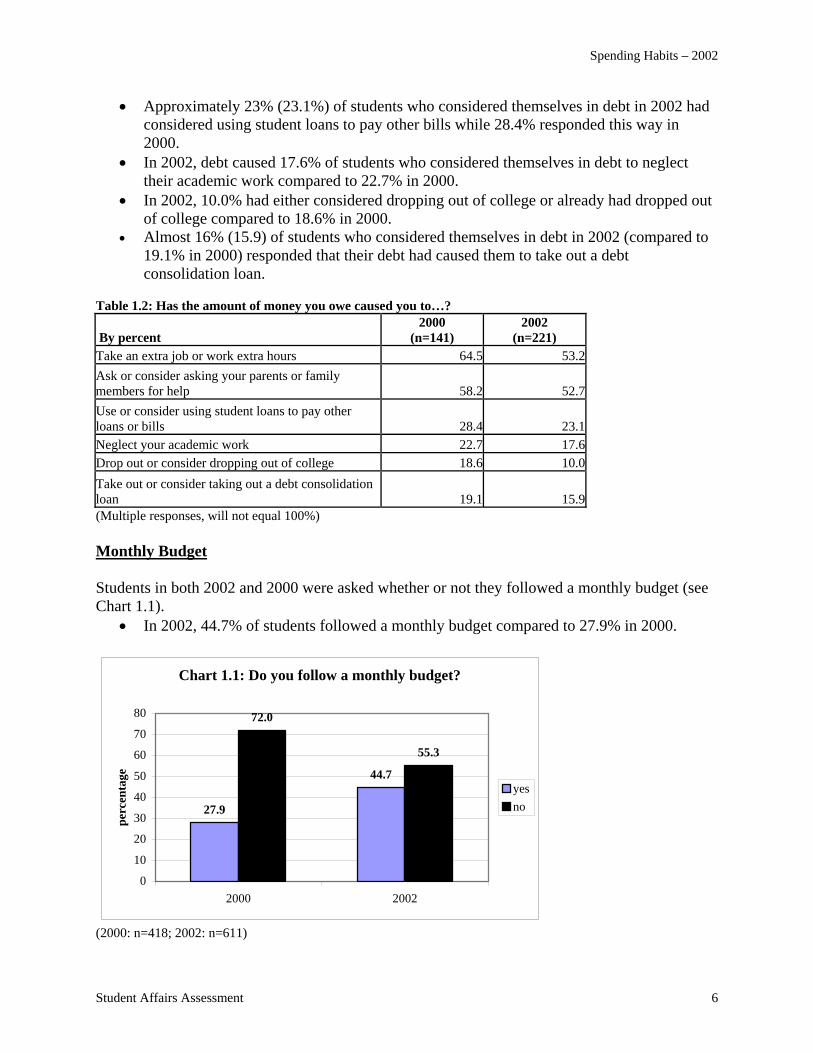
(n=221) Take an extra job or work extra hours 64.5 53.2 Ask or consider asking your parents or family members for help 58.2 52.7 Use or consider using student loans to pay other loans or bills 28.4 23.1 Neglect your academic work 22.7 17.6 Drop out or consider dropping out of college 18.6 10.0 Take out or consider taking out a debt consolidation loan 19.1 15.9 (Multiple responses, will not equal 100%) Monthly Budget Students in both 2002 and 2000 were asked whether or not they followed a monthly budget (see Chart 1.1).
• In 2002, 44.7% of students followed a monthly budget compared to 27.9% in 2000.
Chart 1.1: Do you follow a monthly budget?
44.7
72.0
55.3
27.9
0
10
20
30
40
50
60
70
80
2000 2002
perc
enta
ge
yesno
(2000: n=418; 2002: n=611)
Spending Habits – 2002
Student Affairs Assessment 7
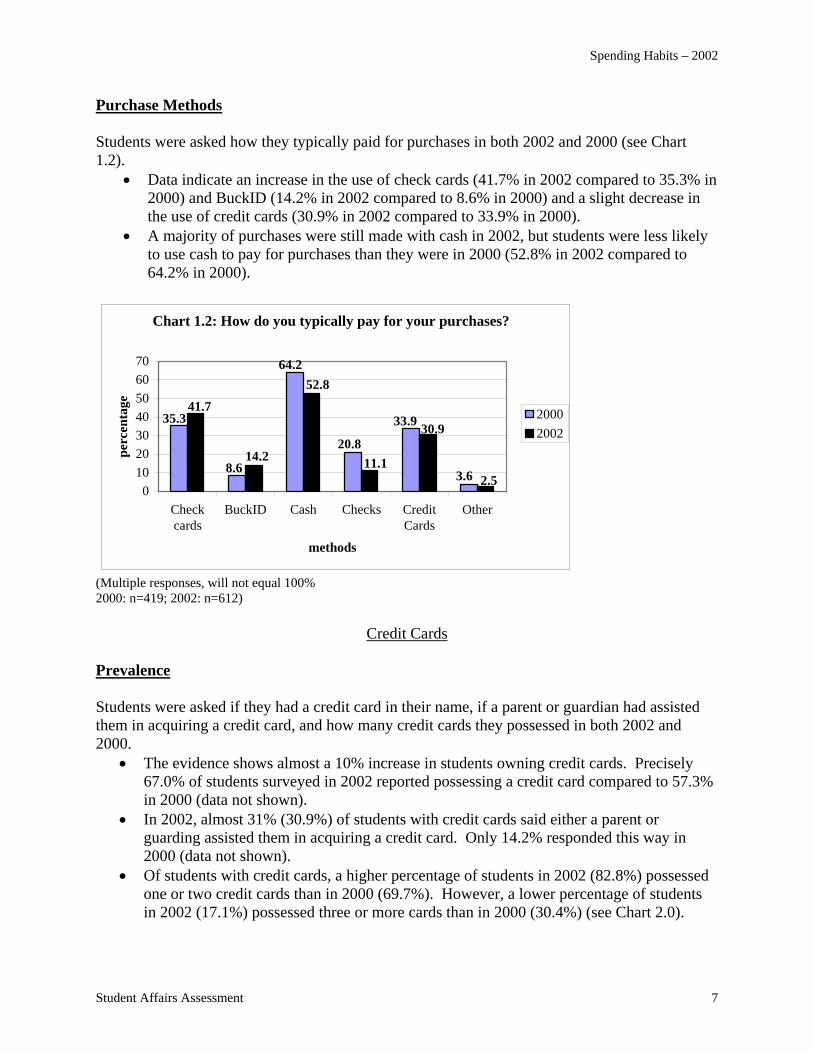
Purchase Methods Students were asked how they typically paid for purchases in both 2002 and 2000 (see Chart 1.2).
• Data indicate an increase in the use of check cards (41.7% in 2002 compared to 35.3% in 2000) and BuckID (14.2% in 2002 compared to 8.6% in 2000) and a slight decrease in the use of credit cards (30.9% in 2002 compared to 33.9% in 2000).
• A majority of purchases were still made with cash in 2002, but students were less likely to use cash to pay for purchases than they were in 2000 (52.8% in 2002 compared to 64.2% in 2000).
Chart 1.2: How do you typically pay for your purchases?
3.6
33.9
20.8
64.2
8.6
35.3
2.5
30.9
11.1
52.8
14.2
41.7
010203040506070
Checkcards
BuckID Cash Checks CreditCards
Other
methods
perc
enta
ge
20002002
(Multiple responses, will not equal 100% 2000: n=419; 2002: n=612)
Credit Cards Prevalence Students were asked if they had a credit card in their name, if a parent or guardian had assisted them in acquiring a credit card, and how many credit cards they possessed in both 2002 and 2000.
• The evidence shows almost a 10% increase in students owning credit cards. Precisely 67.0% of students surveyed in 2002 reported possessing a credit card compared to 57.3% in 2000 (data not shown).
• In 2002, almost 31% (30.9%) of students with credit cards said either a parent or guarding assisted them in acquiring a credit card. Only 14.2% responded this way in 2000 (data not shown).
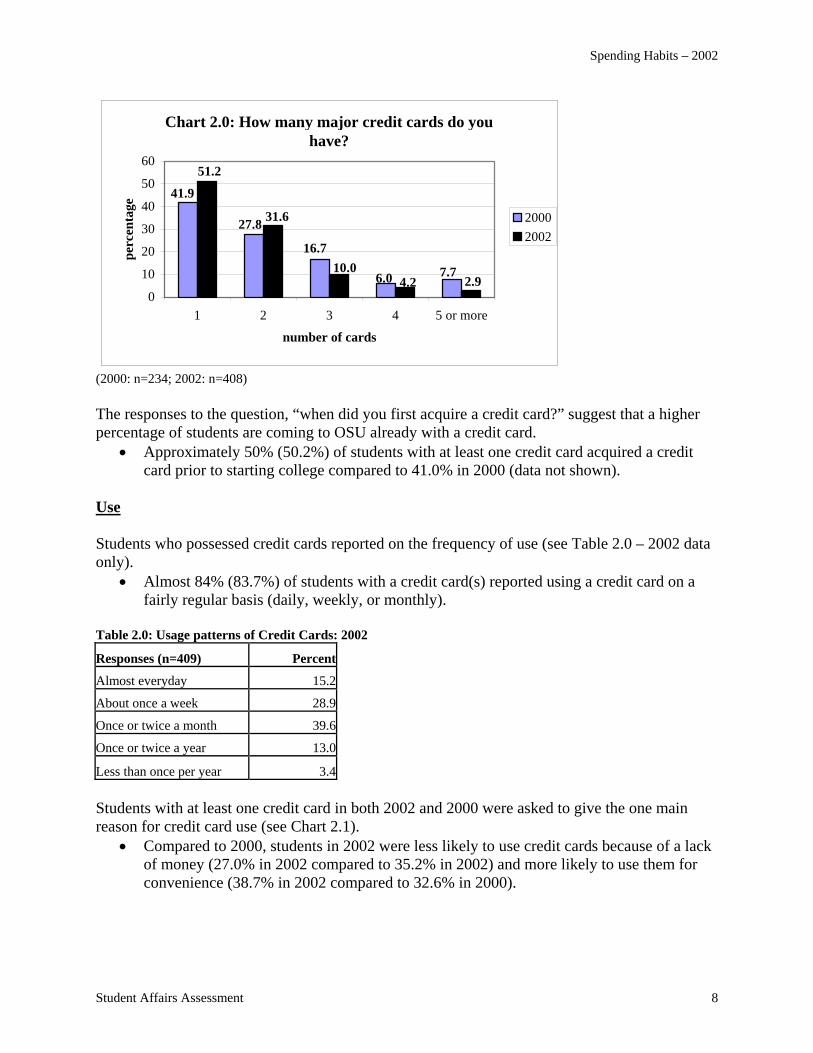
• Of students with credit cards, a higher percentage of students in 2002 (82.8%) possessed one or two credit cards than in 2000 (69.7%). However, a lower percentage of students in 2002 (17.1%) possessed three or more cards than in 2000 (30.4%) (see Chart 2.0).
Spending Habits – 2002
Student Affairs Assessment 8
Chart 2.0: How many major credit cards do you have?
7.76.0
16.7
27.8
41.9
2.94.210.0
31.6
51.2
0
10
20
30
40
50
60
1 2 3 4 5 or more
number of cards
perc
enta
ge
20002002
(2000: n=234; 2002: n=408) The responses to the question, “when did you first acquire a credit card?” suggest that a higher percentage of students are coming to OSU already with a credit card.
• Approximately 50% (50.2%) of students with at least one credit card acquired a credit card prior to starting college compared to 41.0% in 2000 (data not shown).
Use Students who possessed credit cards reported on the frequency of use (see Table 2.0 – 2002 data only).
• Almost 84% (83.7%) of students with a credit card(s) reported using a credit card on a fairly regular basis (daily, weekly, or monthly).
Table 2.0: Usage patterns of Credit Cards: 2002
Responses (n=409) Percent
Almost everyday 15.2
About once a week 28.9
Once or twice a month 39.6
Once or twice a year 13.0
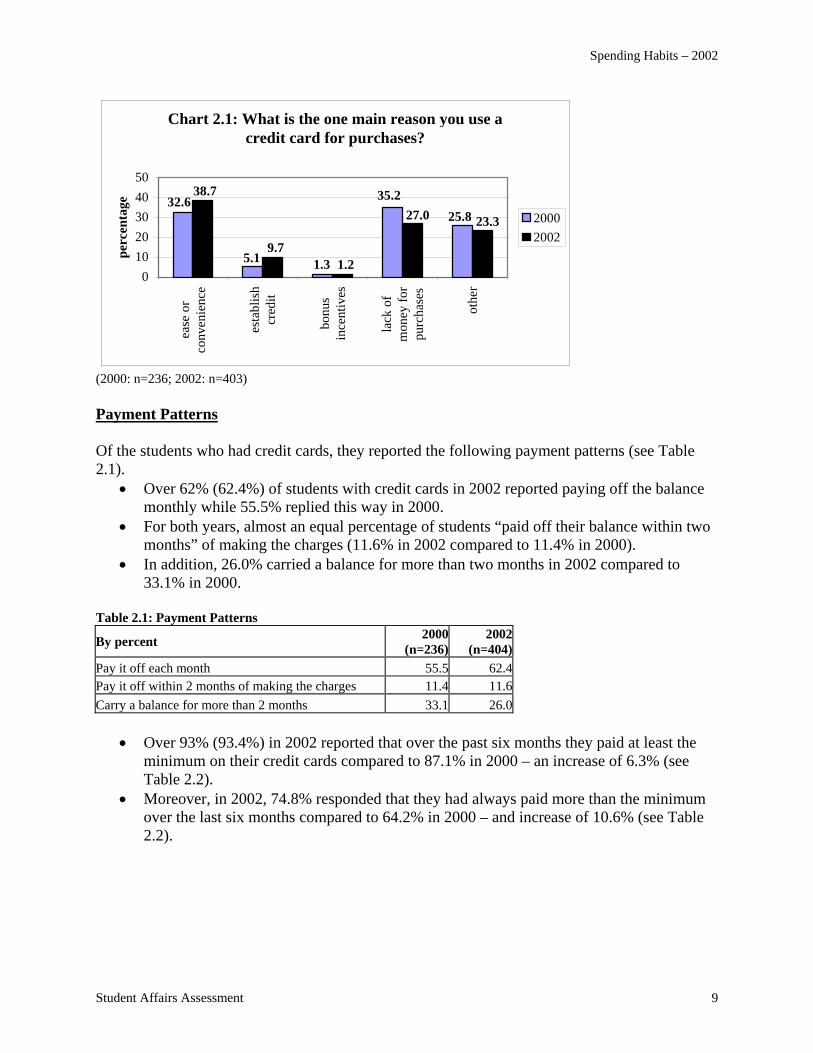
Less than once per year 3.4 Students with at least one credit card in both 2002 and 2000 were asked to give the one main reason for credit card use (see Chart 2.1).
• Compared to 2000, students in 2002 were less likely to use credit cards because of a lack of money (27.0% in 2002 compared to 35.2% in 2002) and more likely to use them for convenience (38.7% in 2002 compared to 32.6% in 2000).
Spending Habits – 2002
Student Affairs Assessment 9
Chart 2.1: What is the one main reason you use a credit card for purchases?
25.835.2
1.35.1
32.623.327.0
1.29.7
38.7
01020304050
ease
or
conv
enie
nce
esta
blis
hcr
edit
bonu
sin
cent
ives
lack
of
mon
ey fo
rpu
rcha
ses
othe
r
perc
enta
ge
20002002
(2000: n=236; 2002: n=403) Payment Patterns Of the students who had credit cards, they reported the following payment patterns (see Table 2.1).
• Over 62% (62.4%) of students with credit cards in 2002 reported paying off the balance monthly while 55.5% replied this way in 2000.
• For both years, almost an equal percentage of students “paid off their balance within two months” of making the charges (11.6% in 2002 compared to 11.4% in 2000).
• In addition, 26.0% carried a balance for more than two months in 2002 compared to 33.1% in 2000.
Table 2.1: Payment Patterns
By percent 2000 (n=236)
2002 (n=404)
Pay it off each month 55.5 62.4Pay it off within 2 months of making the charges 11.4 11.6Carry a balance for more than 2 months 33.1 26.0
• Over 93% (93.4%) in 2002 reported that over the past six months they paid at least the minimum on their credit cards compared to 87.1% in 2000 – an increase of 6.3% (see Table 2.2).
• Moreover, in 2002, 74.8% responded that they had always paid more than the minimum over the last six months compared to 64.2% in 2000 – and increase of 10.6% (see Table 2.2).
Spending Habits – 2002
Student Affairs Assessment 10
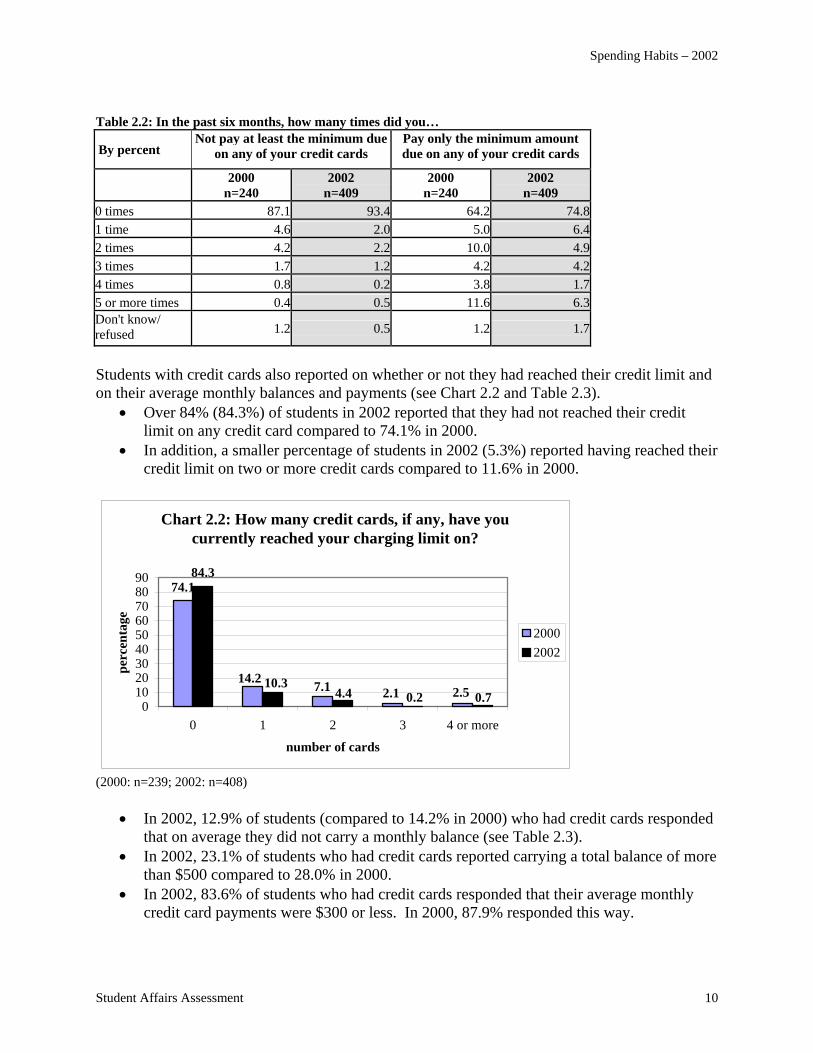
Table 2.2: In the past six months, how many times did you…
By percent Not pay at least the minimum due
on any of your credit cards Pay only the minimum amount due on any of your credit cards
2000
n=240 2002
n=409 2000
n=240 2002
n=409 0 times 87.1 93.4 64.2 74.8 1 time 4.6 2.0 5.0 6.4 2 times 4.2 2.2 10.0 4.9 3 times 1.7 1.2 4.2 4.2 4 times 0.8 0.2 3.8 1.7 5 or more times 0.4 0.5 11.6 6.3 Don't know/ refused 1.2 0.5 1.2 1.7
Students with credit cards also reported on whether or not they had reached their credit limit and on their average monthly balances and payments (see Chart 2.2 and Table 2.3).
• Over 84% (84.3%) of students in 2002 reported that they had not reached their credit limit on any credit card compared to 74.1% in 2000.
• In addition, a smaller percentage of students in 2002 (5.3%) reported having reached their credit limit on two or more credit cards compared to 11.6% in 2000.
Chart 2.2: How many credit cards, if any, have you currently reached your charging limit on?
74.184.3
2.52.17.114.20.70.24.4
10.3
0102030405060708090
0 1 2 3 4 or more
number of cards
perc
enta
ge
20002002
(2000: n=239; 2002: n=408)
• In 2002, 12.9% of students (compared to 14.2% in 2000) who had credit cards responded that on average they did not carry a monthly balance (see Table 2.3).
• In 2002, 23.1% of students who had credit cards reported carrying a total balance of more than $500 compared to 28.0% in 2000.
• In 2002, 83.6% of students who had credit cards responded that their average monthly credit card payments were $300 or less. In 2000, 87.9% responded this way.
Spending Habits – 2002
Student Affairs Assessment 11
Table 2.3: Average Total Monthly Balance and Amount Paid Monthly
By percent Average Monthly Balance Carried
On Credit Cards Average Amount Paid Monthly
On Credit Cards
2000
(n=225) 2002
(n=373) 2000
(n=229) 2002
(n=366) 0 14.2 12.9 6.6 6.3 $100 or less 24.4 24.4 50.7 47.5 $101-$300 22.2 25.7 30.6 29.8 $301-$500 11.1 13.9 7.9 9.3 $501-$1000 13.3 11.0 3.1 4.6 $1001-$1500 2.7 3.5 0.9 1.4 $1501-$2000 4.4 1.9 0.4 0.5 Over $2000 7.6 6.7 0.0 0.5 Although a larger percentage of students in 2002 were carrying a balance on their credit card(s), students seemed to be managing their debt with greater responsibility.
• Approximately 56% (56.3%) of all students in 2002 (compared to 47.6% in 2000) carried a credit card balance (data not shown).
• Of students with a credit card, the average monthly balance was $592 with an average monthly payment of $211. This is an improvement from 2000 when the average monthly balance was $659 and the average monthly payment was $166 (data not shown).
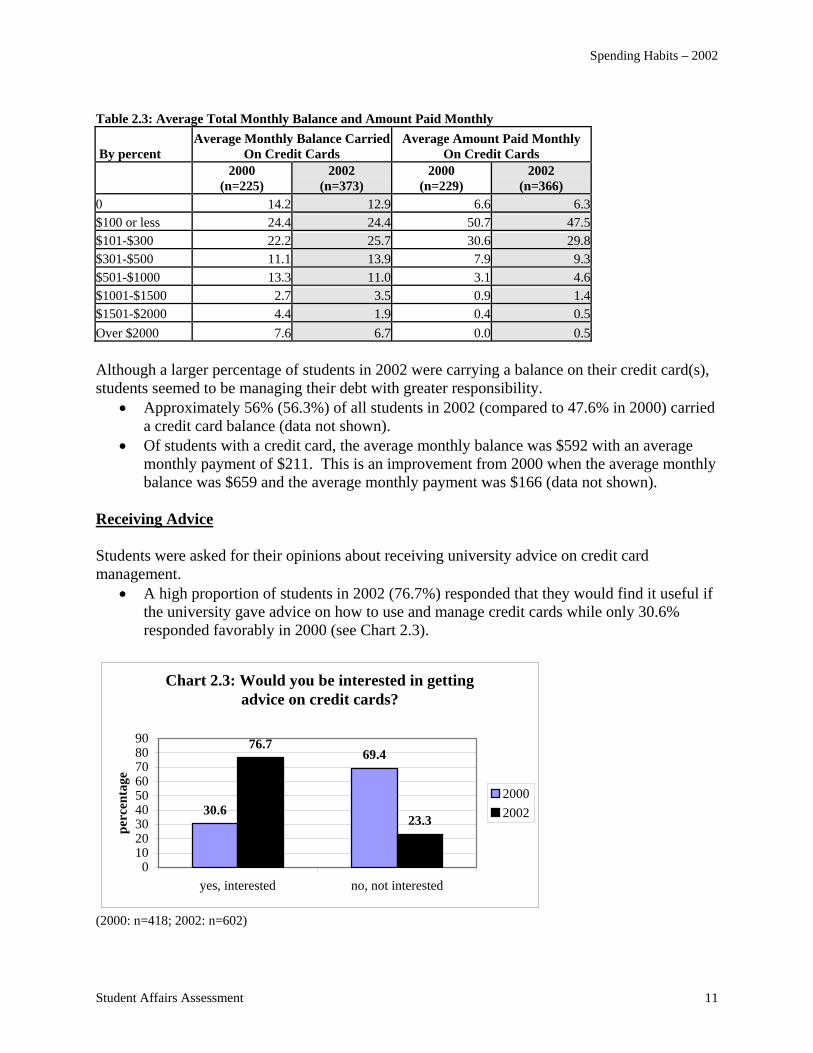
Receiving Advice Students were asked for their opinions about receiving university advice on credit card management.
• A high proportion of students in 2002 (76.7%) responded that they would find it useful if the university gave advice on how to use and manage credit cards while only 30.6% responded favorably in 2000 (see Chart 2.3).
Chart 2.3: Would you be interested in getting advice on credit cards?
30.6
69.476.7
23.3
0102030405060708090
yes, interested no, not interested
perc
enta
ge
20002002
(2000: n=418; 2002: n=602)
Spending Habits – 2002
Student Affairs Assessment 12
Vendors on Campus Another issue related to credit card use among college students is the presence of credit card vendors on campus (the university is changing its policy beginning 2002-2003 to a one-vendor contract allowing only limited access to campus). As such, students were asked about how frequently they have applied for or received credit cards from vendors, their impressions of the vendors on campus, and their reasons for applying for a credit card on campus (all percentages are from 2002 data).
• Approximately 23% (23.4%) of students surveyed applied for or received a credit card from a vendor on campus (data not shown).
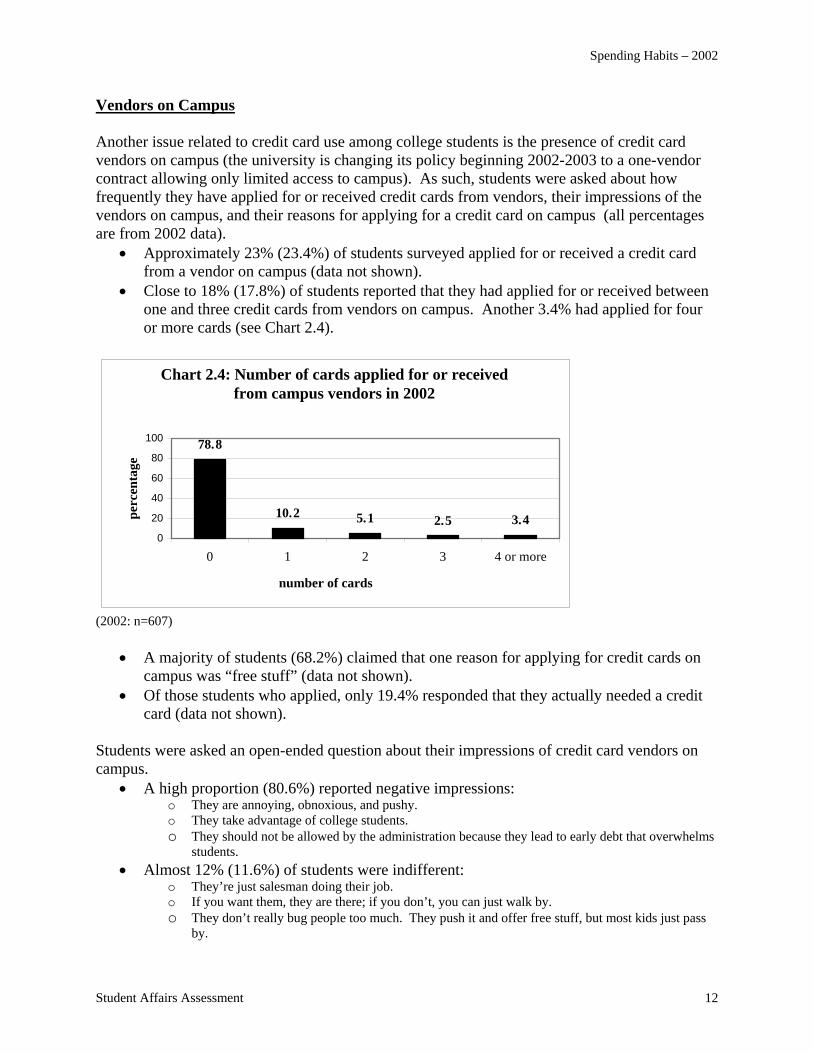
• Close to 18% (17.8%) of students reported that they had applied for or received between one and three credit cards from vendors on campus. Another 3.4% had applied for four or more cards (see Chart 2.4).
Chart 2.4: Number of cards applied for or received from campus vendors in 2002
78.8
10.2 5.1 2.5 3.40
20
40
60
80
100
0 1 2 3 4 or more
number of cards
perc
enta
ge
(2002: n=607)
• A majority of students (68.2%) claimed that one reason for applying for credit cards on campus was “free stuff” (data not shown).
• Of those students who applied, only 19.4% responded that they actually needed a credit card (data not shown).
Students were asked an open-ended question about their impressions of credit card vendors on campus.
• A high proportion (80.6%) reported negative impressions: o They are annoying, obnoxious, and pushy. o They take advantage of college students. o They should not be allowed by the administration because they lead to early debt that overwhelms
students. • Almost 12% (11.6%) of students were indifferent:
o They’re just salesman doing their job. o If you want them, they are there; if you don’t, you can just walk by. o They don’t really bug people too much. They push it and offer free stuff, but most kids just pass
by.
Spending Habits – 2002
Student Affairs Assessment 13
• Almost 8% (7.8%) of students responded with favorable impressions: o They’re good, but it depends on the person. o It’s a good thing to offer. o I have no problem with them. They have good options.
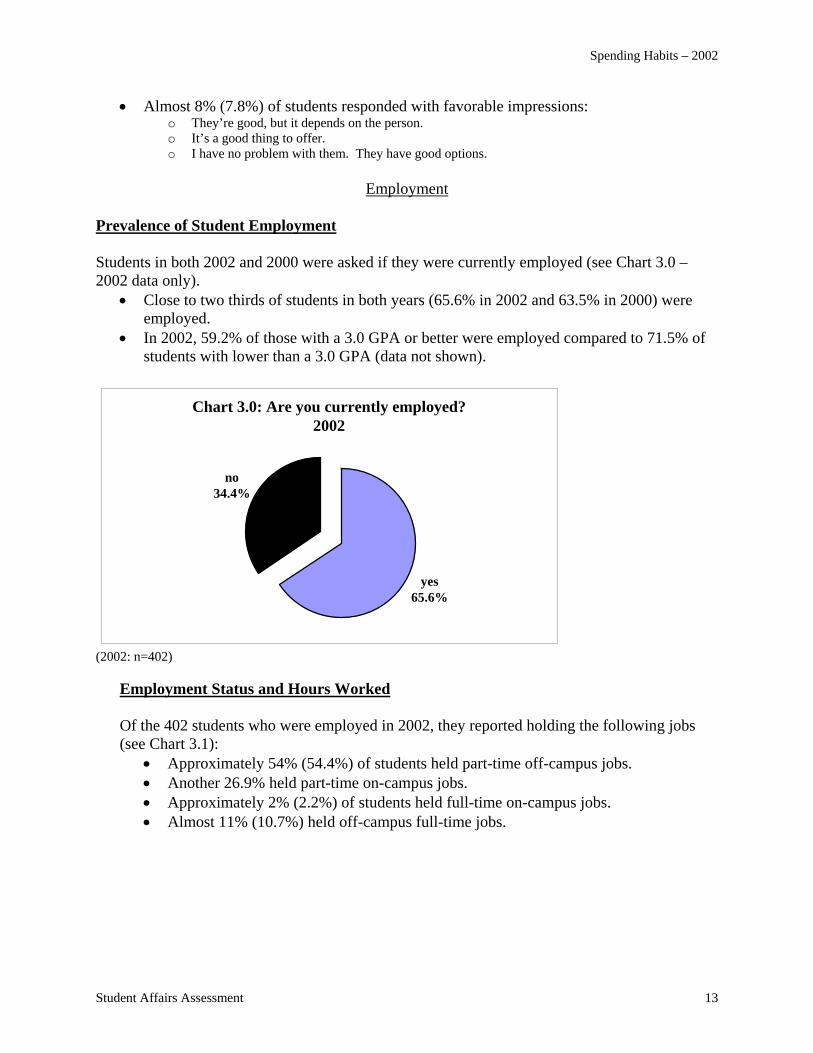
Employment Prevalence of Student Employment Students in both 2002 and 2000 were asked if they were currently employed (see Chart 3.0 – 2002 data only).
• Close to two thirds of students in both years (65.6% in 2002 and 63.5% in 2000) were employed.
• In 2002, 59.2% of those with a 3.0 GPA or better were employed compared to 71.5% of students with lower than a 3.0 GPA (data not shown).
Chart 3.0: Are you currently employed?2002
no34.4%
yes65.6%
(2002: n=402)
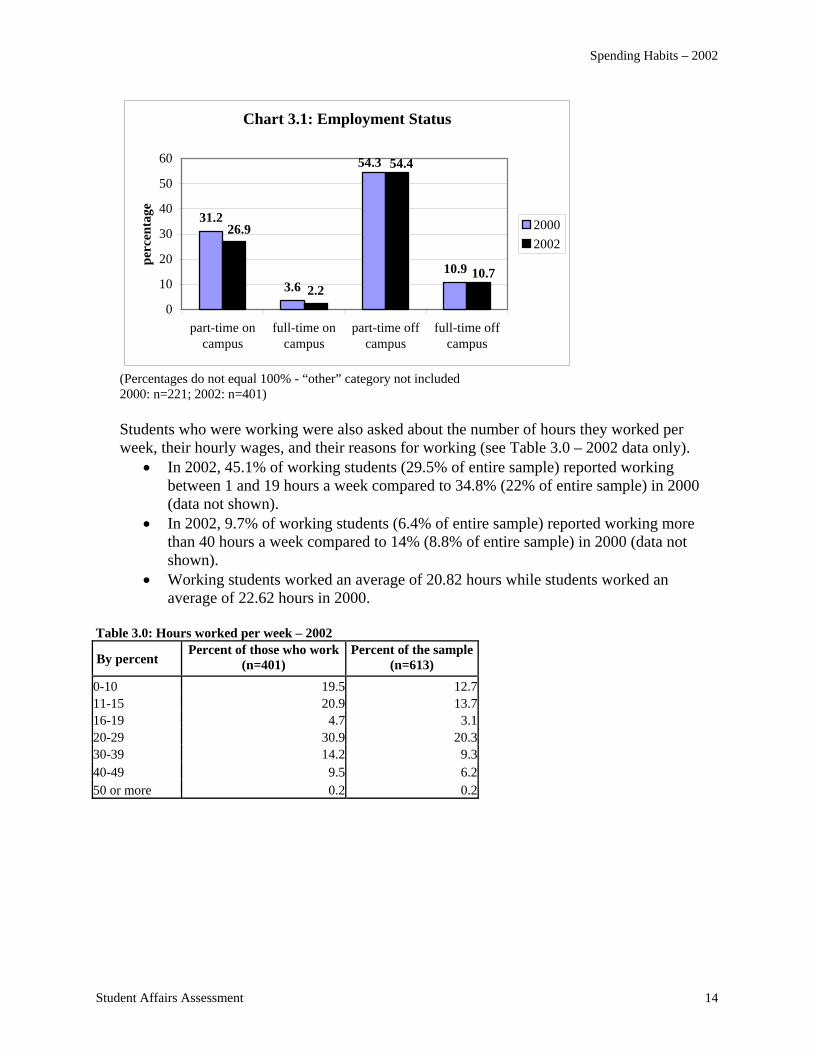
Employment Status and Hours Worked Of the 402 students who were employed in 2002, they reported holding the following jobs (see Chart 3.1):
• Approximately 54% (54.4%) of students held part-time off-campus jobs. • Another 26.9% held part-time on-campus jobs. • Approximately 2% (2.2%) of students held full-time on-campus jobs. • Almost 11% (10.7%) held off-campus full-time jobs.
Spending Habits – 2002
Student Affairs Assessment 14
Chart 3.1: Employment Status
31.2
3.610.9
2.2
54.3
10.7
26.9
54.4
0
10
20
30
40
50
60
part-time oncampus
full-time oncampus
part-time offcampus
full-time offcampus
perc
enta
ge
20002002
(Percentages do not equal 100% - “other” category not included 2000: n=221; 2002: n=401) Students who were working were also asked about the number of hours they worked per week, their hourly wages, and their reasons for working (see Table 3.0 – 2002 data only).
• In 2002, 45.1% of working students (29.5% of entire sample) reported working between 1 and 19 hours a week compared to 34.8% (22% of entire sample) in 2000 (data not shown).
• In 2002, 9.7% of working students (6.4% of entire sample) reported working more than 40 hours a week compared to 14% (8.8% of entire sample) in 2000 (data not shown).
• Working students worked an average of 20.82 hours while students worked an average of 22.62 hours in 2000.
Table 3.0: Hours worked per week – 2002
By percent Percent of those who work
(n=401) Percent of the sample
(n=613) 0-10 19.5 12.711-15 20.9 13.716-19 4.7 3.120-29 30.9 20.330-39 14.2 9.340-49 9.5 6.250 or more 0.2 0.2
Spending Habits – 2002
Student Affairs Assessment 15
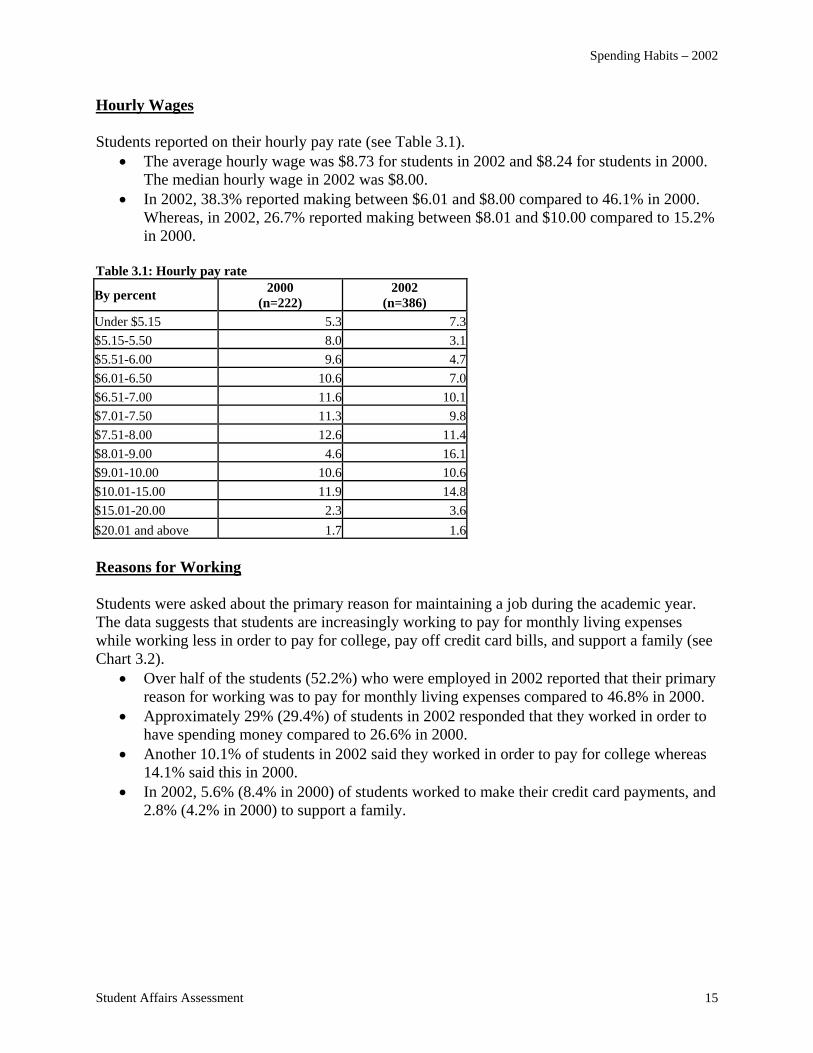
Hourly Wages Students reported on their hourly pay rate (see Table 3.1).
• The average hourly wage was $8.73 for students in 2002 and $8.24 for students in 2000. The median hourly wage in 2002 was $8.00.
• In 2002, 38.3% reported making between $6.01 and $8.00 compared to 46.1% in 2000. Whereas, in 2002, 26.7% reported making between $8.01 and $10.00 compared to 15.2% in 2000.
Table 3.1: Hourly pay rate
By percent 2000 (n=222)
2002 (n=386)
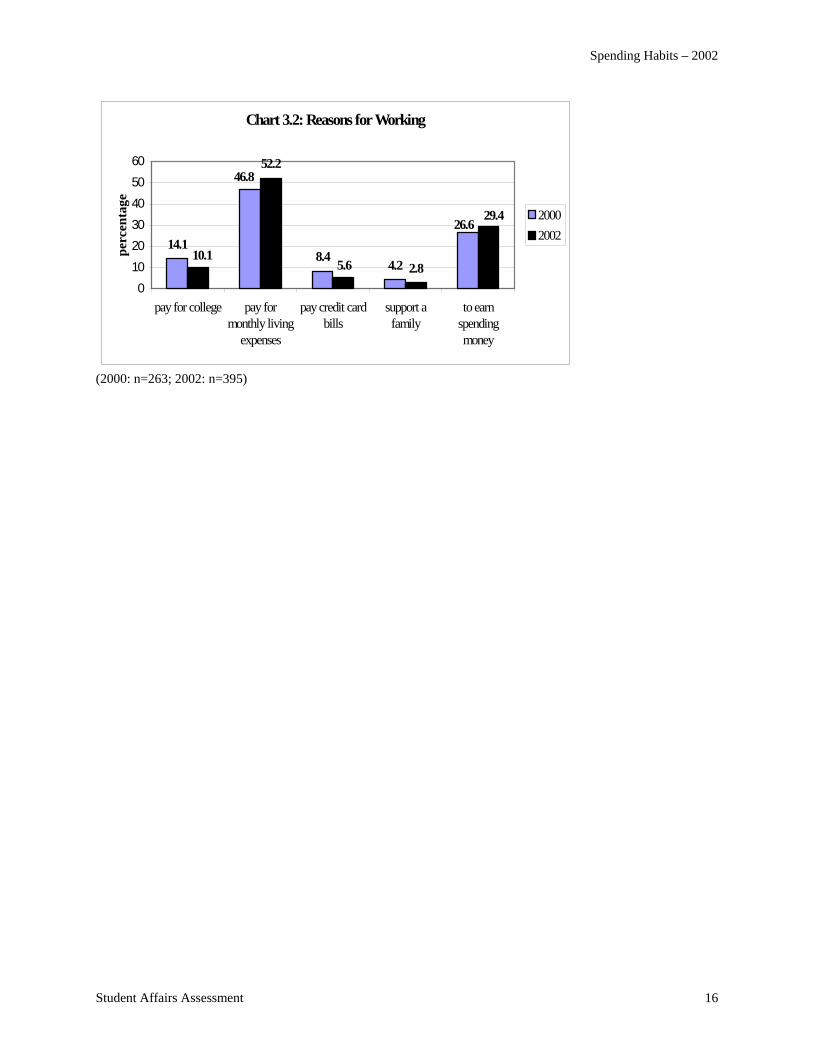
Under $5.15 5.3 7.3$5.15-5.50 8.0 3.1$5.51-6.00 9.6 4.7$6.01-6.50 10.6 7.0$6.51-7.00 11.6 10.1$7.01-7.50 11.3 9.8$7.51-8.00 12.6 11.4$8.01-9.00 4.6 16.1$9.01-10.00 10.6 10.6$10.01-15.00 11.9 14.8$15.01-20.00 2.3 3.6$20.01 and above 1.7 1.6 Reasons for Working Students were asked about the primary reason for maintaining a job during the academic year. The data suggests that students are increasingly working to pay for monthly living expenses while working less in order to pay for college, pay off credit card bills, and support a family (see Chart 3.2).
• Over half of the students (52.2%) who were employed in 2002 reported that their primary reason for working was to pay for monthly living expenses compared to 46.8% in 2000.
• Approximately 29% (29.4%) of students in 2002 responded that they worked in order to have spending money compared to 26.6% in 2000.
• Another 10.1% of students in 2002 said they worked in order to pay for college whereas 14.1% said this in 2000.
• In 2002, 5.6% (8.4% in 2000) of students worked to make their credit card payments, and 2.8% (4.2% in 2000) to support a family.
Spending Habits – 2002
Student Affairs Assessment 16
Chart 3.2: Reasons for Working
14.18.4
4.2
52.2
2.8
46.8
26.629.4
10.15.6
0102030405060
pay for college pay formonthly living
expenses
pay credit cardbills
support afamily
to earnspendingmoney
perc
enta
ge
20002002
(2000: n=263; 2002: n=395)
Spending Habits – 2002
Student Affairs Assessment 17
APPENDIX
Demographic Comparisons
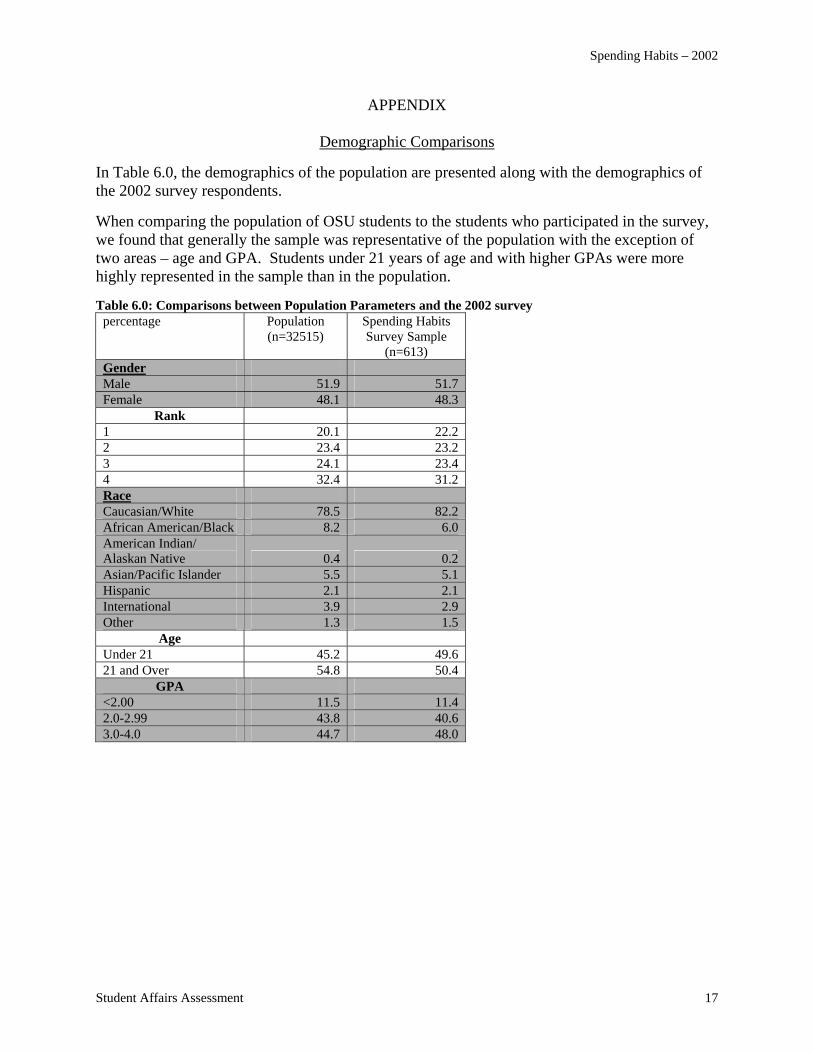
In Table 6.0, the demographics of the population are presented along with the demographics of the 2002 survey respondents. When comparing the population of OSU students to the students who participated in the survey, we found that generally the sample was representative of the population with the exception of two areas – age and GPA. Students under 21 years of age and with higher GPAs were more highly represented in the sample than in the population. Table 6.0: Comparisons between Population Parameters and the 2002 survey
percentage Population (n=32515)
Spending Habits Survey Sample
(n=613) Gender Male 51.9 51.7 Female 48.1 48.3
Rank 1 20.1 22.2 2 23.4 23.2 3 24.1 23.4 4 32.4 31.2 Race Caucasian/White 78.5 82.2 African American/Black 8.2 6.0 American Indian/ Alaskan Native 0.4 0.2 Asian/Pacific Islander 5.5 5.1 Hispanic 2.1 2.1 International 3.9 2.9 Other 1.3 1.5
Age Under 21 45.2 49.6 21 and Over 54.8 50.4
GPA <2.00 11.5 11.4 2.0-2.99 43.8 40.6 3.0-4.0 44.7 48.0
Spending Habits – 2002
Student Affairs Assessment 18
REFERENCES
Astin, A. W. (1993). What matters in college: Four critical years revisited. San Francisco: Jossey-Bass.
Burd, S. (2001, April 6). Students don’t realize the extent of their debt, report warns. The
Chronicle of Higher Education [Electronic version]. Retrieved November 22, 2002, from http://chronicle.com/weekly/v47/i30/30a03402.htm
D’Agostino, D. M. (2001). Consumer finance: College students and credit cards. Washington,
DC: General Accounting Office. Kellogg, A. P. (2002, March 8). New report on student-loan data finds debt loads burdensome
for many graduates. The Chronicle of Higher Education [Electronic version]. Retrieved November 22, 2002, from http://chronicle.com/daily/2002/03/2002030804n.htm.
King, J. E. (1998, May 1). Too many students are holding jobs for too many hours. The
Chronicle of Higher Education, A72. Murphy, M. C., & Archer, J. (1996). Stressors on the college campus: A comparison of 1985 and
1993. Journal of College Student Development, 1, 20-27. Pinto, M. B., Parente, D. H., & Palmer, T. S. (2001). College student performance and credit
card usage. Journal of College Student Development, 42(1), 49-58. Undergraduate students and credit cards: An analysis of usage rates and trends. Nellie Mae.
Retrieved November 22, 2002, from http://www.nelliemae.com/library/ccstudy_2001.pdf