Embed Size (px)
Citation preview

Astron. Astrophys. 329, 115–130 (1998) ASTRONOMYAND
ASTROPHYSICS
Spectroscopic and spectrophotometric studies of V2301 Oph
I. The high accretion state?
Damir Simic, Heinz Barwig, Andreas Bobinger, Karl-Heinz Mantel, and Sebastian Wolf
Universitats-Sternwarte, Scheinerstr. 1, D-81679 Munchen, Germany
Received 14 April 1997 / Accepted 8 August 1997
Abstract. An approach is made to clarify the two different clas-sifications of V2301 Oph (formerly: 1H1752+081) as a lowfield intermediate polar or an AM Her candidate, by analysingphase-resolved spectroscopy and simultaneously recorded high-speed-spectrophotometry. By combining both data sets we ob-tained for the first time photometric data of V2301 Oph withhigh spectral (1.3A) resolution during an enhanced accretionstate. The trailed spectrograms show in unprecedented clear-ness the well-known complex emission line profiles which arecharacterized by a broad and a narrow component shifted inphase by ∆ϕ ≈ 0.25. By means of Doppler tomography theorigin of the narrow component can be located on the irradiatedface of the secondary star, whereas the broad component can betraced back to the coupling region where the accreting materialis connected to the field lines.
It was also possible to analyse separately the eclipse be-haviour of the emission lines and of the respective continua.The decomposed continuum light curves clearly reveal that thepre-eclipse hump cannot be explained with a hot spot on an ac-cretion disk. It can be rather assigned to cyclotron radiation froma shock-region on the white dwarf. Furthermore, it is shownfrom the eclipse features, that the acccretion stream is distorteddue to a weak magnetic field. An investigation of the super-imposed flickering did not reveal any short-periodic variation,which would be an evidence for a non-synchronously rotatingprimary star. Therefore, we can classify V2301 Oph as an AMHer system, where the dipole axis of the white dwarf is inclinedto its rotational axis.
Key words: stars: individual: V2301 Oph – cataclysmic vari-ables – eclipsing binaries – stars: magnetic fields
1. Introduction
The X-ray source V2301 Oph (formerly: 1H1752+081) discov-ered during the HEAO-1 Modulation Collimator survey turned
Send offprint requests to: D. Simic(e-mail: [email protected])? Based on observations obtained at the German-Spanish Astronom-ical Center, Calar Alto, Spain.
out to be an eclipsing cataclysmic variable (CV) with an orbitalperiod of 1.88 h (Silber et al. 1994).
Different approaches were made to analyse and classify thisunique binary system. Silber (1992) performed optical spec-troscopy and CCD-photometry of V2301 Oph in a high ac-cretion state, concluding that this CV may be a DQ Her typebinary with a small accretion disc. Barwig et al. (1994) inde-pendently obtained spectroscopic and photometric data in 1992and suggested that this system is an AM Her type eclipsing bi-nary without an accretion disc. Ferrario et al. (1995) undertookspectropolarimetric observations of V2301 Oph in a low accre-tion state and found out that the white dwarf has a magneticfield structure that deviates from that of a centered dipole witha measured mean photospheric field of about 7 MG. Therefore,they argued this binary system being probably a low-field AMHer variable. According to Antipin & Shugarov (1995) this CVexhibits regular light variations with a 148.3 d period. The au-thors concluded that these long-term light variations (up to 1m)might be due to large-scale changes in the accretion rate on thewhite dwarf which switches between high and low accretionstates.
AM Herculis systems are close binary systems containinga late type secondary star and a strong magnetic white dwarfprimary star. Material escapes from the Roche lobe filling sec-ondary star and accretes along the magnetic field lines onto theprimary star, without forming an accretion disc. This happens,because the white dwarf, due to its strong magnetic field, islocked into synchronous rotation with the orbital period. De-pending on the dipole inclination, accretion can occur onto oneor two regions which are located on opposite hemispheres ofthe white dwarf (Ferrario et al. 1989). Intermediate polars (highand low field IPs) show a different behaviour, because their mag-netic field is considerably weaker than those of AM Hers. Asa result, the white dwarf is not synchronously rotating with theorbital period. Still, material can accrete onto the white dwarf(high field IPs) without creating an accretion disc.
The magnetically funnelled material streams onto the polewhich is inclinated towards the incoming stream, so that eachmagnetic pole accretes material for half a beat-cycle, causinga pole-switching type modulation (Ferrario et al. 1993). Low
116 D. Simic et al.: Spectroscopic and spectrophotometric studies of V2301 Oph. I
field intermediate polars can form a partial accretion disc, wheremost of the energy of the incoming accretion stream is spread byviscous forces in the disc. Assuming again an oblique magneticdipole of the white dwarf, accretion processes can only happenonto one of the two foot points of a field line which connectsthe coupling region to the primary star. Therefore, two accretioncurtains are formed, one below and one above the orbital planeextended by 1800 in longitude, where material is accreted alongthe field lines (Ferrario & Wickramasinghe 1993).
This paper intends to examine the two different classifica-tions (AM Her versus IPs) by analysing simultaneously takenspectroscopic and spectrophotometric data sets when the systemwas in a high accretion state. The different on/off conditions ofthe accretion process enable us either to study the properties ofthe gas-stream and the reprocessing effects involved (this paper)or to study the primary and secondary star, because the streamemission lines are considerably weaker, so that absorption linesfrom the secondary can be detected and examined (Paper II,Barwig, in preparation).
In Sect. 2 we refer on the spectroscopic and spectrophoto-metric observations of V2301 Oph and the data reduction proce-dures used. Sect. 3 deals with the results and analysis of the datasets. In Sect. 4 we present a discussion and our conclusions.
2. Data acquisition and reduction
A special approach to investigate V2301 Oph was made duringthe observing campaign in August 1994. We performed simulta-neous spectroscopy and spectrophotometry, respectively at the3.5m and 2.2m telescopes at the German-Spanish AstronomicalCenter, Calar Alto, Spain.
2.1. Spectroscopy
V2301 Oph was observed on August 06-09, 1994 with theCassegrain double beam spectrograph (TWIN) attached to the3.5m telescope. The blue and the red spectral channels wereequipped with low-noise CCDs (TEK#11 and TEK#12) witha pixel size of 24µm and a CCD size of 1024x1024 pixel.Using a slit-width of 1.′′5 and a spectral resolution of 1.3A ,we chose the spectral range of 4080. . . 5430A in the blue and6500. . . 8400A in the red. The object was trailed along the slit,in order to obtain phase-resolved, high resolution spectra. Expo-sure times ranged between 300. . . 1800s and the mean trail ve-locity amounted to 1pixel/22s. The trailed spectra were binnedin direction of the slit by a factor of 2. Flatfield measurementswere taken at the beginning and end of each night, as well asHelium-Argon wavelength calibration spectra which were takenapproximately every hour during the night. Further informationabout the observation is given in Table 1. The data reductionincluded bias-subtraction, flatfield-correction, sky-subtraction,cosmic-ray elimination and wavelength-calibration as describedin e.g. Horne (1986). After that the continuum of the spectro-scopic data set was calibrated with our simultaneously obtainedspectrophotometric data. By applying this method we were ableto correct for intensity variations of the emission lines which
might have been caused by poor weather conditions (e.g clouds)or observational difficulties (e.g. variable vignetting of the see-ing disc by the slit). This new method which allows a relativelyprecise determination of the emission line flux is described inthe next section.
In a last step the trailed spectra were phase-folded into 100phase bins using an update of the eclipse-ephemeris of V2301Oph given by Barwig et al. (1994) :HJD 2448071.02014 (±7) + 0.078450008 (±10)× E
2.2. Spectrophotometry
Simultaneously with the spectroscopic measurements, we ob-tained high-speed (time resolution : 1s) spectrophotometric datawith MEKASPEK attached to the 2.2m telescope at the CalarAlto Observatory. This 4 channel fiber-optic spectrophotometerwas developed at the Universitats-Sternwarte Munchen and hasthe following properties :
Simultaneous measurements of object, two comparison starsand sky background within the spectral range of 3700. . . 9000Aat a spectral resolution of λ / ∆λ ≈ 50. The photon-countingtwo-dimensional detector (MEPSICRON) has a time resolutionof up to 20ms with no deadtime during readout.
Furthermore, MEKASPEK performs a correct treatment ofatmospheric extinction effects and allows an accurate colourtransformation to any broadband photometric system. A spe-cially developed online-graphics-system allows to examine inrealtime the observed spectra and light curves of object, com-parison stars and sky background in selected spectral regions.For more details see Mantel et al. (1993b) and Mantel & Bar-wig (1993). Atmospheric effects are eliminated using the so-called standard reduction (Barwig et al. 1987) which sub-tracts the sky background of each colour channel from objectand comparison star and divides the object by the comparisonstar measurements afterwards, therefore enabling photometricmeasurements even under non-photometric conditions.
A new method for calibrating the trailed spectra with thespectrophotometric data set resulted from the above mentionedadvantages of multichannel photometry.
Before this procedure could be employed, the continuum ofthe spectra had to be normalized by dividing it with undisturbedcontinuum ranges, where no line features (emission lines or ab-sorption bands) appeared. By interpolating between those areasafterwards, we could normalize the data set in the entire spectralrange.
From our spectrophotometric data set, narrow-band, filter-curves were extracted from the continuum in the same spectralranges that were used to normalize the spectroscopic data.
The following multiplication with the reduced narrow-banddata allows a calibration of the spectra.
Our continuum filter-curves can be used, after multiplica-tion, in the same way for interpolation between the designatedareas in order to calibrate the entire spectral range.
Due to the properties of MEKASPEK, it is also possibleto investigate separately the Balmer emission lines and the re-spective continua. However, because of the short integration

D. Simic et al.: Spectroscopic and spectrophotometric studies of V2301 Oph. I 117
Table 1. Journal of spectroscopic observations. B = blue spectral re-gion, R = red spectral region, UT=universal time, IT=integration time
Date Spectra Phase range Start (UT) IT (s)06/07.08.1994 B R 0.21-0.48 21h20m40s 1800
B R 0.53-0.72 21h56m49s 1300B R 0.78-0.88 22h25m03s 600B R 0.92-0.18 22h40m25s 1800B R 0.23-0.49 23h15m52s 1800
07/08.08.1994 B R 0.93-0.04 21h17m10s 760B R 0.50-0.61 22h21m34s 785B R 0.47-0.64 00h11m50s 1200B R 0.70-0.79 00h36m51s 635B R 0.86-0.90 00h55m12s 300B R 0.94-0.04 01h04m18s 720
08/09.08.1994 B R 0.49-0.67 20h56m30s 1200B 0.74-0.85 21h24m54s 721
B R 0.20-0.37 22h16m29s 1200B R 0.41-0.60 22h40m52s 1200B R 0.64-0.83 23h05m53s 1300B R 0.89-0.10 23h33m55s 1500
Table 2. Journal of spectrophotometric observations. UT=universaltime, IT=integration time
Date Start (UT) Stop (UT) IT (s)04/05.08.1994 20h54m04s 23h10m44s 106/07.08.1994 20h40m41s 23h39m49s 107/08.08.1994 20h23m58s 01h23m24s 108/09.08.1994 20h28m43s 00h02m54s 1
time (1s) the single spectra are quite weak. In order to improvethe S/N, the spectra were binned in time by a factor of 20.Instead of dividing by the comparison star, we confined the re-duction to sky-subtraction only. Non-photometric parts of lightcurves were excluded. The emission lines were extracted fromthe spectrophotometric data set by subtracting an interpolatedcontinuum. Therewith, we are enabled to investigate informa-tion that might be included either in the continuum or in theemission lines.
As mentioned before, the spectrophotometric and spectro-scopic data sets were taken simultaneously, except the nightsof 04-05 August 1994, when the MEKASPEK team receivedadditional observing time. Due to instrumental difficulties, nodata could be obtained during the night of 05/06.08.1994. Theobservational details are listed in Table 2.
3. Analysis and results
3.1. The trailed spectra
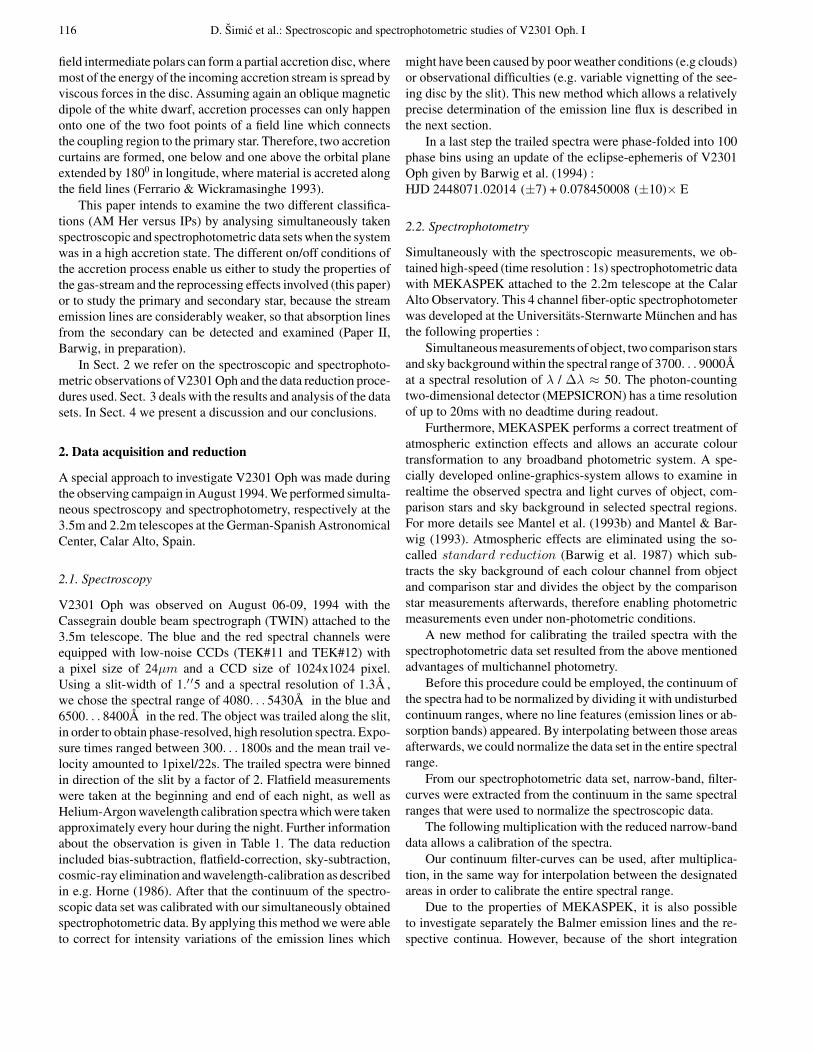
A detailed survey of individual emission lines, that is to say,the stronger lines Hδ , Hγ , Hβ , Hα, HeI (λλ 4471, 6686 , 7065),HeII (λ 4686) are shown in Fig. 1, all with a phase resolutionof 100 phase bins. The dynamical gray-scale range was set in-tentionally, in order to emphasize the individual line features.
The emission lines of HeI ((λλ 4921, 5015) blended withFeI (λλ 4924, 5018)), were excluded from further investigationsdue to the poor S/N.
With the exception of HeII (λ 4686) and HeI (λ 7065) allemission lines exhibit the same general appearance, a broadcomponent (henceforth BC) and a narrow component (hence-forth NC). It is generally assumed that the multiple emissionlines in AM Hers are produced in different parts of the accretionstream (BC) and on the X-ray-heated surface of the secondarystar (NC). Comprehensive discussions about the emission lineorigins can be found in Young & Schneider (1979) or Biermannet al. (1985). Various authors (e.g. Rosen et al. 1987; Schwopeet al. 1996) have presented analysis of AM Her stars with com-plex phase-dependent emission line profiles which confirm thetheoretical assumptions.
The origin of the BC of V2301 Oph can be assigned to theaccretion stream which is free-falling from the inner Lagrangianpoint L1 towards the white dwarf, until it is compressed in thecoupling region, where the accreting material is connected tothe magnetic field lines of the primary star. From there on, thegas stream is funneled along the magnetic field lines, until itimpacts onto the surface of the white dwarf, creating an accre-tion spot or a so-called post-shock region (Mukai, 1988). Theorbital intensity variations of the BC can be explained geomet-rically, assuming an optically thick accretion stream. Betweeenphases ϕ = 0.05 . . . 0.35 the inner, illuminated concave side ofthe gas stream facing the primary star is moving towards maxi-mum approaching velocity (ϕ ≈ 0.46). During the phase-rangesbetweenϕ = 0.4 . . . 0.5 a significant decrease of intensity is ob-served when the BC is probably eclipsed by itself. The eclipseof the emission lines occurring around phase ϕ ≈ 0.0 is total.
In favour of this interpretation is the fact that the lines showno sign of a rotational disturbance and the mean orbital spectrapresented in Fig. 2 show only single peaked emission lines.Both signatures make it rather unlikely that an accretion disc ispresent in V2301 Oph as proposed by Silber et al. (1992).
Another criterion in favour of an AM Her classification is theabsence of any outbursts. Antipin & Shugarov (1995) reportedthe existence of regular light variations with a 148.3 d period,which are due to changes in the accretion rate on the primarystar. The resulting high/low states are characteristic of the long-term variability of AM Hers.
The origin of the NC can be found on the hemisphere of thesecondary star facing the white dwarf. It is due to recombinationprocesses of hydrogen being ionized by X-rays emitted from theaccretion spot on the primary star. Its progression is the sameas that of the BC, but phase-shifted by ∆ϕ ≈ 0.25.
Therefore, the NC represents the orbital motion of the pho-tocenter of the illuminated part of the secondary star. The profileof HeII (λ 4686) is different in not showing a narrow component.However, this behaviour seems to be very sensitive to the amountof the X-ray emission coming from the white dwarf, since spec-tra obtained by Hessman et al. (1995) clearly do show the pres-ence of the NC in the HeII (λ 4686) emission line. We thereforepresume, that HeII (λ 4686) at this accretion state mostly orig-inates in the gas stream.
118 D. Simic et al.: Spectroscopic and spectrophotometric studies of V2301 Oph. I
Fig. 1. Trailed, photometrically calibrated, high-resolution spectra of V2301 Oph derived by phase-averaging the spectra into 100 phase bins.The dynamic range of each gray-scale plot was chosen appropriately to emphasize the individual features of the emission lines, where the phaseruns along the ordinate and the wavelength along the abscissa. Note, that the HeII (λ4686) emission line shows no narrow line component,indicating the origin of this line in the accretion column only. Another peculiarity is present in the HeI (λ7065) emission line, where the narrowcomponent is still visible shortly before and after ϕ = 0.0, an effect not observed in other emission lines.
Visible only in the trailed spectra is the weak, not resolvedBowen blend (NIII(λ 4634), NIII(λ 4641), CIII(λ 4650)).
In CVs, the intensity of this line complex is correlated withthat of HeII (λ 4686), with the Bowen blend being weaker, butnot with such an extreme ratio. However, this behaviour seemsnot to be unusual in AM Hers since Schwope et al. (1996),presented trailed spectra of HU Aqr showing a similar ratio.
The most striking feature was observed in the HeI (λ 7065)emission line, whose NC is still visible shortly before and afterϕ = 0.0, an effect not observed in other emission lines, wherethe NC vanishes already around phase ϕ ≈ 0.8. The eclipse ofthe NC seeems to be mostly symmetric to phase ϕ = 0.0. Due
to the longer visibility of the NC, it is likely that most of thesecondary’s area facing the primary star is irradiated.
3.2. The mean orbital spectra
In Fig. 2 we present radial velocity-corrected, mean orbitalspectra in the blue (4080. . . 5350A) and in the red spectral range(6500. . . 8300A) in order to distinguish spectroscopic evidenceeither of the narrow component or the broad component. To ac-centuate either the NC or the BC the spectra were shifted witha radial velocity of -275 kms−1· sin φ and -575 kms−1 · sin φ,(both values taken from Barwig et al. 1994) respectively. The

D. Simic et al.: Spectroscopic and spectrophotometric studies of V2301 Oph. I 119
Hα 6563
HeI 6678 HeI 7065
BC
Hδ 4102
Hγ 4340HeI 4388 FeI 4388
HeI 4472
HeII 4686
HeI 4713
Hβ 4861HeI 4921 FeII 4924
HeI 5016 FeII 5018
FeII 5169BC
Hα 6563
HeI 6678 HeI 7065NC
Hδ 4102
Hγ 4340HeI 4388 FeI 4388
HeI 4472
HeII 4686
HeI 4713
Hβ 4861HeI 4922 FeII 4924
HeI 5016 FeII 5018
FeII 5169NC
Fig. 2. Mean orbital spectra of V2301 Oph in the blue spectral range (upper both panels) and the red spectral range (lower both panels)after radial-velocity-correction, in order to emphasize either the NC (additional shift of 275 kms−1· sin φ) or the BC (additional shift of 575kms−1· sin φ). The NC manifests itself in a spiky peak atop of the broad line wings, whereas the BC is represented by round, broad peaks. Note,that the HeII (λ 4686) shows no sign of a narrow component. The spikes around 6880A and between 7200. . . 7380A as well as 7700. . . 8180Aare faint remnants of atmospheric emission lines, whereas the feature at 7600A represents the atmospheric oxygen absorption band.
mean optical spectra of V2301 Oph are characterized by intenseemission lines typical of an AM Her system in a high state.
We identified lines of the Balmer series (Hδ , Hγ , Hβand Hα) as well as of HeI (λλ 4388, 4921, 5016) blendedwith FeI (λλ 4388, 4924, 5018) and the single lines of HeI(λλ 4471, 4713, 6678, 7065) and HeII (λ 4686).
The NC-corrected spectra show a peaked narrow emis-sion line atop the broad line wings except for HeII, where nospiky component could be detected. On the other hand the BC-corrected spectra exhibit round, broad line wings.
An additional proof for the high-state of this system is theinvisibility of the KI and NaI absorption lines, which are typicalfor an M-dwarf secondary in such binaries.
3.3. Radial velocities
The usual procedure of measuring radial velocities in complexemission lines is fitting Gaussians to their line profiles.
Our investigation was restricted to the strong Balmer lines(Hγ , Hβ , Hα), because of the poor S/N of the HeI and HeIIlines. The Hδ emission line was omitted, since lying too closeto the edge of the CCD. In each pixel row of the trailed spectra wefitted the NC and the BC with two Gaussians simultaneously. Tosuppress the influence of noise in these spectra and to providea reliable profile fit, the central region of the Gaussians wasgiven a bigger weight with respect to the adjacence (continuum-transition) of the line profiles.
After that, a sine-fit was applied to the fitted radial velocitiesV of the NC using the following relation :
V = γ −KNC sin(ϕ− ϕ0) (1)
120 D. Simic et al.: Spectroscopic and spectrophotometric studies of V2301 Oph. I
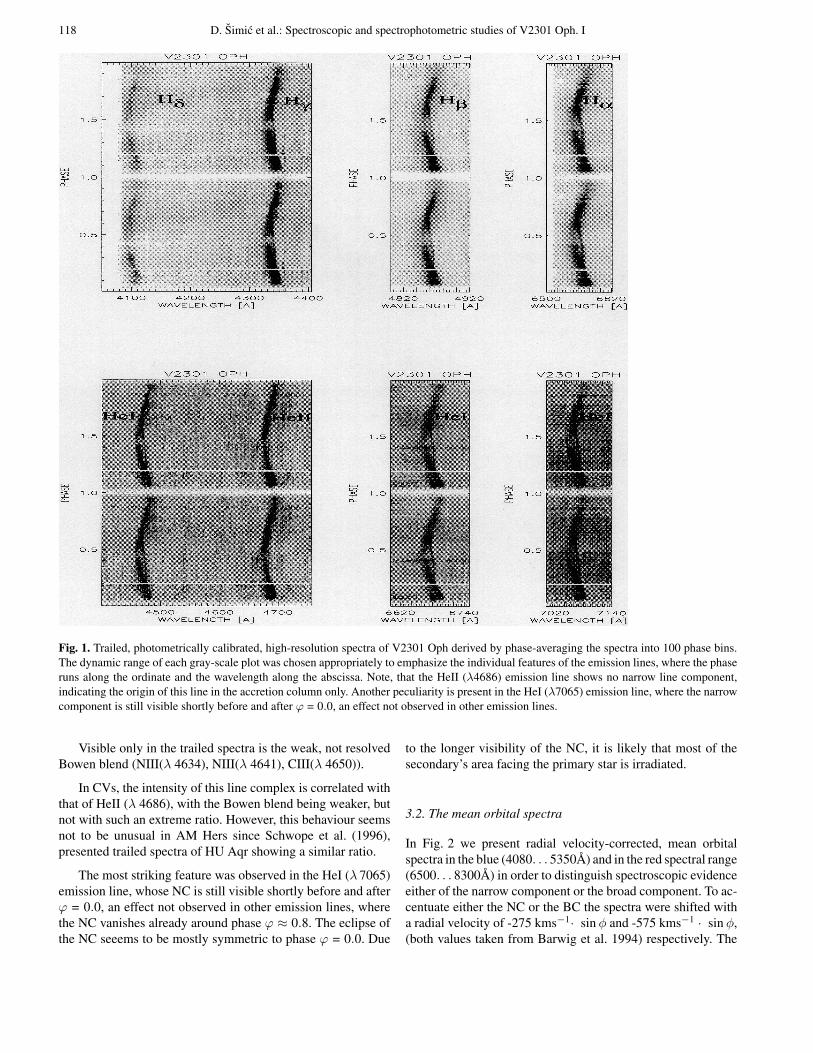
Table 3. Orbital parameter for V2301 Oph. KNC is the amplitude ofthe radial velocity of the narrow component and γ denotes the sys-tem velocity, both in kms−1. σ designates the errors of the mentionedparameter. Hmean is the deduced mean value of the radial velocityamplitude of Hγ , Hβ and Hα from all observing nights. For furtheranalysis the γ value of Hα was accepted to be the most reliable.
Line KNC σKNC γ σγ DataHγ 329.90 6.20 -43.50 13.90 250Hβ 310.70 5.30 -107.80 7.60 348Hα 300.80 2.60 -56.80 4.50 382
Line KNC σKNC DataHmean 307.40 2.70 980
where γ is the system velocity, and KNC denotes the radial ve-locity amplitude of the narrow component.ϕ andϕ0 respectivelyindicate the phase and the phase offset of the binary system.
The fitted radial velocities of the BC were approximatedwith a spline-curve. For the velocity amplitude KBC of thehighly variable broad component we could only estimate a valuerange between 600-650 kms−1. Inaccurate measurements andbroad scattering of the values occur during the phases, where theNC and BC intersect (ϕ ≈ 0.05 . . . 0.2 and ϕ ≈ 0.6 . . . 0.8).
These phase ranges were not taken into account, whilst mea-suring the velocities of the NC, in order to avoid falsificationdue to systematic errors.
The sine-fit to the radial velocity of the NC and the radialvelocity curve of the BC are presented in Figs. 3 and 4, whereasthe deduced values of KNC and γ are displayed in Table 3.
By examining the system velocity γ it is apparent, that thederived values differ significantly from each other.
This might be explained physically with the probable blend-ing of the Hγ and Hβ emission lines with the HeII Pickering-series (λλ 4859,4339), an effect also observed for other AMHers in high state e.g. for HU Aqr (Schwope et al. 1996).
The largest deviations could be found for the Hγ and Hβemission lines, so we take the γ of the unblended Hα as theappropriate value.
Also apparent is an increase of the KNC values with the lineexcitation levels. This is exactly the opposite what one wouldexpect if those components are generated by irradiation fromthe vicinity of the white dwarf, as the photocenter of higherexcitation lines should be closer to the L1 point. This increasein Hγ and Hβ is ambiguous and probably results from distortionsof the Gaussian fit, caused by nearby emission lines.
It should be stressed that the errors in Table 3 are estimatederrors, assuming equal weighting for each Gaussian fitted radialvelocity.
Determination of errors was done according to the proceduredescribed in Bevington & Robinson (1992).
3.4. Doppler tomography
Doppler tomography is an useful tool to extract further infor-mation on CVs from trailed spectra. This method which was
Fig. 3. A radial velocity curve for the narrow component determined byfitting Gaussians to the trailed spectra of Hα. The upper panel shows theresiduals, the lower the distribution of the fitted data. The phase-rangeruns along the abscissa and the velocity along the ordinate. The solidline is the sine-fit to the data. Different symbols mark the three consec-utive observing nights. The deduced radial velocities for each emissionline are shown in Table 3.
Fig. 4. Radial velocity curve for the broad component determined byfitting Gaussians to the spectra of Hα. The phase-range runs along theabscissa and the velocity along the ordinate. Different symbols markthe three consecutive observing nights. A spline approximation fittedto the data yielded an estimate for the radial velocity of the BC between600 and 650 kms−1.
developed by Marsh & Horne (1988) uses the velocity profilesof emission-lines at each phase to create a two-dimensional in-tensity image in velocity-space coordinates (VX , VY ).
Therefore, the Doppler tomogram can be interpreted as aprojection of emitting regions in cataclysmic variables onto theplane perpendicular to the observer’s view. The Doppler mapis a function of the velocity (VX , VY ), where the X-axis pointsfrom the white dwarf to the secondary star and the Y-axis pointsin the direction of the secondary’s motion. An image pixel with

D. Simic et al.: Spectroscopic and spectrophotometric studies of V2301 Oph. I 121
given velocity coordinates (VX , VY ) produces an S-wave witha radial velocity
V = γ − VX cos(2πφ) + VY sin(2πφ) (2)
where γ denotes the system velocity and φ the phase. Simplyspeaking, a Doppler map consists of a series of pixels compara-ble to a CCD-image, which was produced by summing up theline flux in the appropriate sinusoidals in the trailed spectra.
To accomplish this, a linear tomography algorithm, theFourier-filtered back-projection (FFBP) is used, which is de-scribed in detail e.g. by Horne (1991). The resulting Dopplermap (or tomogram) is displayed as a gray-scale image. A help-ful assistance in interpreting Doppler maps are additional in-serted plots which mark the position of the secondary star andthe ballistic trajectory of the gas stream. Assuming a Keple-rian velocity field, emission originating near the center of thesystem has a larger velocity and thus appears in the outer re-gions of the map. Therefore, an image in such a representationis turned inside-out. For the tomogram analysis we restrict our-selves to the three Balmer lines Hγ , Hβ , Hα and the interest-ing HeI (λλ 4471, 6678, 7065) and the HeII (λ 4686) emissionlines. No reasonable Doppler maps could be produced either forHδ , because this emission line was too close to the edge of theCCD, or for the blended HeI (λλ 4921, 5016) emission lineswhich had a poor S/N. Nevertheless, our data set exhibits a richvariety of seven emission lines from different temperature re-gions and excitation states. Since we cannot assume any relationbetween position and velocity during eclipse we constrained ourdata set by removing eclipse spectra between the phase-rangesφ = 0.01 . . . 0.03. Before computing the tomograms we sub-tracted the continuum from the individual emission-lines, sincetheir line-flux is the quantity needed to produce these maps. Thiswas done by subtracting from each pixel row of the trailed spec-tra the according median of the intensity. The emission lines inV, φ-coordinates are displayed in Figs. 6 and 8 and the corre-sponding Doppler maps in velocity coordinates (VX , VY ) areshown in Figs. 7 and 9 as gray-scale-plots.
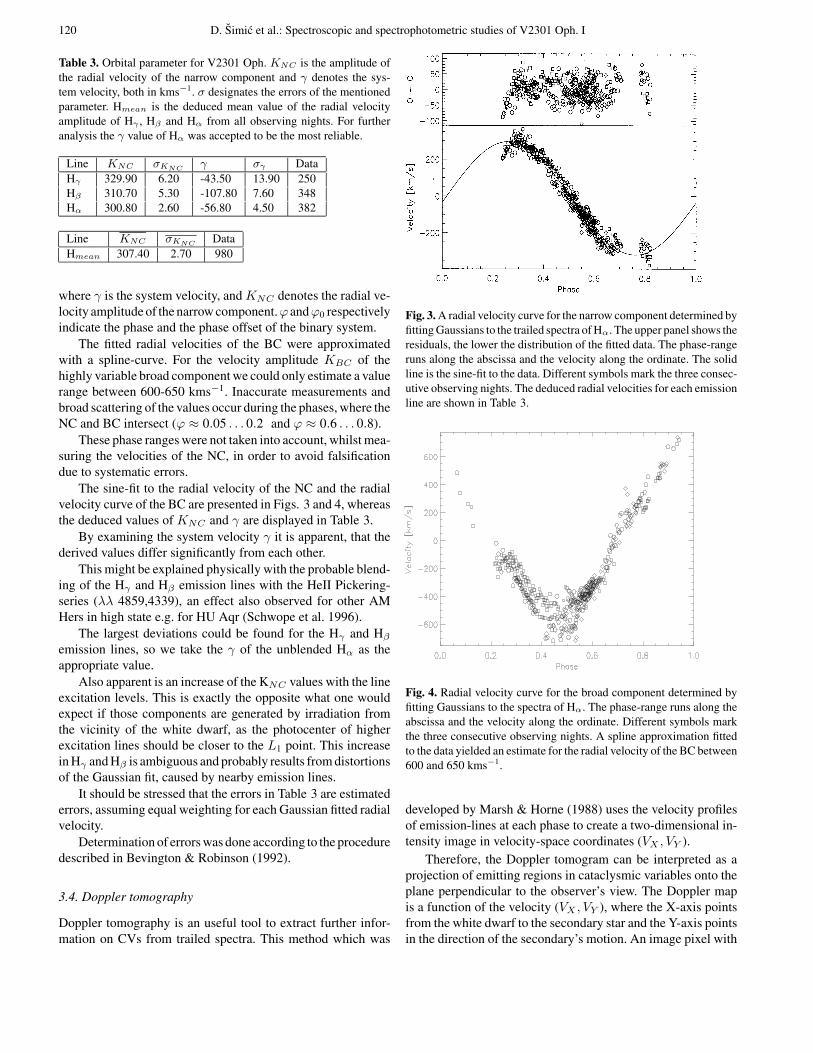
Two general features can be easily recognized in each tomo-gram, an intense bright spot around velocityVY ≈ +300 kms−1,and an extended, bright region nearby that spot reaching out left-wards with velocity coordinates of VX ≈ 0 . . .− 1000 kms−1,VY ≈ 0 . . .− 300 kms−1.
As explained above, the FFBP transforms every sine curve inthe trailed spectra to points in the tomograms. The intense spotthus correlates to the NC, which represents the heated face ofthe secondary, whereas the extended, bright region correspondsto the BC. The distances of the NC and BC from the originof the map correspond to the semi-amplitude of the accordingcomponent.
It should be noted, that we achieved a FWHM resolutionof 200 kms−1 in the central regions of the tomograms, whereasat higher velocities (≈ 800 kms−1) the resolution of the mapssuffered a considerable degradation.
Furthermore, the emission lines can be blurred by the so-called ’gamma-smearing’ effect which is explained in detail by
Diaz & Steiner (1994). Gas moving with a velocity perpendic-ular to the orbital plane VZ generates a shift γ = VZcosi whichblurs the corresponding feature in the Doppler image in a ring-like manner.
The linear structures in the high velocity region of the mapare sampling artefacts (aliasing streaks) which are not taken intoaccount in the further interpretation. For a detailed discussionabout sampling artefacts see e.g. Robinson et al. (1993).
The schematic overlay of the Roche lobe and the gas streamtrajectory is a function of K1 and K2.
We computed our trajectory by taking the best estimate forthe mass ratio q (M1 ≈ 0.897M� (primary star) as well as M2
≈ 0.185M� (secondary star)) from Barwig et al. (1994).By using the following relation for the star masses (M1,M2)
and their radial velocity amplitudes (K1, K2)
q =M2
M1=
K1
K2(3)
as well as using the radial velocity K2 = 400± 50 kms−1 of themass center of the secondary, measured from absorption lineswhen the system was in a low state (Barwig, in preparation),we were able to evaluate the missing value K1 ≈ 82 kms−1 forour schematic overlay. The center of mass and the location ofthe white dwarf are marked respectively by a cross and a pointlocated below the Roche lobe, whereas the stream is representedby an arc originating from the secondary’s lobe at the innerLagrangian point. This arc is calibrated every 0.1RL1 (opencircles) as it is accelerated towards the primary star.
Due to the magnetic field geometry the stream moves onlyat the beginning along a ballistic trajectory and is then deviatedleft-downwards.
In order to compute the magnetically funnelled trajectoryone needs to know two parameters, the azimuthal angle ψ andthe inclination angle θ of the white dwarf’s magnetic pole fromthe rotational axis.
The azimuthal angle ψ (angle between the direction fromthe primary to the secondary star and the projection of the gasstream onto the orbital plane) corresponds to the phase shift(∆φ = 0.25) between the narrow component and the broadcomponent. Since the Doppler tomograms are virtually blindtowards vertical motions we used the values of Ferrario et al.(1995) to estimate θ.
According to Ferrario et al. (1995) the best fit of the viewingangle to the dipole axis is estimated to be about 70◦, so thecolatitude of the magnetic pole is expected to lie between 15◦
and 30◦, depending on the assumed orbital inclination.The resulting magnetically funneled trajectory moves within
the emitting regions of the BC in the Doppler maps.Note, that it also might be possible, that this weak magnetic
AM Her is accreting material onto the other magnetic pole.Some features in our Doppler maps (especially Hγ) indicatesuch a behaviour, where the intensity distribution can be fittedwith a magnetically funneled accretion stream onto the oppositepole, using the same, but negative θ-value. This trajectory isplotted in the Hγ Doppler tomogram, although we cannot ruleout that the emission feature near the inner Lagrangian point

122 D. Simic et al.: Spectroscopic and spectrophotometric studies of V2301 Oph. I
might as well come from an almost stationary component witha low velocity amplitude like in V834 Cen (Rosen et al. 1987).Theoretical and geometrical calculations considering accretiononto both poles were performed by Ferrario et al. (1989).
We generally assume, that most of the emission of the BCis coming from or originating near the coupling region. Theballistic trajectory hardly fits any of the bright emission spotsof the BC and the VX and VY velocity values are too high torepresent a free-falling gas stream near the inner Lagrangianpoint L1.
We could not calculate the trajectories behind the couplingregion, because the accretion kinematics are not well knownthere. Even so, every tomogram shows its own interesting fea-tures which are explained below.
A position coordinate display of the system and the dif-ferent trajectories is shown in Fig. 5. The eclipse-removed,continuum-subtracted trailed spectra used for computing theDoppler maps are displayed in velocity-coordinates in Figs. 6and 8, respectively.
The tomogram of Hγ (Fig. 7) shows an intense small spot(NC) around VY = 300 kms−1 and a bright, extended region(BC) extending leftwards from it with velocity coordinates ofVY = 0 . . .− 400 kms−1 and VX = 0 . . .− 1000 kms−1 .
Another interesting feature is the part of the stream whichseems to combine the gas stream and the secondary. This mightbe interpreted as an emission contribution originating near theinner Lagrangian point. From this map we considered an accre-tion onto the opposite pole.
Therefore, the magnetically funneled trajectory moves in adirection opposite to the ballistic one. The bright area with theintense spots inside depicts the gas stream which is compressedbefore being coupled on the magnetic field line.
Comparing the Hβ with the Hγ (Fig. 7) Doppler map, wefind some differences. The secondary’s feature is more intenseand the bright area is stronger than in the Hγ map, confirmingthe higher intensity of Hβ .
The Hα tomogram (Fig. 7) seems to be more blurred whichmay be due to the above mentioned ‘gamma-smearing’ effect,but we can still distinguish the same features (bright spot andextended bright area) as in the other maps. The Doppler mapsof the Helium emission lines display weaker features.
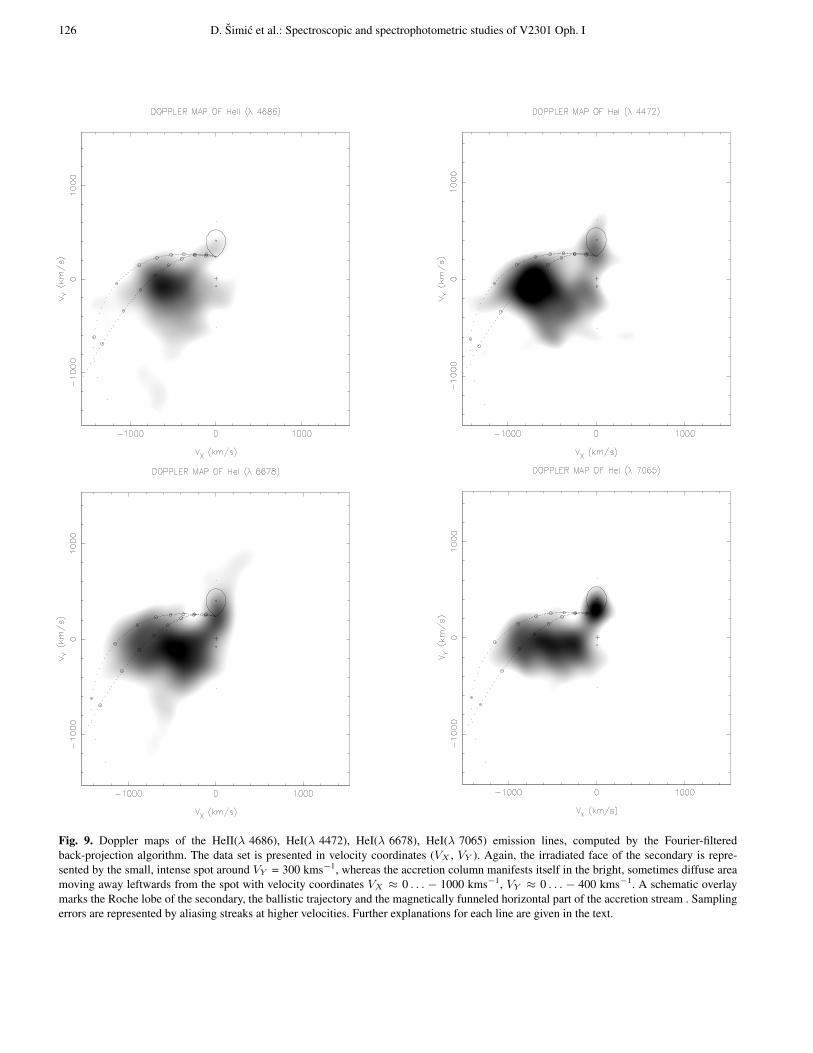
In the HeI (λ 4472) tomogram (Fig. 9) the same small in-tense spot (illuminated face of the secondary) can be found,whereas the gas stream is represented by a bright, fragmentedarea extending leftwards from the spot.
One of the most interesting tomograms resulted in back-projecting the HeII (λ 4686) emission line (Fig. 9) where theNC is absent. Thus, we are able to compute a map representingthe BC only. Instead of the secondary’s feature we could onlydetect a diffuse area resulting from the back-projection of theadjacent HeI (λ 4713).
An intense bright spot is present with velocity coordinates ofVX ≈ 0 . . .−800 kms−1 and VY ≈ 0 . . .−400 kms−1 whichis due to emission lines originating in the coupling region.
The Doppler map of HeI (λ 6678) (Fig. 9) represents thesame but weaker features as the Balmer lines, whereas the last
12
3
Fig. 5. Position coordinate display of the accretion geometry of V2301Oph computed for an assumed mass ratio of q = 0.205. The loci ofthe secondary and the primary star are denoted by a cross and a point,respectively. Their Roche lobes are displayed as solid (secondary) anddashed lines (primary). The axes are plotted in units of the distancebetween the white dwarf and L1. The ballistic trajectory (stream 1)is plotted together with the magnetically funneled part of the streamcomputed for ψ = 25◦ and θ = 70◦ (stream 2). Additionally, weinserted a magnetically funneled trajectory (stream 3) computed witha negative θ-value for accretion on the opposite pole.
but not the least interesting tomogram presented by the HeI(λ 7065) emission line (Fig. 9) shows a stronger NC than inother maps.
3.5. The light curves
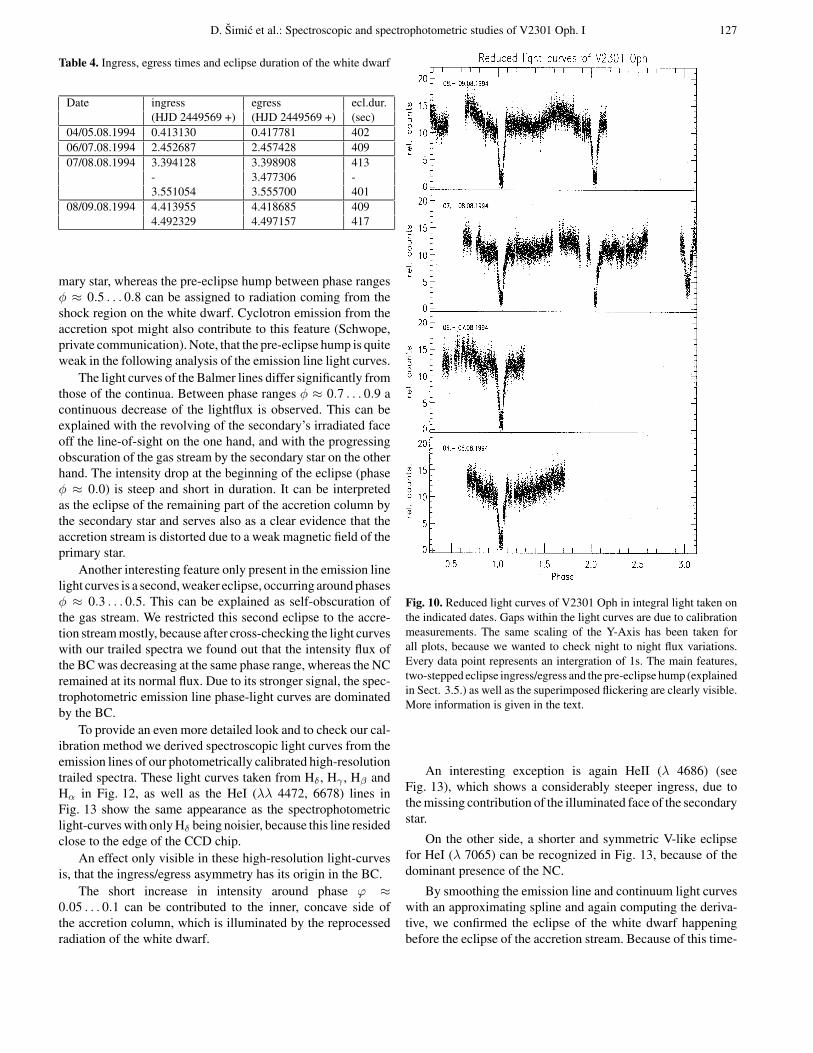
Spectrophotometric observations of V2301 Oph were obtainedwith MEKASPEK over three consecutive nights (06-09 Aug.,1994) and in the night of 04/05 Aug., 1994. Seven eclipsescould be acquired, though only the last night turned out to bephotometric. The data set was reduced as described in Sect. 2.1.and then phase-folded with a time resolution of 1s using theupdated eclipse-ephemeris (see Sect. 2.1.). The reduced lightcurves of each night in integral light are presented in Fig. 10.Several quite interesting features of the light curve are explainedin the following.
A well-known feature (Barwig et al. 1994) is the two-stepped eclipse ingress/egress of the white dwarf and the gasstream. In the first ingress step, the white dwarf is occulted,whereas the temporally highly variable accretion column iseclipsed during the second ingress step. The following pro-gression of the light curve is flat, indicating a total eclipse ofboth components. After that, the primary star emerges first,pictured in the first egress step, followed by the gas streamwhich reappears in the second step. Another interesting featureis the pre-eclipse hump between phases φ ≈ 0.5 . . . 0.85. Sucha behaviour cannot be explained with the common hot spot-accretion disc configuration. Barwig et al. (1994) concludedthat the observed ingress/egress phases of an assumed hot spot

D. Simic et al.: Spectroscopic and spectrophotometric studies of V2301 Oph. I 123
Fig. 6. Zoomed gray-scale representations of continuum-subtracted,photometrically calibrated, high-resolution spectra of the prominentBalmer lines Hγ , Hβ and Hα. The emission lines are plotted inv, φ-coordinates. Not covered phase-ranges are marked with whiteempty rows. The eclipse spectra have been removed, since we assumeno relation between position and velocity.
would require an unrealistically small accretion disc. Superim-posed on the hump and the remaining out-of-eclipse light curveis a non-periodic, sometimes quasi-periodic flickering, whichmight have its origin in the hot, anisotropically radiating gasstream.
The duration of the eclipse of the white dwarf was mea-sured in the B-channel by smoothing the eclipse features
(ingress/egress steps) of every single night with an approximat-ing spline first, and taking the derivative of this fit afterwards.Derivatives of ingress and egress features show local minimaand maxima, respectively. Those quite precise time values withan error corresponding to the time resolution, were taken to de-termine the timings of the ingress/egress of the primary star. The
124 D. Simic et al.: Spectroscopic and spectrophotometric studies of V2301 Oph. I
Fig. 7. Doppler maps of the prominent Balmer lines Hγ , Hβ and Hα
in velocity space (VX , VY ) using the Fourier-filtered back-projectiontechnique. The intense small spot around VY = 300 kms−1 representsthe heated face of the secondary, whereas the gas stream is denoted bythe bright area extending leftwards from the spot with velocity coordi-nates VX ≈ 0 . . .− 1000 kms−1, VY ≈ 0 . . .− 400 kms−1. Samplingerrors are represented by aliasing streaks in the higher velocity regions.A schematic overlay marks the Roche lobe of the secondary, the bal-listic trajectory and the magnetically funneled horizontal part of theaccretion stream. Note, that in the Hγ map, a magnetically funneledtrajectory has been modelled, assuming an accretion to the oppositepole. Further information for each line is given in the text.
individual values for each night as well as the average eclipsetimes are given in Table 4.
3.6. The decomposition of light curves
As explained in Sect. 2.2., using MEKASPEK we were ableto extract Balmer lines from the continuum. Emission lines ofV2301 Oph are thought to be arising mainly in the gas stream
and on the illuminated face of the secondary, whereas the whitedwarf dominates in the continuum.
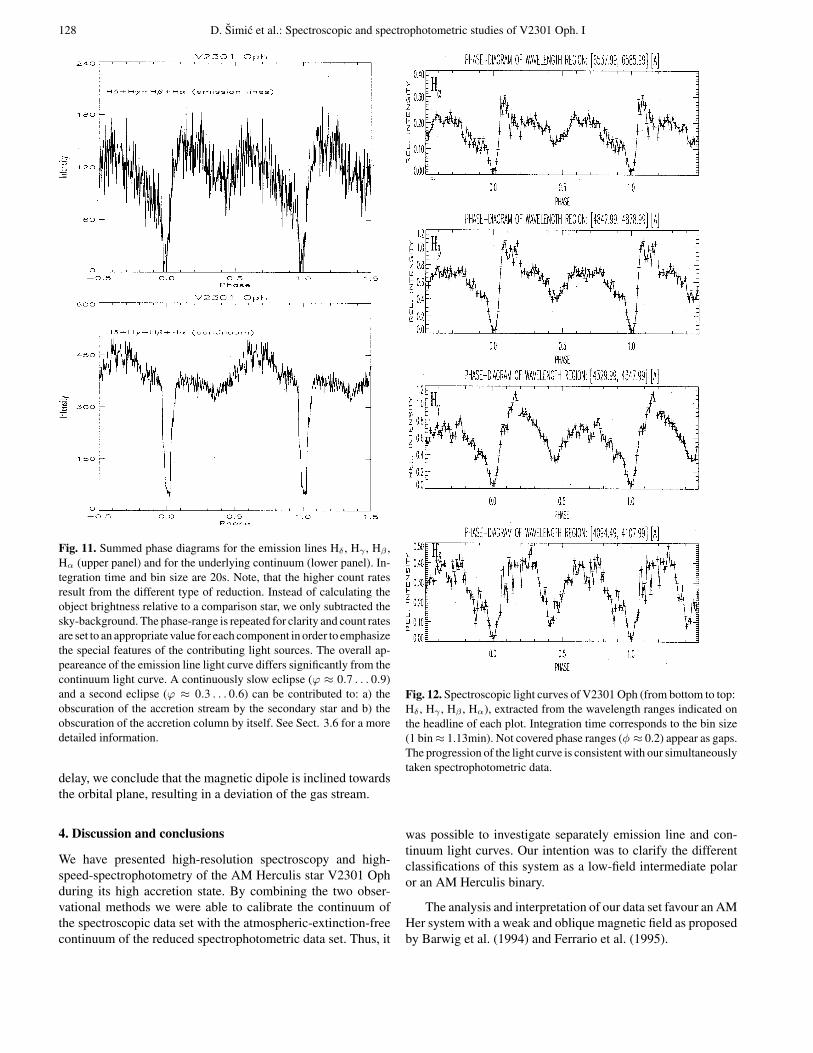
The decomposed light curves have a lower time resolution(20s), in favour of a better S/N. Still, the signal is quite noisyand useful information can only be obtained by phase-foldingall acquired light curves at the orbital period. In order to in-crease the S/N, the individual phase diagrams of the Balmerlines and the underlying continuum were summed up as shownin Fig. 11. The continuum light curves show features of the pri-

D. Simic et al.: Spectroscopic and spectrophotometric studies of V2301 Oph. I 125
Fig. 8. Zoomed gray-scale representations of continuum-subtracted, photometrically calibrated, high-resolution spectra of the weaker linesHeII(λ 4686), HeI(λ 4472), HeI(λ 6678), HeI(λ 7065) . The emission lines are plotted in v, φ-coordinates. Empty phase-ranges are markedby blank rows. Eclipse spectra have been removed, since we assume no relation between position and velocity. Note, that the NC in the HeI (λ7065) emission line is still visible shortly before and after phase ϕ = 0.
126 D. Simic et al.: Spectroscopic and spectrophotometric studies of V2301 Oph. I
Fig. 9. Doppler maps of the HeII(λ 4686), HeI(λ 4472), HeI(λ 6678), HeI(λ 7065) emission lines, computed by the Fourier-filteredback-projection algorithm. The data set is presented in velocity coordinates (VX , VY ). Again, the irradiated face of the secondary is repre-sented by the small, intense spot around VY = 300 kms−1, whereas the accretion column manifests itself in the bright, sometimes diffuse areamoving away leftwards from the spot with velocity coordinates VX ≈ 0 . . . − 1000 kms−1, VY ≈ 0 . . . − 400 kms−1. A schematic overlaymarks the Roche lobe of the secondary, the ballistic trajectory and the magnetically funneled horizontal part of the accretion stream . Samplingerrors are represented by aliasing streaks at higher velocities. Further explanations for each line are given in the text.
D. Simic et al.: Spectroscopic and spectrophotometric studies of V2301 Oph. I 127
Table 4. Ingress, egress times and eclipse duration of the white dwarf
Date ingress egress ecl.dur.(HJD 2449569 +) (HJD 2449569 +) (sec)
04/05.08.1994 0.413130 0.417781 40206/07.08.1994 2.452687 2.457428 40907/08.08.1994 3.394128 3.398908 413
- 3.477306 -3.551054 3.555700 401
08/09.08.1994 4.413955 4.418685 4094.492329 4.497157 417
mary star, whereas the pre-eclipse hump between phase rangesφ ≈ 0.5 . . . 0.8 can be assigned to radiation coming from theshock region on the white dwarf. Cyclotron emission from theaccretion spot might also contribute to this feature (Schwope,private communication). Note, that the pre-eclipse hump is quiteweak in the following analysis of the emission line light curves.
The light curves of the Balmer lines differ significantly fromthose of the continua. Between phase ranges φ ≈ 0.7 . . . 0.9 acontinuous decrease of the lightflux is observed. This can beexplained with the revolving of the secondary’s irradiated faceoff the line-of-sight on the one hand, and with the progressingobscuration of the gas stream by the secondary star on the otherhand. The intensity drop at the beginning of the eclipse (phaseφ ≈ 0.0) is steep and short in duration. It can be interpretedas the eclipse of the remaining part of the accretion column bythe secondary star and serves also as a clear evidence that theaccretion stream is distorted due to a weak magnetic field of theprimary star.
Another interesting feature only present in the emission linelight curves is a second, weaker eclipse, occurring around phasesφ ≈ 0.3 . . . 0.5. This can be explained as self-obscuration ofthe gas stream. We restricted this second eclipse to the accre-tion stream mostly, because after cross-checking the light curveswith our trailed spectra we found out that the intensity flux ofthe BC was decreasing at the same phase range, whereas the NCremained at its normal flux. Due to its stronger signal, the spec-trophotometric emission line phase-light curves are dominatedby the BC.
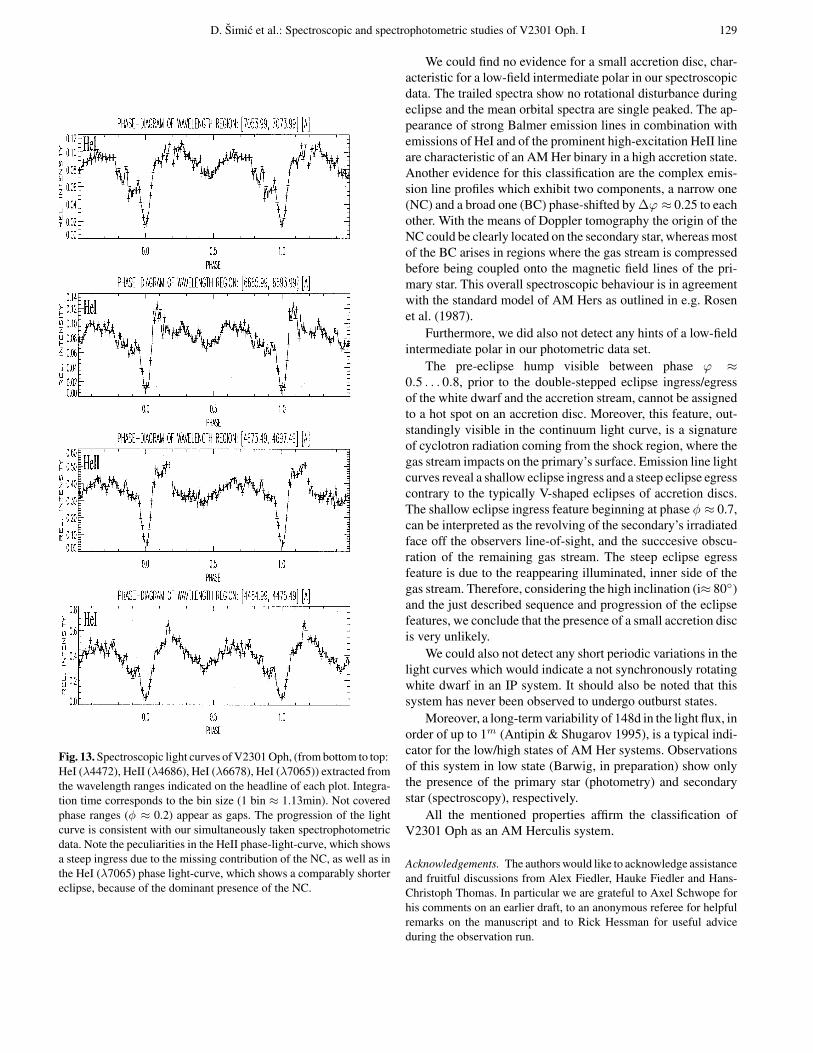
To provide an even more detailed look and to check our cal-ibration method we derived spectroscopic light curves from theemission lines of our photometrically calibrated high-resolutiontrailed spectra. These light curves taken from Hδ , Hγ , Hβ andHα in Fig. 12, as well as the HeI (λλ 4472, 6678) lines inFig. 13 show the same appearance as the spectrophotometriclight-curves with only Hδ being noisier, because this line residedclose to the edge of the CCD chip.
An effect only visible in these high-resolution light-curvesis, that the ingress/egress asymmetry has its origin in the BC.
The short increase in intensity around phase ϕ ≈0.05 . . . 0.1 can be contributed to the inner, concave side ofthe accretion column, which is illuminated by the reprocessedradiation of the white dwarf.
Fig. 10. Reduced light curves of V2301 Oph in integral light taken onthe indicated dates. Gaps within the light curves are due to calibrationmeasurements. The same scaling of the Y-Axis has been taken forall plots, because we wanted to check night to night flux variations.Every data point represents an intergration of 1s. The main features,two-stepped eclipse ingress/egress and the pre-eclipse hump (explainedin Sect. 3.5.) as well as the superimposed flickering are clearly visible.More information is given in the text.
An interesting exception is again HeII (λ 4686) (seeFig. 13), which shows a considerably steeper ingress, due tothe missing contribution of the illuminated face of the secondarystar.
On the other side, a shorter and symmetric V-like eclipsefor HeI (λ 7065) can be recognized in Fig. 13, because of thedominant presence of the NC.
By smoothing the emission line and continuum light curveswith an approximating spline and again computing the deriva-tive, we confirmed the eclipse of the white dwarf happeningbefore the eclipse of the accretion stream. Because of this time-
128 D. Simic et al.: Spectroscopic and spectrophotometric studies of V2301 Oph. I
Fig. 11. Summed phase diagrams for the emission lines Hδ , Hγ , Hβ ,Hα (upper panel) and for the underlying continuum (lower panel). In-tegration time and bin size are 20s. Note, that the higher count ratesresult from the different type of reduction. Instead of calculating theobject brightness relative to a comparison star, we only subtracted thesky-background. The phase-range is repeated for clarity and count ratesare set to an appropriate value for each component in order to emphasizethe special features of the contributing light sources. The overall ap-peareance of the emission line light curve differs significantly from thecontinuum light curve. A continuously slow eclipse (ϕ ≈ 0.7 . . . 0.9)and a second eclipse (ϕ ≈ 0.3 . . . 0.6) can be contributed to: a) theobscuration of the accretion stream by the secondary star and b) theobscuration of the accretion column by itself. See Sect. 3.6 for a moredetailed information.
delay, we conclude that the magnetic dipole is inclined towardsthe orbital plane, resulting in a deviation of the gas stream.
4. Discussion and conclusions
We have presented high-resolution spectroscopy and high-speed-spectrophotometry of the AM Herculis star V2301 Ophduring its high accretion state. By combining the two obser-vational methods we were able to calibrate the continuum ofthe spectroscopic data set with the atmospheric-extinction-freecontinuum of the reduced spectrophotometric data set. Thus, it
Fig. 12. Spectroscopic light curves of V2301 Oph (from bottom to top:Hδ , Hγ , Hβ , Hα), extracted from the wavelength ranges indicated onthe headline of each plot. Integration time corresponds to the bin size(1 bin≈ 1.13min). Not covered phase ranges (φ ≈ 0.2) appear as gaps.The progression of the light curve is consistent with our simultaneouslytaken spectrophotometric data.
was possible to investigate separately emission line and con-tinuum light curves. Our intention was to clarify the differentclassifications of this system as a low-field intermediate polaror an AM Herculis binary.
The analysis and interpretation of our data set favour an AMHer system with a weak and oblique magnetic field as proposedby Barwig et al. (1994) and Ferrario et al. (1995).
D. Simic et al.: Spectroscopic and spectrophotometric studies of V2301 Oph. I 129
Fig. 13. Spectroscopic light curves of V2301 Oph, (from bottom to top:HeI (λ4472), HeII (λ4686), HeI (λ6678), HeI (λ7065)) extracted fromthe wavelength ranges indicated on the headline of each plot. Integra-tion time corresponds to the bin size (1 bin ≈ 1.13min). Not coveredphase ranges (φ ≈ 0.2) appear as gaps. The progression of the lightcurve is consistent with our simultaneously taken spectrophotometricdata. Note the peculiarities in the HeII phase-light-curve, which showsa steep ingress due to the missing contribution of the NC, as well as inthe HeI (λ7065) phase light-curve, which shows a comparably shortereclipse, because of the dominant presence of the NC.
We could find no evidence for a small accretion disc, char-acteristic for a low-field intermediate polar in our spectroscopicdata. The trailed spectra show no rotational disturbance duringeclipse and the mean orbital spectra are single peaked. The ap-pearance of strong Balmer emission lines in combination withemissions of HeI and of the prominent high-excitation HeII lineare characteristic of an AM Her binary in a high accretion state.Another evidence for this classification are the complex emis-sion line profiles which exhibit two components, a narrow one(NC) and a broad one (BC) phase-shifted by ∆ϕ ≈ 0.25 to eachother. With the means of Doppler tomography the origin of theNC could be clearly located on the secondary star, whereas mostof the BC arises in regions where the gas stream is compressedbefore being coupled onto the magnetic field lines of the pri-mary star. This overall spectroscopic behaviour is in agreementwith the standard model of AM Hers as outlined in e.g. Rosenet al. (1987).
Furthermore, we did also not detect any hints of a low-fieldintermediate polar in our photometric data set.
The pre-eclipse hump visible between phase ϕ ≈0.5 . . . 0.8, prior to the double-stepped eclipse ingress/egressof the white dwarf and the accretion stream, cannot be assignedto a hot spot on an accretion disc. Moreover, this feature, out-standingly visible in the continuum light curve, is a signatureof cyclotron radiation coming from the shock region, where thegas stream impacts on the primary’s surface. Emission line lightcurves reveal a shallow eclipse ingress and a steep eclipse egresscontrary to the typically V-shaped eclipses of accretion discs.The shallow eclipse ingress feature beginning at phase φ ≈ 0.7,can be interpreted as the revolving of the secondary’s irradiatedface off the observers line-of-sight, and the succcesive obscu-ration of the remaining gas stream. The steep eclipse egressfeature is due to the reappearing illuminated, inner side of thegas stream. Therefore, considering the high inclination (i≈ 80◦)and the just described sequence and progression of the eclipsefeatures, we conclude that the presence of a small accretion discis very unlikely.
We could also not detect any short periodic variations in thelight curves which would indicate a not synchronously rotatingwhite dwarf in an IP system. It should also be noted that thissystem has never been observed to undergo outburst states.
Moreover, a long-term variability of 148d in the light flux, inorder of up to 1m (Antipin & Shugarov 1995), is a typical indi-cator for the low/high states of AM Her systems. Observationsof this system in low state (Barwig, in preparation) show onlythe presence of the primary star (photometry) and secondarystar (spectroscopy), respectively.
All the mentioned properties affirm the classification ofV2301 Oph as an AM Herculis system.
Acknowledgements. The authors would like to acknowledge assistanceand fruitful discussions from Alex Fiedler, Hauke Fiedler and Hans-Christoph Thomas. In particular we are grateful to Axel Schwope forhis comments on an earlier draft, to an anonymous referee for helpfulremarks on the manuscript and to Rick Hessman for useful adviceduring the observation run.

130 D. Simic et al.: Spectroscopic and spectrophotometric studies of V2301 Oph. I
References
Antipin S.V., Shugarov S.Yu., 1995, In: Proceedings Abano-PadovaConference on Cataclysmic Variables, Kluwer Academic Publish-ers, p. 145
Barwig H., Schoembs H., Buckenmayer C., 1987, A&A 175, 327Barwig H., Ritter H., Barnbantner O., 1994, A&A 288, 204Bevington P.R., Robinson D., 1992, Data reduction and error analysis
for the physical sciences, McGraw-Hill Inc., New York.Biermann P., Schmidt G.D., Liebert J., et al. , 1985, ApJ 293, 303Diaz M.P., Steiner J.E., 1994, A&A 283, 508Ferrario L., Wickramasinghe D., 1993, MNRAS 265, 605Ferrario L., Wickramasinghe D., Tuohy I.R., 1989, ApJ 341, 327Ferrario L., Wickramasinghe D., King A.R., 1993, MNRAS 260, 149Ferrario L., Wickramasinghe D., Bailey J., Buckley D., 1995, MNRAS
273, 17Hessman F.V., Beuermann K., Burwitz V., Reinsch K., Thomas H.C.,
1995, In: Proceedings Abano-Padova Conference on CataclysmicVariables, Kluwer Academic Publishers, p. 23
Horne K., 1986, PASP 98, 609Horne K., 1991, In: Fundamental Properties of Cataclysmic Variable
Stars: 12th North American Workshop on Cataclysmic Variablesand Low Mass X-ray Binaries, San Diego, San Diego State Uni-versity Publication, p. 160
Mantel K.H., Barwig H., 1993, NATO ASI series C436, 329Mantel K.H., Barwig H., Kiesewetter S., 1993b, AG Abstract series 9,
14Marsh T.R., Horne K., 1988, MNRAS 235, 269Mukai K., 1988, MNRAS 232, 175Robinson E.L., Marsh T.R., Smak J.I., 1993, In: Accretion Disks in
Compact Stellar Systems, Singapore, World Scientific PublishingCo. Pte. Ltd, p. 75
Rosen S.R., Mason K.O., Cordova F.A., 1987, MNRAS 224, 987Silber A.D., 1992, Ph.D.thesis, Massachusetts Institute of TechnologySilber A.D., Remillard R.A., Horne K., Bradt H.V., 1994, ApJ 424,
955Schwope A.D., Mantel K.H., Horne K., 1997, A&A (in press)Young P., Schneider D.P., 1979, ApJ 230, 502
This article was processed by the author using Springer-Verlag LaTEXA&A style file L-AA version 3.