Embed Size (px)
Citation preview
March 10, 2009 / Vol. 7, No. 3 / CHINESE OPTICS LETTERS 201
Spectral feature matching based on partial least squares
Weidong Yan (òòò���ÀÀÀ)1∗, Zheng Tian (XXX ���)1,2, Lulu Pan (���åååååå)1, and Mingtao Ding (¶¶¶²²²777)1
1School of Science, Northwestern Polytechnical University, Xi’an 7100722State Key Laboratory of Remote Sensing Science, Institute of Remote Sensing Applications,
Chinese Academy of Sciences, Beijing 100101∗E-mail: [email protected]
Received September 16, 2008
We investigate the spectral approaches to the problem of point pattern matching, and present a spectralfeature descriptors based on partial least square (PLS). Given keypoints of two images, we define theposition similarity matrices respectively, and extract the spectral features from the matrices by PLS, whichindicate geometric distribution and inner relationships of the keypoints. Then the keypoints matching isdone by bipartite graph matching. The experiments on both synthetic and real-world data corroboratethe robustness and invariance of the algorithm.
OCIS codes: 100.0100, 100.2000.doi: 10.3788/COL20090703.0201.
Image registration is a fundamental task in image pro-cessing used to match two or more images which are takenat different time from different sensors or different view-points, so that differences can be detected. The mostdifficult part of a registration process is the determi-nation of the correspondence of keypoints between theimages to be registered. If some correspondences are in-correct, they will produce an incorrect transformationfunction, which could yield totally wrong results. So ahighly robust point matching algorithm is needed.
Image registration methods can be generally orga-nized in area-based and feature-based methods[1]. Area-based methods deal with the images without attempt-ing to detect salient features, and adopt optimizationalgorithms[2,3]. These methods have some limitations,which can be affected by the intensity distribution.Feature-based matching which is particularly suited tomulti-source image registration consists of three stages.In the first stage, features in the image are extracted,such as keypoints, lines, and patches. In the second stage,keypoints in the reference image are corresponded withkeypoints in the sensed image. In the last stage, a spatialmapping, usually an affine transformation, is determinedusing these matched keypoints based on least square re-gression or similar techniques. However, in most cases,the extraction and representation of the relationship it-self are difficult problems. The crucial objective[4] of allfeature-based matching methods is to have discrimina-tive and robust feature descriptors that are invariant toall assumed differences between the images.
Keypoints are the simplest form of features, whichare represented basically by the point locations. How-ever, the resulting point matching problem can be quitedifficult because of various factors like noise. Keypointscan be matched by considering either the radiometricproperties of the surrounding pixels, or the geometricdistribution of the whole set of keypoints across thewhole image[5]. Spectral graph theory is a term ap-plied to a family of techniques that aim to character-ize the global structural properties of graphs using theeigenvalues and eigenvectors of similarity matrices[6]. So
the spectral graph can indicate geometric distributionof keypoints. In the computer vision literatures, therehave been a number of attempts to use spectral proper-ties for graph-matching[7−9]. Scott et al. used a Gaus-sian weighting function to build an inter-image similaritymatrix between feature points in different images beingmatched and then performed singular value decomposi-tion (SVD) on the similarity matrix in order to get cor-respondences from the similarity matrix’s singular valuesand vectors[7]. This method fails when the rotation orscaling between the images is too large. To overcomethis problem, Shapiro et al.
[8] constructed intra-imagesimilarity matrices for the individual points-sets beingmatched with an aim to capture the relational imagestructure[8]. The eigenvectors of the individual similaritymatrices were used to match. This method can be viewedas projecting the individual point-sets into an eigenspace,and seeking matches by looking for the closest point cor-respondence. Wang et al. investigated the performanceof kernel principal component analysis (PCA) with apolynomial kernel function for solving the point corre-spondence problem and discussed the relationship withShapiro’s correspondence method[9]. Such approachescharacterize the graphs by their dominant eigenvectors.However, these eigenvectors are computed independentlyfor each graph and thus often do not capture co-salientstructures of the graphs. While the partial least square(PLS) approach helps to extract representations from twoimages which contain relevant information for the match-ing of the particular pair of images.
In this letter, we present a method of spectral featurematching based on PLS. The spectral features are con-structed with information of position similarity matri-ces, using PLS components, and invariant to translation,scale, and rotation, and very suitable for feature-basedmatching.
The PLS method initially developed by Wold et al.[10]
has a tremendous success in chemometrics and chemi-cal industries for static data analysis. It integrates thePCA and canonical correlation analysis (CCA) togethernaturally and is convenient for the analysis of the multi-
1671-7694/2009/030201-05 c© 2009 Chinese Optics Letters
202 CHINESE OPTICS LETTERS / Vol. 7, No. 3 / March 10, 2009
dimensional complexity system. In its general form, PLScreates components by using the existing correlations be-tween different sets of variance while also keeping mostof the variance of both sets. Before detailing the algo-rithm, we provide some of the formal ingredients of themethod.
Consider a general setting of the PLS algorithm tomodel the relation between two data sets. Let x =(x1, · · · , xN ) denote an N -dimensional vector of vari-ables in the first block of data, and similarly let y =(y1, · · · , yM ) denote a vector of variables from the secondset. Observing n data samples from each block of vari-ables, PLS decomposes X = (xij)n×N and Y = (yij)n×N
into the form
X = TPT + F,
Y = UQT + G,
where T and U are n×r matrices of the extracted r com-ponents, the N × r matrices P and Q represent matricesof projections, and the n × N matrices F and Q are thematrices of residuals. The PLS method, in which theclassical form is based on the nonlinear iterative partialleast square (NIPALS) algorithm, finds projection axesw and c such that[10]
max S = tTu=(Xw)T(Y c) = wTXTY c,
s.t.
{
wTw = ‖w‖2
= 1
cTc = ‖c‖2
= 1. (1)
The solution to this optimization problem is given by thefollowing eigenvalue problem[11]:
XTY Y TXw = λw,
where λ is the eigenvalue associated with w. The com-ponents of X are then given as t = Xw.
Similarly, the extraction of components of Y is givenas
XXTY Y Tt = λt, (2)
u = Y Y Tt. (3)
Now, we select the keypoint sets on the referenceimage and the sensed image respectively, and denoteX = (x1, x2, · · · , xn) and Y = (y1, y2, · · · , yn). In thisletter, the keypoints in each data-set are in the form ofxi = (x1
i , x2i ) and yi = (y1
i , y2i ), respectively. Our aim is
to establish a one-to-one point correspondence betweenthe two data-sets.
Using the keypoint sets, we construct the position simi-larity matrices by Gaussian kernel function, (Sx)n×n and(Sy)n×n,
(Sx)ij = exp(−d(xi, xj)
2
σ2x
),
and (Sy)ij = exp(−d(yi, yj)
2
σ2y
),
where d(xi, xj) is the Euclidean distance between thekeypoints xi and xj , and σx, σy are adjustable pa-rameters. Now every keypoint corresponds to an n-dimensional feature vector, xi → (Sx)i·, yj → (Sy)j·.The mapping of the original two-dimensional (2D) datato a higher dimensional space is completed and thus thestructural information can be captured from the featurevectors[8].
Under the criterion (1), the number of componentsis rank(ST
x SySTy Sx) (that is the number of non-zero
eigenvalues of matrix STx SyS
Ty Sx) pairs at most. r
(≤ rank(STx SyST
y Sx)) pairs of components are com-posed of vectors which are selected from the eigenvec-tors corresponding to the first r maximum eigenvalues ofeigenequations
SxSTx SyST
y T = λ2T, (4)
SySTy SxST
x U = λ2U, (5)
where T = [t1, · · · , tr], U = [u1, · · · , ur].Now we give the proof of the above theorem. Using the
Lagrange multiplier method[12] to transform Eq. (1), weget
L(W, C) = WTSTx SyC −
λ1
2(WTW − 1) −
λ2
2(CTC − 1),
where λ1 and λ2 are Lagrange multipliers. Let
∂L(W, C)
∂W= ST
x SyC − λ1W = 0,
∂L(W, C)
∂C= ST
y SxW − λ2C = 0,
then,
WTSTx SyC = λ1W
TW = λ1,
CTSTy SxW = λ2C
TC = λ2.
Since (STy Sx)T = ST
x Sy, we have
λ1 = λT1 = (WTST
x SyC)T = CTSTy SxW = λ2.
Let λ1 = λ2 = λ, we can infer that to obtain the maxi-mum value of λ is the same as to maximize the criterion(1).
Then r pairs of projection axes W , C can be inferredvia
STx SyST
y SxW = λ2W,
STy SxST
x SyC = λ2C.
Multiplying both side of Eq. (4) by Sx, then the compo-nents of Sx are given by T = SxW , that is SxST
x SySTy T =
λ2T . Since both STx SyS
Ty Sx and ST
y SxSTx Sy are symmet-
ric matrices, and rank(STx SyST
y Sx) = rank(STy SxST
x Sy),the two eigenequations (4) and (5) have the same non-zero eigenvalues.
In the same way, SySTy SxST
x U = λ2U .Now the keypoint xi in the reference image and
yj in the sensed image can be represented by PLSspectral features (T )i = [ti1, ti2, · · · , tir ] and (U)j =
March 10, 2009 / Vol. 7, No. 3 / CHINESE OPTICS LETTERS 203
[uj1, uj2, · · · , ujr] in the r-dimensional eigenspacespanned by T and U respectively. Thus if the arbi-trary numbering of two features in an image is changed,their feature vectors simply change positions in T (orU), and the matching of keypoints can be converted tothe matching of PLS spectral features. It is known fromgeometry that the Euclidean distance is invariant to thesimilarity transformation[12]. Hence, the spectral fea-tures have invariance.
Various methods have been proposed to deal with thekeypoint matching problem[13,14]. As a fundamentalproblem in image registration, graph matching has avariety of applications in the field of computer vision.In graph matching, keypoints are modeled as graphsand feature matching amounts to find a correspondencebetween the nodes of different graphs. In this letter, bi-partite matching methods are applied in feature match-ing. We firstly extract keypoints from the reference andsensed images, and then compute the spectral featurevectors (T and U) for the keypoints, forming the ver-tices for a bipartite graph. Each vertex is connectedto all the vertices on the opposite side. The similaritymeasures between these two sets of spectral features aresummarized in the association matrix. We then applythe Hungarian algorithm to find the optimal matchingfor the bipartite graph.
To make the algorithm more robust, the mismatchingkeypoints can be eliminated by the continuity constraint(close neighbors in the reference image must be mappedto close neighbors in the sensed image). So we can exam-ine the correspondences of the neighbors of the matchedkeypoints to eliminate the mismatching.
We investigate the performance of the method of spec-tral feature matching based on PLS. We use it to solvea 2D rigid mapping (rotation, translation, and scale).Three experiments were performed. In the experiment 1,we compared the matching performance of the PLS-basedapproach described above and SVD-based approach[7],and showed the robustness of the PLS-based approach.In the experiment 2, we verified the invariance of the
spectral features on synthetic and optical images. Fi-nally, in the experiment 3, we tested the method on asynthetic aperture radar (SAR) image.
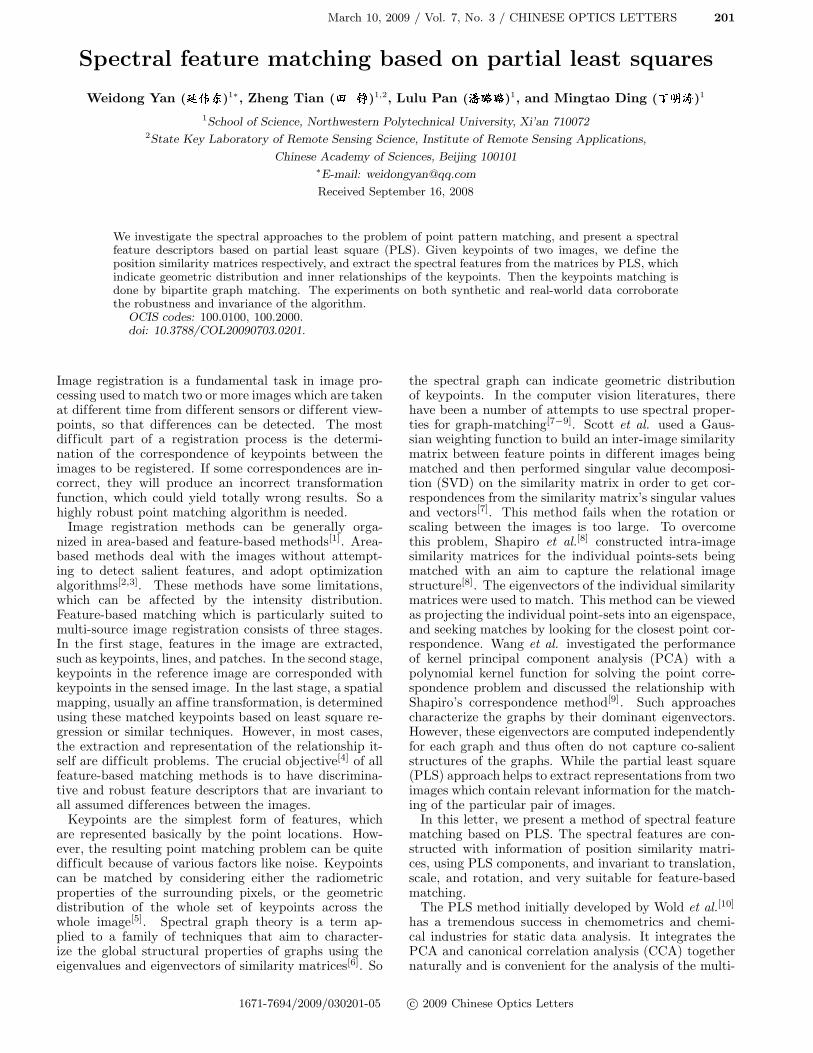
Firstly, we investigated the effect of controlled affineskew of the point sets. The reference point set was ran-domly generated and then transformed by parameters toget the sensed data set. Figure 1 shows the matchingresults of SVD-based matching and PLS-based featurematching. Tables 1 and 2 show the accuracy results ofPLS-based feature matching and SVD-based matchingfor four different transform models. In Fig. 1 and thetables, we define the known translational transforma-tions in x-axis and y-axis as dx and dy, the rotationaltransformation as θ, and the scale transformation as s.From the results, it is obvious that our technique per-mits highly accurate matching results, especially whenthe parameter θ is large. The SVD-based algorithm doesnot cope with large rotation in the image. Small root-mean-square (RMS) errors have been observed in mostcases of different transform models.
Fig. 1. (a) Reference data set and sensed data set without out-liers; (b) SVD-based matching result; (c) PLS-based featurematching result. In (b) and (c), the circles are the referencedata, the crosses are the sensed data. dx = 0.1, dy = 0.2,θ = 20◦, s = 1.1.
Table 1. Accuracy of PLS-Based Feature Matching Using 50 Point-Sets
Ground Truth Matching Results
dx dy θ (rad) s Data Sets dx dy θ (rad) s
0.4 0.5 0.1745 1.1 50 0.4 0.5 0.1745 1.1
0.1 0.2 0.1745 1.2 50 0.1 0.2 0.1745 1.2
0.1 0.2 0.2618 1.1 50 0.1 0.2 0.2618 1.1
0.1 0.2 0.5236 1.1 50 0.1 0.2 0.5236 1.1
RMS Error 0 0 0 0
Table 2. Accuracy of SVD-Based Feature Matching Using 50 Point-Sets
Ground Truth Matching Results
dx dy θ (rad) s Data Sets dx dy θ (rad) s
0.4 0.5 0.1745 1.1 50 0.4003 0.4999 0.1746 1.0992
0.1 0.2 0.1745 1.2 50 0.1035 0.2111 0.1680 1.1930
0.1 0.2 0.2618 1.1 50 0.1237 0.2128 0.2824 1.0845
0.1 0.2 0.5236 1.1 50 0.4307 0.2698 0.9606 1.0567
RMS Error 0.1658 0.0361 0.2188 0.0233
204 CHINESE OPTICS LETTERS / Vol. 7, No. 3 / March 10, 2009
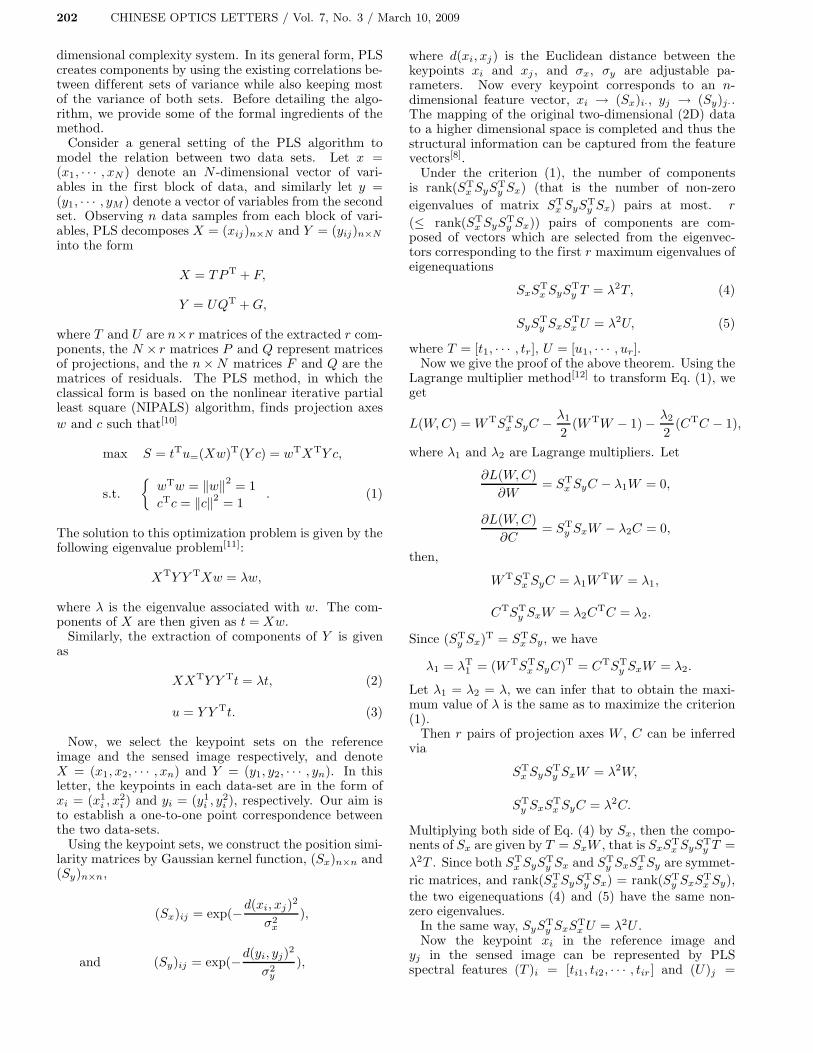
Secondly, we focused on the performance of the algo-rithms when the data were under affine transformationsand contained uncertainties such as outliers and noise.For this purpose, we added noise to the sensed data. Thereference data set was the same as that in the experiment1, and 5 outliers were added to the sensed data set. Theresults are shown in Fig. 2. The PLS-based algorithmpresents a strong ability to eliminate incorrect match-ing. And the total computation time elapsed during thematching process is less than 1 s for 50 points matching.
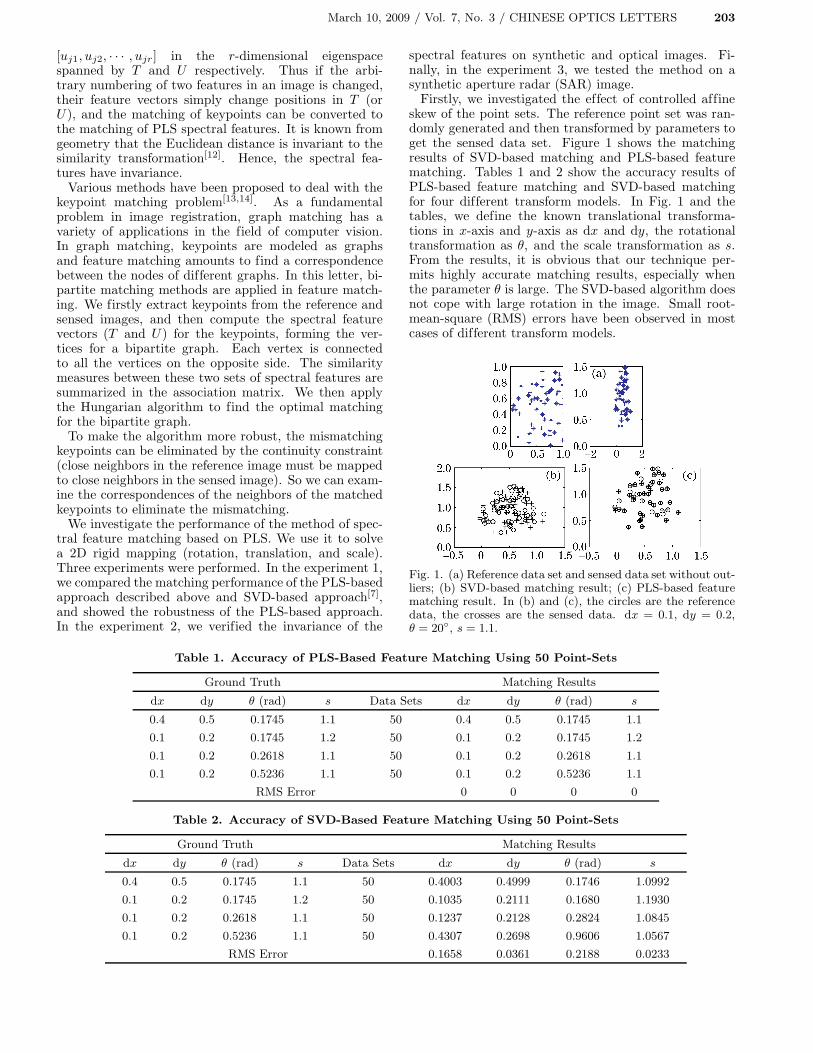
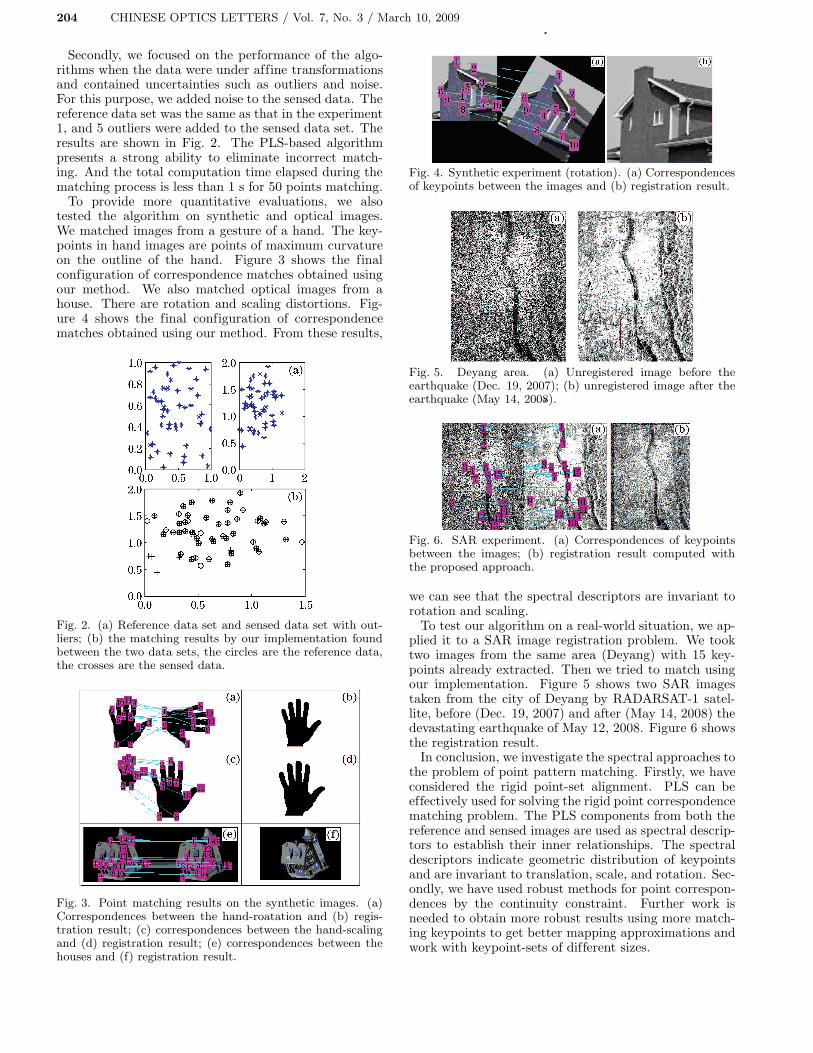
To provide more quantitative evaluations, we alsotested the algorithm on synthetic and optical images.We matched images from a gesture of a hand. The key-points in hand images are points of maximum curvatureon the outline of the hand. Figure 3 shows the finalconfiguration of correspondence matches obtained usingour method. We also matched optical images from ahouse. There are rotation and scaling distortions. Fig-ure 4 shows the final configuration of correspondencematches obtained using our method. From these results,
Fig. 2. (a) Reference data set and sensed data set with out-liers; (b) the matching results by our implementation foundbetween the two data sets, the circles are the reference data,the crosses are the sensed data.
Fig. 3. Point matching results on the synthetic images. (a)Correspondences between the hand-roatation and (b) regis-tration result; (c) correspondences between the hand-scalingand (d) registration result; (e) correspondences between thehouses and (f) registration result.
Fig. 4. Synthetic experiment (rotation). (a) Correspondencesof keypoints between the images and (b) registration result.
Fig. 5. Deyang area. (a) Unregistered image before theearthquake (Dec. 19, 2007); (b) unregistered image after theearthquake (May 14, 2008).
Fig. 6. SAR experiment. (a) Correspondences of keypointsbetween the images; (b) registration result computed withthe proposed approach.
we can see that the spectral descriptors are invariant torotation and scaling.
To test our algorithm on a real-world situation, we ap-plied it to a SAR image registration problem. We tooktwo images from the same area (Deyang) with 15 key-points already extracted. Then we tried to match usingour implementation. Figure 5 shows two SAR imagestaken from the city of Deyang by RADARSAT-1 satel-lite, before (Dec. 19, 2007) and after (May 14, 2008) thedevastating earthquake of May 12, 2008. Figure 6 showsthe registration result.
In conclusion, we investigate the spectral approaches tothe problem of point pattern matching. Firstly, we haveconsidered the rigid point-set alignment. PLS can beeffectively used for solving the rigid point correspondencematching problem. The PLS components from both thereference and sensed images are used as spectral descrip-tors to establish their inner relationships. The spectraldescriptors indicate geometric distribution of keypointsand are invariant to translation, scale, and rotation. Sec-ondly, we have used robust methods for point correspon-dences by the continuity constraint. Further work isneeded to obtain more robust results using more match-ing keypoints to get better mapping approximations andwork with keypoint-sets of different sizes.

March 10, 2009 / Vol. 7, No. 3 / CHINESE OPTICS LETTERS 205
This work was supported by the Northwestern Poly-technical University Doctoral Dissertation InnovationFoundation (No. CX200819), the National Natural Sci-ence Foundation of China (No. 60375003), the Astronau-tics Basal Science Foundation of China (No. 03I53059),and the Science and Technology Innovation Foun-dation of the Northwestern Polytechnical University(No. 2007KJ01033).
References
1. B. Zitova and J. Flusser, Image Vision Comput. 21, 977(2003).
2. X. Yang and J. Pei, Chin. Opt. Lett. 3, 510 (2005).
3. F. Ye, L. Su, and S. Li, Chin. Opt. Lett. 4, 386 (2006).
4. W. Aguilar, Y. Frauel, F. Escolano, M. E. Martinez-Perez, A. Espinosa-Romero, and M. A. Lozano, ImageVision Comput. (to be published).
5. P. Dare and I. Dowman, ISPRS J. Photogramm. RemoteSens. 56, 13 (2001).
6. M. Carcassoni and E. R. Hancock, Pattern Recogn. 36,193 (2003).
7. G. L. Scott and H. C. Longuet-Higgins, Proc. R. Soc.Lond. B 244, 21 (1991).
8. L. S. Shapiro and J. M. Brady, Image Vision Comput.10, 283 (1992).
9. H. Wang and E. Hancock, Lecture Notes in ComputerScience 3138, 361 (2004).
10. S. Wold, H. Ruhe, H. Wold, and W. J. Dunn III, SIAMJ. Sci. Sta. Comput. 5, 735 (1984).
11. A. Hoskuldsson, J. Chemometr. 2, 211 (1988).
12. Q.-S. Sun, Z. Jin, P.-A. Heng, and D.-S. Xia, LectureNotes in Computer Science 3686, 268 (2005).
13. P. J. Besl and N. D. McKay, IEEE Trans. Pattern Anal.Mach. Intell. 14, 239 (1992).
14. Y. Wang, F. Makedon, J. Ford, and H. Huang, in Pro-ceedings of the 26th Annual Int. Conf. IEEE EMBS 4,2972 (2004).


![Assessment of spectrum matching procedure for nonlinear ...An early approach for time domain spectral matching was developed by Kaul [9], and it was extended to multiple damping levels](https://img.dokumen.tips/doc/110x75/61168cd87dc53c4867357e8e/assessment-of-spectrum-matching-procedure-for-nonlinear-an-early-approach-for.jpg)