Embed Size (px)
Citation preview
Leading Your Analytics Driven Customer Team through ChangeLeading Your Analytics Driven Customer Team through Change
SpeakersNick Sorvillo, Nick Sorvillo & Associates
Mike Pommer, VP Analytics, Genpact, Inc.
In this session, learn how the intelligent enterprise gains the ability to constantly look forward,adapt, and continuously push greater effectiveness.
Promotion Optimization Institute Spring 2013 Summit
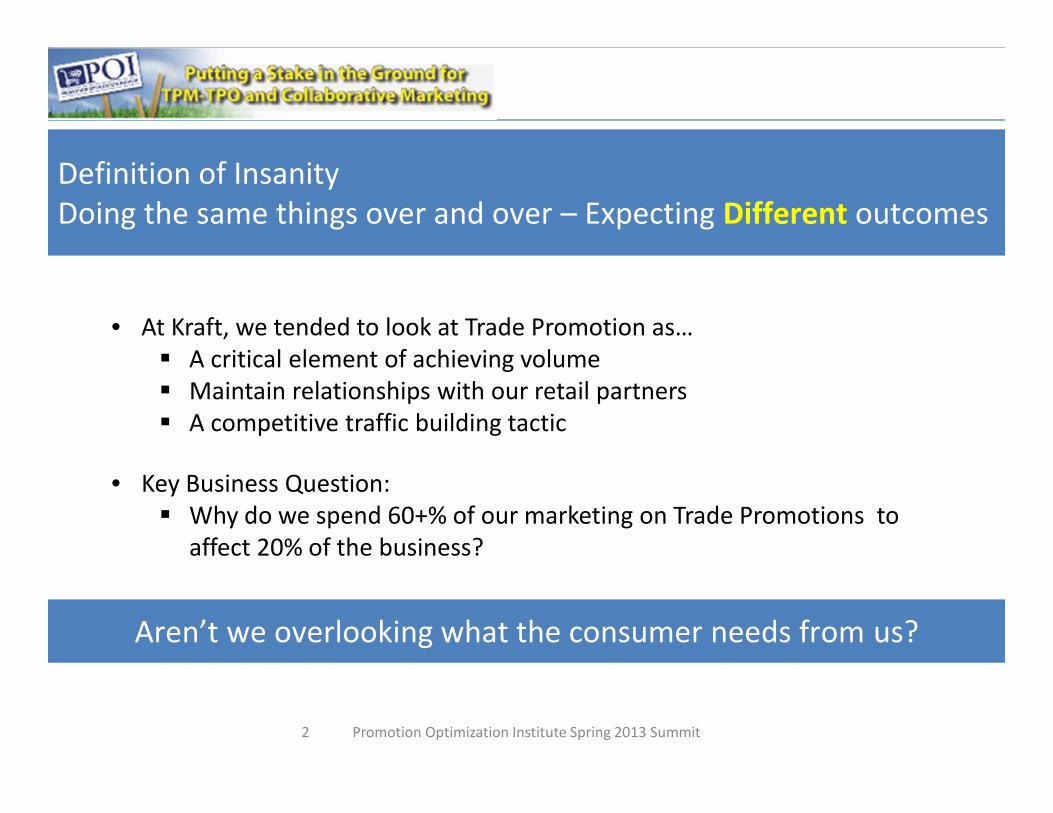
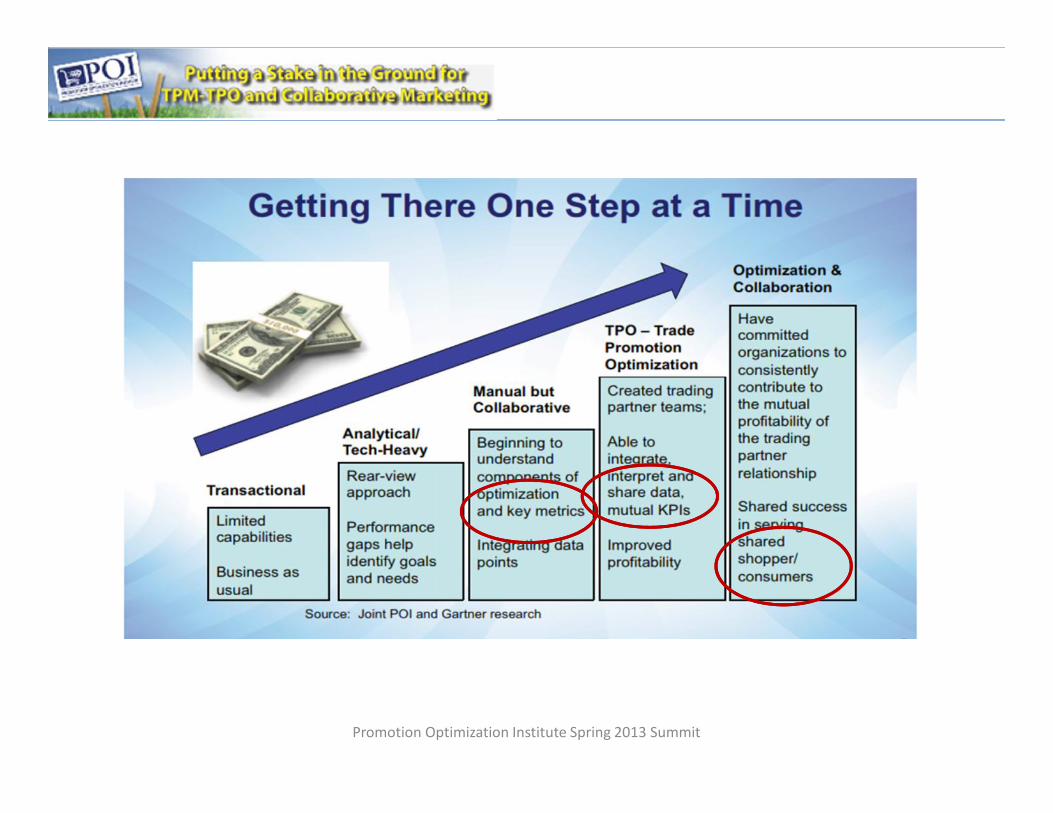
• At Kraft, we tended to look at Trade Promotion as… A critical element of achieving volume Maintain relationships with our retail partners A competitive traffic building tactic
• Key Business Question: Why do we spend 60+% of our marketing on Trade Promotions to
affect 20% of the business?
Definition of InsanityDoing the same things over and over – Expecting Different outcomesDefinition of InsanityDoing the same things over and over – Expecting Different outcomes
Aren’t we overlooking what the consumer needs from us?Aren’t we overlooking what the consumer needs from us?
Promotion Optimization Institute Spring 2013 Summit2

CONSUMERS ARE IN CONTROL: consumers choose media and brandthey want to interact with themselvesCONSUMERS ARE IN CONTROL: consumers choose media and brandthey want to interact with themselvesPromotion Optimization Institute Spring 2013 Summit

Introducing Integrated Business PlanningIntroducing Integrated Business Planning
• Consumer relationships with CPG brands has increasingly become morepersonal Consumers are demanding an understanding of how brands fit into their
lives i.e., “be relevant or perish” Communication touch points have exploded i.e., “be where I am when I
want you” Communities have become “trusted advisors” Products need to provide functional and emotional benefits while
servicing consumers under their rules
• CPG’s opportunity is to harness our insights, delivering the right products, at theright time, in the right venue, through the right communication …
Current Situation And The Opportunities It Provides BrandsCurrent Situation And The Opportunities It Provides Brands
Promotion Optimization Institute Spring 2013 Summit4

Brand Success=
Functional+
Emotional+
Cultural BenefitsPromotion Optimization Institute Spring 2013 Summit5
• Its not enough to affect 20% of the business ..what about the other 80%
• If we really believe in the power of brands, there are alternatives
• Execute against ALL reasons consumers buy through Integrated BusinessPlanning Consider this Practical Example – Kraft Hockeyville
A Case for Change: Its Not About Promotions... Its About IntegratedBusiness PlanningA Case for Change: Its Not About Promotions... Its About IntegratedBusiness Planning
Promotion Optimization Institute Spring 2013 Summit6

Brands Are Evaluating What Will Make A DifferenceFinding “The SOUL” Of The Brand
Commoditization
7
Features, prices,functionaldifferences
Engagedrelationships, digitalseeking
Brand Relevance
Rationalsensory focus
Emotional,social connections
Sense andrespond
Winner:store brands
Winner:national brands,
consumers
Promotion Optimization Institute Spring2013 Summit

Promotion Optimization Institute Spring 2013 Summit8

Promotion Optimization Institute Spring 2013 Summit9
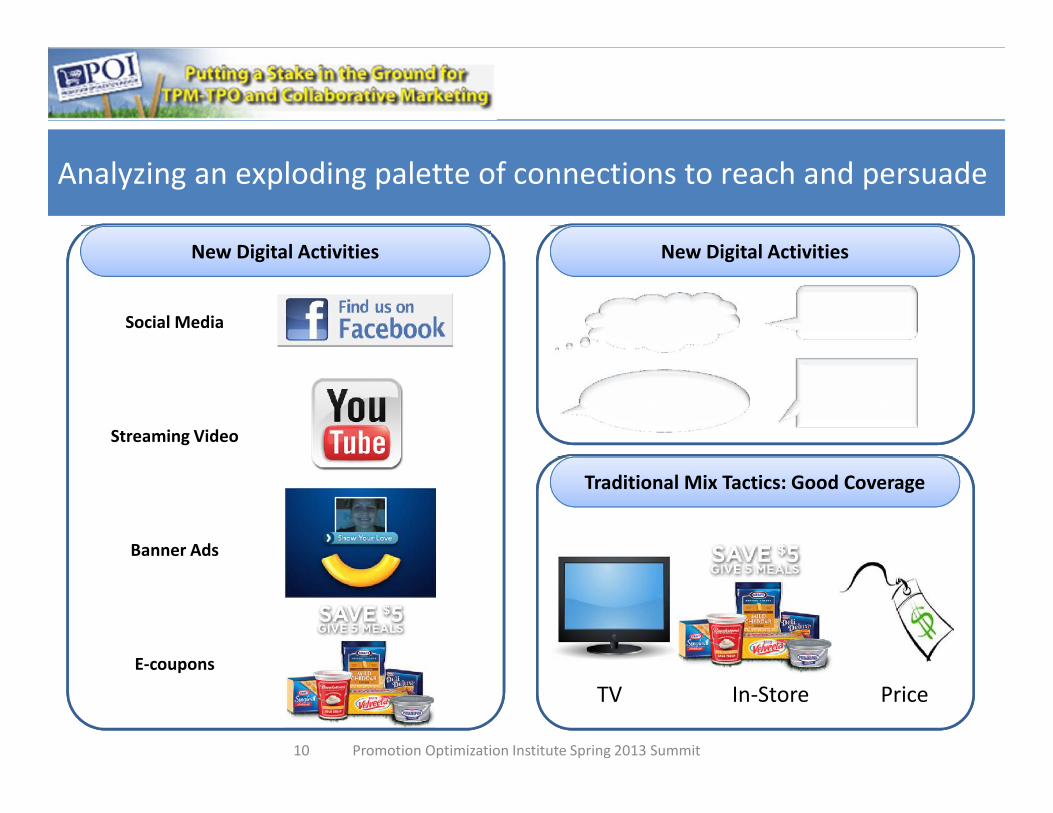
New Digital ActivitiesNew Digital Activities
Analyzing an exploding palette of connections to reach and persuadeAnalyzing an exploding palette of connections to reach and persuade
Promotion Optimization Institute Spring 2013 Summit10
New Digital ActivitiesNew Digital Activities
Conversations Discussions
OpinionsReviews/
Comments
Traditional Mix Tactics: Good CoverageTraditional Mix Tactics: Good Coverage
TV In-Store Price
Social Media
Streaming Video
Banner Ads
E-coupons
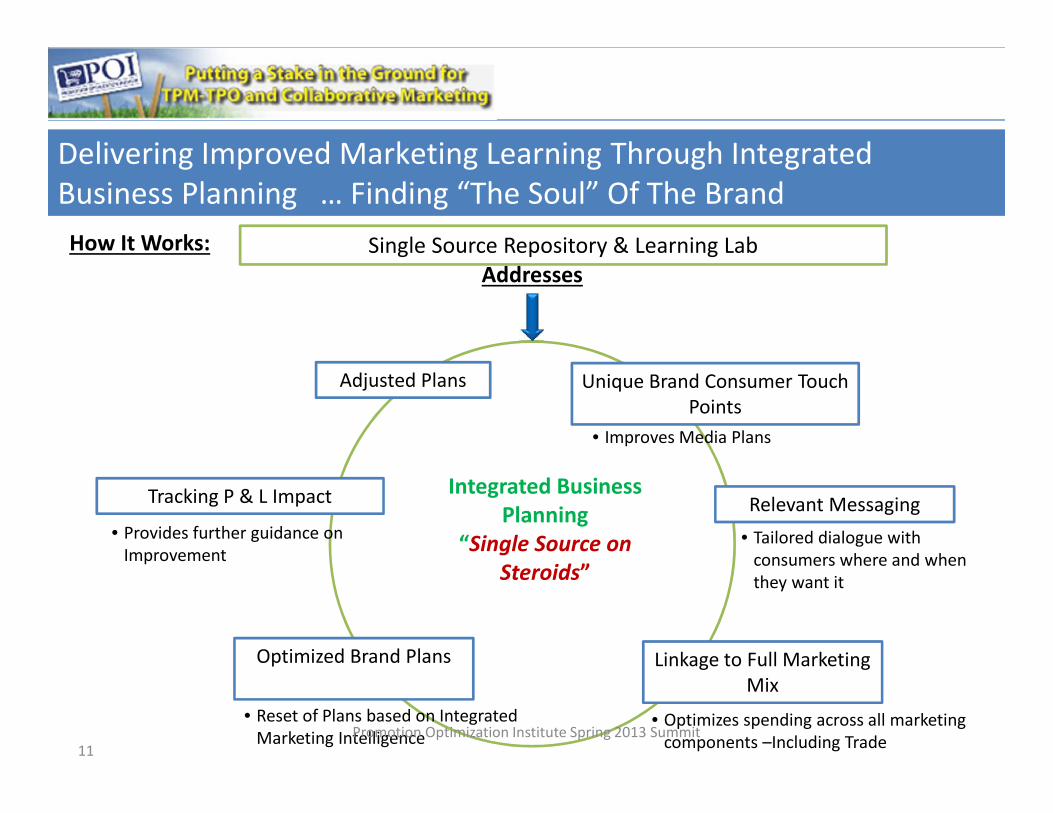
How It Works: Single Source Repository & Learning LabAddresses
Unique Brand Consumer TouchPoints
Relevant Messaging
Linkage to Full MarketingMix
Tracking P & L Impact
Optimized Brand Plans
Adjusted Plans
Integrated BusinessPlanning
“Single Source onSteroids”
• Improves Media Plans
• Tailored dialogue withconsumers where and whenthey want it
• Optimizes spending across all marketingcomponents –Including Trade
• Reset of Plans based on IntegratedMarketing Intelligence
• Provides further guidance onImprovement
11
Delivering Improved Marketing Learning Through IntegratedBusiness Planning … Finding “The Soul” Of The BrandDelivering Improved Marketing Learning Through IntegratedBusiness Planning … Finding “The Soul” Of The Brand
Promotion Optimization Institute Spring 2013 Summit

CONSUMERS ARE TELLING US WHAT THEYWANT.
Promotion Optimization Institute Spring 2013 Summit12

WHAT KIND OF EFFECT WILL YOU HAVE?
Promotion Optimization Institute Spring 2013 Summit13

THE REVOLUTION STARTS HERE.
Promotion Optimization Institute Spring 2013 Summit14
Consumers “Be Relevant In My Life Or Perish”

Leading Your Analytics Driven Customer Team through ChangeLeading Your Analytics Driven Customer Team through Change
SpeakersNick Sorvillo, Nick Sorvillo & Associates
Mike Pommer, VP Analytics, Genpact, Inc.
In this session, learn how the intelligent enterprise gains the ability to constantly look forward,adapt, and continuously push greater effectiveness.
Promotion Optimization Institute Spring 2013 Summit
• In the TPO world we tend to focus on predictive models, lift factors, and financialmetrics
• Analytics can also be applied to the more mundane activities of how things actuallyget done
Process Analytics• Understanding how outcomes, key performance measures, activities and key
performance drivers are linked.• Looking for ways to improve achievement of the KPM’s that are important to you.
• How does your achievement rank against best practice?• What can you do for incremental improvement?
Driving Change - Process AnalyticsDriving Change - Process Analytics
Promotion Optimization Institute Spring 2013 Summit16
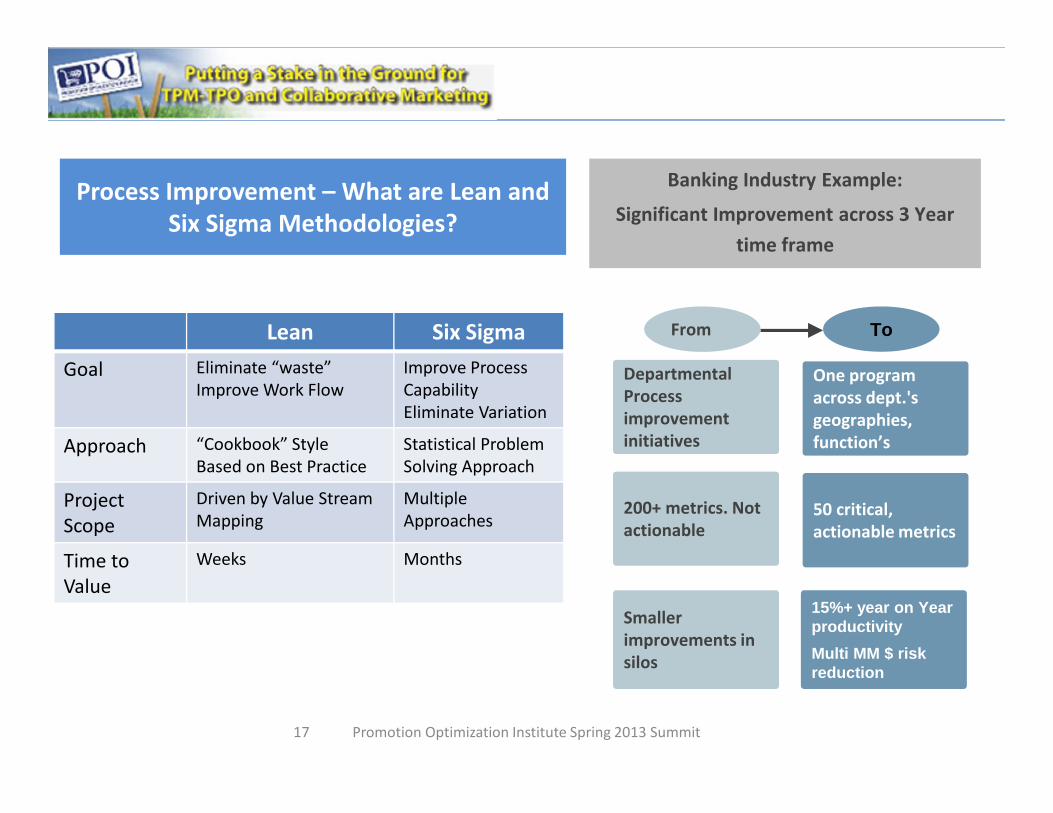
Process Improvement – What are Lean andSix Sigma Methodologies?
Lean Six SigmaGoal Eliminate “waste”
Improve Work FlowImprove ProcessCapabilityEliminate Variation
Approach “Cookbook” StyleBased on Best Practice
Statistical ProblemSolving Approach
ProjectScope
Driven by Value StreamMapping
MultipleApproaches
Time toValue
Weeks Months
Promotion Optimization Institute Spring 2013 Summit17
DepartmentalProcessimprovementinitiatives
One programacross dept.'sgeographies,function’s
200+ metrics. Notactionable
50 critical,actionable metrics
From To
Smallerimprovements insilos
15%+ year on YearproductivityMulti MM $ riskreduction
Banking Industry Example:
Significant Improvement across 3 Yeartime frame
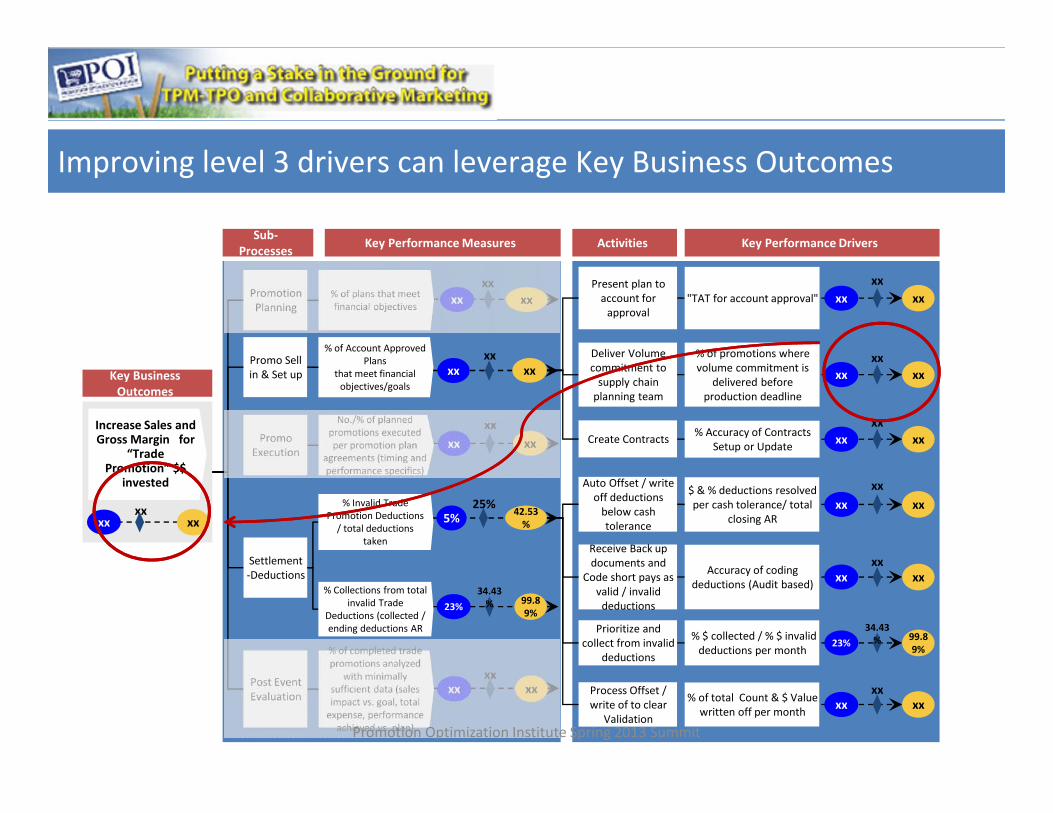
Key BusinessOutcomes
Increase Sales andGross Margin for
“TradePromotion” $$
invested
PromotionPlanning
Promo Sellin & Set up
Settlement-Deductions
Post EventEvaluation
Key Performance MeasuresSub-Processes
xx
xxxx
99.89%
34.43%
xx
5%
23%
xx
42.53%
xx
25%
% of plans that meetfinancial objectives
% of Account ApprovedPlans
that meet financialobjectives/goals
% Invalid TradePromotion Deductions
/ total deductionstaken
% Collections from totalinvalid Trade
Deductions (collected /ending deductions AR
xxxxxx
PromoExecution
xxxx
xx
No./% of plannedpromotions executedper promotion plan
agreements (timing andperformance specifics)
Present plan toaccount for
approval
Key Performance DriversActivities
xxxx
xx
% of completed tradepromotions analyzed
with minimallysufficient data (salesimpact vs. goal, total
expense, performanceachieved vs. plan)
xxxx
xx
Deliver Volumecommitment to
supply chainplanning team
xxxx
xx
Receive Back updocuments and
Code short pays asvalid / invalid
deductions
Prioritize andcollect from invalid
deductions
Auto Offset / writeoff deductions
below cashtolerance
Process Offset /write of to clear
Validation
xxxx
xx
xxxx
xx
99.89%
34.43%23%
xxxx
xx
"TAT for account approval"
% of promotions wherevolume commitment is
delivered beforeproduction deadline
Accuracy of codingdeductions (Audit based)
% $ collected / % $ invaliddeductions per month
$ & % deductions resolvedper cash tolerance/ total
closing AR
% of total Count & $ Valuewritten off per month
Create Contracts xxxx
xx% Accuracy of ContractsSetup or Update
Improving level 3 drivers can leverage Key Business OutcomesImproving level 3 drivers can leverage Key Business Outcomes
Promotion Optimization Institute Spring 2013 Summit
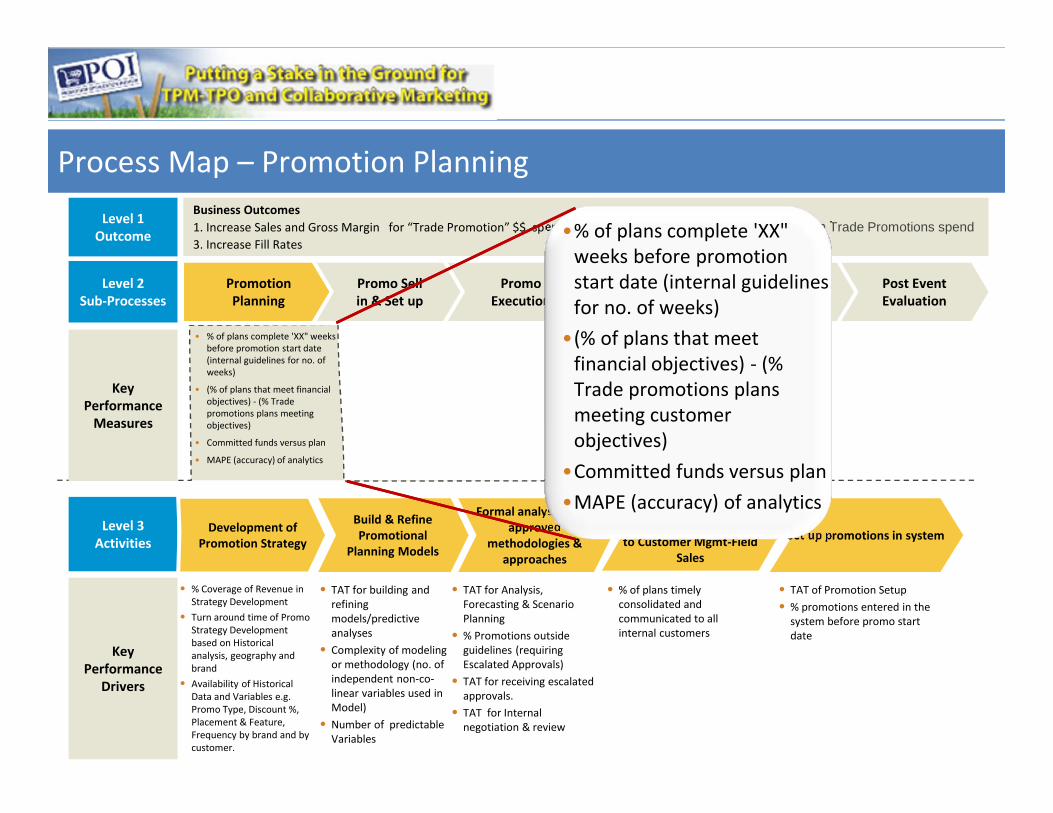
Process Map – Promotion PlanningProcess Map – Promotion PlanningLevel 1
Outcome
Level 2Sub-Processes
Level 3Activities
• % of plans complete 'XX" weeksbefore promotion start date(internal guidelines for no. ofweeks)
• (% of plans that meet financialobjectives) - (% Tradepromotions plans meetingobjectives)
• Committed funds versus plan
• MAPE (accuracy) of analytics
• % Coverage of Revenue inStrategy Development
• Turn around time of PromoStrategy Developmentbased on Historicalanalysis, geography andbrand
• Availability of HistoricalData and Variables e.g.Promo Type, Discount %,Placement & Feature,Frequency by brand and bycustomer.
• TAT for building andrefiningmodels/predictiveanalyses
• Complexity of modelingor methodology (no. ofindependent non-co-linear variables used inModel)
• Number of predictableVariables
• TAT for Analysis,Forecasting & ScenarioPlanning
• % Promotions outsideguidelines (requiringEscalated Approvals)
• TAT for receiving escalatedapprovals.
• TAT for Internalnegotiation & review
Development ofPromotion Strategy
Build & RefinePromotional
Planning Models
Formal analysis usingapproved
methodologies &approaches
Set up promotions in system
Business Outcomes1. Increase Sales and Gross Margin for “Trade Promotion” $$ spent 2. Increased visibility to Trade Promotions spend3. Increase Fill Rates 4. Customer Satisfaction
KeyPerformance
Measures
KeyPerformance
Drivers
PromotionPlanning
Promo Sellin & Set up
PromoExecution
Settlements- Deductions
Settlements- Claims
Post EventEvaluation
Promotion Planpublication and handoffto Customer Mgmt-Field
Sales
• % of plans timelyconsolidated andcommunicated to allinternal customers
• TAT of Promotion Setup• % promotions entered in the
system before promo startdate
•% of plans complete 'XX"weeks before promotionstart date (internal guidelinesfor no. of weeks)
•(% of plans that meetfinancial objectives) - (%Trade promotions plansmeeting customerobjectives)
•Committed funds versus plan•MAPE (accuracy) of analytics
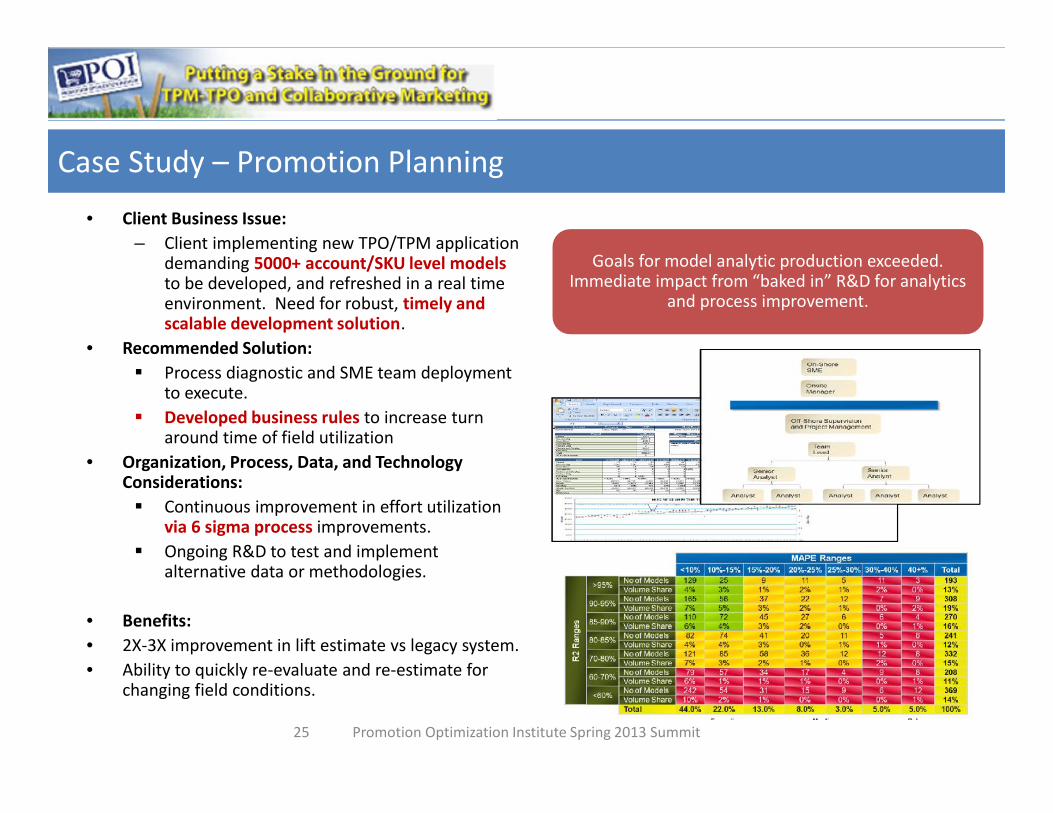
Case Study – Promotion PlanningCase Study – Promotion Planning
Promotion Optimization Institute Spring 2013 Summit20
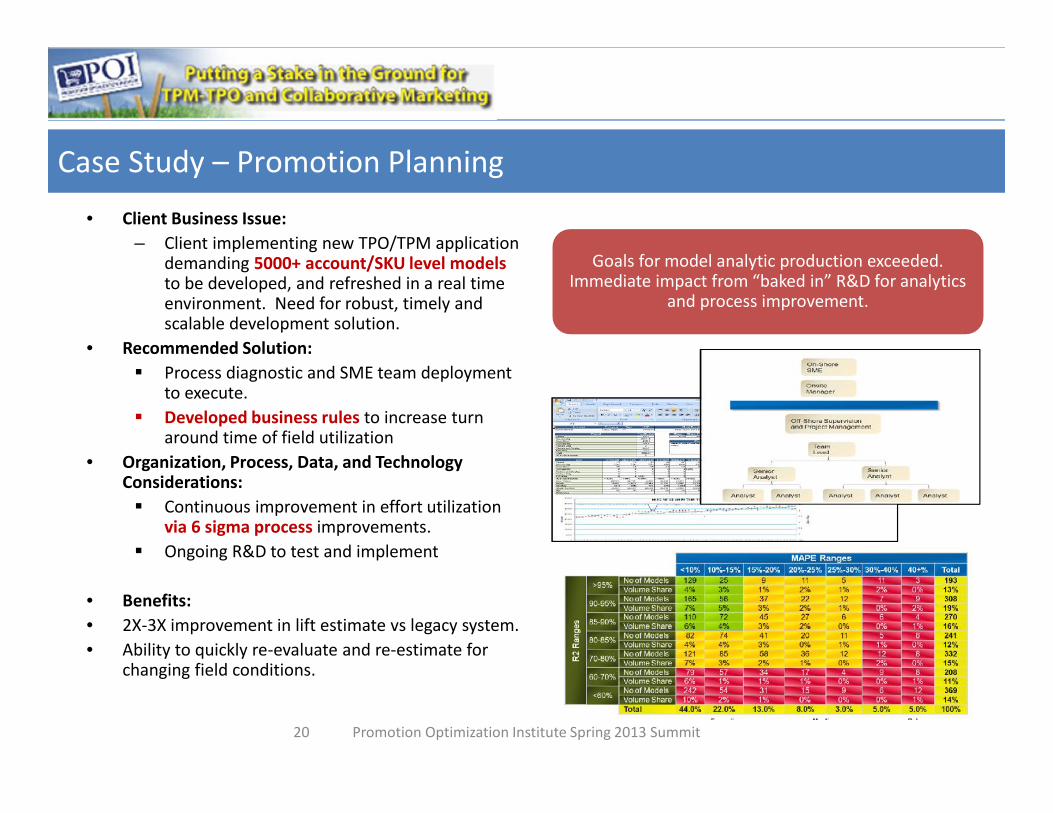
• Client Business Issue:– Client implementing new TPO/TPM application
demanding 5000+ account/SKU level modelsto be developed, and refreshed in a real timeenvironment. Need for robust, timely andscalable development solution.
• Recommended Solution: Process diagnostic and SME team deployment
to execute. Developed business rules to increase turn
around time of field utilization• Organization, Process, Data, and Technology
Considerations: Continuous improvement in effort utilization
via 6 sigma process improvements. Ongoing R&D to test and implement
• Benefits:• 2X-3X improvement in lift estimate vs legacy system.• Ability to quickly re-evaluate and re-estimate for
changing field conditions.
Goals for model analytic production exceeded.Immediate impact from “baked in” R&D for analytics
and process improvement.
Key components of end state
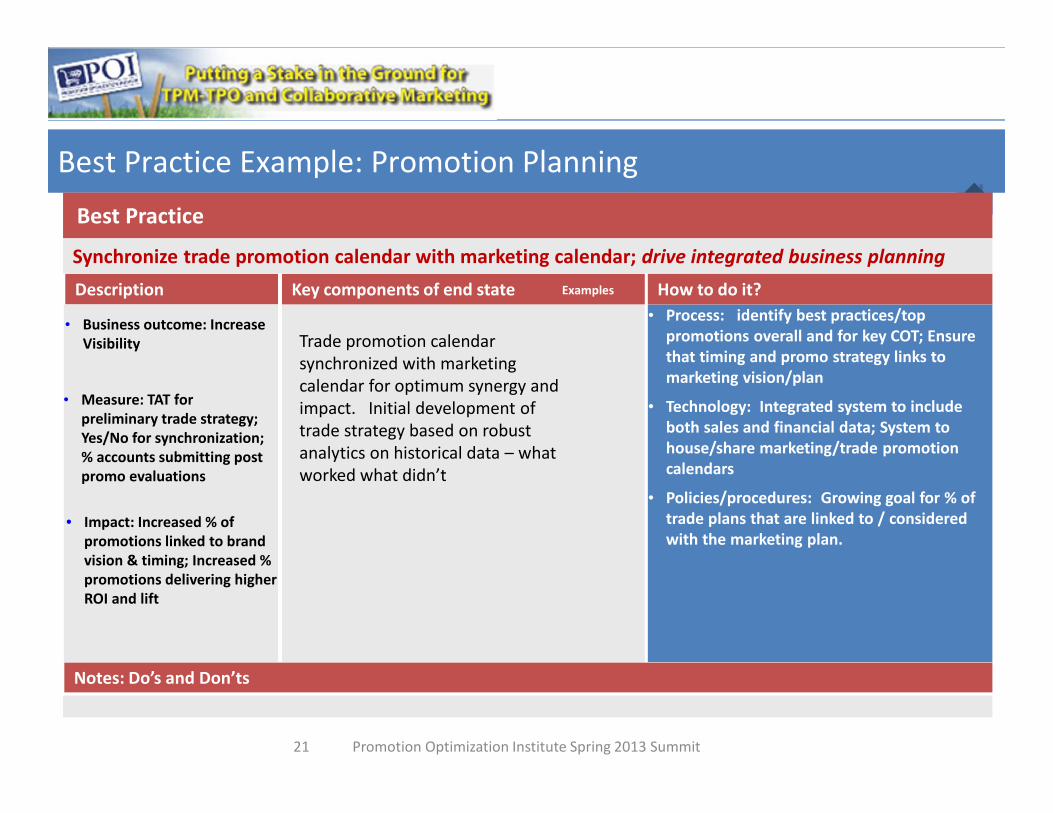
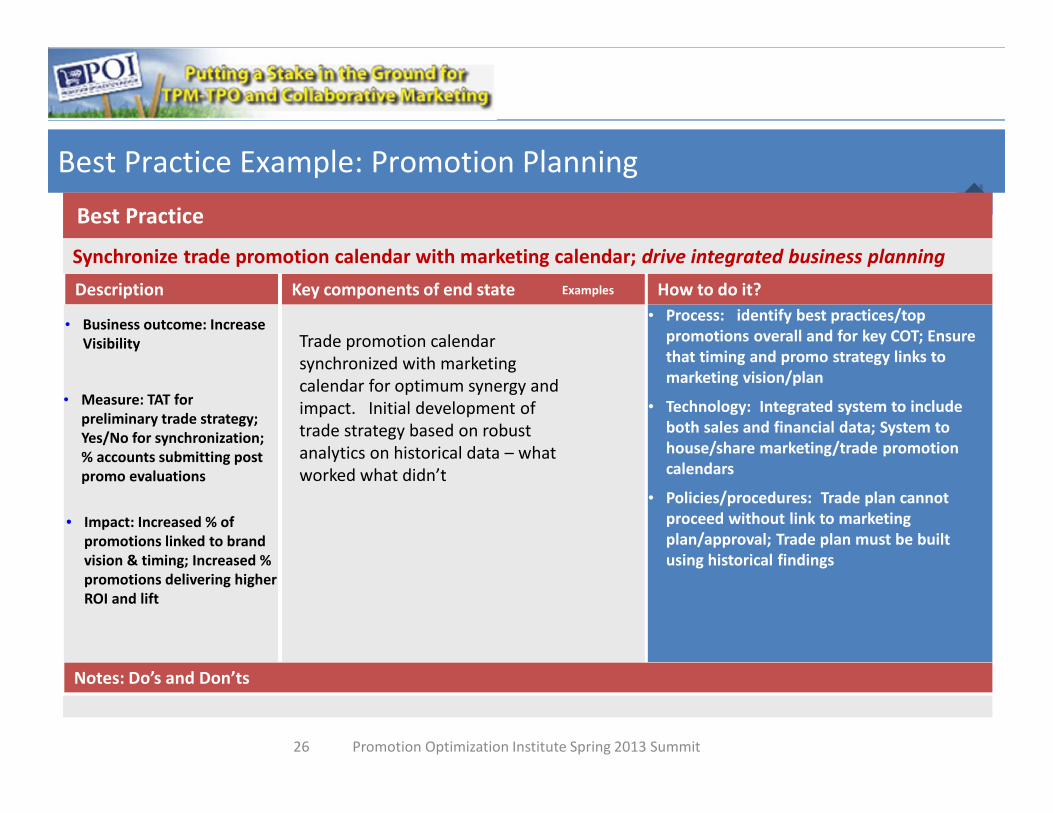
Best Practice Example: Promotion PlanningBest Practice Example: Promotion Planning
Promotion Optimization Institute Spring 2013 Summit21
Description• Process: identify best practices/top
promotions overall and for key COT; Ensurethat timing and promo strategy links tomarketing vision/plan
• Technology: Integrated system to includeboth sales and financial data; System tohouse/share marketing/trade promotioncalendars
• Policies/procedures: Growing goal for % oftrade plans that are linked to / consideredwith the marketing plan.
Synchronize trade promotion calendar with marketing calendar; drive integrated business planning
Best Practice
• Business outcome: IncreaseVisibility
• Measure: TAT forpreliminary trade strategy;Yes/No for synchronization;% accounts submitting postpromo evaluations
• Impact: Increased % ofpromotions linked to brandvision & timing; Increased %promotions delivering higherROI and lift
Notes: Do’s and Don’ts
Examples
Trade promotion calendarsynchronized with marketingcalendar for optimum synergy andimpact. Initial development oftrade strategy based on robustanalytics on historical data – whatworked what didn’t
How to do it?

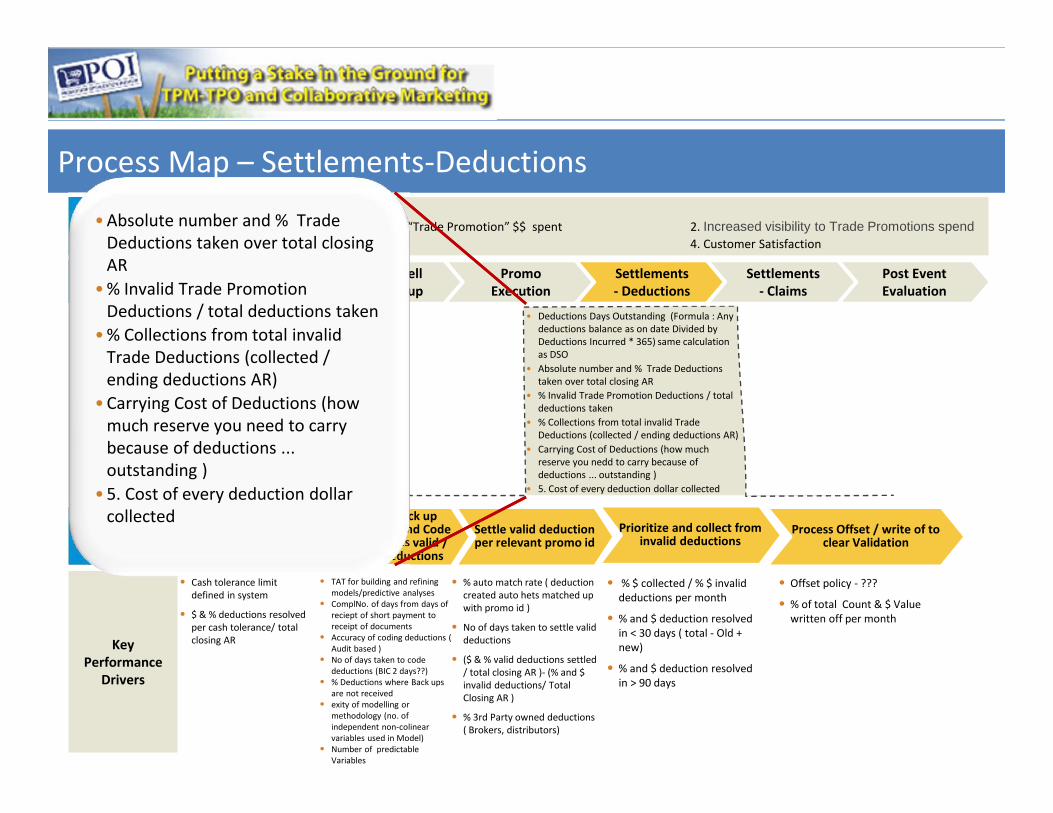
Process Map – Settlements-DeductionsProcess Map – Settlements-DeductionsLevel 1
SEP
Level 2Sub-Processes
Level 3Activities
• Deductions Days Outstanding (Formula : Anydeductions balance as on date Divided byDeductions Incurred * 365) same calculationas DSO
• Absolute number and % Trade Deductionstaken over total closing AR
• % Invalid Trade Promotion Deductions / totaldeductions taken
• % Collections from total invalid TradeDeductions (collected / ending deductions AR)
• Carrying Cost of Deductions (how muchreserve you nedd to carry because ofdeductions ... outstanding )
• 5. Cost of every deduction dollar collected
• Cash tolerance limitdefined in system
• $ & % deductions resolvedper cash tolerance/ totalclosing AR
• TAT for building and refiningmodels/predictive analyses
• ComplNo. of days from days ofreciept of short payment toreceipt of documents
• Accuracy of coding deductions (Audit based )
• No of days taken to codedeductions (BIC 2 days??)
• % Deductions where Back upsare not received
• exity of modelling ormethodology (no. ofindependent non-colinearvariables used in Model)
• Number of predictableVariables
• % auto match rate ( deductioncreated auto hets matched upwith promo id )
• No of days taken to settle validdeductions
• ($ & % valid deductions settled/ total closing AR )- (% and $invalid deductions/ TotalClosing AR )
• % 3rd Party owned deductions( Brokers, distributors)
Auto Offset / writeoff deductions
below cashtolerance
Receive Back updocuments and Codeshort pays as valid /invalid deductions
Settle valid deductionper relevant promo id
Process Offset / write of toclear Validation
Business Outcomes1. Increase Sales and Gross Margin for “Trade Promotion” $$ spent 2. Increased visibility to Trade Promotions spend3. Increase Fill Rates 4. Customer Satisfaction
KeyPerformance
Measures
KeyPerformance
Drivers
PromotionPlanning
Promo Sellin & Set up
PromoExecution
Settlements- Deductions
Settlements- Claims
Post EventEvaluation
Prioritize and collect frominvalid deductions
• % $ collected / % $ invaliddeductions per month
• % and $ deduction resolvedin < 30 days ( total - Old +new)
• % and $ deduction resolvedin > 90 days
• Offset policy -
• % of total Count & $ Valuewritten off per month
• Absolute number and % TradeDeductions taken over total closingAR
• % Invalid Trade PromotionDeductions / total deductions taken
• % Collections from total invalidTrade Deductions (collected /ending deductions AR)
• Carrying Cost of Deductions (howmuch reserve you need to carrybecause of deductions outstanding )
• Cost of every deduction dollarcollected
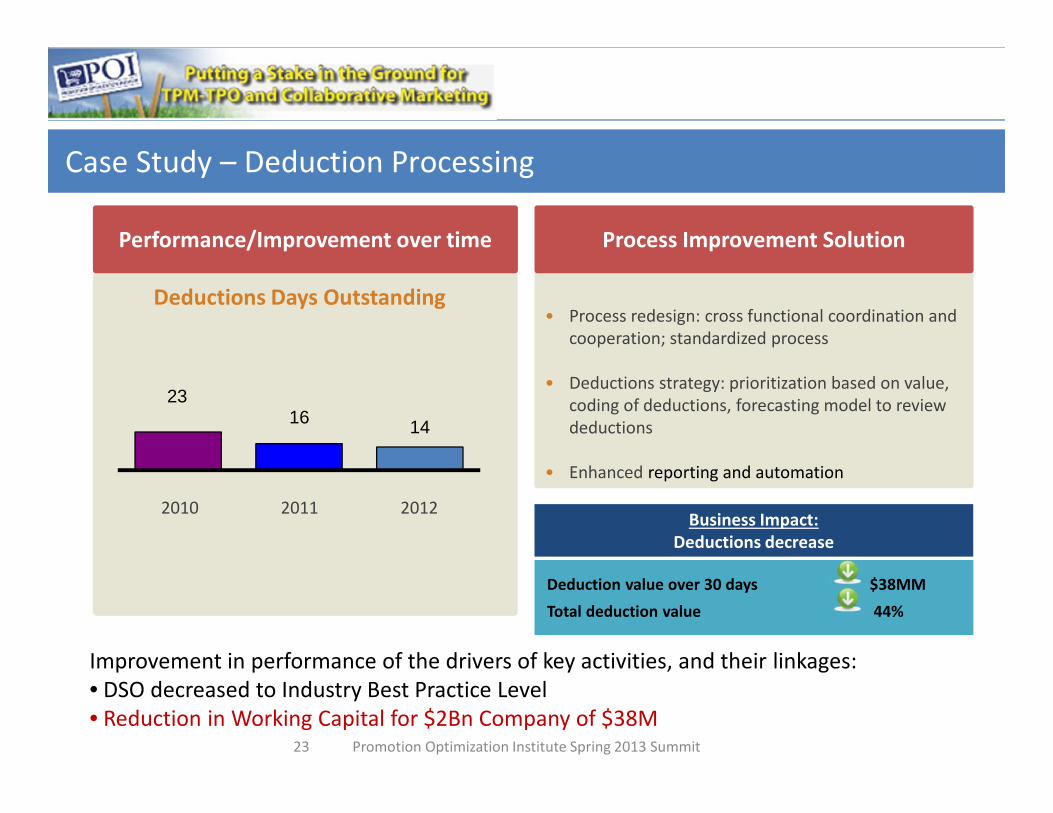
Case Study – Deduction ProcessingCase Study – Deduction Processing
Promotion Optimization Institute Spring 2013 Summit23
• Process redesign: cross functional coordination andcooperation; standardized process
• Deductions strategy: prioritization based on value,coding of deductions, forecasting model to reviewdeductions
• Enhanced reporting and automation
Performance/Improvement over time Process Improvement Solution
Deductions Days Outstanding
2316 14
2010 2011 2012
Deduction value over 30 days $38MMTotal deduction value 44%
Business Impact:Deductions decrease
Improvement in performance of the drivers of key activities, and their linkages:• DSO decreased to Industry Best Practice Level• Reduction in Working Capital for $2Bn Company of $38M
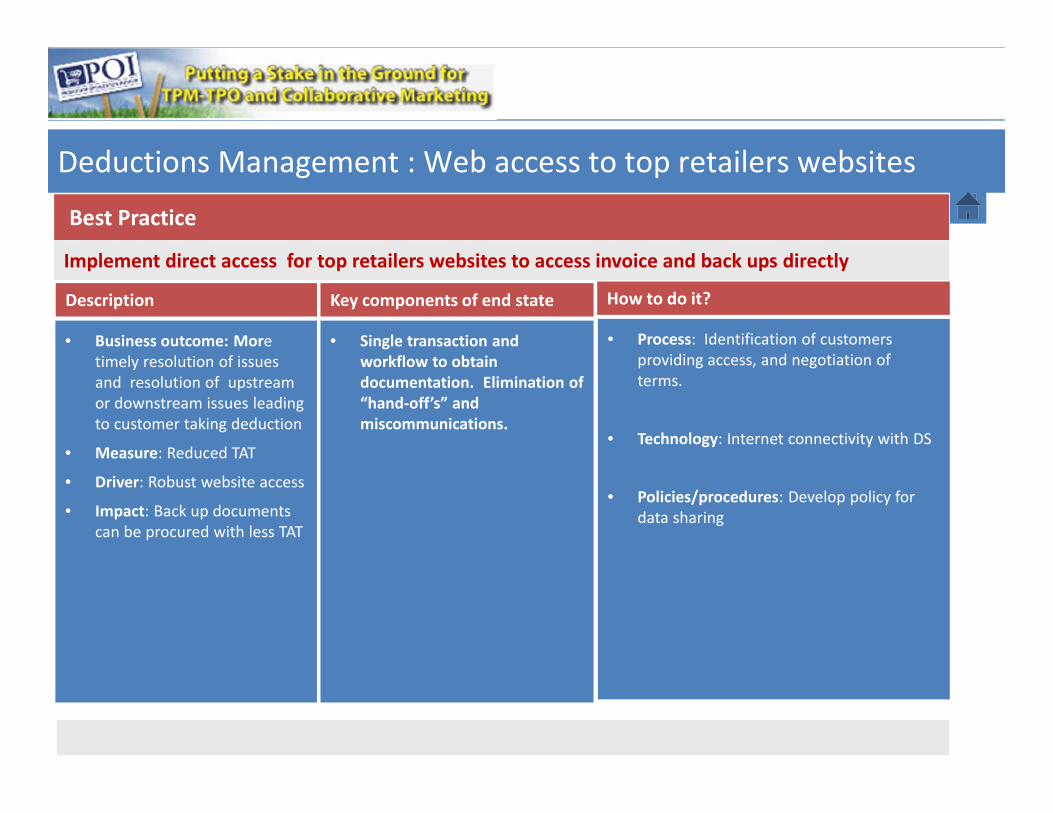
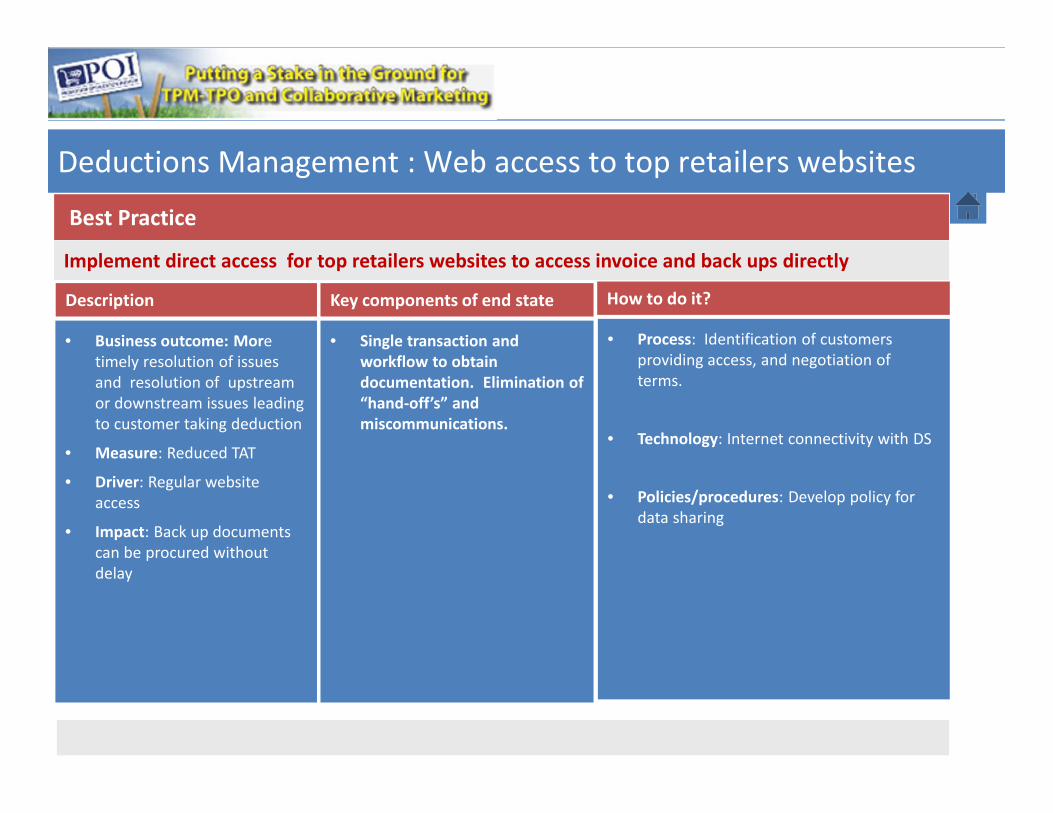
Deductions Management : Web access to top retailers websitesDeductions Management : Web access to top retailers websites
Promotion Optimization Institute Spring 2013 Summit24
Best Practice
Implement direct access for top retailers websites to access invoice and back ups directly
How to do it?Description Key components of end state
• Process: Identification of customersproviding access, and negotiation ofterms.
• Technology: Internet connectivity with DS
• Policies/procedures: Develop policy fordata sharing
• Single transaction andworkflow to obtaindocumentation. Elimination of“hand-off’s” andmiscommunications.
• Business outcome: Moretimely resolution of issuesand resolution of upstreamor downstream issues leadingto customer taking deduction
• Measure: Reduced TAT
• Driver: Robust website access
• Impact: Back up documentscan be procured with less TAT
Case Study – Promotion PlanningCase Study – Promotion Planning
Promotion Optimization Institute Spring 2013 Summit25
• Client Business Issue:– Client implementing new TPO/TPM application
demanding 5000+ account/SKU level modelsto be developed, and refreshed in a real timeenvironment. Need for robust, timely andscalable development solution.
• Recommended Solution: Process diagnostic and SME team deployment
to execute. Developed business rules to increase turn
around time of field utilization• Organization, Process, Data, and Technology
Considerations: Continuous improvement in effort utilization
via 6 sigma process improvements. Ongoing R&D to test and implement
alternative data or methodologies.
• Benefits:• 2X-3X improvement in lift estimate vs legacy system.• Ability to quickly re-evaluate and re-estimate for
changing field conditions.
Goals for model analytic production exceeded.Immediate impact from “baked in” R&D for analytics
and process improvement.
Key components of end state
Best Practice Example: Promotion PlanningBest Practice Example: Promotion Planning
Promotion Optimization Institute Spring 2013 Summit26
Description• Process: identify best practices/top
promotions overall and for key COT; Ensurethat timing and promo strategy links tomarketing vision/plan
• Technology: Integrated system to includeboth sales and financial data; System tohouse/share marketing/trade promotioncalendars
• Policies/procedures: Trade plan cannotproceed without link to marketingplan/approval; Trade plan must be builtusing historical findings
Synchronize trade promotion calendar with marketing calendar; drive integrated business planning
Best Practice
• Business outcome: IncreaseVisibility
• Measure: TAT forpreliminary trade strategy;Yes/No for synchronization;% accounts submitting postpromo evaluations
• Impact: Increased % ofpromotions linked to brandvision & timing; Increased %promotions delivering higherROI and lift
Notes: Do’s and Don’ts
Examples
Trade promotion calendarsynchronized with marketingcalendar for optimum synergy andimpact. Initial development oftrade strategy based on robustanalytics on historical data – whatworked what didn’t
How to do it?
Process Map – Settlements-DeductionsProcess Map – Settlements-DeductionsLevel 1
SEP
Level 2Sub-Processes
Level 3Activities
• Deductions Days Outstanding (Formula : Anydeductions balance as on date Divided byDeductions Incurred * 365) same calculationas DSO
• Absolute number and % Trade Deductionstaken over total closing AR
• % Invalid Trade Promotion Deductions / totaldeductions taken
• % Collections from total invalid TradeDeductions (collected / ending deductions AR)
• Carrying Cost of Deductions (how muchreserve you nedd to carry because ofdeductions ... outstanding )
• 5. Cost of every deduction dollar collected
• Cash tolerance limitdefined in system
• $ & % deductions resolvedper cash tolerance/ totalclosing AR
• TAT for building and refiningmodels/predictive analyses
• ComplNo. of days from days ofreciept of short payment toreceipt of documents
• Accuracy of coding deductions (Audit based )
• No of days taken to codedeductions (BIC 2 days??)
• % Deductions where Back upsare not received
• exity of modelling ormethodology (no. ofindependent non-colinearvariables used in Model)
• Number of predictableVariables
• % auto match rate ( deductioncreated auto hets matched upwith promo id )
• No of days taken to settle validdeductions
• ($ & % valid deductions settled/ total closing AR )- (% and $invalid deductions/ TotalClosing AR )
• % 3rd Party owned deductions( Brokers, distributors)
Auto Offset / writeoff deductions
below cashtolerance
Receive Back updocuments and Codeshort pays as valid /invalid deductions
Settle valid deductionper relevant promo id
Process Offset / write of toclear Validation
Business Outcomes1. Increase Sales and Gross Margin for “Trade Promotion” $$ spent 2. Increased visibility to Trade Promotions spend3. Increase Fill Rates 4. Customer Satisfaction
KeyPerformance
Measures
KeyPerformance
Drivers
PromotionPlanning
Promo Sellin & Set up
PromoExecution
Settlements- Deductions
Settlements- Claims
Post EventEvaluation
Prioritize and collect frominvalid deductions
• % $ collected / % $ invaliddeductions per month
• % and $ deduction resolvedin < 30 days ( total - Old +new)
• % and $ deduction resolvedin > 90 days
• Offset policy - ???
• % of total Count & $ Valuewritten off per month
• Absolute number and % TradeDeductions taken over total closingAR
• % Invalid Trade PromotionDeductions / total deductions taken
• % Collections from total invalidTrade Deductions (collected /ending deductions AR)
• Carrying Cost of Deductions (howmuch reserve you need to carrybecause of deductions ...outstanding )
• 5. Cost of every deduction dollarcollected

Case Study – Deduction ProcessingCase Study – Deduction Processing
Promotion Optimization Institute Spring 2013 Summit28
• Process redesign: cross functional coordination andcooperation; standardized process
• Deductions strategy: prioritization based on value,coding of deductions, forecasting model to reviewdeductions
• Enhanced reporting and automation
Performance/Improvement over time Process Improvement Solution
Deductions Days Outstanding
2316 14
2010 2011 2012
Deduction value over 30 days $38MMTotal deduction value 44%
Business Impact:Deductions decrease
Improvement in performance of the drivers of key activities, and their linkages:• DSO decreased to Industry Best Practice Level• Reduction in Working Capital for $2Bn Company of $38M
Deductions Management : Web access to top retailers websitesDeductions Management : Web access to top retailers websites
Promotion Optimization Institute Spring 2013 Summit29
Best Practice
Implement direct access for top retailers websites to access invoice and back ups directly
How to do it?Description Key components of end state
• Process: Identification of customersproviding access, and negotiation ofterms.
• Technology: Internet connectivity with DS
• Policies/procedures: Develop policy fordata sharing
• Single transaction andworkflow to obtaindocumentation. Elimination of“hand-off’s” andmiscommunications.
• Business outcome: Moretimely resolution of issuesand resolution of upstreamor downstream issues leadingto customer taking deduction
• Measure: Reduced TAT
• Driver: Regular websiteaccess
• Impact: Back up documentscan be procured withoutdelay
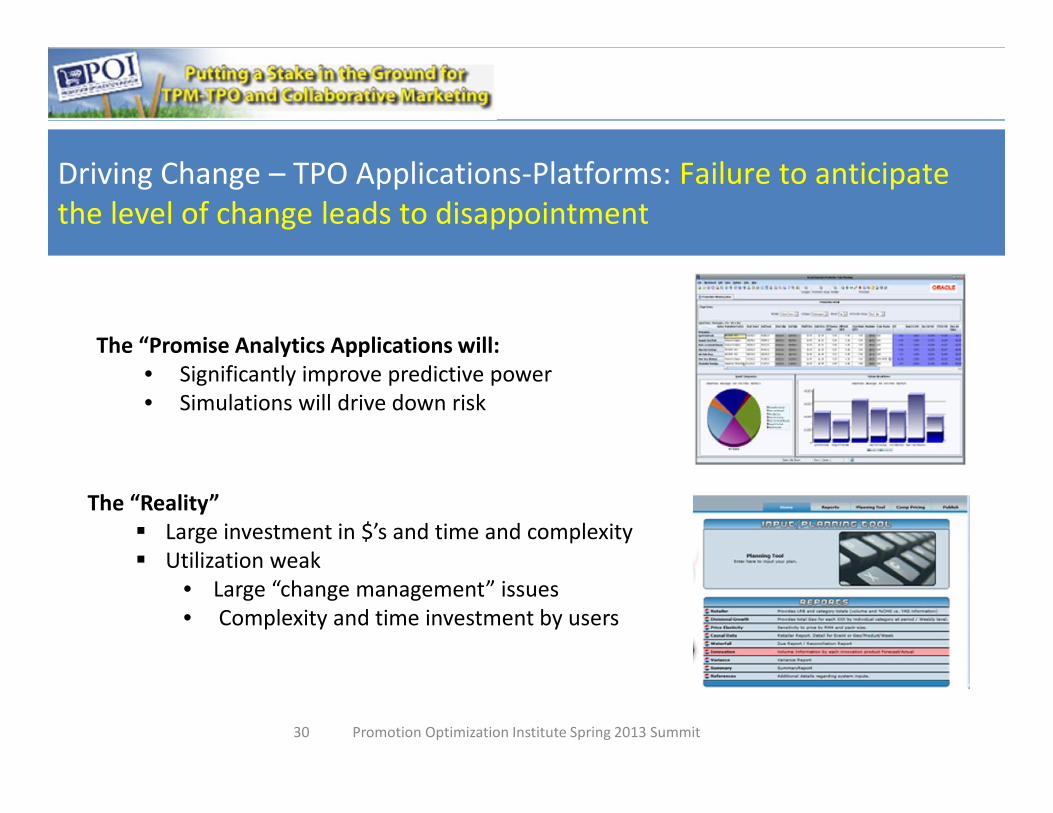
The “Promise Analytics Applications will:• Significantly improve predictive power• Simulations will drive down risk
The “Reality” Large investment in $’s and time and complexity Utilization weak
• Large “change management” issues• Complexity and time investment by users
Driving Change – TPO Applications-Platforms: Failure to anticipatethe level of change leads to disappointmentDriving Change – TPO Applications-Platforms: Failure to anticipatethe level of change leads to disappointment
Promotion Optimization Institute Spring 2013 Summit30
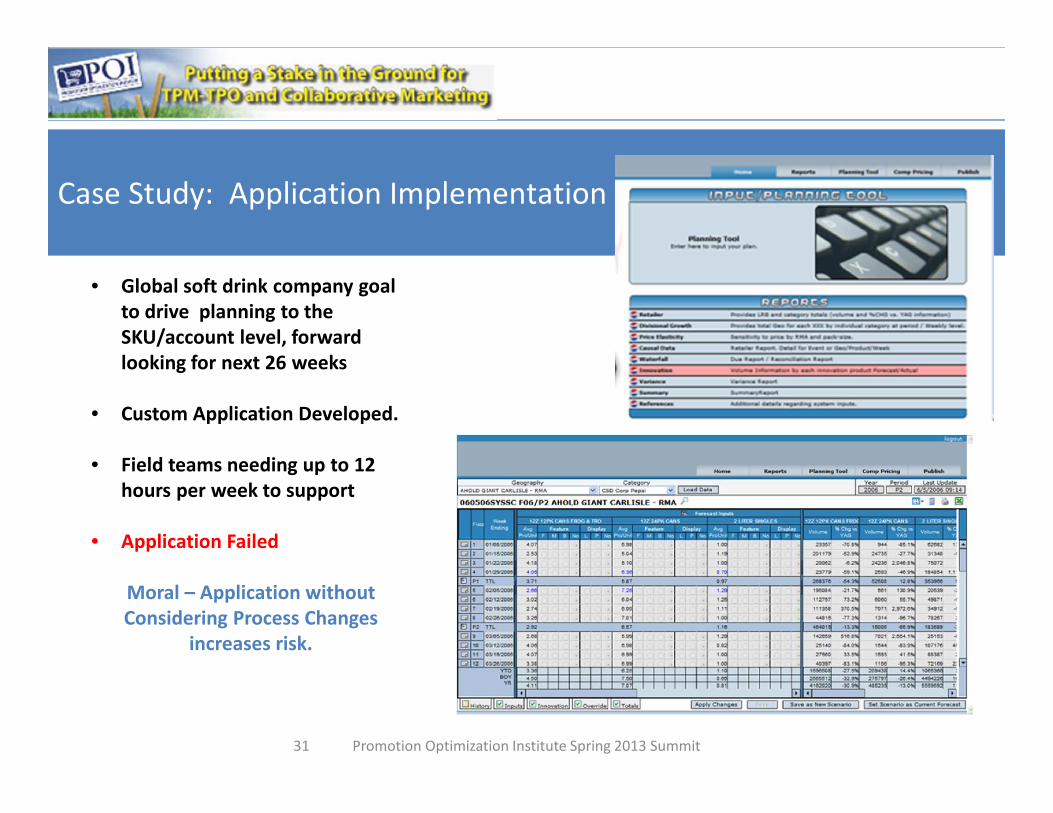
• Global soft drink company goalto drive planning to theSKU/account level, forwardlooking for next 26 weeks
• Custom Application Developed.
• Field teams needing up to 12hours per week to support
• Application Failed
Moral – Application withoutConsidering Process Changes
increases risk.
Case Study: Application ImplementationCase Study: Application Implementation
Promotion Optimization Institute Spring 2013 Summit31

Analytics - DataAnalytics - Data
Best Practice Implications for Driving Change
Too Much Data..Too Little Understanding
• Analyze the entire data Eco System (cause and effect) Focus on data that drives the important KPI’s
• Define merchandising variables that drive results.
• Evaluate consumer oriented KPI’s… After all they call theplays
• Develop continuous insight .. We are in an ever changingworld Promotion Optimization Institute Spring 2013 Summit
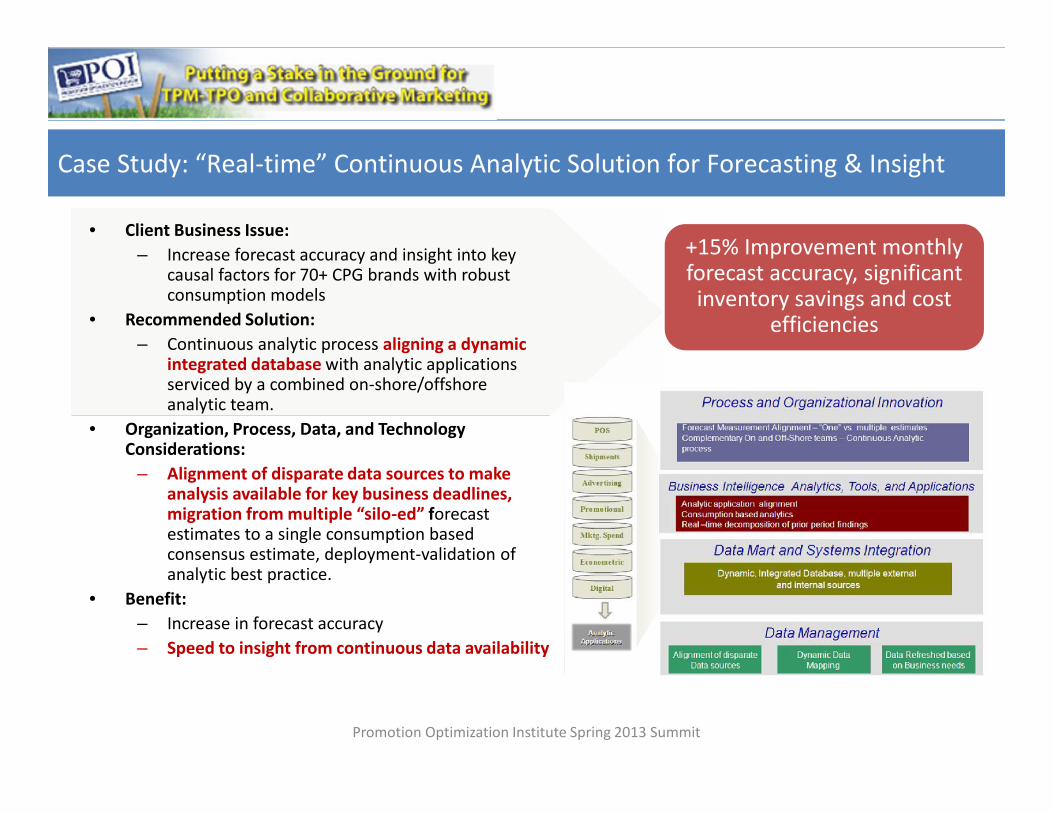
Case Study: “Real-time” Continuous Analytic Solution for Forecasting & InsightCase Study: “Real-time” Continuous Analytic Solution for Forecasting & Insight
• Client Business Issue:– Increase forecast accuracy and insight into key
causal factors for 70+ CPG brands with robustconsumption models
• Recommended Solution:– Continuous analytic process aligning a dynamic
integrated database with analytic applicationsserviced by a combined on-shore/offshoreanalytic team.
• Organization, Process, Data, and TechnologyConsiderations:
– Alignment of disparate data sources to makeanalysis available for key business deadlines,migration from multiple “silo-ed” forecastestimates to a single consumption basedconsensus estimate, deployment-validation ofanalytic best practice.
• Benefit:– Increase in forecast accuracy– Speed to insight from continuous data availability
+15% Improvement monthlyforecast accuracy, significantinventory savings and cost
efficiencies
Promotion Optimization Institute Spring 2013 Summit
Promotion Optimization Institute Spring 2013 Summit
Thank You!Thank You!
Promotion Optimization Institute Spring 2013 Summit35