Embed Size (px)
Citation preview
MARINE ECOLOGY PROGRESS SERIESMar Ecol Prog Ser
Vol. 511: 41–58, 2014doi: 10.3354/meps10933
Published September 24
INTRODUCTION
Factors influencing the spatial and temporal pat-terns of marine nitrification and nitrifying microbesare poorly understood. Until recently, it was assumedthat ammonia-oxidising bacteria (AOB) were solelyresponsible for the first step of nitrification. TheAOB-centric viewpoint of ammonia oxidisation waschallenged when genes similar to the ammoniamonooxygenase genes of bacteria were discoveredwithin archaeal scaffolds in both marine waters
(Venter et al. 2004) and soils (Treusch et al. 2005,Leininger et al. 2006). Ammonia-oxidising archaea(AOA) 16S rRNA and amoA genes have now beendetected in wastewater sludge (Mußmann et al.2011), in coastal aquifers (Santoro et al. 2008) andwithin the marine environment in corals (Beman etal. 2007), sponges (Steger et al. 2008), sediments(Francis et al. 2005, Caffrey et al. 2007, Mosier &Francis 2008, Abell et al. 2010, Bernhard et al. 2010)and coastal and open waters (e.g. Francis et al. 2005,Wuchter et al. 2006, Beman et al. 2008).
© Inter-Research 2014 · www.int-res.com*Corresponding author: [email protected]
Spatio-temporal variability in ammonia oxidationand ammonia-oxidising bacteria and archaea in
coastal sediments of the western English Channel
K. Tait1,*, V. Kitidis1, B. B. Ward2, D. G. Cummings1, M. R. Jones1, P. J. Somerfield1, S. Widdicombe1
1Plymouth Marine Laboratory, Prospect Place, Plymouth, PL1 3DH, UK2Department of Geosciences, Guyot Hall, Princeton University, Princeton, NJ 08544, USA
ABSTRACT: The abundance of ammonia-oxidising bacterial (AOB) and ammonia-oxidisingarchaeal (AOA) (amoA) genes and ammonia oxidation rates were compared bimonthly from July2008 to May 2011 in 4 contrasting coastal sediments in the western English Channel. Despite ahigher abundance of AOA amoA genes within all sediments and at all time-points, rates of ammo-nia oxidation correlated with AOB and not AOA amoA gene abundance. Sediment type was amajor factor in determining both AOB amoA gene abundance and AOB community structure, pos-sibly due to deeper oxygen penetration into the sandier sediments, increasing the area availablefor ammonia oxidation. Decreases in AOB amoA gene abundance were evident during summerand autumn, with maximum abundance and ammonia oxidation rates occurring in winter andearly spring. PCR-DGGE of AOB amoA genes indicated that no seasonal changes to communitycomposition occurred; however, a gradual movement in community composition occurred at 3 ofthe sites studied. The lack of correlation between AOA amoA gene abundance and ammoniumoxidation rates, or any other environmental variable measured, may be related to the higher spa-tial variation amongst measurements, obscuring temporal trends, or the bimonthly sampling,which may have been too infrequent to capture temporal variability in the deposition of freshorganic matter. Alternatively, AOA may respond to changing substrate concentrations by anincrease or decrease in transcript rather than gene abundance.
KEY WORDS: Coastal · Sediment · Ammonia oxidation · Archaeal amoA gene · Bacteria amoAgene
Resale or republication not permitted without written consent of the publisher
Mar Ecol Prog Ser 511: 41–58, 2014
AOA consistently outnumber the AOB in pelagicsystems (Coolen et al. 2007, Lam et al. 2007, Minceret al. 2007, Bouskill et al. 2012, Horak et al. 2013),and there is substantial evidence to suggest that theAOA are the dominant nitrifiers in oceanic waters(Wuchter et al. 2006, Beman et al. 2008). However,the relative contribution of AOA and AOB to nitrifi-cation within sediments is less clear. The ratio ofAOA:AOB appears to be highly variable with severalstudies reporting higher abundance of AOA amoAgenes (Caffrey et al. 2007, Abell et al. 2010, Bernhardet al. 2010, Tait et al. 2014), whereas others havereported higher incidences of AOB relative to AOAamoA genes (Caffrey et al. 2007, Mosier & Francis2008, Santoro et al. 2008, Wankel et al. 2011, Zhenget al. 2014). These differences in the relative abun-dance of AOA and AOB have been attributed to anumber of factors, including salinity, temperature,ammonium concentration, dissolved oxygen, pore-water sulphide concentrations and pH (Santoro et al.2008, Abell et al. 2010, Biller et al. 2012, Bouskill etal. 2012, Dang et al. 2010, Tait et al. 2014). Salinityhas been demonstrated to be a major factor influenc-ing both nitrification rates (Seitzinger et al. 1991,Rysgaard et al. 1999), the abundance of AOA andAOB within sediments (Caffrey et al. 2007, Santoro etal. 2008, Bernhard et al. 2010) and the communitystructure of AOB (Francis et al. 2003, Bernhard et al.2005, Mosier & Francis 2008, Bouskill et al. 2011, Jinet al. 2011) and AOA (Francis et al. 2005, Mosier &Francis 2008, Abell et al. 2010, Biller et al. 2012, Caoet al. 2013). For example, in a study of the relativeabundance of AOA and AOB amoA genes in 6 dif -ferent estuaries, Caffrey et al. (2007) reported abun-dance of AOA amoA genes to be positively cor -related with salinity. In contrast, coastal aquifersediment samples taken along a salinity gradientindicated AOB amoA gene abundance decreasedwith decreasing salinity, whereas AOA amoA genecopy numbers were relatively constant (Santoro et al.2008). Biller et al. (2012) were able to show that 60%of the variation in aquatic AOA amoA sequencetypes corresponded to salinity. Although a high per-centage, this highlights that additional environmen-tal variables also significantly influence the distribu-tion of AOA ecotypes in aquatic environments.
The contribution of AOA to nitrification, relative tothe AOB, is also not well understood. For example,Caffrey et al. (2007) showed a significant relationshipbetween potential nitrification rates and AOA amoAabundance in 2 out of 6 estuarine sediments but wereunable to show any relationship with AOB amoAabundance. In contrast, the abundance of AOB amoA
genes correlated with potential nitrification rateswithin estuarine sediments (Bernhard et al. 2010),whereas Magalhães et al. (2009) saw no correlationbetween AOB or AOA amoA abundance and nitrifi-cation potential flux in the intertidal sediments of theDouro River estuary in Portugal. Wankel et al. (2011)published similar results for sediments from theElkhorn Slough, California, USA. Evaluating the rel-ative contribution of AOA and AOB to ammonia oxi-dation is further complicated by the fact that recentevidence suggests that not all AOA are obligatechemolithoautotrophic ammonia oxidisers (Teira etal. 2006, Hatzenpichler et al. 2008, Mußmann et al.2011) and that the AOA AmoA may have alternativesubstrates such as urea (Alonso-Sáez et al. 2012). Incontrast, the chemoautotrophic nature of the AOB(Norton et al. 2008) indicates that their presence inthe environment can be more confidently attributedto nitrification potential.
The link between AOA and AOB amoA gene abun-dance and nitrification rates was investigated incoastal marine sediments of the western EnglishChannel. Four sites within the Western Channel Ob-servatory (www.westernchannelobservatory. org. uk),chosen for their contrasting depth, sediment type andlevel of exposure to storm events, were sampled bi-monthly between July 2008 and May 2011. Jennycliff(50° 20.91’ N, 04° 07.71’ W) and Cawsand (50° 19.81’ N,04° 11.50’ W) represent shallow habitats (~10 m deep).Both sites are sheltered from the prevailing south-westerly winds, but they have dif ferent sedimentstypes, with Jennycliff being coarse silt and Cawsandfine sand. Rame Mud (50° 17.75’ N, 04° 16.00’ W) andL4 (50° 13.30’ N, 04° 11.40’ W) are exposed sites with adepth of ~50 m, again with contrasting sediment type,Rame Mud being medium silt and L4 fine sand. Thewater column at the L4 station is also seasonally strati-fied from late-April until September (Smyth et al.2010). Alongside collecting samples for DNA extrac-tion and ammonia oxidation rate measurements, awhole suite of environmental variables were collectedat the same time. Crucially, seabed salinity variesvery little at each of these coastal sites. This providedthe opportunity to survey the abundance and com -munity composition of archaeal and bacterial ammo-nia-oxidiser abundance at each location over the 3 yrperiod and make use of the accompanying environ-mental measurements to identify key abiotic factors,other than salinity, driving AOA and AOB abundancein the sediments of the western English Channel.
This study examined the distribution of AOB andAOA in relation to temperature, sediment carbonand nitrogen content and nutrient concentrations,
42
Tait et al.: Ammonia-oxidising bacteria and archaea in western English Channel 43
taken from the bottom of the water column at thesediment surface. The abundance of both AOB andAOA was measured using quantitative PCR (qPCR)of archaeal- and bacterial-specific amoA gene PCRprimers. Measurements of benthic nitrification rateswere made at the same time. AOA and AOB commu-nity composition throughout the 3 yr period and ateach location were compared using PCR-DGGE ofamoA genes, and a small number of samples werealso examined by DNA hybridisation to functionalgene microarrays for the AOA (Bouskill et al. 2012)and the AOB (Ward et al. 2007, Bouskill et al. 2011).
MATERIALS AND METHODS
Site description and sampling protocols
Samples were taken approximately bimonthlyfrom July 2008 to May 2011. Some winter samplingdates were missed due to adverse weather condi-tions, particularly at the furthest offshore site L4.Used in this analysis are the water depth of the site,sediment type (measured as specific surface area[SSSA]: Jennycliff = 3.95; Cawsand = 1.52; RameMud = 5.19 and L4 = 0.73 m2 g−l), sediment carbonand nitrogen content and measurements of salinity,temperature and nutrients (ammonium, nitrate,nitrite, silicate and phosphate) taken from the bottomwater. Details of methods can be found at www.west-ernchannelobservatory.org.uk, and data has beenstored at the British Oceanographic Data Centre(www.bodc.ac.uk/). Porewater nutrients were notdetermined. However, as a first approximation, wecalculated porewater NH4
+ concentration in surficialsediment (PWNH4
+; in the upper 1 cm of sedimentwhere nitrification occurs) from the nutrient flux dataand Fick’s diffusion law:
(1)
where ‘Flux’ was the ammonium flux calculated fromnutrient flux experiments (data available from theBritish Oceanographic Data Centre www. bodc. ac.uk),‘NH4
+zero’ was the NH4
+ concentration in over lyingwater at the start of nutrient flux experiments, ‘Dz ’was the thickness of the diffusive layer (0.01 m), ‘ϕ’was the porosity at each site and ‘D’ was the diffusioncoefficient for ammonium (9.85 m2 d−1). D was takenfrom the apparent diffusion coefficients of NH4
+ (Li &Gregory 1974), corrected for tortuosity (Sweerts et al.1991). Although our approach is based on theassumption of diffusive flux (Fick’s law), it implicitly
considers bio-irrigation by using the measured ‘Flux’data. The ‘Flux’ data carry an uncertainty of up to40% based on replicate cores (SD of 8 cores).
Ammonia oxidation rate measurements
Ammonium oxidation rates were determined byslurry-type-incubations, in vitro, as previously de -scribed (Kitidis et al. 2011). Briefly, sediment for invitro determination of ammonium oxidation was col-lected with a box core (0.25 m2 surface area). Anyoverlying water was siphoned off, and surface sedi-ment (top 1 cm) was scraped into 14 ml glass vials.Bottom water was added to each vial to a final ratio ofapproximately 2/3 surface sediment and 1/3 seawa-ter. Triplicate slurries were treated either with allyl -thiourea (ATU) or sodium chlorate (NaClO3) (0.1 mlof 0.1 mol l−1 added to each treatment). ATU is aninhibitor of the first stage of nitrification (i.e. ammo-nium oxidation) while NaClO3 is an inhibitor of thesecond stage (NO2
− oxidation). The vials were thensealed with rubber septa and incubated in the darkfor 24 h at ambient seawater surface temperature(stored in a plastic box placed in a shaded tank withflowing surface water). At the end of each incu -bation, the supernatant in each vial was filtered(0.7 μM, Whatman GF/F) and the filtrate NO2
− con-centration was determined by manual colorimetricassay against NaNO2 standards (Sigma; >99.9%purity; standard range: 0.0 to 2.0 μmol l−1; R2 > 0.999)(Grasshoff 1983). NH3 oxidation rates were calcu-lated as accumulation of NO2
− in the NaClO3 treat-ment compared to the ATU treatment. Post-incuba-tion, the vials were dried and weighed in order tocalculate the exact amount of sediment in each vial.The final NO2
− concentration in each vial was nor-malised by the respective weight of sediment beforerate calculations. The precision and detection limit ofNO2
− analysis were 5 and 9 nmol NO2− l−1, respec-
tively (initial NO2− concentration in all samples was
>10 nmol l−1). The corresponding limits of detectionfor rate calculations were 0.3 nmol NH4
+ l−1 h−1
(ml wet sediment−1)
DNA extraction
A multicorer was used to collect 8 replicate cores atJennycliff, Rame Mud and L4, and a box corer wasused to collect sediment at Cawsand. Surface sedi-ment samples (1 ml) were taken using the barrel of a2.5 ml syringe and immediately frozen at −20°C.
DDzPWNH
FluxNH zero4 4=
× ϕ× ++ +
Mar Ecol Prog Ser 511: 41–58, 2014
Sedi ment samples from 4 randomly selected coreswere chosen for DNA extraction. Each sedimentsample was homogenised by stirring with a sterilemetal spatula and DNA extracted using the methodof Laverock et al. (2010). Briefly, 0.5 g sediment wasadded to a sterile 2 ml microtube with 0.5 ml of 0.1 Msodium phosphate buffer (pH 8.0) and cells lysed bybead beating with 0.3 g each of 212 to 300 μm and710 to 1180 μm glass beads (Sigma-Aldrich) and0.5 ml phenol:chloroform:isoamyl alcohol (25:24:1,pH 8.0, Sigma-Aldrich). The lysate was separatedfrom sediment by centrifugation, and the aqueousupper layer transferred to a clean 2 ml microtubecontaining 0.5 ml chloroform:isoamyl alcohol (24:1,Sigma-Aldrich), mixed and centrifuged again. Theaqueous layer was purified by ethanol precipitationand resuspended in sterile water. DNA extracts thenrequired further purification with the PowerClean®
DNA Clean-Up Kit (Mobio) according to the manu-facturer’s instructions. Extraction of DNA was con-firmed by agarose gel electrophoresis and quantifiedusing a NanoDrop spectrophotometer (NanoDropTechnologies).
qPCR
An ABI 7000 sequence detection system (AppliedBiosystems) and QuantiFast SYBR Green PCR Kit(Qiagen) were used for all qPCR experiments. Todetermine the abundance of archaeal and bacterialamoA genes, the following primers were used:arch-amoAF (5’-STA ATG GTC TGG CTT AGACG-‘3) and arch-amoAR(5’-GCG GCC ATC CATCTG TAT GT-3’) for archaeal amoA (Francis et al.2005) and amoA1F (5’-GGG GTT TCT ACT GGTGGT-3’) and amoA2R (5’-CCT CKG SAA AGCCTT CTT C-3’) (Rotthauwe et al. 1997, Hornek etal. 2006) for bacterial amoA genes. For archaealamoA genes, the 20 μl reaction mixture contained10 μl of Master Mix, 300 nM of each primer and 10ng of DNA, and PCR conditions were 5 min at 95°Cfollowed by 40 cycles of 95°C for 15 s and 58.5°Cfor 1 min. For bacterial amoA genes, the 20 μl reac-tions contained 10 μl of Master Mix, 900 nM ofeach primer and 10 ng of DNA and PCR conditionswere 5 min at 95°C followed by 40 cycles of 95°Cfor 15 s and 61.5°C for 1 min. Assays were con-ducted in triplicate and in cluded a standard curvecontaining 102 to 108 amplicons μl−1 DNA. Standardcurves for each primer pair were constructed usingcloned sequences. Nucleic acids were quantifiedusing a NanoDrop spectrophotometer (NanoDrop
Technologies). Gene numbers were quantified bycomparison to standard curves using the ABI Prism7000 detection software. Automatic analysis settingswere used to determine the threshold cycle (CT)values and baselines settings. The no-templatecontrols were below the threshold in all experi-ments. For each standard curve, the slope, y-inter-cept, coefficient of determination (r2) and the effi-ciency of amplification were determined. Values forarchaeal amoA genes were typically: r2 = 0.98, y-intercept = 40.78, E (amplification efficiency) =86.32%, and for bacterial amoA genes: r2 = 0.99, y-intercept = 34.33, E = 94.98%.
DGGE
DGGE analysis of archaeal and bacterial amoAgene sequences were performed with the INGENY -phorU DGGE system (Ingeny). The primers used forthe bacterial amoA qPCR were also used for DGGEanalysis but with a base GC clamp (CGC CCG CCGCGC CCC GCG CCC GGC CCG CCG CCC CCGCCC C) attached to the 5’-end of the reverse primer.For archaeal amoA, PCR products were resolvedwithout the requirement of a GC clamp. For both, the50 μl PCR mixture contained 1 μl cDNA, 5× PCRbuffer, 3.0 mM MgCl2, 400 μM of each dNTP, 2.5 UGoTaq Flexi DNA Polymerase (Promega) and100 nM of each primer and PCR conditions were aspreviously described (Shen et al. 2008). PCR prod-ucts from the 4 replicate cores from each site werethen combined to give one PCR product for eachsampling time-point and the PCR products run onpolyacylamide gradient gels with denaturing gradi-ents of 35 to 55% for bacterial amoA and 10 to 50%for archaeal amoA. Gels were electrophoresed in 1×TAE (Tris-acetate-EDTA) at a constant temperatureof 60°C for 16 h at 60 V. DGGE fingerprinting pat-terns were converted to presence/absence datausing Gel Compar II software (Applied Maths) andthe data imported into PRIMER v6 multivariateanalysis software (Clarke & Gorley 2006) for statisti-cal analysis.
Archaeal and bacterial amoAoligonucleotide probe design
This study employed the archaeal and bacterialamoA archetype arrays outlined by Ward & Bouskill(2011). The array employs an internal standard to fil-ter and quantify signal intensity of the amoA probes.
44
Tait et al.: Ammonia-oxidising bacteria and archaea in western English Channel
Each 90-mer oligonucleotide probe contains a 70-mer bacterial- or archaeal-specific amoA archetypesequence combined with a 20-mer oligo (5’-GATCCC CGG GAA TTG CCA TG-3’ for AOB amoA and5’-GTA CTA CTA GCC TAG GCT AG-3’ for AOAamoA), functioning as an internal standard. The de -sign and spotting of the amoA probes have beendescribed previously (Ward & Bouskill 2011). For theAOA, 31 AOA archetype probes represent 1400 se -quences taken from clone libraries built from terres-trial, aquatic and geothermal environments (Bouskillet al. 2012), and for the AOB, 28 individual probesrepresent 506 amoA sequences including both envi-ronmental and culture-based sequences (Bouskill etal. 2011).
amoA amplification, target preparation and microarray hybridization
Hybridization targets were produced from the PCRamplicons from Rame Mud and L4 in July 2008 andin March 2009 using methodology previously de -scribed (Ward & Bouskill 2011). PCR products fromthe 4 replicate cores from each site were then com-bined to give one PCR product for each samplingtime-point. These were cleaned and labelled byincorporating amino-allyl-dUTP during linear ampli-fication using Klenow enzyme. The Klenow productwas purified and conjugated with Cy3 as describedpreviously.
Cy3-labelled PCR product (200 ng) was combinedwith 2 × hybridization buffer (1 × final concentration;Agilent) and 0.25 pmol of a Cy5-labelled comple-mentary 20-mer standard oligonucleotide and thenincubated at 95°C for 5 min before being cooled toroom temperature. Samples were hybridized to tripli-cate arrays by overnight incubation at 65°C andwashed (Ward & Bouskill 2011). The arrays werescanned with an Agilent laser scanner (Agilent Tech-nologies) and analysed using the Gene Pix Pro 6.0software (Molecular Devices).
Various steps were employed to filter and quantifythe signal hybridization data following Taroncher-Oldenburg et al. (2003). Signal hybridization intensi-ties were standardized to the total fluorescenceacross the AOA or AOB probe sets to give a relativefluorescence ratio (RFR) allowing comparison be -tween different arrays (Ward & Bouskill 2011). All ofthe original array files are available at GEO (GeneExpression Omnibus; www.ncbi.nlm.nih.gov/ projects/geo/) at NCBI (National Centre for BiotechnologyInformation) under GEO Accession No. GSE 50163.
Statistics
Analysis was performed using PRIMER v6 (Clarke& Gorley 2006) with the PERMANOVA+ add on (An -derson et al. 2008). Pearson’s correlation coefficientwas used to examine relationships among the abioticvariables, and also among the AOA and AOB amoAgene abundances and ammonia oxidation rates.Bray-Curtis resemblance matrices were used forgene and DGGE data throughout this study, whereasEuclidean distance similarity matrices were used forall process rate and environmental data. Two-waypermutational multivariate analysis of variance(PERM ANOVA), using site and month as fixed fac-tors in a crossed design, were used to compare theeffect of sediment location and season on the abun-dance of archaeal and bacterial amoA genes andammonia oxidation rate data. For the presence/absence of DGGE banding patterns, resemblancesbetween samples were generated using the Bray-Curtis coefficient, and non-metric multidimensionalscaling (nMDS) ordinations were used to visualisethe configuration of the different samples on a 2Dscaling plot. The BIO-ENV routine (Clarke & Ains -worth 1993) within PRIMER was used to determinethe environmental variables that best explained thevariation in AOA and AOB amoA DGGE bandingpatterns and also in the amoA gene abundance data.The RELATE procedure, a non-parametric Manteltest, was used to test the hypothesis that the changesto the bacterial and archaeal amoA gene DGGE pat-terns varied linearly through time and also to assessrelationships between the bacterial and archaealamoA gene abundance data and the environmentalvariables.
RESULTS
Environmental variables
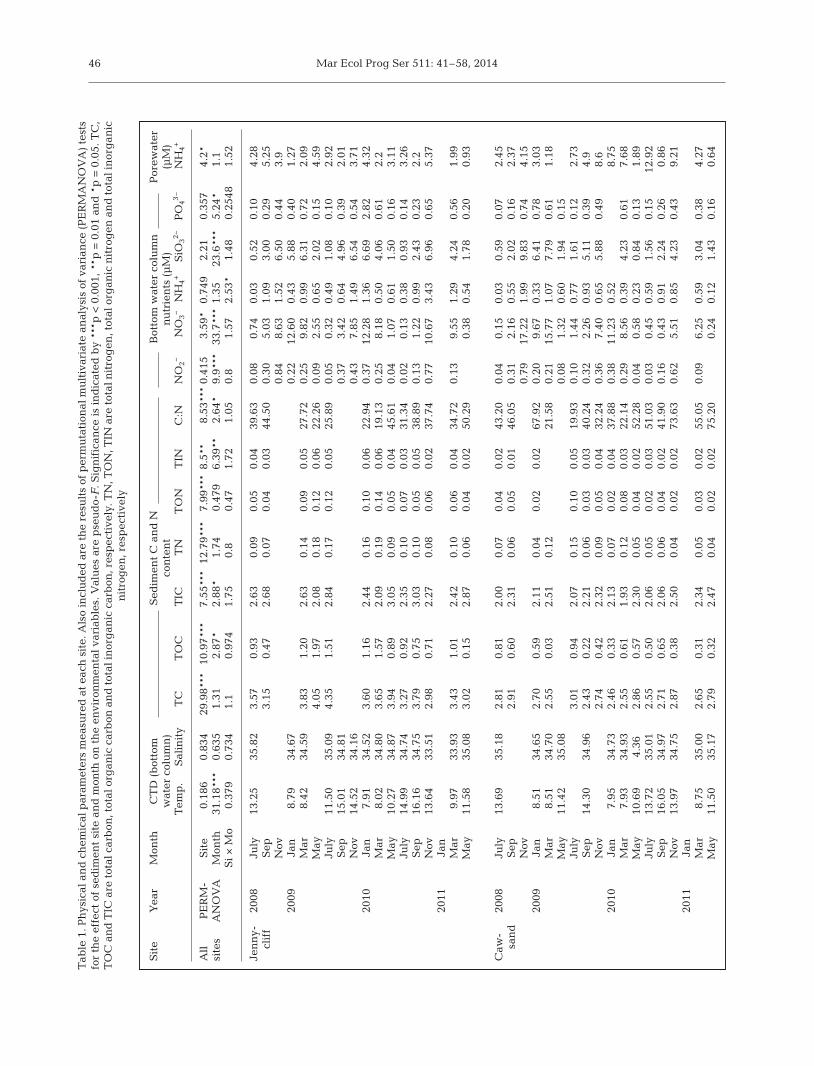
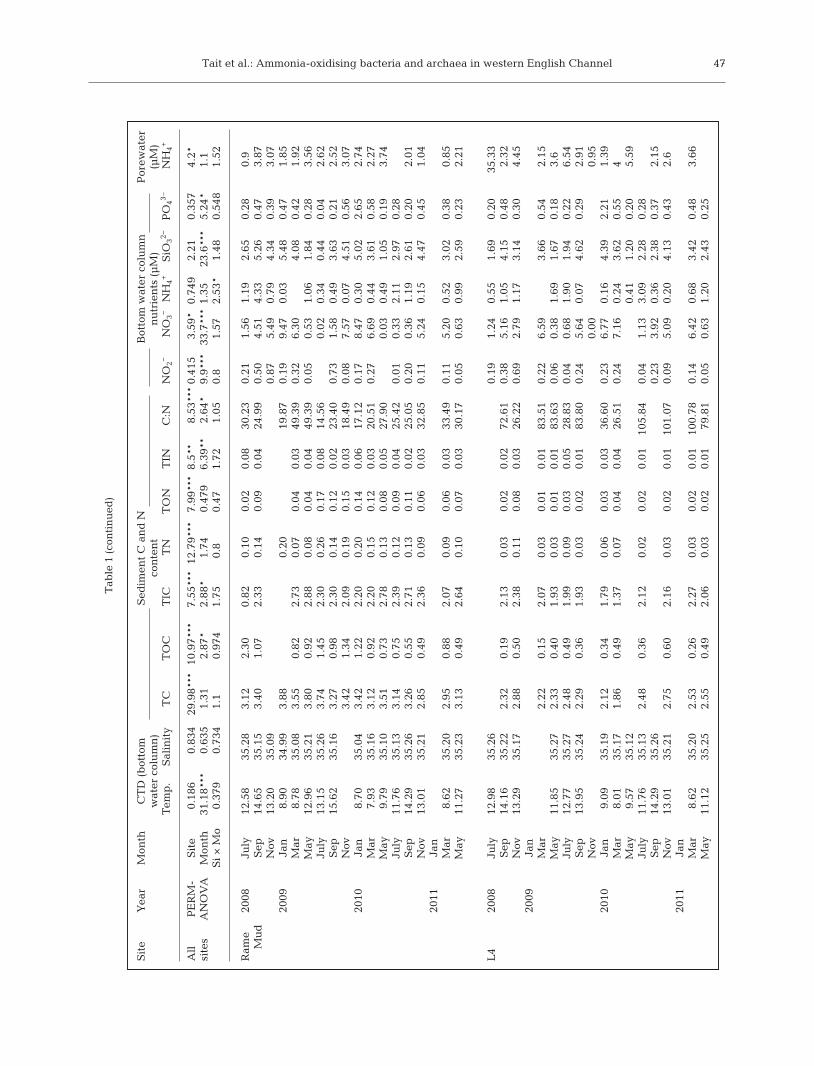
Environmental variables and statistical analysesfor differences between sediment site and monthare shown in Table 1. Salinity, measured in the bot-tom water at the sediment surface, was very similarat each of the 4 sites. The near-shore sites, particu-larly Jennycliff, experienced dips in salinity duringperiods of heavy rainfall (e.g. winter of 2010/2011),but these pulses of fresher water were not evidentwithin the deeper waters at Rame Mud or L4(Table 1). There was a clear seasonal signature totemperature and to the nutrients nitrite, nitrate, sil-icate and phosphate; concentrations of these nutri-
45
Mar Ecol Prog Ser 511: 41–58, 201446
Tab
le 1
. Ph
ysic
al a
nd
ch
emic
al p
aram
eter
s m
easu
red
at
each
sit
e. A
lso
incl
ud
ed a
re t
he
resu
lts
of p
erm
uta
tion
al m
ult
ivar
iate
an
alys
is o
f va
rian
ce (
PE
RM
AN
OV
A)
test
sfo
r th
e ef
fect
of
sed
imen
t si
te a
nd
mon
th o
n t
he
envi
ron
men
tal
vari
able
s. V
alu
es a
re p
seu
do-
F. S
ign
ific
ance
is
ind
icat
ed b
y **
*p <
0.0
01, *
*p =
0.0
1 an
d *
p =
0.0
5. T
C,
TO
C a
nd
TIC
are
tot
al c
arb
on, t
otal
org
anic
car
bon
an
d t
otal
inor
gan
ic c
arb
on, r
esp
ecti
vely
. TN
, TO
N, T
IN a
re t
otal
nit
rog
en, t
otal
org
anic
nit
rog
en a
nd
tot
al in
org
anic
n
itro
gen
, res
pec
tive
ly
Sit
eY
ear
Mon
thC
TD
(b
otto
m
Sed
imen
t C
an
d N
B
otto
m w
ater
col
um
n
Por
ewat
er
wat
er c
olu
mn
)co
nte
nt
nu
trie
nts
(μ
M)
(μM
)T
emp
.S
alin
ity
TC
TO
CT
ICT
NT
ON
TIN
C:N
NO
2−N
O3−
NH
4+S
iO32−
PO
43–
NH
4+
All
PE
RM
-S
ite
0.18
60.
834
29.9
8***
10.9
7***
7.55
***
12.7
9***
7.99
***
8.5*
*8.
53**
*0.
415
3.59
*0.
749
2.21
0.35
74.
2*si
tes
AN
OV
AM
onth
31.1
8***
0.63
51.
312.
87*
2.88
*1.
740.
479
6.39
**2.
64*
9.9*
**33
.7**
*1.
3523
.6**
*5.
24*
1.1
Si
× M
o0.
379
0.73
41.
10.
974
1.75
0.8
0.47
1.72
1.05
0.8
1.57
2.53
*1.
480.
2548
1.52
Jen
ny-
2008
July
13.2
535
.82
3.57
0.93
2.63
0.09
0.05
0.04
39.6
30.
080.
740.
030.
520.
104.
28cl
iff
Sep
3.15
0.47
2.68
0.07
0.04
0.03
44.5
00.
305.
031.
093.
000.
295.
25N
ov0.
848.
631.
526.
500.
443.
920
09Ja
n8.
7934
.67
0.22
12.6
00.
435.
880.
401.
27M
ar8.
4234
.59
3.83
1.20
2.63
0.14
0.09
0.05
27.7
20.
259.
820.
996.
310.
722.
09M
ay4.
051.
972.
080.
180.
120.
0622
.26
0.09
2.55
0.65
2.02
0.15
4.59
July
11.5
035
.09
4.35
1.51
2.84
0.17
0.12
0.05
25.8
90.
050.
320.
491.
080.
102.
92S
ep15
.01
34.8
10.
373.
420.
644.
960.
392.
01N
ov14
.52
34.1
60.
437.
851.
496.
540.
543.
7120
10Ja
n7.
9134
.52
3.60
1.16
2.44
0.16
0.10
0.06
22.9
40.
3712
.28
1.36
6.69
2.82
4.32
Mar
8.02
34.8
03.
651.
572.
090.
190.
140.
0619
.13
0.25
8.18
0.50
4.06
0.61
2.2
May
10.2
734
.87
3.94
0.89
3.05
0.09
0.05
0.04
45.6
10.
041.
070.
611.
500.
163.
11Ju
ly14
.99
34.7
43.
270.
922.
350.
100.
070.
0331
.34
0.02
0.13
0.38
0.93
0.14
3.26
Sep
16.1
634
.75
3.79
0.75
3.03
0.10
0.05
0.05
38.8
90.
131.
220.
992.
430.
232.
2N
ov13
.64
33.5
12.
980.
712.
270.
080.
060.
0237
.74
0.77
10.6
73.
436.
960.
655.
3720
11Ja
nM
ar9.
9733
.93
3.43
1.01
2.42
0.10
0.06
0.04
34.7
20.
139.
551.
294.
240.
561.
99M
ay11
.58
35.0
83.
020.
152.
870.
060.
040.
0250
.29
0.38
0.54
1.78
0.20
0.93
Caw
-20
08Ju
ly13
.69
35.1
82.
810.
812.
000.
070.
040.
0243
.20
0.04
0.15
0.03
0.59
0.07
2.45
san
dS
ep2.
910.
602.
310.
060.
050.
0146
.05
0.31
2.16
0.55
2.02
0.16
2.37
Nov
0.79
17.2
21.
999.
830.
744.
1520
09Ja
n8.
5134
.65
2.70
0.59
2.11
0.04
0.02
0.02
67.9
20.
209.
670.
336.
410.
783.
03M
ar8.
5134
.70
2.55
0.03
2.51
0.12
21.5
80.
2115
.77
1.07
7.79
0.61
1.18
May
11.4
235
.08
0.08
1.32
0.60
1.94
0.15
July
3.01
0.94
2.07
0.15
0.10
0.05
19.9
30.
101.
440.
771.
610.
122.
73S
ep14
.30
34.9
62.
430.
222.
210.
060.
030.
0340
.24
0.32
2.26
0.93
5.11
0.39
4.9
Nov
2.74
0.42
2.32
0.09
0.05
0.04
32.2
40.
367.
400.
655.
880.
498.
620
10Ja
n7.
9534
.73
2.46
0.33
2.13
0.07
0.02
0.04
37.8
80.
3811
.23
0.52
8.75
Mar
7.93
34.9
32.
550.
611.
930.
120.
080.
0322
.14
0.29
8.56
0.39
4.23
0.61
7.68
May
10.6
94.
362.
860.
572.
300.
050.
040.
0252
.28
0.04
0.58
0.23
0.84
0.13
1.89
July
13.7
235
.01
2.55
0.50
2.06
0.05
0.02
0.03
51.0
30.
030.
450.
591.
560.
1512
.92
Sep
16.0
534
.97
2.71
0.65
2.06
0.06
0.04
0.02
41.9
00.
160.
430.
912.
240.
260.
86N
ov13
.97
34.7
52.
870.
382.
500.
040.
020.
0273
.63
0.62
5.51
0.85
4.23
0.43
9.21
2011
Jan
Mar
8.75
35.0
02.
650.
312.
340.
050.
030.
0255
.05
0.09
6.25
0.59
3.04
0.38
4.27
May
11.5
035
.17
2.79
0.32
2.47
0.04
0.02
0.02
75.2
00.
240.
121.
430.
160.
64
Tait et al.: Ammonia-oxidising bacteria and archaea in western English Channel 47
Tab
le 1
(co
nti
nu
ed)
Sit
eY
ear
Mon
thC
TD
(b
otto
m
Sed
imen
t C
an
d N
B
otto
m w
ater
col
um
n
Por
ewat
er
wat
er c
olu
mn
)co
nte
nt
nu
trie
nts
(μ
M)
(μM
)T
emp
.S
alin
ity
TC
TO
CT
ICT
NT
ON
TIN
C:N
NO
2−N
O3−
NH
4+S
iO32−
PO
43–
NH
4+
All
P
ER
M-
Sit
e0.
186
0.83
429
.98*
**10
.97*
**7.
55**
*12
.79*
**7.
99**
*8.
5**
8.53
***
0.41
53.
59*
0.74
92.
210.
357
4.2*
site
sA
NO
VA
Mon
th31
.18*
**0.
635
1.31
2.87
*2.
88*
1.74
0.47
96.
39**
2.64
*9.
9***
33.7
***
1.35
23.6
***
5.24
*1.
1S
i ×
Mo
0.37
90.
734
1.1
0.97
41.
750.
80.
471.
721.
050.
81.
572.
53*
1.48
0.54
81.
52
Ram
e 20
08Ju
ly12
.58
35.2
83.
122.
300.
820.
100.
020.
0830
.23
0.21
1.56
1.19
2.65
0.28
0.9
Mu
dS
ep14
.65
35.1
53.
401.
072.
330.
140.
090.
0424
.99
0.50
4.51
4.33
5.26
0.47
3.87
Nov
13.2
035
.09
0.87
5.49
0.79
4.34
0.39
3.07
2009
Jan
8.90
34.9
93.
880.
2019
.87
0.19
9.47
0.03
5.48
0.47
1.85
Mar
8.78
35.0
83.
550.
822.
730.
070.
040.
0349
.39
0.32
6.30
4.08
0.42
1.92
May
12.9
635
.21
3.80
0.92
2.88
0.08
0.04
0.04
49.3
90.
050.
531.
061.
840.
283.
56Ju
ly13
.15
35.2
63.
741.
452.
300.
260.
170.
0814
.56
0.02
0.34
0.44
0.04
2.62
Sep
15.6
235
.16
3.27
0.98
2.30
0.14
0.12
0.02
23.4
00.
731.
580.
493.
630.
212.
52N
ov3.
421.
342.
090.
190.
150.
0318
.49
0.08
7.57
0.07
4.51
0.56
3.07
2010
Jan
8.70
35.0
43.
421.
222.
200.
200.
140.
0617
.12
0.17
8.47
0.30
5.02
2.65
2.74
Mar
7.93
35.1
63.
120.
922.
200.
150.
120.
0320
.51
0.27
6.69
0.44
3.61
0.58
2.27
May
9.79
35.1
03.
510.
732.
780.
130.
080.
0527
.90
0.03
0.49
1.05
0.19
3.74
July
11.7
635
.13
3.14
0.75
2.39
0.12
0.09
0.04
25.4
20.
010.
332.
112.
970.
28S
ep14
.29
35.2
63.
260.
552.
710.
130.
110.
0225
.05
0.20
0.36
1.19
2.61
0.20
2.01
Nov
13.0
135
.21
2.85
0.49
2.36
0.09
0.06
0.03
32.8
50.
115.
240.
154.
470.
451.
0420
11Ja
nM
ar8.
6235
.20
2.95
0.88
2.07
0.09
0.06
0.03
33.4
90.
115.
200.
523.
020.
380.
85M
ay11
.27
35.2
33.
130.
492.
640.
100.
070.
0330
.17
0.05
0.63
0.99
2.59
0.23
2.21
L4
2008
July
12.9
835
.26
0.19
1.24
0.55
1.69
0.20
35.3
3S
ep14
.16
35.2
22.
320.
192.
130.
030.
020.
0272
.61
0.38
5.16
1.05
4.15
0.48
2.32
Nov
13.2
935
.17
2.88
0.50
2.38
0.11
0.08
0.03
26.2
20.
692.
791.
173.
140.
304.
4520
09Ja
nM
ar2.
220.
152.
070.
030.
010.
0183
.51
0.22
6.59
3.66
0.54
2.15
May
11.8
535
.27
2.33
0.40
1.93
0.03
0.01
0.01
83.6
30.
060.
381.
691.
670.
183.
6Ju
ly12
.77
35.2
72.
480.
491.
990.
090.
030.
0528
.83
0.04
0.68
1.90
1.94
0.22
6.54
Sep
13.9
535
.24
2.29
0.36
1.93
0.03
0.02
0.01
83.8
00.
245.
640.
074.
620.
292.
91N
ov0.
000.
9520
10Ja
n9.
0935
.19
2.12
0.34
1.79
0.06
0.03
0.03
36.6
00.
236.
770.
164.
392.
211.
39M
ar8.
0135
.17
1.86
0.49
1.37
0.07
0.04
0.04
26.5
10.
247.
160.
243.
620.
554
May
9.57
35.1
20.
411.
200.
205.
59Ju
ly11
.76
35.1
32.
480.
362.
120.
020.
020.
0110
5.84
0.04
1.13
3.09
2.28
0.28
Sep
14.2
935
.26
0.23
3.92
0.36
2.38
0.37
2.15
Nov
13.0
135
.21
2.75
0.60
2.16
0.03
0.02
0.01
101.
070.
095.
090.
204.
130.
432.
620
11Ja
nM
ar8.
6235
.20
2.53
0.26
2.27
0.03
0.02
0.01
100.
780.
146.
420.
683.
420.
483.
66M
ay11
.12
35.2
52.
550.
492.
060.
030.
020.
0179
.81
0.05
0.63
1.20
2.43
0.25
Mar Ecol Prog Ser 511: 41–58, 2014
ents are higher in winter months (Table 1). Ammo-nium concentrations revealed a more complex pat-tern and were highly variable seasonally and be -tween the different sites: at the shallow sites,ammonium concentration peaked in November,whereas at the deeper sites stratification coincidedwith peaks in ammonium concentration duringsummer months (Table 1). Pore water NH4
+ was 1 to2 orders of magnitude higher than in the overlyingwater column, driving a consistent efflux of ammo-nium from the sediments. Sediment type was re -lated to carbon and nitrogen content, both of whichwere higher at the muddy sites than the sandiersites (Table 1). There was also some evidence forseasonal fluctuations in the organic and inorganiccarbon and inorganic nitrogen content of the sedi-ments, which tended to decrease during summerand autumn months (Table 1).
Ammonia oxidation rates measurements
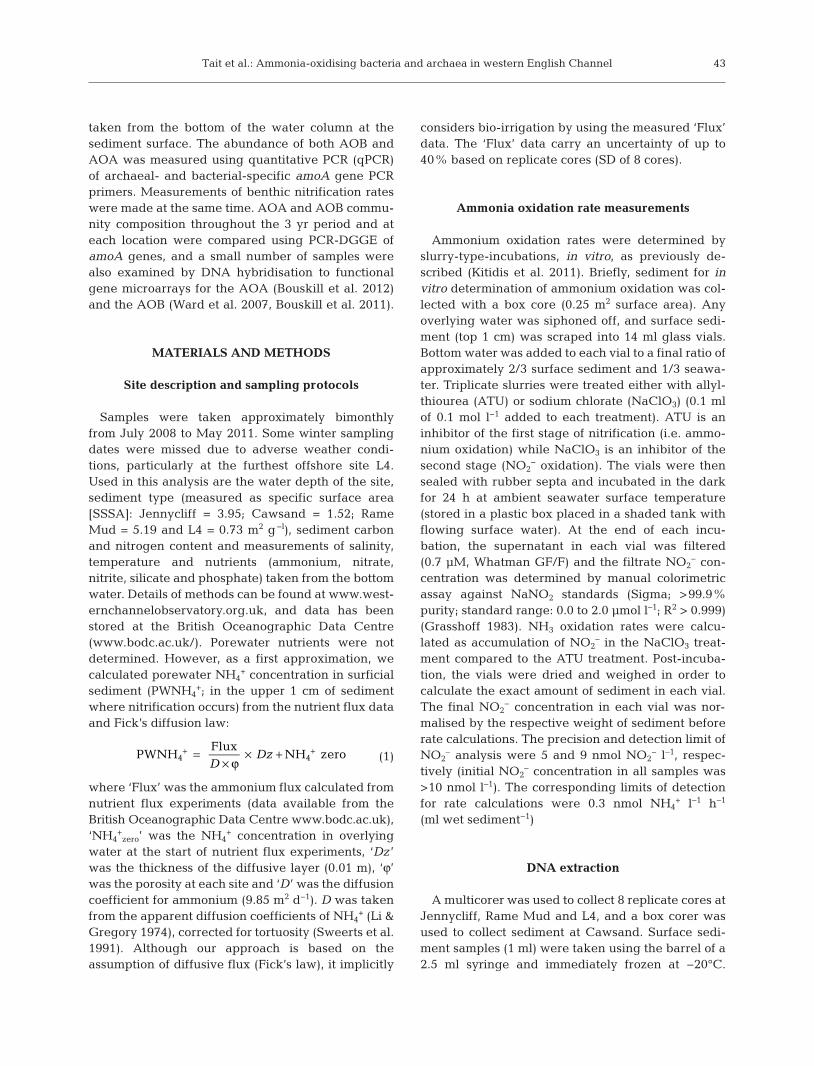
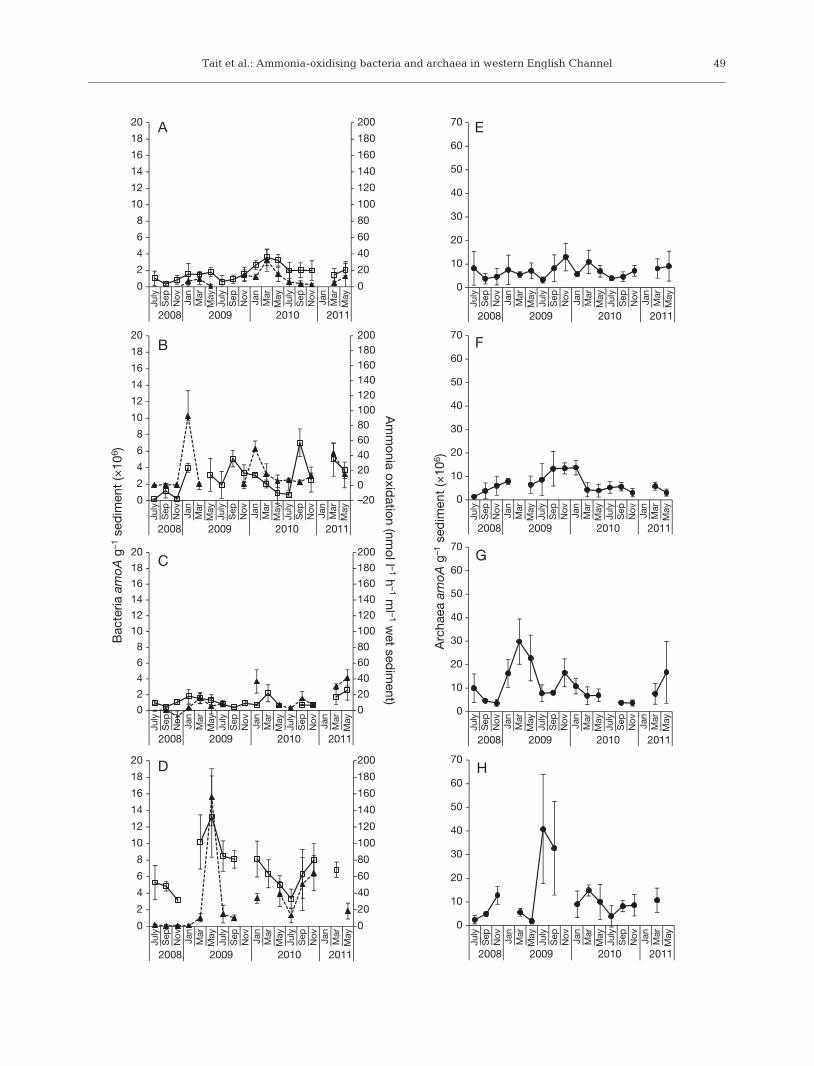
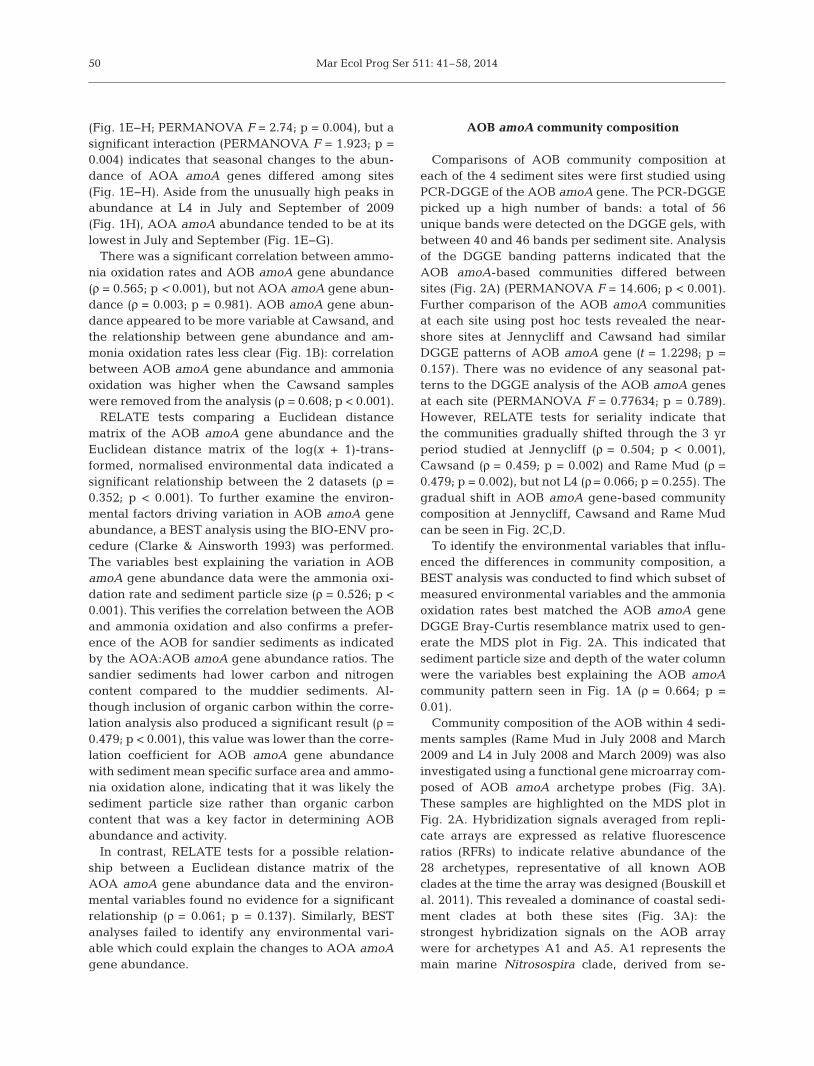
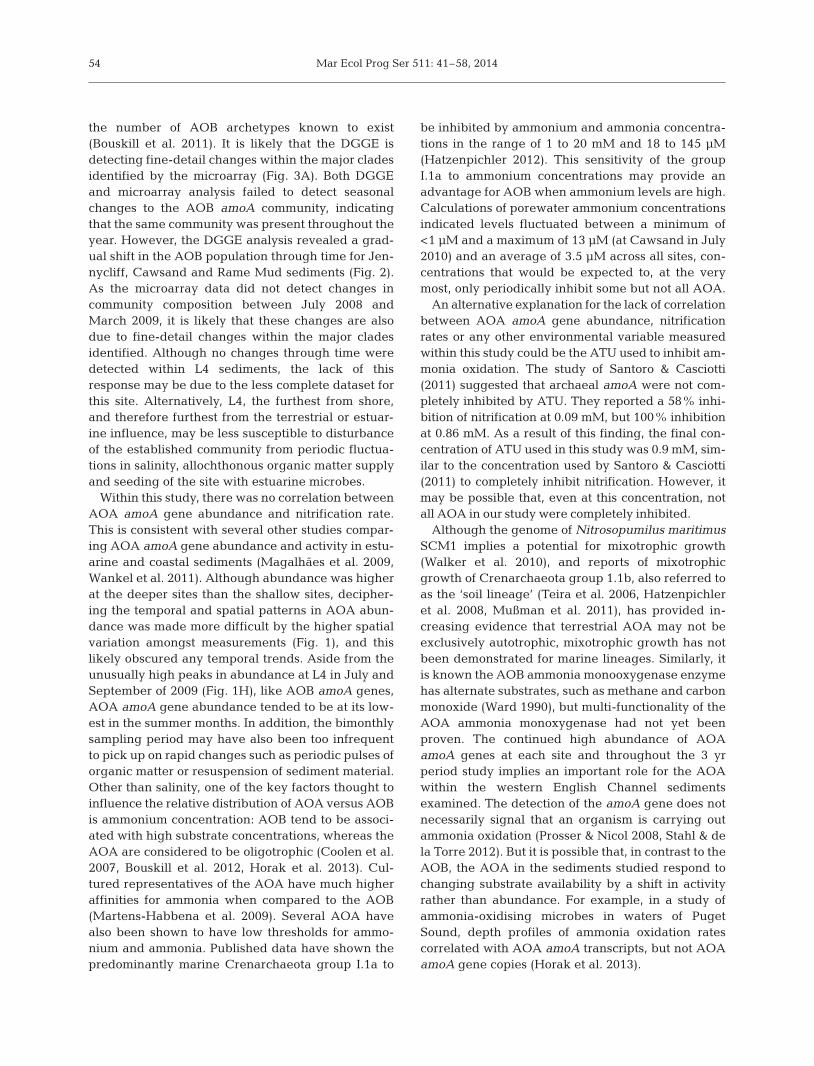
Comparisons of ammonia oxidation rates, meas-ured from each sediment site from July 2008 to May2011, revealed a strong influence of sediment type,with higher rates of ammonia oxidation occurring inthe sandier sediments (Cawsand and L4) than inthe muddy sediments (Jennycliff and Rame Mud)(Fig. 1A−D). For Cawsand and L4, average ammoniaoxidation rates of 18.2 (±6.8 SD) and 29.7 (±10.8 SD)nmol l−1 h−1 ml−1 wet sediment were recorded,respectively, whereas Jennycliff and Rame Mudaverage rates were 7.7 (±6.3 SD) and 12 (±5.4 SD)nmol l−1 h−1 ml−1 wet sediment, respectively. PERM-ANOVA tests performed on Euclidean distancematrices derived from the ammonia oxidation ratedata confirmed the significant differences betweensites (F = 2.895; p = 0.042), but no seasonal differ-ences were detected (F = 1.986; p = 0.113). However,although not regular in occurrence, peaks in activitytended to occur within January, March and May forJennycliff, Cawsand and Rame Mud, whereas peaksat L4 were less regular, with large peaks in May2009 and November 2010 (Fig. 1A−D). Particularlyhigh ammonia oxidation rates were also recorded atCawsand in January 2009 (92.7 nmol l−1 h−1 ml−1 wetsediment). Pearson’s correlation coefficients werecal culated for the ammonia oxidation rate measure-ments and the environmental variables (see Table1A in the Appendix) to determine possible relation-ships between the rate data and environmentalmeasurements, but no significant correlations werefound.
AOB and AOA amoA gene abundance
For each sample, the abundance of AOB (Figs. 1A−D)and AOA (Fig. 1E−H) was measured by quantificationof the respective amoA genes. The abundance ofAOB amoA genes strongly differed between sites(PERMANOVA F = 44.597; p < 0.001). Abundancewas higher at the sandier sediment sites Cawsand(averaging 2.76 × 10⁶ [±9.78 × 10⁵ SD] copies g−1 sedi-ment) and L4 (6.95 × 10⁶ [±1.85 × 10⁶ SD] copies g−1
sediment), and lower at the muddy sediment sitesJennycliff (averaging 1.71 × 10⁶ [±7.5 × 10⁵ SD]copies g−1 sediment) and Rame Mud (1.16 × 10⁶
[±4.37 × 10⁵ SD] copies g−1 sediment) (Fig. 1A−D). Asevident by the lower F-ratio, seasonal changes toAOB amoA abundance were less pronounced thanthe site-specific differences (Fig. 1A−D; PERM-ANOVA F = 5.037; p < 0.001), with increases in abun-dance generally occurring in January, March andMay at all 4 sites, with additional peaks in Septemberin Cawsand sediments (Fig. 1A−D).
AOA amoA genes were more abundant than AOBamoA genes at each site: ratios of AOA:AOB amoAgene abundance averaged for each site were 5.1(±2.76 SD) for Jennycliff, 4.87 (±6.07 SD) forCawsand, 10.8 (±5.77 SD) for Rame Mud, and 1.83(±1.46 SD) for L4. AOA amoA gene abundance alsodiffered between sites, but as evident from the lowerF-ratio, not to the same extent as AOB amoA abun-dance (Fig. 1E−H; PERMANOVA F = 3.881; p <0.001). Average abundance was 6.96 × 10⁶ (±3.55 ×10⁶ SD) gene copies g−1 sediment at Jennycliff, 6.62 ×10⁶ (±3.21 × 10⁶ SD) at Cawsand, 1.10 × 10⁷ at RameMud (±4.54 × 10⁶ SD) and 1.19 × 10⁷ (±6.81 × 10⁶ SD)at L4. These differences in abundance could beattributed to the unusually high peaks in abundancein March and May at Rame Mud in 2009 and in Julyand September in the same year at L4. However,AOA amoA abundance was also higher (average of2.31 × 106 [±5.22 × 10⁶ SD] AOA amoA gene copiesg−1 sediment) at the deeper sites than the shallowsites at all the other times. There was also evidenceof seasonal differences in AOA amoA abundance
48
Fig. 1. Spatial and temporal changes to the abundance g−1
sediment of bacterial and archaeal amoA genes and ammo-nia oxidation rates (m). To highlight their close relationship,bacterial amoA gene abundance (h) and ammonia oxidationrate measurements are plotted together for (A) Jennycliff,(B) Cawsand, (C) Rame Mud and (D) L4, and (d) archaealamoA gene abundance measurements plotted separately for(E) Jennycliff, (F) Cawsand, (G) Rame Mud and (H) L4. Fourreplicate core samples were used for each measurement and
error bars are standard deviation (n = 4)
Tait et al.: Ammonia-oxidising bacteria and archaea in western English Channel 49
0
20
40
60
80
100
120
140
160
180
200
0
2
4
6
8
10
12
14
16
18
20
July
Sep
Nov Jan
Mar
May
July
Sep
Nov Jan
Mar
May
July
Sep
Nov Jan
Mar
May
2008 2009 2010 2011
0
10
20
30
40
50
60
70
July
Sep
Nov Jan
Mar
May
July
Sep
Nov Jan
Mar
May
July
Sep
Nov Jan
Mar
May
2008 2009 2010 2011
–20020406080100120140160180200
0
2
4
6
8
10
12
14
16
18
20
July
Sep
Nov Jan
Mar
May
July
Sep
Nov Jan
Mar
May
July
Sep
Nov Jan
Mar
May
2008 2009 2010 2011
0
10
20
30
40
50
60
70
July
Sep
Nov Jan
Mar
May
July
Sep
Nov Jan
Mar
May
July
Sep
Nov Jan
Mar
May
2008 2009 2010 2011
0
20
40
60
80
100
120
140
160
180
200
0
2
4
6
8
10
12
14
16
18
20
July
Sep
Nov Jan
Mar
May
July
Sep
Nov Jan
Mar
May
July
Sep
Nov Jan
Mar
May
2008 2009 2010 2011
Am
monia oxid
ation (nmol l –1 h
–1 ml –1 w
et sedim
ent)
0
10
20
30
40
50
60
70
July
Sep
Nov Jan
Mar
May
July
Sep
Nov Jan
Mar
May
July
Sep
Nov Jan
Mar
May
2008 2009 2010 2011
0
20
40
60
80
100
120
140
160
180
200
0
2
4
6
8
10
12
14
16
18
20
July
Sep
Nov Jan
Mar
May
July
Sep
Nov Jan
Mar
May
July
Sep
Nov Jan
Mar
May
2008 2009 2010 2011
Bac
teria
am
oA g
–1 s
edim
ent
(×10
6 )
0
10
20
30
40
50
60
70
July
Sep
Nov Jan
Mar
May
July
Sep
Nov Jan
Mar
May
July
Sep
Nov Jan
Mar
May
2008 2009 2010 2011
Arc
haea
am
oA g
–1 s
edim
ent
(×10
6 )
A
H
G
F
E
D
C
B
Mar Ecol Prog Ser 511: 41–58, 2014
(Fig. 1E−H; PERMANOVA F = 2.74; p = 0.004), but asignificant interaction (PERMANOVA F = 1.923; p =0.004) indicates that seasonal changes to the abun-dance of AOA amoA genes differed among sites(Fig. 1E−H). Aside from the unusually high peaks inabundance at L4 in July and September of 2009(Fig. 1H), AOA amoA abundance tended to be at itslowest in July and September (Fig. 1E−G).
There was a significant correlation between ammo -nia oxidation rates and AOB amoA gene abundance(ρ = 0.565; p < 0.001), but not AOA amoA gene abun-dance (ρ = 0.003; p = 0.981). AOB amoA gene abun-dance appeared to be more variable at Caw sand, andthe relationship between gene abundance and am-monia oxidation rates less clear (Fig. 1B): correlationbetween AOB amoA gene abundance and ammoniaoxidation was higher when the Cawsand sampleswere removed from the analysis (ρ = 0.608; p < 0.001).
RELATE tests comparing a Euclidean distancematrix of the AOB amoA gene abundance and theEuclidean distance matrix of the log(x + 1)-trans-formed, normalised environmental data indicated asignificant relationship between the 2 datasets (ρ =0.352; p < 0.001). To further examine the environ-mental factors driving variation in AOB amoA geneabundance, a BEST analysis using the BIO-ENV pro-cedure (Clarke & Ainsworth 1993) was performed.The variables best explaining the variation in AOBamoA gene abundance data were the ammonia oxi-dation rate and sediment particle size (ρ = 0.526; p <0.001). This verifies the correlation between the AOBand ammonia oxidation and also confirms a prefer-ence of the AOB for sandier sediments as indicatedby the AOA:AOB amoA gene abundance ratios. Thesandier sediments had lower carbon and nitrogencontent compared to the muddier sediments. Al -though inclusion of organic carbon within the corre-lation analysis also produced a significant result (ρ =0.479; p < 0.001), this value was lower than the corre-lation coefficient for AOB amoA gene abundancewith sediment mean specific surface area and ammo-nia oxidation alone, indicating that it was likely thesediment particle size rather than organic carboncontent that was a key factor in determining AOBabundance and activity.
In contrast, RELATE tests for a possible relation-ship between a Euclidean distance matrix of theAOA amoA gene abundance data and the environ-mental variables found no evidence for a significantrelationship (ρ = 0.061; p = 0.137). Similarly, BESTanalyses failed to identify any environmental vari-able which could explain the changes to AOA amoAgene abundance.
AOB amoA community composition
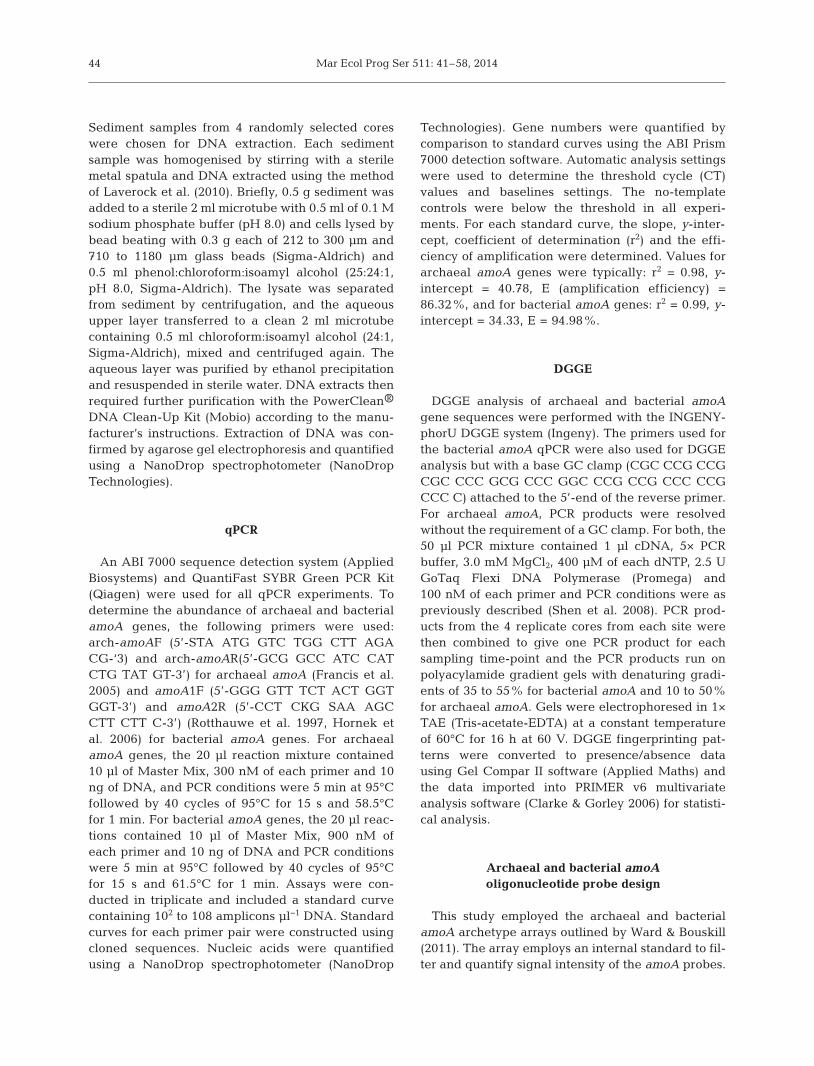
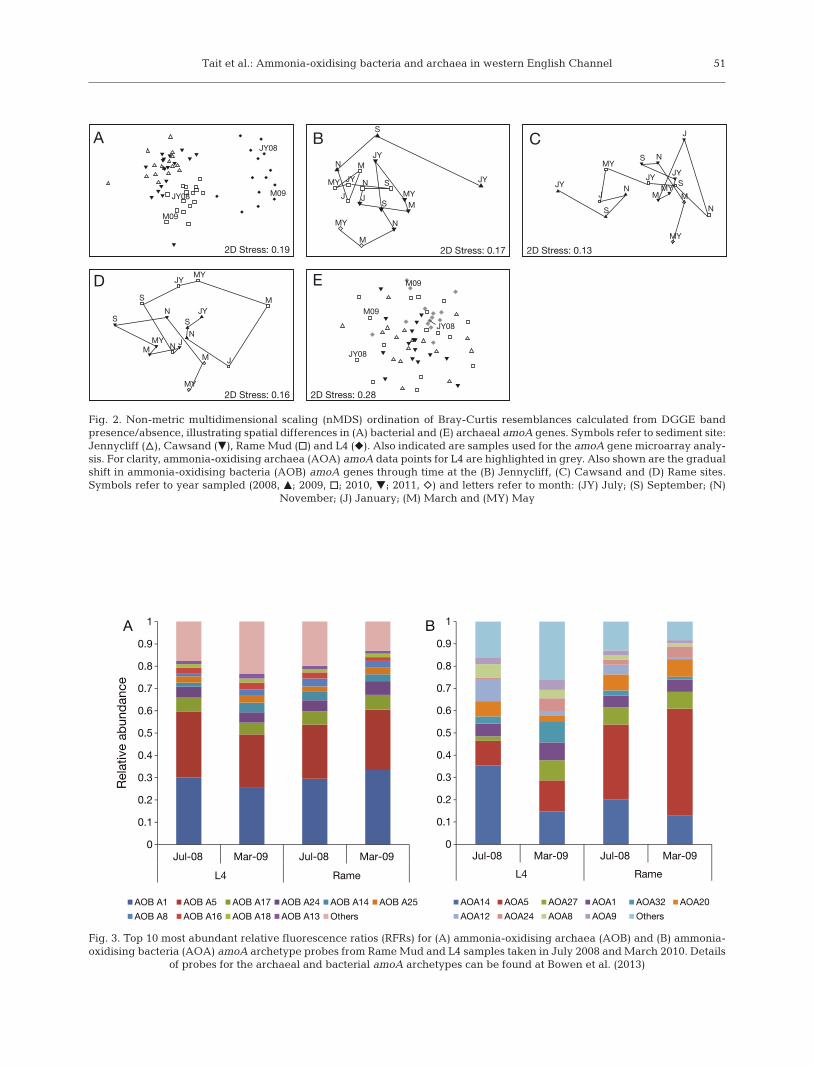
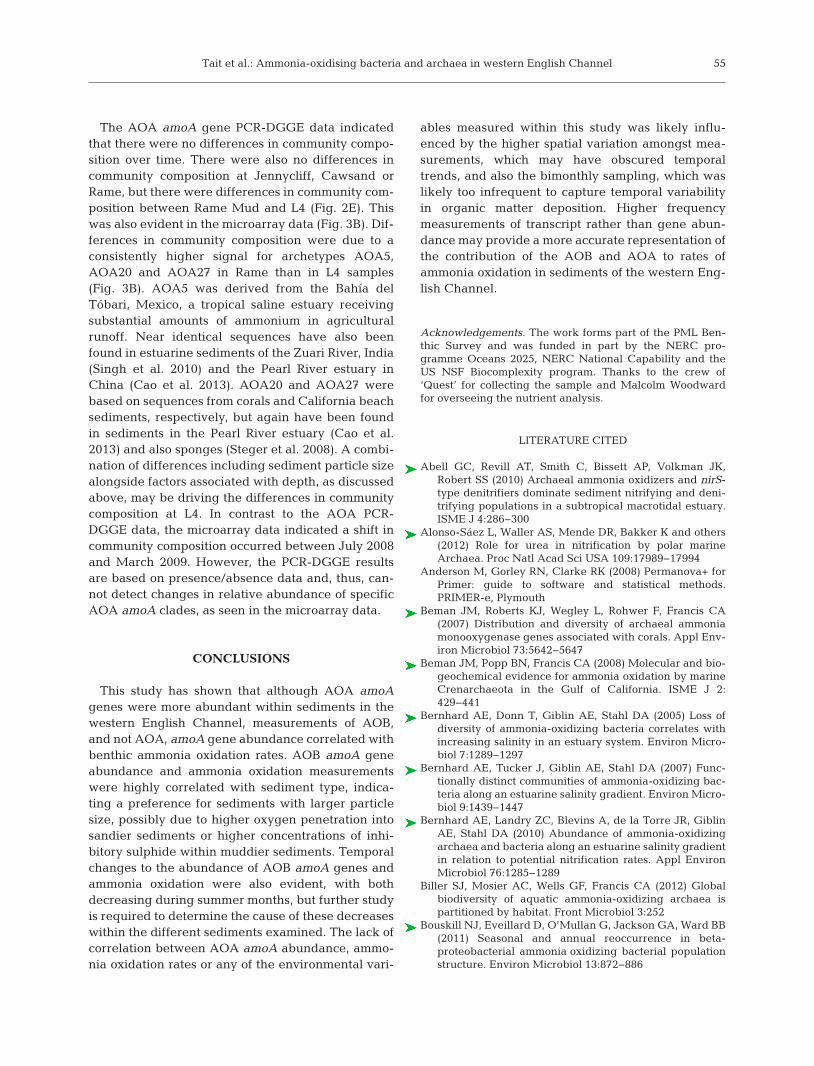
Comparisons of AOB community composition ateach of the 4 sediment sites were first studied usingPCR-DGGE of the AOB amoA gene. The PCR-DGGEpicked up a high number of bands: a total of 56unique bands were detected on the DGGE gels, withbetween 40 and 46 bands per sediment site. Analysisof the DGGE banding patterns indicated that theAOB amoA-based communities differed betweensites (Fig. 2A) (PERMANOVA F = 14.606; p < 0.001).Further comparison of the AOB amoA communitiesat each site using post hoc tests revealed the near-shore sites at Jennycliff and Cawsand had similarDGGE patterns of AOB amoA gene (t = 1.2298; p =0.157). There was no evidence of any seasonal pat-terns to the DGGE analysis of the AOB amoA genesat each site (PERMANOVA F = 0.77634; p = 0.789).However, RELATE tests for seriality indicate thatthe communities gradually shifted through the 3 yrperiod studied at Jennycliff (ρ = 0.504; p < 0.001),Cawsand (ρ = 0.459; p = 0.002) and Rame Mud (ρ =0.479; p = 0.002), but not L4 (ρ = 0.066; p = 0.255). Thegradual shift in AOB amoA gene-based communitycomposition at Jennycliff, Cawsand and Rame Mudcan be seen in Fig. 2C,D.
To identify the environmental variables that influ-enced the differences in community composition, aBEST analysis was conducted to find which subset ofmeasured environmental variables and the ammoniaoxidation rates best matched the AOB amoA geneDGGE Bray-Curtis resemblance matrix used to gen-erate the MDS plot in Fig. 2A. This indicated thatsediment particle size and depth of the water columnwere the variables best explaining the AOB amoAcommunity pattern seen in Fig. 1A (ρ = 0.664; p =0.01).
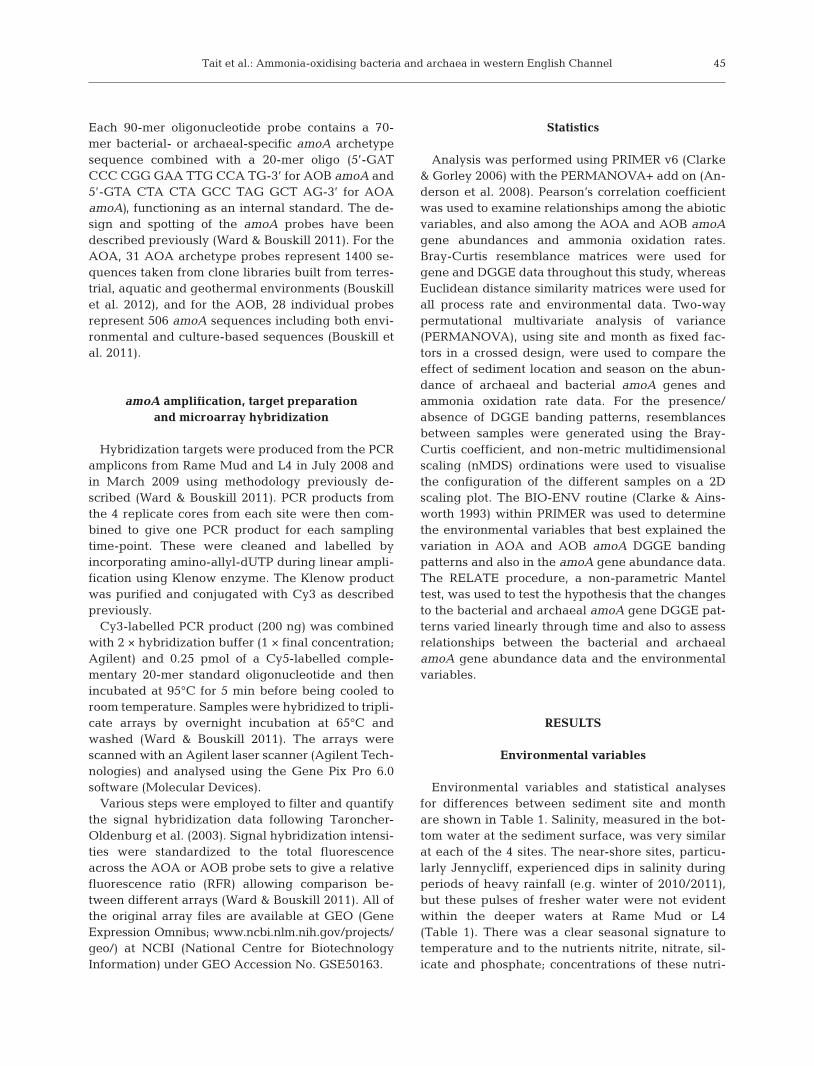
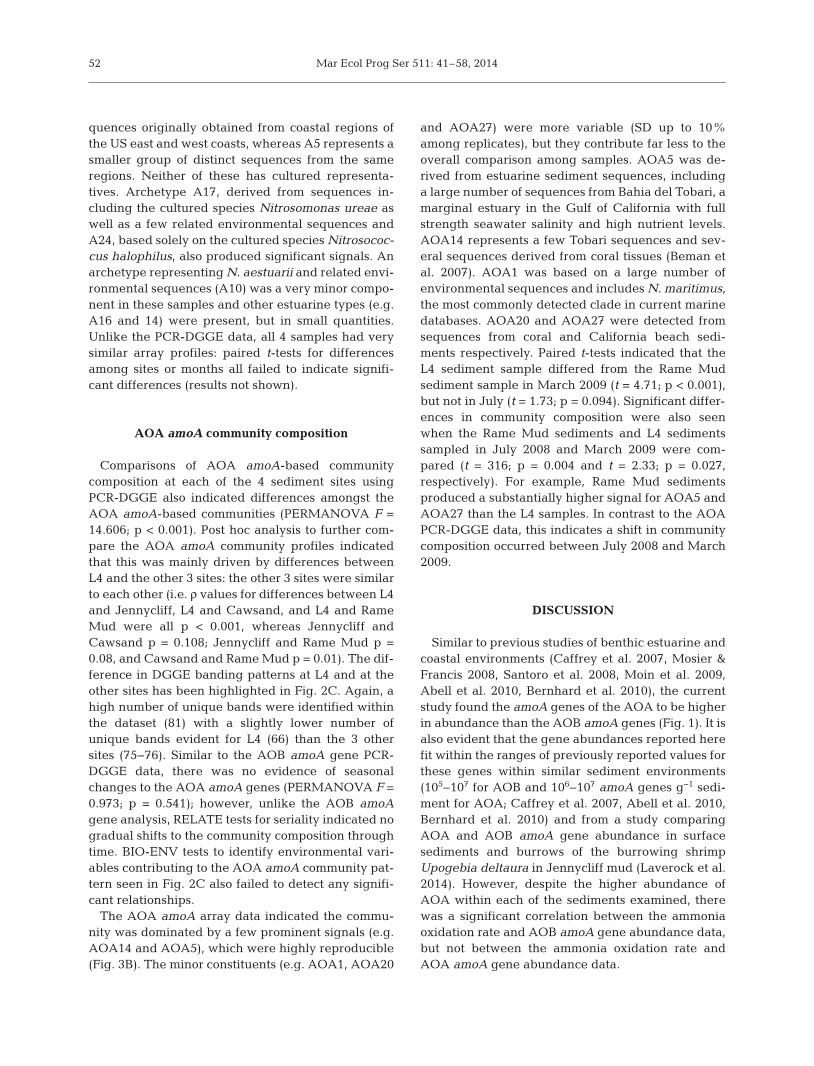
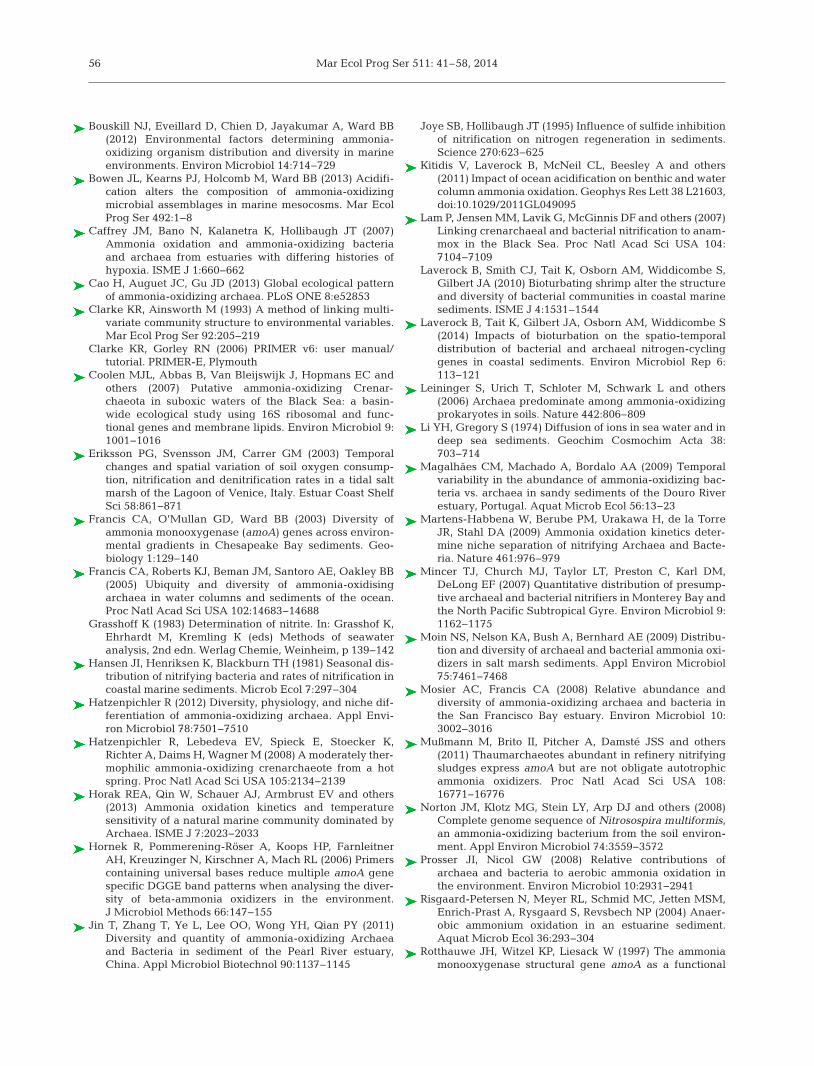
Community composition of the AOB within 4 sedi-ments samples (Rame Mud in July 2008 and March2009 and L4 in July 2008 and March 2009) was alsoinvestigated using a functional gene microarray com-posed of AOB amoA archetype probes (Fig. 3A).These samples are highlighted on the MDS plot inFig. 2A. Hybridization signals averaged from repli-cate arrays are expressed as relative fluorescenceratios (RFRs) to indicate relative abundance of the28 archetypes, representative of all known AOBclades at the time the array was designed (Bouskill etal. 2011). This revealed a dominance of coastal sedi-ment clades at both these sites (Fig. 3A): thestrongest hybridization signals on the AOB arraywere for archetypes A1 and A5. A1 represents themain marine Nitrosospira clade, derived from se -
50
Tait et al.: Ammonia-oxidising bacteria and archaea in western English Channel 51
JY08
M09
JY08
M09
2D Stress: 0.19
JY
S
N
J
M
MY JY SN
JM
MY
JY
S
N
M
MY
2D Stress: 0.17
JY
S
NJ
MY
JYS
N
J
MMY
JY
S N
M
MY
2D Stress: 0.13
JYS
N
J
M
MYJY
S
N JM
MY
SN
M
MY2D Stress: 0.16
JY08
M09
JY08
M09
2D Stress: 0.28
A B
D E
C
Fig. 2. Non-metric multidimensional scaling (nMDS) ordination of Bray-Curtis resemblances calculated from DGGE bandpresence/absence, illustrating spatial differences in (A) bacterial and (E) archaeal amoA genes. Symbols refer to sediment site:Jennycliff (n), Cawsand (z), Rame Mud (h) and L4 (f). Also indicated are samples used for the amoA gene microarray analy-sis. For clarity, ammonia-oxidising archaea (AOA) amoA data points for L4 are highlighted in grey. Also shown are the gradualshift in ammonia-oxidising bacteria (AOB) amoA genes through time at the (B) Jennycliff, (C) Cawsand and (D) Rame sites.Symbols refer to year sampled (2008, m; 2009, h; 2010, z; 2011, e) and letters refer to month: (JY) July; (S) September; (N)
November; (J) January; (M) March and (MY) May
0
0.1
0.2
0.3
0.4
0.5
0.6
0.7
0.8
0.9
1
Jul-08 Mar-09 Jul-08 Mar-09
L4 Rame
Rel
ativ
e ab
und
ance
AOB A1 AOB A5 AOB A17 AOB A24 AOB A14 AOB A25
AOB A8 AOB A16 AOB A18 AOB A13 Others
0
0.1
0.2
0.3
0.4
0.5
0.6
0.7
0.8
0.9
1
Jul-08 Mar-09 Jul-08 Mar-09
L4 Rame
AOA14 AOA5 AOA27 AOA1 AOA32 AOA20
AOA12 AOA24 AOA8 AOA9 Others
A B
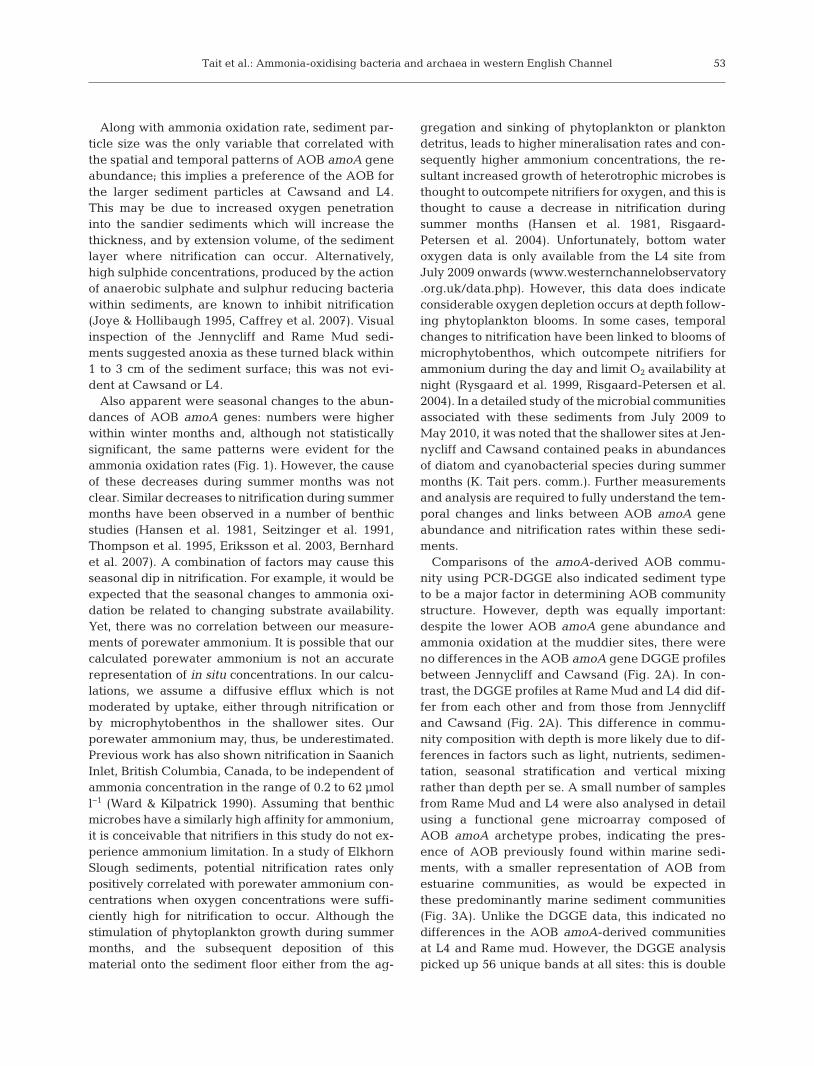
Fig. 3. Top 10 most abundant relative fluorescence ratios (RFRs) for (A) ammonia-oxidising archaea (AOB) and (B) ammonia-oxidising bacteria (AOA) amoA archetype probes from Rame Mud and L4 samples taken in July 2008 and March 2010. Details
of probes for the archaeal and bacterial amoA archetypes can be found at Bowen et al. (2013)
Mar Ecol Prog Ser 511: 41–58, 2014
quen ces originally obtained from coastal regions ofthe US east and west coasts, whereas A5 represents asmaller group of distinct sequences from the sameregions. Neither of these has cultured representa-tives. Archetype A17, derived from sequences in -cluding the cultured species Nitrosomonas ureae aswell as a few related environmental sequences andA24, based solely on the cultured species Nitrosococ-cus halophilus, also produced significant signals. Anarchetype representing N. aestuarii and related envi-ronmental sequences (A10) was a very minor compo-nent in these samples and other estuarine types (e.g.A16 and 14) were present, but in small quantities.Unlike the PCR-DGGE data, all 4 samples had verysimilar array profiles: paired t-tests for differencesamong sites or months all failed to indicate signifi-cant differences (results not shown).
AOA amoA community composition
Comparisons of AOA amoA-based communitycom position at each of the 4 sediment sites usingPCR-DGGE also indicated differences amongst theAOA amoA-based communities (PERMANOVA F =14.606; p < 0.001). Post hoc analysis to further com-pare the AOA amoA community profiles indicatedthat this was mainly driven by differences betweenL4 and the other 3 sites: the other 3 sites were similarto each other (i.e. ρ values for differences between L4and Jennycliff, L4 and Cawsand, and L4 and RameMud were all p < 0.001, whereas Jennycliff andCawsand p = 0.108; Jennycliff and Rame Mud p =0.08, and Cawsand and Rame Mud p = 0.01). The dif-ference in DGGE banding patterns at L4 and at theother sites has been highlighted in Fig. 2C. Again, ahigh number of unique bands were identified withinthe dataset (81) with a slightly lower number ofunique bands evident for L4 (66) than the 3 othersites (75−76). Similar to the AOB amoA gene PCR-DGGE data, there was no evidence of seasonalchanges to the AOA amoA genes (PERMANOVA F =0.973; p = 0.541); however, unlike the AOB amoAgene analysis, RELATE tests for seriality indicated nogradual shifts to the community composition throughtime. BIO-ENV tests to identify environmental vari-ables contributing to the AOA amoA community pat-tern seen in Fig. 2C also failed to detect any signifi-cant relationships.
The AOA amoA array data indicated the commu-nity was dominated by a few prominent signals (e.g.AOA14 and AOA5), which were highly reproducible(Fig. 3B). The minor constituents (e.g. AOA1, AOA20
and AOA27) were more variable (SD up to 10%among replicates), but they contribute far less to theoverall comparison among samples. AOA5 was de -rived from estuarine sediment sequences, includinga large number of sequences from Bahia del Tobari, amarginal estuary in the Gulf of California with fullstrength seawater salinity and high nutrient levels.AOA14 represents a few Tobari sequences and sev-eral sequences derived from coral tissues (Beman etal. 2007). AOA1 was based on a large number ofenvironmental sequences and includes N. maritimus,the most commonly detected clade in current marinedatabases. AOA20 and AOA27 were detected fromsequences from coral and California beach sedi-ments respectively. Paired t-tests indicated that theL4 sediment sample differed from the Rame Mudsediment sample in March 2009 (t = 4.71; p < 0.001),but not in July (t = 1.73; p = 0.094). Significant differ-ences in community composition were also seenwhen the Rame Mud sediments and L4 sedimentssampled in July 2008 and March 2009 were com-pared (t = 316; p = 0.004 and t = 2.33; p = 0.027,respectively). For example, Rame Mud sedimentsproduced a substantially higher signal for AOA5 andAOA27 than the L4 samples. In contrast to the AOAPCR-DGGE data, this indicates a shift in communitycomposition occurred between July 2008 and March2009.
DISCUSSION
Similar to previous studies of benthic estuarine andcoastal environments (Caffrey et al. 2007, Mosier &Francis 2008, Santoro et al. 2008, Moin et al. 2009,Abell et al. 2010, Bernhard et al. 2010), the currentstudy found the amoA genes of the AOA to be higherin abundance than the AOB amoA genes (Fig. 1). It isalso evident that the gene abundances reported herefit within the ranges of previously reported values forthese genes within similar sediment environments(105−107 for AOB and 106−107 amoA genes g−1 sedi-ment for AOA; Caffrey et al. 2007, Abell et al. 2010,Bernhard et al. 2010) and from a study comparingAOA and AOB amoA gene abundance in surfacesediments and burrows of the burrowing shrimpUpogebia deltaura in Jennycliff mud (Laverock et al.2014). However, despite the higher abundance ofAOA within each of the sediments examined, therewas a significant correlation between the ammoniaoxidation rate and AOB amoA gene abundance data,but not between the ammonia oxidation rate andAOA amoA gene abundance data.
52
Tait et al.: Ammonia-oxidising bacteria and archaea in western English Channel
Along with ammonia oxidation rate, sediment par-ticle size was the only variable that correlated withthe spatial and temporal patterns of AOB amoA geneabundance; this implies a preference of the AOB forthe larger sediment particles at Cawsand and L4.This may be due to increased oxygen penetrationinto the sandier sediments which will increase thethickness, and by extension volume, of the sedimentlayer where nitrification can occur. Alternatively,high sulphide concentrations, produced by the actionof anaerobic sulphate and sulphur reducing bacteriawithin sediments, are known to inhibit nitrification(Joye & Hollibaugh 1995, Caffrey et al. 2007). Visualinspection of the Jennycliff and Rame Mud sedi-ments suggested anoxia as these turned black within1 to 3 cm of the sediment surface; this was not evi-dent at Cawsand or L4.
Also apparent were seasonal changes to the abun-dances of AOB amoA genes: numbers were higherwithin winter months and, although not statisticallysignificant, the same patterns were evident for theammonia oxidation rates (Fig. 1). However, the causeof these decreases during summer months was notclear. Similar decreases to nitrification during summermonths have been observed in a number of benthicstudies (Hansen et al. 1981, Seitzinger et al. 1991,Thompson et al. 1995, Eriksson et al. 2003, Bernhardet al. 2007). A combination of factors may cause thisseasonal dip in nitrification. For example, it would beexpected that the seasonal changes to ammonia oxi-dation be related to changing substrate availability.Yet, there was no correlation between our measure-ments of porewater ammonium. It is possible that ourcalculated porewater ammonium is not an accuraterepresentation of in situ concentrations. In our calcu-lations, we assume a diffusive efflux which is notmoderated by uptake, either through nitrification orby microphytobenthos in the shallower sites. Ourporewater ammonium may, thus, be underestimated.Previous work has also shown nitrification in SaanichInlet, British Columbia, Canada, to be independent ofammonia concentration in the range of 0.2 to 62 μmoll−1 (Ward & Kilpatrick 1990). Assuming that benthicmicrobes have a similarly high affinity for ammonium,it is conceivable that nitrifiers in this study do not ex-perience ammonium limitation. In a study of ElkhornSlough sediments, potential nitrification ra tes onlypositively correlated with porewater ammonium con-centrations when oxygen concentrations were suffi-ciently high for nitrification to occur. Al though thestimulation of phytoplankton growth during summermonths, and the subsequent deposition of thismaterial onto the sediment floor either from the ag-
gregation and sinking of phytoplankton or planktondetritus, leads to higher mineralisation rates and con-sequently higher ammonium concentrations, the re-sultant increased growth of heterotrophic microbes isthought to outcompete nitrifiers for oxygen, and this isthought to cause a decrease in nitrification duringsummer months (Hansen et al. 1981, Risgaard- Petersen et al. 2004). Unfortunately, bottom wateroxygen data is only available from the L4 site fromJuly 2009 onwards (www. western channel observatory.org.uk/ data.php). However, this data does indicateconsiderable oxygen depletion occurs at depth follow-ing phytoplankton blooms. In some cases, temporalchanges to nitrification have been linked to blooms ofmicrophytobenthos, which outcompete nitrifiers forammonium during the day and limit O2 availability atnight (Rysgaard et al. 1999, Risgaard-Petersen et al.2004). In a detailed study of the microbial communitiesassociated with these sediments from July 2009 toMay 2010, it was noted that the shallower sites at Jen-nycliff and Cawsand contained peaks in abundancesof diatom and cyanobacterial species during summermonths (K. Tait pers. comm.). Further measurementsand analysis are required to fully understand the tem-poral changes and links between AOB amoA geneabundance and nitrification rates within these sedi-ments.
Comparisons of the amoA-derived AOB commu-nity using PCR-DGGE also indicated sediment typeto be a major factor in determining AOB communitystructure. However, depth was equally important:despite the lower AOB amoA gene abundance andammonia oxidation at the muddier sites, there wereno differences in the AOB amoA gene DGGE profilesbetween Jennycliff and Cawsand (Fig. 2A). In con-trast, the DGGE profiles at Rame Mud and L4 did dif-fer from each other and from those from Jennycliffand Cawsand (Fig. 2A). This difference in commu-nity composition with depth is more likely due to dif-ferences in factors such as light, nutrients, sedimen-tation, seasonal stratification and vertical mixingrather than depth per se. A small number of samplesfrom Rame Mud and L4 were also analysed in detailusing a functional gene microarray composed ofAOB amoA archetype probes, indicating the pres-ence of AOB previously found within marine sedi-ments, with a smaller representation of AOB fromestuarine communities, as would be expected inthese predominantly marine sediment communities(Fig. 3A). Unlike the DGGE data, this indicated nodifferences in the AOB amoA-derived communitiesat L4 and Rame mud. However, the DGGE analysispicked up 56 unique bands at all sites: this is double
53
Mar Ecol Prog Ser 511: 41–58, 2014
the number of AOB archetypes known to exist(Bouskill et al. 2011). It is likely that the DGGE isdetecting fine-detail changes within the major cladesidentified by the microarray (Fig. 3A). Both DGGEand microarray analysis failed to detect seasonalchanges to the AOB amoA community, indicatingthat the same community was present throughout theyear. However, the DGGE analysis revealed a grad-ual shift in the AOB population through time for Jen-nycliff, Cawsand and Rame Mud sediments (Fig. 2).As the microarray data did not detect changes incommunity composition between July 2008 andMarch 2009, it is likely that these changes are alsodue to fine-detail changes within the major cladesidentified. Although no changes through time weredetected within L4 sediments, the lack of thisresponse may be due to the less complete dataset forthis site. Alternatively, L4, the furthest from shore,and therefore furthest from the terrestrial or estuar-ine influence, may be less susceptible to disturbanceof the established community from periodic fluctua-tions in salinity, allochthonous organic matter supplyand seeding of the site with estuarine microbes.
Within this study, there was no correlation betweenAOA amoA gene abundance and nitrification rate.This is consistent with several other studies compar-ing AOA amoA gene abundance and activity in estu-arine and coastal sediments (Magalhães et al. 2009,Wankel et al. 2011). Although abundance was higherat the deeper sites than the shallow sites, decipher-ing the temporal and spatial patterns in AOA abun-dance was made more difficult by the higher spatialvariation amongst measurements (Fig. 1), and thislikely obscured any temporal trends. Aside from theunusually high peaks in abundance at L4 in July andSeptember of 2009 (Fig. 1H), like AOB amoA genes,AOA amoA gene abundance tended to be at its low-est in the summer months. In addition, the bimonthlysampling period may have also been too infrequentto pick up on rapid changes such as periodic pulses oforganic matter or resuspension of sediment material.Other than salinity, one of the key factors thought toinfluence the relative distribution of AOA versus AOBis ammonium concentration: AOB tend to be associ-ated with high substrate concentrations, whereas theAOA are considered to be oligotrophic (Coolen et al.2007, Bouskill et al. 2012, Horak et al. 2013). Cul-tured representatives of the AOA have much higheraffinities for ammonia when compared to the AOB(Martens-Habbena et al. 2009). Several AOA havealso been shown to have low thresholds for ammo-nium and ammonia. Published data have shown thepredominantly marine Crenarchaeota group I.1a to
be inhibited by ammonium and ammonia concentra-tions in the range of 1 to 20 mM and 18 to 145 μM(Hatzenpichler 2012). This sensitivity of the groupI.1a to ammonium concentrations may provide anadvantage for AOB when ammonium levels are high.Calculations of porewater ammonium concentrationsindicated levels fluctuated between a minimum of<1 μM and a maximum of 13 μM (at Cawsand in July2010) and an average of 3.5 μM across all sites, con-centrations that would be ex pected to, at the verymost, only periodically inhibit some but not all AOA.
An alternative explanation for the lack of correlationbetween AOA amoA gene abundance, nitrificationrates or any other environmental variable measuredwithin this study could be the ATU used to inhibit am-monia oxidation. The study of Santoro & Casciotti(2011) suggested that archaeal amoA were not com-pletely inhibited by ATU. They reported a 58% inhi-bition of nitrification at 0.09 mM, but 100% inhibitionat 0.86 mM. As a result of this finding, the final con-centration of ATU used in this study was 0.9 mM, sim-ilar to the concentration used by Santoro & Casciotti(2011) to completely inhibit nitrification. However, itmay be possible that, even at this concentration, notall AOA in our study were completely inhibited.
Although the genome of Nitrosopumilus maritimusSCM1 implies a potential for mixotrophic growth(Walker et al. 2010), and reports of mixotrophicgrowth of Crenarchaeota group 1.1b, also referred toas the ‘soil lineage’ (Teira et al. 2006, Hatzenpichleret al. 2008, Mußman et al. 2011), has provided in -creasing evidence that terrestrial AOA may not beexclusively autotrophic, mixotrophic growth has notbeen demonstrated for marine lineages. Similarly, itis known the AOB ammonia monooxygenase enzymehas alternate substrates, such as methane and carbonmonoxide (Ward 1990), but multi-functionality of theAOA ammonia monoxygenase had not yet beenproven. The continued high abundance of AOAamoA genes at each site and throughout the 3 yrperiod study implies an important role for the AOAwithin the western English Channel sedimentsexamined. The detection of the amoA gene does notnecessarily signal that an organism is carrying outammonia oxidation (Prosser & Nicol 2008, Stahl & dela Torre 2012). But it is possible that, in contrast to theAOB, the AOA in the sediments studied respond tochanging substrate availability by a shift in activityrather than abundance. For example, in a study ofammonia-oxidising microbes in waters of PugetSound, depth profiles of ammonia oxidation ratescorrelated with AOA amoA transcripts, but not AOAamoA gene copies (Horak et al. 2013).
54
Tait et al.: Ammonia-oxidising bacteria and archaea in western English Channel
The AOA amoA gene PCR-DGGE data indicatedthat there were no differences in community compo-sition over time. There were also no differences incommunity composition at Jennycliff, Cawsand orRame, but there were differences in community com-position between Rame Mud and L4 (Fig. 2E). Thiswas also evident in the microarray data (Fig. 3B). Dif-ferences in community composition were due to aconsistently higher signal for archetypes AOA5,AOA20 and AOA27 in Rame than in L4 samples(Fig. 3B). AOA5 was derived from the Bahía delTóbari, Mexico, a tropical saline estuary receivingsubstantial amounts of ammonium in agriculturalrunoff. Near identical sequences have also beenfound in estuarine sediments of the Zuari River, India(Singh et al. 2010) and the Pearl River estuary inChina (Cao et al. 2013). AOA20 and AOA27 werebased on sequences from corals and California beachsediments, respectively, but again have been foundin sediments in the Pearl River estuary (Cao et al.2013) and also sponges (Steger et al. 2008). A combi-nation of differences including sediment particle sizealongside factors associated with depth, as discussedabove, may be driving the differences in communitycomposition at L4. In contrast to the AOA PCR-DGGE data, the microarray data indicated a shift incommunity composition occurred between July 2008and March 2009. However, the PCR-DGGE resultsare based on presence/absence data and, thus, can-not detect changes in relative abundance of specificAOA amoA clades, as seen in the microarray data.
CONCLUSIONS
This study has shown that although AOA amoAgenes were more abundant within sediments in thewestern English Channel, measurements of AOB,and not AOA, amoA gene abundance correlated withbenthic ammonia oxidation rates. AOB amoA geneabundance and ammonia oxidation measurementswere highly correlated with sediment type, indica-ting a preference for sediments with larger particlesize, possibly due to higher oxygen penetration intosandier sediments or higher concentrations of inhi -bitory sulphide within muddier sediments. Temporalchanges to the abundance of AOB amoA genes andammonia oxidation were also evident, with bothdecreasing during summer months, but further studyis required to determine the cause of these decreaseswithin the different sediments examined. The lack ofcorrelation between AOA amoA abundance, ammo-nia oxidation rates or any of the environmental vari-
ables measured within this study was likely influ-enced by the higher spatial variation amongst mea -surements, which may have obscured temporaltrends, and also the bimonthly sampling, which waslikely too infrequent to capture temporal variabilityin organic matter deposition. Higher frequencymeasurements of transcript rather than gene abun-dance may provide a more accurate representation ofthe contribution of the AOB and AOA to rates ofammonia oxidation in sediments of the western Eng-lish Channel.
Acknowledgements. The work forms part of the PML Ben-thic Survey and was funded in part by the NERC pro-gramme Oceans 2025, NERC National Capability and theUS NSF Biocomplexity program. Thanks to the crew of‘Quest’ for collecting the sample and Malcolm Woodwardfor overseeing the nutrient analysis.
LITERATURE CITED
Abell GC, Revill AT, Smith C, Bissett AP, Volkman JK,Robert SS (2010) Archaeal ammonia oxidizers and nirS-type denitrifiers dominate sediment nitrifying and deni-trifying populations in a subtropical macrotidal estuary.ISME J 4: 286−300
Alonso-Sáez L, Waller AS, Mende DR, Bakker K and others(2012) Role for urea in nitrification by polar marineArchaea. Proc Natl Acad Sci USA 109: 17989−17994
Anderson M, Gorley RN, Clarke RK (2008) Permanova+ forPrimer: guide to software and statistical methods.PRIMER-e, Plymouth
Beman JM, Roberts KJ, Wegley L, Rohwer F, Francis CA(2007) Distribution and diversity of archaeal ammoniamonooxygenase genes associated with corals. Appl Env-iron Microbiol 73: 5642−5647
Beman JM, Popp BN, Francis CA (2008) Molecular and bio-geochemical evidence for ammonia oxidation by marineCrenarchaeota in the Gulf of California. ISME J 2: 429−441
Bernhard AE, Donn T, Giblin AE, Stahl DA (2005) Loss ofdiversity of ammonia-oxidizing bacteria correlates withincreasing salinity in an estuary system. Environ Micro-biol 7: 1289−1297
Bernhard AE, Tucker J, Giblin AE, Stahl DA (2007) Func-tionally distinct communities of ammonia-oxidizing bac-teria along an estuarine salinity gradient. Environ Micro-biol 9: 1439−1447
Bernhard AE, Landry ZC, Blevins A, de la Torre JR, GiblinAE, Stahl DA (2010) Abundance of ammonia-oxidizingarchaea and bacteria along an estuarine salinity gradientin relation to potential nitrification rates. Appl EnvironMicrobiol 76: 1285−1289
Biller SJ, Mosier AC, Wells GF, Francis CA (2012) Globalbiodiversity of aquatic ammonia-oxidizing archaea ispartitioned by habitat. Front Microbiol 3: 252
Bouskill NJ, Eveillard D, O’Mullan G, Jackson GA, Ward BB(2011) Seasonal and annual reoccurrence in beta -proteobacterial ammonia oxidizing bacterial populationstructure. Environ Microbiol 13: 872−886
55
Mar Ecol Prog Ser 511: 41–58, 2014
Bouskill NJ, Eveillard D, Chien D, Jayakumar A, Ward BB(2012) Environmental factors determining ammonia-oxidizing organism distribution and diversity in marineenvironments. Environ Microbiol 14: 714−729
Bowen JL, Kearns PJ, Holcomb M, Ward BB (2013) Acidifi-cation alters the composition of ammonia-oxidizingmicrobial assemblages in marine mesocosms. Mar EcolProg Ser 492: 1−8
Caffrey JM, Bano N, Kalanetra K, Hollibaugh JT (2007)Ammonia oxidation and ammonia-oxidizing bacteriaand archaea from estuaries with differing histories ofhypoxia. ISME J 1: 660−662
Cao H, Auguet JC, Gu JD (2013) Global ecological patternof ammonia-oxidizing archaea. PLoS ONE 8: e52853
Clarke KR, Ainsworth M (1993) A method of linking multi-variate community structure to environmental variables.Mar Ecol Prog Ser 92: 205−219
Clarke KR, Gorley RN (2006) PRIMER v6: user manual/tutorial. PRIMER-E, Plymouth
Coolen MJL, Abbas B, Van Bleijswijk J, Hopmans EC andothers (2007) Putative ammonia-oxidizing Crenar-chaeota in suboxic waters of the Black Sea: a basin-wide ecological study using 16S ribosomal and func-tional genes and membrane lipids. Environ Microbiol 9: 1001−1016
Eriksson PG, Svensson JM, Carrer GM (2003) Temporalchanges and spatial variation of soil oxygen consump-tion, nitrification and denitrification rates in a tidal saltmarsh of the Lagoon of Venice, Italy. Estuar Coast ShelfSci 58: 861−871
Francis CA, O’Mullan GD, Ward BB (2003) Diversity ofammonia monooxygenase (amoA) genes across environ-mental gradients in Chesapeake Bay sediments. Geo -biology 1: 129−140
Francis CA, Roberts KJ, Beman JM, Santoro AE, Oakley BB(2005) Ubiquity and diversity of ammonia-oxidisingarchaea in water columns and sediments of the ocean.Proc Natl Acad Sci USA 102: 14683−14688
Grasshoff K (1983) Determination of nitrite. In: Grasshof K,Ehrhardt M, Kremling K (eds) Methods of seawateranalysis, 2nd edn. Werlag Chemie, Weinheim, p 139−142
Hansen JI, Henriksen K, Blackburn TH (1981) Seasonal dis-tribution of nitrifying bacteria and rates of nitrification incoastal marine sediments. Microb Ecol 7: 297−304
Hatzenpichler R (2012) Diversity, physiology, and niche dif-ferentiation of ammonia-oxidizing archaea. Appl Envi-ron Microbiol 78: 7501−7510
Hatzenpichler R, Lebedeva EV, Spieck E, Stoecker K,Richter A, Daims H, Wagner M (2008) A moderately ther-mophilic ammonia-oxidizing crenarchaeote from a hotspring. Proc Natl Acad Sci USA 105: 2134−2139
Horak REA, Qin W, Schauer AJ, Armbrust EV and others(2013) Ammonia oxidation kinetics and temperature sensitivity of a natural marine community dominated byArchaea. ISME J 7: 2023−2033
Hornek R, Pommerening-Röser A, Koops HP, FarnleitnerAH, Kreuzinger N, Kirschner A, Mach RL (2006) Primerscontaining universal bases reduce multiple amoA genespecific DGGE band patterns when analysing the diver-sity of beta-ammonia oxidizers in the environment.J Microbiol Methods 66: 147−155
Jin T, Zhang T, Ye L, Lee OO, Wong YH, Qian PY (2011)Diversity and quantity of ammonia-oxidizing Archaeaand Bacteria in sediment of the Pearl River estuary,China. Appl Microbiol Biotechnol 90: 1137−1145
Joye SB, Hollibaugh JT (1995) Influence of sulfide inhibitionof nitrification on nitrogen regeneration in sediments.Science 270: 623−625
Kitidis V, Laverock B, McNeil CL, Beesley A and others(2011) Impact of ocean acidification on benthic and watercolumn ammonia oxidation. Geophys Res Lett 38 L21603,doi: 10.1029/2011GL049095
Lam P, Jensen MM, Lavik G, McGinnis DF and others (2007)Linking crenarchaeal and bacterial nitrification to anam-mox in the Black Sea. Proc Natl Acad Sci USA 104: 7104−7109
Laverock B, Smith CJ, Tait K, Osborn AM, Widdicombe S,Gilbert JA (2010) Bioturbating shrimp alter the structureand diversity of bacterial communities in coastal marinesediments. ISME J 4:1531–1544
Laverock B, Tait K, Gilbert JA, Osborn AM, Widdicombe S(2014) Impacts of bioturbation on the spatio-temporaldistribution of bacterial and archaeal nitrogen-cyclinggenes in coastal sediments. Environ Microbiol Rep 6: 113−121
Leininger S, Urich T, Schloter M, Schwark L and others(2006) Archaea predominate among ammonia-oxidizingprokaryotes in soils. Nature 442: 806−809
Li YH, Gregory S (1974) Diffusion of ions in sea water and indeep sea sediments. Geochim Cosmochim Acta 38: 703−714
Magalhães CM, Machado A, Bordalo AA (2009) Temporalvariability in the abundance of ammonia-oxidizing bac-teria vs. archaea in sandy sediments of the Douro Riverestuary, Portugal. Aquat Microb Ecol 56: 13−23
Martens-Habbena W, Berube PM, Urakawa H, de la TorreJR, Stahl DA (2009) Ammonia oxidation kinetics deter-mine niche separation of nitrifying Archaea and Bacte-ria. Nature 461: 976−979
Mincer TJ, Church MJ, Taylor LT, Preston C, Karl DM,DeLong EF (2007) Quantitative distribution of presump-tive archaeal and bacterial nitrifiers in Monterey Bay andthe North Pacific Subtropical Gyre. Environ Microbiol 9: 1162−1175
Moin NS, Nelson KA, Bush A, Bernhard AE (2009) Distribu-tion and diversity of archaeal and bacterial ammonia oxi-dizers in salt marsh sediments. Appl Environ Microbiol75: 7461−7468
Mosier AC, Francis CA (2008) Relative abundance anddiversity of ammonia-oxidizing archaea and bacteria inthe San Francisco Bay estuary. Environ Microbiol 10: 3002−3016
Mußmann M, Brito II, Pitcher A, Damsté JSS and others(2011) Thaumarchaeotes abundant in refinery nitrifyingsludges express amoA but are not obligate autotrophicammonia oxidizers. Proc Natl Acad Sci USA 108: 16771−16776
Norton JM, Klotz MG, Stein LY, Arp DJ and others (2008)Complete genome sequence of Nitrosospira multiformis,an ammonia-oxidizing bacterium from the soil environ-ment. Appl Environ Microbiol 74: 3559−3572
Prosser JI, Nicol GW (2008) Relative contributions ofarchaea and bacteria to aerobic ammonia oxidation inthe environment. Environ Microbiol 10: 2931−2941
Risgaard-Petersen N, Meyer RL, Schmid MC, Jetten MSM,Enrich-Prast A, Rysgaard S, Revsbech NP (2004) Anaer-obic ammonium oxidation in an estuarine sediment.Aquat Microb Ecol 36: 293−304
Rotthauwe JH, Witzel KP, Liesack W (1997) The ammoniamonooxygenase structural gene amoA as a functional
56
Tait et al.: Ammonia-oxidising bacteria and archaea in western English Channel
marker: molecular fine-scale analysis of natural ammo-nia-oxidizing populations. Appl Environ Microbiol 63: 4704−4712
Rysgaard S, Thastum P, Dalsgaard T, Christensen PB, SlothNP (1999) Effects of salinity on NH4
+ adsorption capacity,nitrification, and denitrification in Danish estuarine sedi-ments. Estuaries 22: 21−30
Santoro AE, Casciotti KL (2011) Enrichment and characteri-zation of ammonia-oxidizing archaea from the openocean: phylogeny, physiology and stable isotope fraction-ation. ISME J 5: 1796–1808
Santoro AE, Francis CA, de Sieyes NR, Boehm AB (2008)Shifts in the relative abundance of ammonia-oxidizingbacteria and archaea across physicochemical gradients ina subterranean estuary. Environ Microbiol 10: 1068−1079
Seitzinger SP, Gardner WS, Spratt AK (1991) The effect ofsalinity on ammonium sorption in aquatic sediments: implications for benthic nutrient recycling. Estuaries 14: 167−174
Shen JP, Zhang LM, Zhu YG, Zhang JB, He JZ (2008) Abun-dance and composition of ammonia-oxidizing bacteriaand ammonia-oxidizing archaea communities of an alka-line sandy loam. Environ Microbiol 10: 1601−1611
Singh SK, Verma P, Ramaiah N, Chandrashekar AA,Shouche YS (2010) Phylogenetic diversity of archaeal16S rRNA and ammonia monooxygenase genes fromtropical estuarine sediments on the central west coast ofIndia. Res Microbiol 161: 177−186
Smyth TJ, Fishwick JR, Al-Moosawi L, Cummings DG andothers (2010) A broad spatio-temporal view of the West-ern English Channel observatory. J Plankton Res 32: 585−601
Stahl DA, de la Torre JR (2012) Physiology and diversity ofammonia-oxidizing Archaea. Annu Rev Microbiol 66: 83−101
Steger D, Ettinger Epstein P, Whalan S, Hentschel U, De NysR, Wagner M, Taylor MW (2008) Diversity and mode oftransmission of ammonia-oxidizing archaea in marinesponges. Environ Microbiol 10: 1087−1094
Sweerts JPRA, Kelly CA, Rudd JWM, Hesslein R, Cappen-berg TE (1991) Similarity of whole-sediment moleculardiffusion coefficients in freshwater sediments of low andhigh porosity. Limnol Oceanogr 36: 335−342
Tait K, Laverock B, Widdicombe S (2014) Response of anarctic sediment nitrogen cycling community to increasedCO2. Estuaries Coasts 37: 724−735
Taroncher-Oldenburg G, Griner EM, Francis CA, Ward BB(2003) Oligonucleotide microarray for the study of func-tional gene diversity in the nitrogen cycle in the environ-ment. Appl Environ Microbiol 69: 1159−1171
Teira E, Van Aken H, Veth C, Herndl GJ (2006) Archaealuptake of enantiomeric amino acids in the meso- andbathypelagic waters of the North Atlantic. LimnolOceanogr 51: 60−69
Thompson SP, Paerl HW, Go MC (1995) Seasonal patterns ofnitrification and denitrification in a natural and arestored salt marsh. Estuaries 18: 399−408
Treusch AH, Leininger S, Kletzin A, Schuster SC, Klenk HP,Schleper C (2005) Novel genes for nitrite reductase andAmo related proteins indicate a role of uncultivatedmesophiliccrenarchaeota in nitrogen cycling. EnvironMicrobiol 7: 1985−1995
Venter JC, Remington K, Heidelberg JF, Halpern AL andothers (2004) Environmental genome shotgun sequen-cing of the Sargasso Sea. Science 304: 66−74
Walker CB, De La Torre JR, Klotz MG, Urakawa H and oth-ers (2010) Nitrosopumilus maritimus genome revealsunique mechanisms for nitrification and autotrophy inglobally distributed marine crenarchaea. Proc Natl AcadSci USA 107: 8818−8823
Wankel SD, Mosier AC, Hansel CM, Paytan A, Francis CA(2011) Spatial variability in nitrification rates and ammo-nia-oxidizing microbial communities in the agriculturallyimpacted Elkhorn Slough estuary, California. Appl Envi-ron Microbiol 77: 269−280
Ward BB (1990) Kinetics of ammonia oxidation by a marinenitrifying bacterium — methane as a substrate-analogue.Microb Ecol 19: 211−225
Ward BB, Bouskill NJ (2011) The utility of functional gene ar-rays for assessing community composition, relative abun-dance, and distribution of ammonia-oxidizing bacteriaand archaea. In: Klotz MG, Stein LY (eds) Methods in en-zymology: research on nitrification and related processes,Vol 496. Academic Press, Burlington, MA, p 373−396
Ward BB, Kilpatrick KA (1990) Relationship between sub-strate concentration and oxidation of ammonium andmethane in a stratified water column. Cont Shelf Res 10: 1193−1208
Ward BB, Eveillard D, Kirshtein JD, Nelson JD, Voytek MA,Jackson GA (2007) Ammonia-oxidizing bacterial com-munity composition in estuarine and oceanic environ-ments assessed using a functional gene microarray. Environ Microbiol 9: 2522−2538
Wuchter C, Abbas B, Coolen MJL, Herfort L and others(2006) Archaeal nitrification in the ocean. Proc Natl AcadSci USA 103: 12317−12322
Zheng Y, Hou L, Newell S, Liu M and others (2014) Commu-nity dynamics and activity of ammonia-oxidizing pro -karyotes in intertidal sediments of the Yangtze Estuary.Appl Environ Microbiol 80: 408−419
57
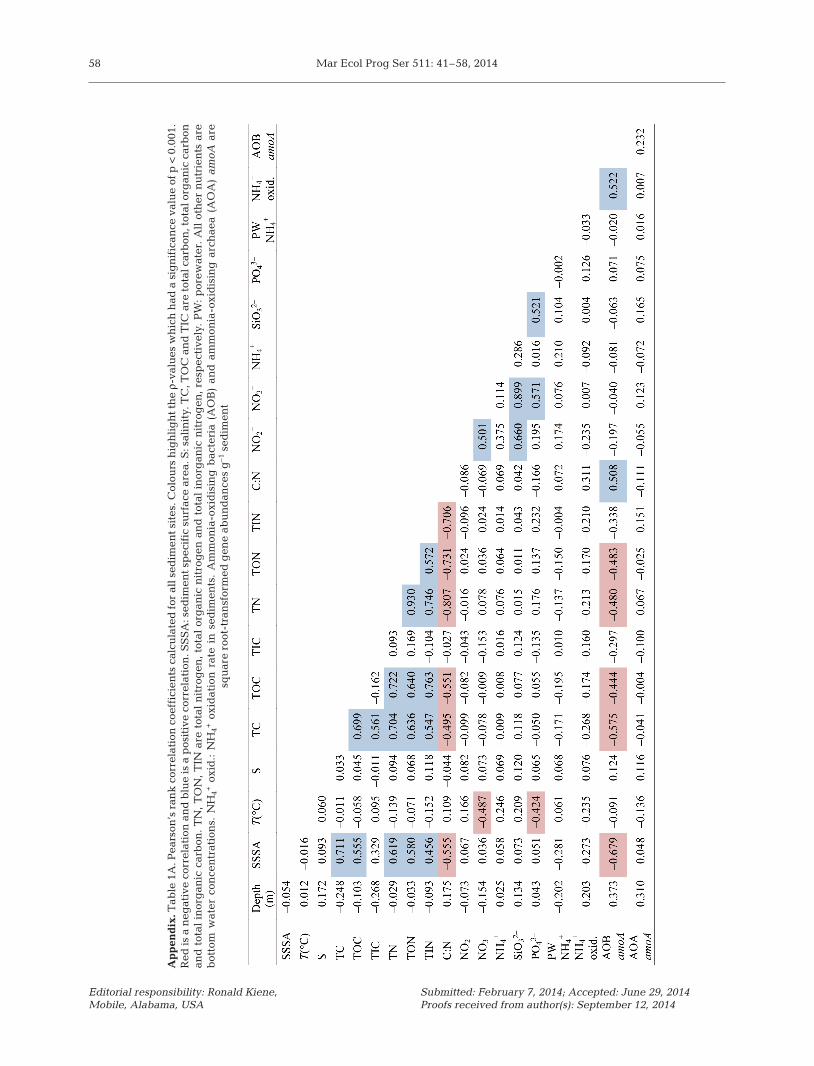
Mar Ecol Prog Ser 511: 41–58, 201458
Ap
pen
dix
.Tab
le 1
A. P
ears
on’s
ran
k c
orre
lati
on c
oeff
icie
nts
cal
cula
ted
for
all
sed
imen
t si
tes.
Col
ours
hig
hli
gh
t th
e ρ-
valu
es w
hic
h h
ad a
sig
nif
ican
ce v
alu
e of
p<
0.0
01.
Red
is a
neg
ativ
e co
rrel
atio
n a
nd
blu
e is
a p
osit
ive
corr
elat
ion
. SS
SA
: sed
i men
t sp
ecif
ic s
urf
ace
area
. S: s
alin
ity.
TC
, TO
C a
nd
TIC
are
tot
al c
arb
on, t
otal
org
anic
car
bon
and
tot
al i
nor
gan
ic c
arb
on.
TN
, T
ON
, T
IN a
re t
otal
nit
rog
en,
tota
l or
gan
ic n
itro
gen
an
d t
otal
in
org
anic
nit
rog
en,
resp
ecti
vely
. P
W:
por
ewat
er.
All
oth
er n
utr
ien
ts a
reb
otto
m w
ater
con
cen
trat
ion
s. N
H4+
oxid
.: N
H4+
oxid
atio
n r
ate
in s
edim
ents
. A
mm
onia
-oxi
dis
ing
bac
teri
a (A
OB
) an
d a
mm
onia
-oxi
dis
ing
arc
hae
a (A
OA
) am
oAar
e sq
uar
e ro
ot-t
ran
sfor
med
gen
e ab
un
dan
ces
g–1
sed
imen
t
Editorial responsibility: Ronald Kiene, Mobile, Alabama, USA
Submitted: February 7, 2014; Accepted: June 29, 2014Proofs received from author(s): September 12, 2014