Embed Size (px)
Citation preview
MARINE ECOLOGY PROGRESS SERIESMar Ecol Prog Ser
Vol. 346: 61–74, 2007doi: 10.3354/meps06996
Published September 27
INTRODUCTION
The sandy sediments that cover large parts of theshallow ocean floor are important sites of nutrientcycling and may play an important role in global bio-geochemical cycles (Huettel et al. 1998, Marinelli etal. 1998). Compared with fine-grained sediments inwhich porewater exchange is diffusion-limited, marinesands are characterized by high permeabilities, allow-
ing for efficient advective exchange of particulate anddissolved materials with the overlying waters. Al-though sandy sediments usually contain little organiccarbon and fewer microbial cells per volume than fine-grained sediments, the hydraulically driven ventilationmay support high rates of overall microbial metabolism(Buhring et al. 2005, Werner et al. 2006). The sandy,biogenic carbonate sediments that are widespread intropical regions are characterized by high volume-
© Inter-Research 2007 · www.int-res.com*Email: [email protected]
Spatial structure of the microbial community insandy carbonate sediment
Ketil B Sørensen1, 4,*, Brian Glazer2, 3, Angelos Hannides3, Eric Gaidos1
1Department of Geology and Geophysics, POST 701, 1680 East West Road, University of Hawaii at Manoa, Honolulu, Hawaii 96822, USA
2NASA Astrobiology Institute, 213 PSB, 2565 McCarthy Mall, University of Hawaii at Manoa, Honolulu, Hawaii 96822, USA3Department of Oceanography, MSB, 1000 Pope Road, University of Hawaii at Manoa, Honolulu, Hawaii 96822, USA
4Present address: Teknologiparken, Kongsvang Alle 29, Århus, Denmark
ABSTRACT: The environmental conditions in permeable carbonate sands are in many ways differentfrom those in fine-grained sediments, but little is known about how this affects the structure and com-position of the microbial community. We studied the microbial community structure in relation to thegeochemical zonation within a 4 m2 patch of a sandy carbonate sediment in Kane’ohe Bay, O’ahu,Hawaii. Porewater concentrations of oxygen and sulfide at depths between 15 and 52 cm were mea-sured in situ using voltammetry, and sediment samples from 0 to 5 cm, 25 to 35 cm, and 70 to 80 cmdepth were used to evaluate vertical and horizontal variation in the microbial community. Anoxic,suboxic (sulfide as well as oxygen below detection limit), or oxic conditions were measured in pore-water from between 15 and 32 cm below the sediment/water interface, with no consistent depth pat-tern. All measurements below 32 cm indicated anoxic conditions, with sulfide concentrations rangingfrom <10 to about 200 μM. The microbial community revealed by denaturing gradient gel elec-trophoresis (DGGE) was homogeneous in the surface sediment, while large variations were observedat 25 to 35 cm depth, and smaller variations occurred at 70 to 80 cm depth. Richness analysis of clonelibraries from each of the 3 depths indicated that the phylotype diversity was highest in the libraryfrom 25 to 35 cm depth. We suggest that the microbial community structure is correlated to localphysico-chemical conditions in the sediment and that spatio-temporally heterogeneous redox condi-tions result in an increased microbial diversity. A monophyletic group of phylotypes that were highlydivergent from any other sequences deposited in the GENBANK database was detected in the sedi-ment. These phylotypes may represent chloroplasts or plastids associated with eukaryotes or a newlineage of Bacteria related to the Cyanobacteria. Using specific primers, members of the group weredetected in sands from several coastal sites on the island of O’ahu.
KEY WORDS: Permeable sediment · Carbonate sediment · Microbial community composition ·Voltammetry · Spatial variation
Resale or republication not permitted without written consent of the publisher
Mar Ecol Prog Ser 346: 61–74, 2007
specific surface areas compared to other types of sandysediment, and may support relatively high numbers ofprokaryotes (Yamamoto & Lopez 1985, Wild et al.2006). A number of studies have documented howmicroorganisms in these sediments efficiently mineral-ize organic material derived from primary producerson the reef (Rasheed et al. 2003, Wild et al. 2004,Werner et al. 2006), and measurements of nitrogen fix-ation as well as chlorophyll a in surface layers of thesediments indicate that they may be sources of bothbioavailable nitrogen and organic carbon (Shashar etal. 1994, Rasheed et al. 2004). Wave pumping and tidalcurrents drive efficient, temporally variable advectivewater transport within the sediment and across thesediment/water interface, and porewater redox condi-tions may be temporally dynamic down to depths ofseveral tens of cm below the sediment surface (Falter &Sansone 2000a,b). The unique physico-chemical con-ditions combined with other factors, like potentiallyhigh predation rates and high pH buffering capacity,may result in different microbial populations com-pared to fine-grained sediments.
Molecular techniques, including PCR amplificationof DNA extracts followed by molecular fingerprintingand/or sequencing of phylotypes, have been usedfrequently to study the microbial community structurein marine sediments (e.g. Bowman & McCuaig 2003,Asami et al. 2005). However, to our knowledge only asingle study from the South Atlantic Bight has exam-ined the phylogenetic composition of microbial com-munities in sandy sediments using genetic techniquesand cloning/sequencing (Hunter et al. 2006). Verticalvariation in molecular community fingerprints wereobserved in carbonate sediments from Heron Island,Australia (Hewson & Fuhrman 2006), but the spatialstructure of microbial communities in sandy carbonatesediments has not been studied specifically in relationto biogeochemistry, and the identities of major phylo-genetic groups are unknown.
The objective of this study was to examine horizontaland vertical variations in microbial communities ofpermeable sandy carbonate sediment in relation toporewater geochemistry. The results suggest that spa-tio-temporal variations in porewater redox conditionsbelow the sediment surface play a major role in struc-turing the microbial community by increasing localdiversity and promoting spatial heterogeneity.
MATERIALS AND METHODS
Study site. Measurements and sampling was per-formed during 2005 at a patch reef (Moku o Lo’e orCoconut Island) in Kane’ohe Bay, O’ahu, Hawai’i,USA. The sediment at the sampling site consists of bio-
genic carbonate rubble with grain sizes from <1 mm toseveral cm. Wave exposure varies with season, tideand wind conditions, but is generally moderate as thesite is protected by the outer reef of Kane’ohe Bay.Tides are semi-diurnal with mean amplitudes ofapproximately 68 cm d–1 (Jokiel et al. 1993), and thehigh tide water depth at the sampling site is about 1 m.Salinity is generally oceanic (34 psu) with occasionalsalinity depression from stream runoff. The annualrange of surface water temperature in Kane’ohe Bay isapproximately 19 to 28°C, and the maximum observedwave height is about 50 cm (Falter & Sansone 2000a,b).
Voltammetric measurements. Porewater concentra-tions of dissolved oxygen and sulfide were measuredusing voltammetry, as described previously (Brendel &Luther 1995, Luther et al. 1998, Dollhopf et al. 2000,Glazer et al. 2006). The electrode setup consisted of anAu/Hg working electrode (0.1 mm diameter), asilver/silver chloride (Ag/AgCl) reference electrode(0.5 mm diameter), and a platinum (Pt) counter elec-trode (0.5 mm diameter). All electrodes were custom-made, sealed in commercially available polyether-etherketone (PEEK) tubing using epoxy (Brendel &Luther 1995, Luther et al. 1998). Linear sweep, cyclic,or square wave voltammetry was used, scanning from–0.1 V to –1.85 V at a scan rate of 250 to 2000 mV s–1.Electrochemical conditioning of the electrode surfacewas performed between scans in order to remove anychemical species from the surface of the electrode. Theelectrodes were calibrated using a benchtop DLK-60electrochemical analyzer (Analytical Instrument Sys-tems) following established standardization proce-dures (Brendel & Luther 1995). For field measure-ments, a DLK-60 analyzer was used with the additionof a portable DC power converter, allowing us to usethe system with a 12 V DC deep-cycle battery.
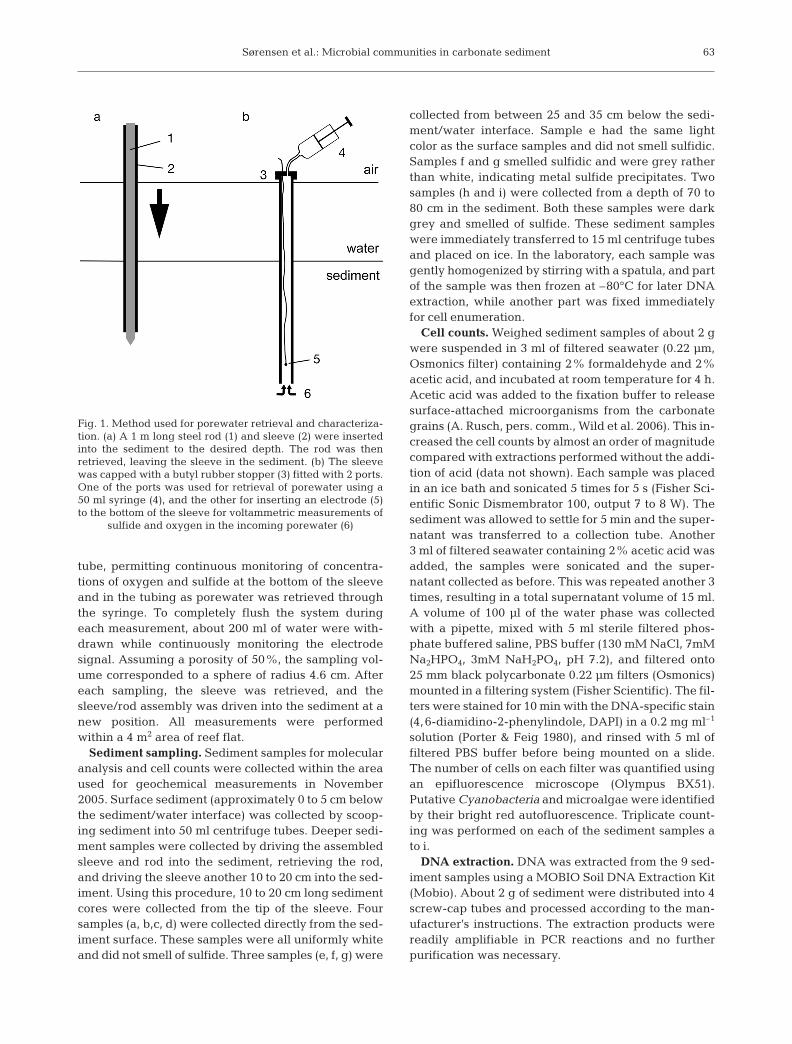
Porewater geochemistry. Measurements were madein the field in October 2005. A modification of estab-lished porewater sampling techniques developedpreviously for highly permeable sediments (Falter &Sansone 2000a) was used in combination with voltam-metric measurements of sulfide and oxygen (Fig. 1). Apointed stainless steel rod (length 1 m, diameter 1 cm)and sleeve were driven into the sediment to thedesired depth. Due to the high permeability of the sed-iment, porewater readily seeped into the sleeve uponremoval of the rod. The sleeve was capped with a butylrubber stopper fitted with 2 ports. Porewater was sam-pled through one of the ports using standard HPLCPEEK tubing and a 50 ml syringe. The other port wasused to insert a solid-state gold/amalgam (Au/Hg)voltammetric electrode for simultaneous measurementof sulfide and oxygen concentrations in the porewateras it entered the system at the bottom of the sleeve. Asimilar electrode was placed inline with the sampling
62
Sørensen et al.: Microbial communities in carbonate sediment
tube, permitting continuous monitoring of concentra-tions of oxygen and sulfide at the bottom of the sleeveand in the tubing as porewater was retrieved throughthe syringe. To completely flush the system duringeach measurement, about 200 ml of water were with-drawn while continuously monitoring the electrodesignal. Assuming a porosity of 50%, the sampling vol-ume corresponded to a sphere of radius 4.6 cm. Aftereach sampling, the sleeve was retrieved, and thesleeve/rod assembly was driven into the sediment at anew position. All measurements were performedwithin a 4 m2 area of reef flat.
Sediment sampling. Sediment samples for molecularanalysis and cell counts were collected within the areaused for geochemical measurements in November2005. Surface sediment (approximately 0 to 5 cm belowthe sediment/water interface) was collected by scoop-ing sediment into 50 ml centrifuge tubes. Deeper sedi-ment samples were collected by driving the assembledsleeve and rod into the sediment, retrieving the rod,and driving the sleeve another 10 to 20 cm into the sed-iment. Using this procedure, 10 to 20 cm long sedimentcores were collected from the tip of the sleeve. Foursamples (a, b,c, d) were collected directly from the sed-iment surface. These samples were all uniformly whiteand did not smell of sulfide. Three samples (e, f, g) were
collected from between 25 and 35 cm below the sedi-ment/water interface. Sample e had the same lightcolor as the surface samples and did not smell sulfidic.Samples f and g smelled sulfidic and were grey ratherthan white, indicating metal sulfide precipitates. Twosamples (h and i) were collected from a depth of 70 to80 cm in the sediment. Both these samples were darkgrey and smelled of sulfide. These sediment sampleswere immediately transferred to 15 ml centrifuge tubesand placed on ice. In the laboratory, each sample wasgently homogenized by stirring with a spatula, and partof the sample was then frozen at –80°C for later DNAextraction, while another part was fixed immediatelyfor cell enumeration.
Cell counts. Weighed sediment samples of about 2 gwere suspended in 3 ml of filtered seawater (0.22 μm,Osmonics filter) containing 2% formaldehyde and 2%acetic acid, and incubated at room temperature for 4 h.Acetic acid was added to the fixation buffer to releasesurface-attached microorganisms from the carbonategrains (A. Rusch, pers. comm., Wild et al. 2006). This in-creased the cell counts by almost an order of magnitudecompared with extractions performed without the addi-tion of acid (data not shown). Each sample was placedin an ice bath and sonicated 5 times for 5 s (Fisher Sci-entific Sonic Dismembrator 100, output 7 to 8 W). Thesediment was allowed to settle for 5 min and the super-natant was transferred to a collection tube. Another3 ml of filtered seawater containing 2% acetic acid wasadded, the samples were sonicated and the super-natant collected as before. This was repeated another 3times, resulting in a total supernatant volume of 15 ml.A volume of 100 μl of the water phase was collectedwith a pipette, mixed with 5 ml sterile filtered phos-phate buffered saline, PBS buffer (130 mM NaCl, 7mMNa2HPO4, 3mM NaH2PO4, pH 7.2), and filtered onto25 mm black polycarbonate 0.22 μm filters (Osmonics)mounted in a filtering system (Fisher Scientific). The fil-ters were stained for 10 min with the DNA-specific stain(4,6-diamidino-2-phenylindole, DAPI) in a 0.2 mg ml–1
solution (Porter & Feig 1980), and rinsed with 5 ml offiltered PBS buffer before being mounted on a slide.The number of cells on each filter was quantified usingan epifluorescence microscope (Olympus BX51). Putative Cyanobacteria and microalgae were identifiedby their bright red autofluorescence. Triplicate count-ing was performed on each of the sediment samples ato i.
DNA extraction. DNA was extracted from the 9 sed-iment samples using a MOBIO Soil DNA Extraction Kit(Mobio). About 2 g of sediment were distributed into 4screw-cap tubes and processed according to the man-ufacturer’s instructions. The extraction products werereadily amplifiable in PCR reactions and no furtherpurification was necessary.
63
Fig. 1. Method used for porewater retrieval and characteriza-tion. (a) A 1 m long steel rod (1) and sleeve (2) were insertedinto the sediment to the desired depth. The rod was thenretrieved, leaving the sleeve in the sediment. (b) The sleevewas capped with a butyl rubber stopper (3) fitted with 2 ports.One of the ports was used for retrieval of porewater using a50 ml syringe (4), and the other for inserting an electrode (5)to the bottom of the sleeve for voltammetric measurements of
sulfide and oxygen in the incoming porewater (6)
Mar Ecol Prog Ser 346: 61–74, 2007
Molecular fingerprinting. The extracted DNA sam-ples were compared using nested PCR amplification ofa fragment of the 16S rRNA gene followed by denatur-ing gradient gel electrophoresis (DGGE) (Muyzer et al.1993). The approach with 2 rounds of PCR, each with arelatively low number of cycles, was taken in order toimprove the quality of the final PCR product (Thomp-son et al. 2002). DNA extraction product (0.3 μl) wasadded to a 50 μl reaction mixture containing 1.5 mMMg++, 1 unit of FastStart Taq polymerase (Roche),10 nmol dNTP, 10 nmol bovine serum albumine(Roche), and 50 nmol of Bacteria-specific primersBAC8f (5’-AGRGTTTGATCCTGGCTCAG-3’) andBAC1492r (5’-CGGCTACCTTGTTACGACTT-3’). Atotal of 20 PCR cycles were performed in an ABI 7000thermocycler, with each cycle consisting of 45 s of de-naturing at 94°C, a 45 s annealing step at 56°C, and a2 min elongation step at 72°C. Subsequently, 1 μl of thereaction product was transferred to a fresh reactionmixture and amplified, as before, in PCR cycles withprimers GC-BAC341f (5’-CGCCCGCCGCGCGCGGCGGGCGGGGCGGGGGCACGGGGGGCCTACGGGRGGCAGCAG-3’) and BAC521r (5’-ACCGCGGCT-GCTGGCAC-3’) (all primers from Integrated DNATechnologies). The quality and concentration of theproduct in each reaction was evaluated on 2% agarosegels. The PCR products were separated in a DGGE-1001 denaturing gradient gel electrophoresis system(C.B.S. Scientific Company). Stock solutions represent-ing 0% and 100% denaturing agent were prepared.The 0% solution consisted of 10% acrylamide/bis-acrylamide (37.5:1) in 0.5 × Tris/acetic acid/EDTAbuffer (TAE), and the 100% solution consisted of 10%acrylamide/bis-acrylamide, 420 g l–1 urea, and 400 mll–1 formamide in 0.5 × TAE. The DGGE gels were castusing mixtures of these stock solutions in denaturinggradients with 40% denaturing agent in the top and70% in the bottom of the gels. Similar amounts of DNA(between 10 and 25 μl of the PCR product, dependingon concentration) were loaded in each well, and thegels were run for 18 h at 120 V and 60°C. The gels werestained for 15 min in 0.5 × TAE buffer containing1:10 000 SYBR-green I (Cambrex Bio Science) and eval-uated on a UV transilluminator (Spectroline).
Comparison of DGGE band patterns. The absenceor presence of the i th band in the j th lane on theDGGE gel was registered by assigning a score Si
x of 0(absence) or 1 (presence). The matrix containing thesescores was used to calculate a distance matrix repre-senting the differences in band patterns. The distancebetween lanes (samples) x and y was calculatedaccording to:
(1)
where N was the total number of different bands onthe gel. Finally, a distance tree (Neighbor Joining) wasconstructed based on the calculated distance matrixusing the programs NEIGHBOR, RETREE, and DRAW-GRAM of the PHYLIP software package (Felsenstein1988).
Cloning and sequencing. Clone libraries were con-structed from samples a (0 to 5 cm depth in sediment),e (25 to 35 cm depth), and h (70 to 80 cm depth). PCRreactions were performed as described above (but with30 cycles) using primers BAC8f and BAC1492r, or withgeneral prokaryotic primers GEN536f (5’-CAGCMGC-CGCGGTAATWC-3’) and GEN1392r (5’-ACGGGCG-GTGTGTRC-3’). PCR products were gel-purified on1% low-melting-point agarose gels. About 50 ng ofPCR product was loaded on the gel, run for 30 min at70 V, and stained with ethidium bromide. DNA wasextracted from the gel using the QIAEX®II gel extrac-tion kit according to the manufacturer’s instructions(QIAGEN). The purified DNA samples were A-tailedto improve cloning efficiency by mixing the purifiedPCR product (40 μl) with 5 μl deoxyadenosine triphos-phate (2 mM), 5 μl 10 × PCR reaction buffer, and 1 unitof FastStart Taq DNA polymerase (Roche). The mix-ture was incubated at 72°C for 10 min, extracted withphenol/chloroform/isoamylalcohol (25:24:1), and cen-trifuged at 6000 × g for 5 min. The aqueous phase wasthen transferred to a fresh microcentrifuge tube andprecipitated with 2.5 volumes of ethanol and 0.1 vol-umes of 5 M NaCl. After centrifugation (10 min,10 000 × g, 4°C), the pellet was washed once with 20 μl70% ethanol, air-dried, and resuspended in 4 μl water.The purified and A-tailed PCR products were ligatedinto a pGEM®-T vector (Promega) and transformed byheat shock (42°C, 50 s) into JM109 cells (Promega)according to the manufacturer’s specifications.Sequence data were obtained from the Center forGenomics, Proteomics, and Bioinformatics at theUniversity of Hawaii using sequencing primers M13F(5’-GTAAAACGACGGCCAG-3’) and M13R (5’-CAG-GAAACAGCTATGAC-3’). Forward and reverse readswere assembled, aligned, and checked for chimericstructures using BELLEROPHON (Huber et al. 2004).
Phylogenetic analysis and design of specific PCRprimers. Sequence data were compared against theGenbank 16S rRNA database using BLAST (Altschul1997). The sequences were aligned using CLUSTAL W(Thompson et al. 1994) followed by manual alignmentin Bioedit 7.0.0 (available at www.mbio.ncsu.edu/BioEdit/bioedit.html). Phylogenetic trees were con-structed from the alignment sequences using programsof the PHYLIP package to calculate Jukes-Cantor dis-tance matrices followed by Neighbor Joining. Bootstrap-ping (1000 resamplings) was performed in order to val-idate the tree topology. Primers were designed based on
D S Sxy xi
yi
i
( )= −−
=∑NN
1 2
1
64
Sørensen et al.: Microbial communities in carbonate sediment
the clone libraries obtained using PRIMROSE(Ashelford et al. 2002), and the specificity of each primerwas subsequently tested by screening against the RDP IIdatabase using <PROBE MATCH> (available atrdp.cme. msu.edu).
Sequence accession numbers. The phylotypes foundduring this study can be downloaded from the NCBIhomepage (www.ncbi.nlm.nih.gov). The accessionnumbers are EF208619 to EF208746.
RESULTS
Porewater geochemistry
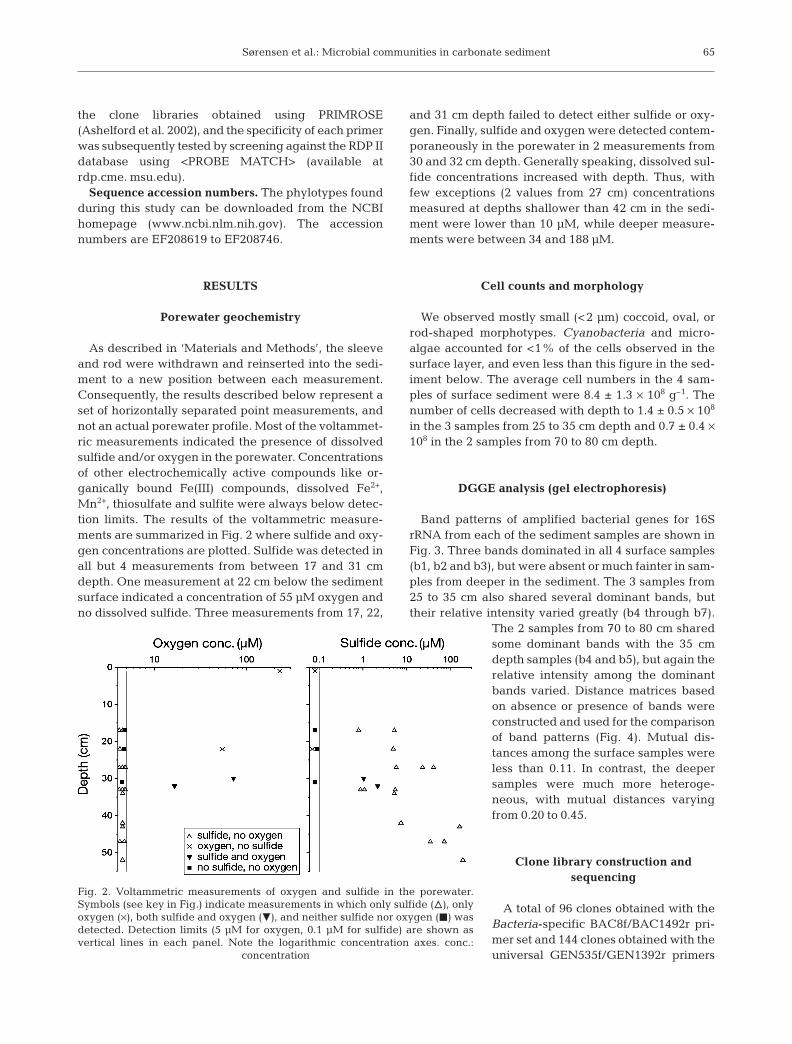
As described in ‘Materials and Methods’, the sleeveand rod were withdrawn and reinserted into the sedi-ment to a new position between each measurement.Consequently, the results described below represent aset of horizontally separated point measurements, andnot an actual porewater profile. Most of the voltammet-ric measurements indicated the presence of dissolvedsulfide and/or oxygen in the porewater. Concentrationsof other electrochemically active compounds like or-ganically bound Fe(III) compounds, dissolved Fe2+,Mn2+, thiosulfate and sulfite were always below detec-tion limits. The results of the voltammetric measure-ments are summarized in Fig. 2 where sulfide and oxy-gen concentrations are plotted. Sulfide was detected inall but 4 measurements from between 17 and 31 cmdepth. One measurement at 22 cm below the sedimentsurface indicated a concentration of 55 μM oxygen andno dissolved sulfide. Three measurements from 17, 22,
and 31 cm depth failed to detect either sulfide or oxy-gen. Finally, sulfide and oxygen were detected contem-poraneously in the porewater in 2 measurements from30 and 32 cm depth. Generally speaking, dissolved sul-fide concentrations increased with depth. Thus, withfew exceptions (2 values from 27 cm) concentrationsmeasured at depths shallower than 42 cm in the sedi-ment were lower than 10 μM, while deeper measure-ments were between 34 and 188 μM.
Cell counts and morphology
We observed mostly small (<2 μm) coccoid, oval, orrod-shaped morphotypes. Cyanobacteria and micro-algae accounted for <1% of the cells observed in thesurface layer, and even less than this figure in the sed-iment below. The average cell numbers in the 4 sam-ples of surface sediment were 8.4 ± 1.3 × 10⁸ g–1. Thenumber of cells decreased with depth to 1.4 ± 0.5 × 10⁸
in the 3 samples from 25 to 35 cm depth and 0.7 ± 0.4 ×10⁸ in the 2 samples from 70 to 80 cm depth.
DGGE analysis (gel electrophoresis)
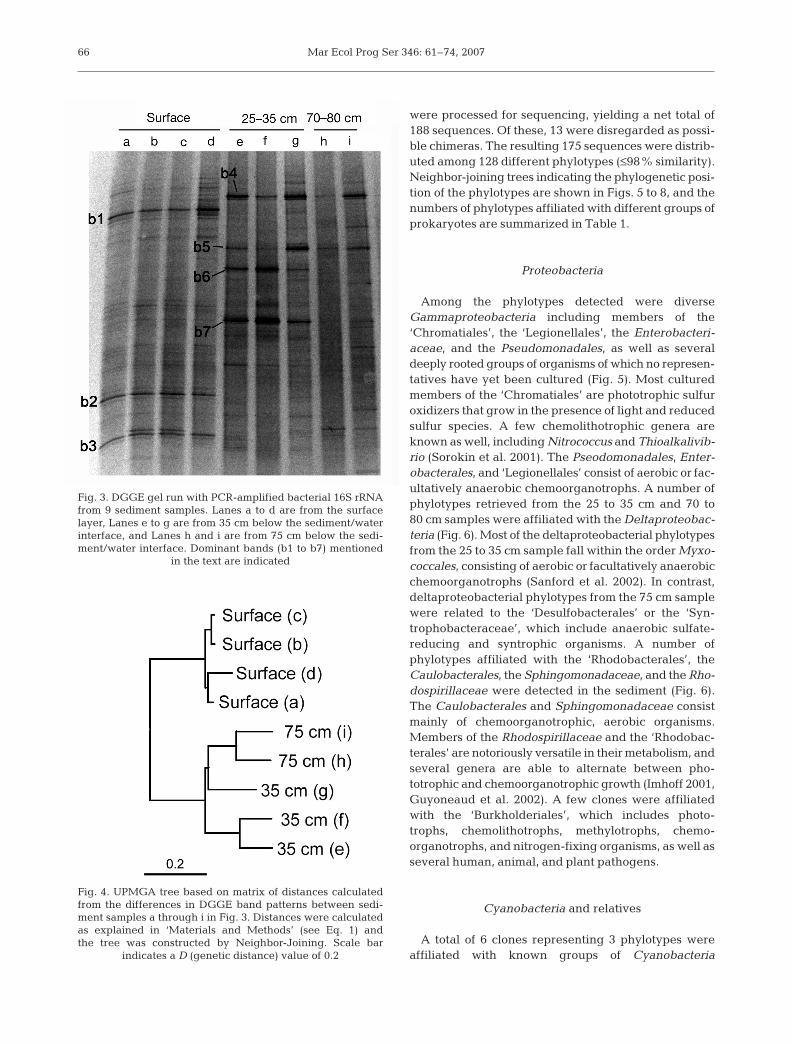
Band patterns of amplified bacterial genes for 16SrRNA from each of the sediment samples are shown inFig. 3. Three bands dominated in all 4 surface samples(b1, b2 and b3), but were absent or much fainter in sam-ples from deeper in the sediment. The 3 samples from25 to 35 cm also shared several dominant bands, buttheir relative intensity varied greatly (b4 through b7).
The 2 samples from 70 to 80 cm sharedsome dominant bands with the 35 cmdepth samples (b4 and b5), but again therelative intensity among the dominantbands varied. Distance matrices basedon absence or presence of bands wereconstructed and used for the comparisonof band patterns (Fig. 4). Mutual dis-tances among the surface samples wereless than 0.11. In contrast, the deepersamples were much more heteroge-neous, with mutual distances varyingfrom 0.20 to 0.45.
Clone library construction andsequencing
A total of 96 clones obtained with theBacteria-specific BAC8f/BAC1492r pri-mer set and 144 clones obtained with theuniversal GEN535f/GEN1392r primers
65
Fig. 2. Voltammetric measurements of oxygen and sulfide in the porewater.Symbols (see key in Fig.) indicate measurements in which only sulfide (n), onlyoxygen (×), both sulfide and oxygen (z), and neither sulfide nor oxygen (j) wasdetected. Detection limits (5 μM for oxygen, 0.1 μM for sulfide) are shown asvertical lines in each panel. Note the logarithmic concentration axes. conc.:
concentration
Mar Ecol Prog Ser 346: 61–74, 2007
were processed for sequencing, yielding a net total of188 sequences. Of these, 13 were disregarded as possi-ble chimeras. The resulting 175 sequences were distrib-uted among 128 different phylotypes (≤98% similarity).Neighbor-joining trees indicating the phylogenetic posi-tion of the phylotypes are shown in Figs. 5 to 8, and thenumbers of phylotypes affiliated with different groups ofprokaryotes are summarized in Table 1.
Proteobacteria
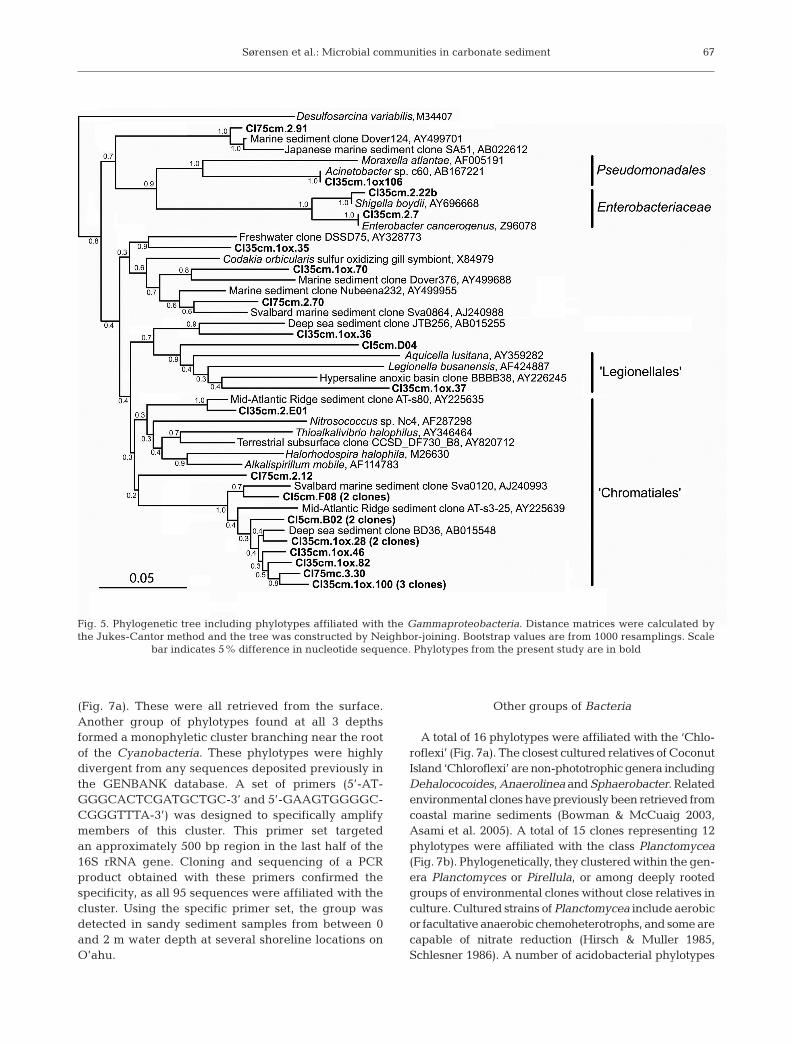
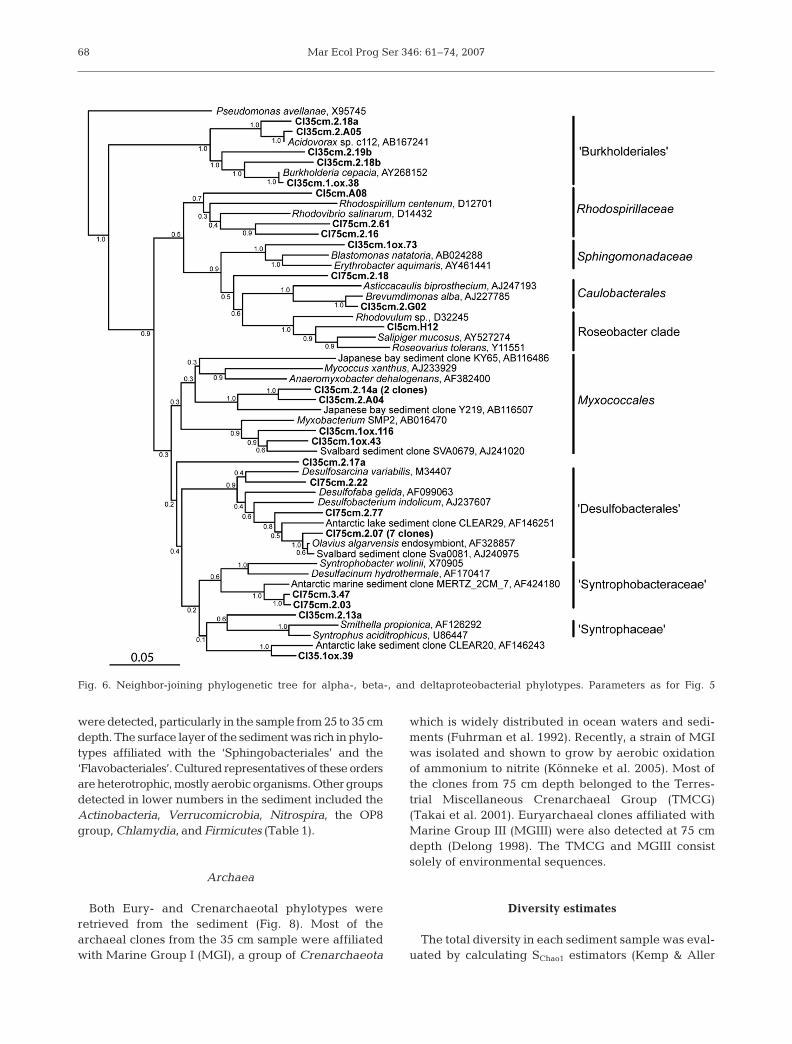
Among the phylotypes detected were diverseGammaproteobacteria including members of the‘Chromatiales’, the ‘Legionellales’, the Enterobacteri-aceae, and the Pseudomonadales, as well as severaldeeply rooted groups of organisms of which no represen-tatives have yet been cultured (Fig. 5). Most culturedmembers of the ‘Chromatiales’ are phototrophic sulfuroxidizers that grow in the presence of light and reducedsulfur species. A few chemolithotrophic genera areknown as well, including Nitrococcus and Thioalkalivib-rio (Sorokin et al. 2001). The Pseodomonadales, Enter-obacterales, and ‘Legionellales’ consist of aerobic or fac-ultatively anaerobic chemoorganotrophs. A number ofphylotypes retrieved from the 25 to 35 cm and 70 to80 cm samples were affiliated with the Deltaproteobac-teria (Fig. 6). Most of the deltaproteobacterial phylotypesfrom the 25 to 35 cm sample fall within the order Myxo-coccales, consisting of aerobic or facultatively anaerobicchemoorganotrophs (Sanford et al. 2002). In contrast,deltaproteobacterial phylotypes from the 75 cm samplewere related to the ‘Desulfobacterales’ or the ‘Syn-trophobacteraceae’, which include anaerobic sulfate-reducing and syntrophic organisms. A number ofphylotypes affiliated with the ‘Rhodobacterales’, theCaulobacterales, the Sphingomonadaceae, and the Rho-dospirillaceae were detected in the sediment (Fig. 6).The Caulobacterales and Sphingomonadaceae consistmainly of chemoorganotrophic, aerobic organisms.Members of the Rhodospirillaceae and the ‘Rhodobac-terales’ are notoriously versatile in their metabolism, andseveral genera are able to alternate between pho-totrophic and chemoorganotrophic growth (Imhoff 2001,Guyoneaud et al. 2002). A few clones were affiliatedwith the ‘Burkholderiales’, which includes photo-trophs, chemolithotrophs, methylotrophs, chemo-organotrophs, and nitrogen-fixing organisms, as well asseveral human, animal, and plant pathogens.
Cyanobacteria and relatives
A total of 6 clones representing 3 phylotypes wereaffiliated with known groups of Cyanobacteria
66
Fig. 3. DGGE gel run with PCR-amplified bacterial 16S rRNAfrom 9 sediment samples. Lanes a to d are from the surfacelayer, Lanes e to g are from 35 cm below the sediment/waterinterface, and Lanes h and i are from 75 cm below the sedi-ment/water interface. Dominant bands (b1 to b7) mentioned
in the text are indicated
Fig. 4. UPMGA tree based on matrix of distances calculatedfrom the differences in DGGE band patterns between sedi-ment samples a through i in Fig. 3. Distances were calculatedas explained in ‘Materials and Methods’ (see Eq. 1) andthe tree was constructed by Neighbor-Joining. Scale bar
indicates a D (genetic distance) value of 0.2
Sørensen et al.: Microbial communities in carbonate sediment
(Fig. 7a). These were all retrieved from the surface.Another group of phylotypes found at all 3 depthsformed a monophyletic cluster branching near the rootof the Cyanobacteria. These phylotypes were highlydivergent from any sequences deposited previously inthe GENBANK database. A set of primers (5’-AT-GGGCACTCGATGCTGC-3’ and 5’-GAAGTGGGGC-CGGGTTTA-3’) was designed to specifically amplifymembers of this cluster. This primer set targetedan approximately 500 bp region in the last half of the16S rRNA gene. Cloning and sequencing of a PCRproduct obtained with these primers confirmed thespecificity, as all 95 sequences were affiliated with thecluster. Using the specific primer set, the group wasdetected in sandy sediment samples from between 0and 2 m water depth at several shoreline locations onO’ahu.
Other groups of Bacteria
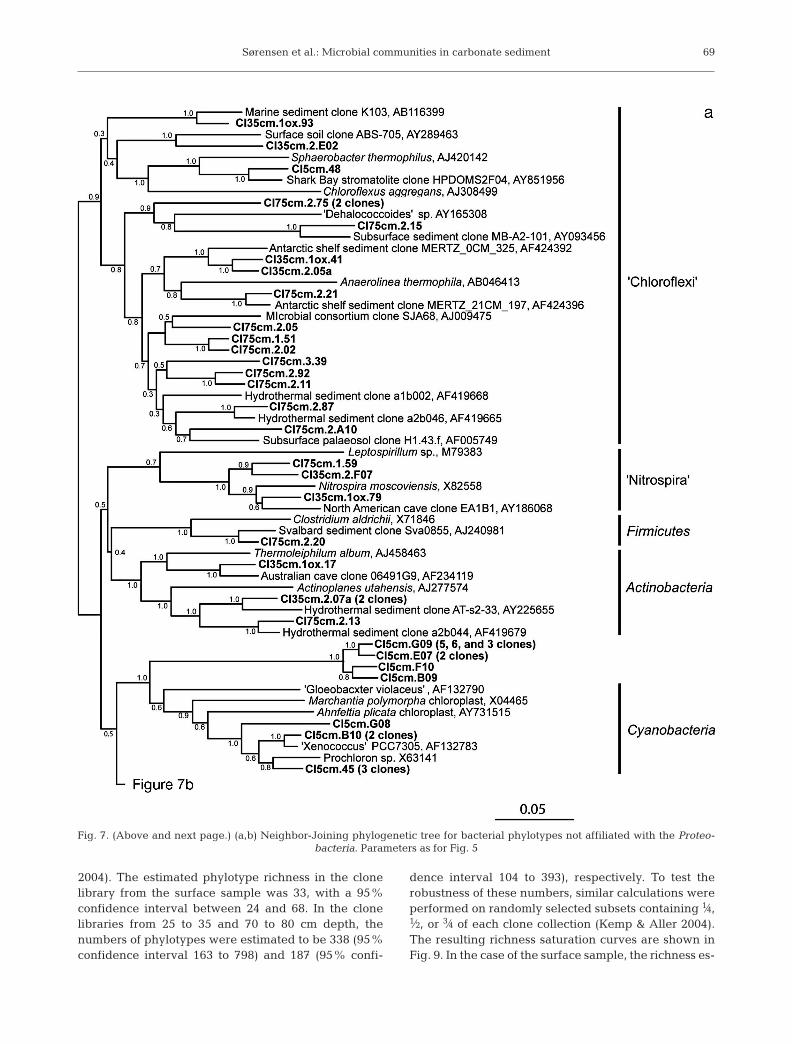
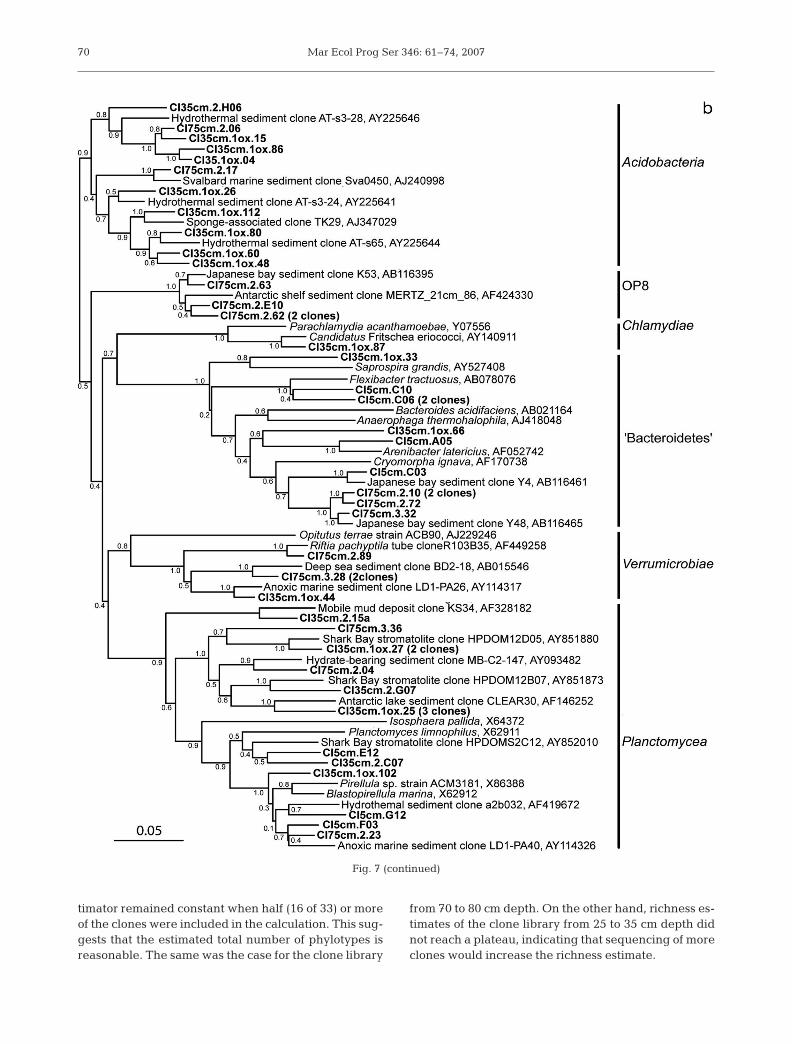
A total of 16 phylotypes were affiliated with the ‘Chlo-roflexi’ (Fig. 7a). The closest cultured relatives of CoconutIsland ‘Chloroflexi’ are non-phototrophic genera includingDehalococoides, Anaerolinea and Sphaerobacter. Relatedenvironmental clones have previously been retrieved fromcoastal marine sediments (Bowman & McCuaig 2003,Asami et al. 2005). A total of 15 clones representing 12phylotypes were affiliated with the class Planctomycea(Fig. 7b). Phylogenetically, they clustered within the gen-era Planctomyces or Pirellula, or among deeply rootedgroups of environmental clones without close relatives inculture. Cultured strains of Planctomycea include aerobicor facultative anaerobic chemoheterotrophs, and some arecapable of nitrate reduction (Hirsch & Muller 1985,Schlesner 1986). A number of acidobacterial phylotypes
67
Fig. 5. Phylogenetic tree including phylotypes affiliated with the Gammaproteobacteria. Distance matrices were calculated bythe Jukes-Cantor method and the tree was constructed by Neighbor-joining. Bootstrap values are from 1000 resamplings. Scale
bar indicates 5% difference in nucleotide sequence. Phylotypes from the present study are in bold
Mar Ecol Prog Ser 346: 61–74, 2007
were detected, particularly in the sample from 25 to 35 cmdepth. The surface layer of the sediment was rich in phylo-types affiliated with the ‘Sphingobacteriales’ and the‘Flavobacteriales’. Cultured representatives of these ordersare heterotrophic, mostly aerobic organisms. Other groupsdetected in lower numbers in the sediment included theActinobacteria, Verrucomicrobia, Nitrospira, the OP8group, Chlamydia, and Firmicutes (Table 1).
Archaea
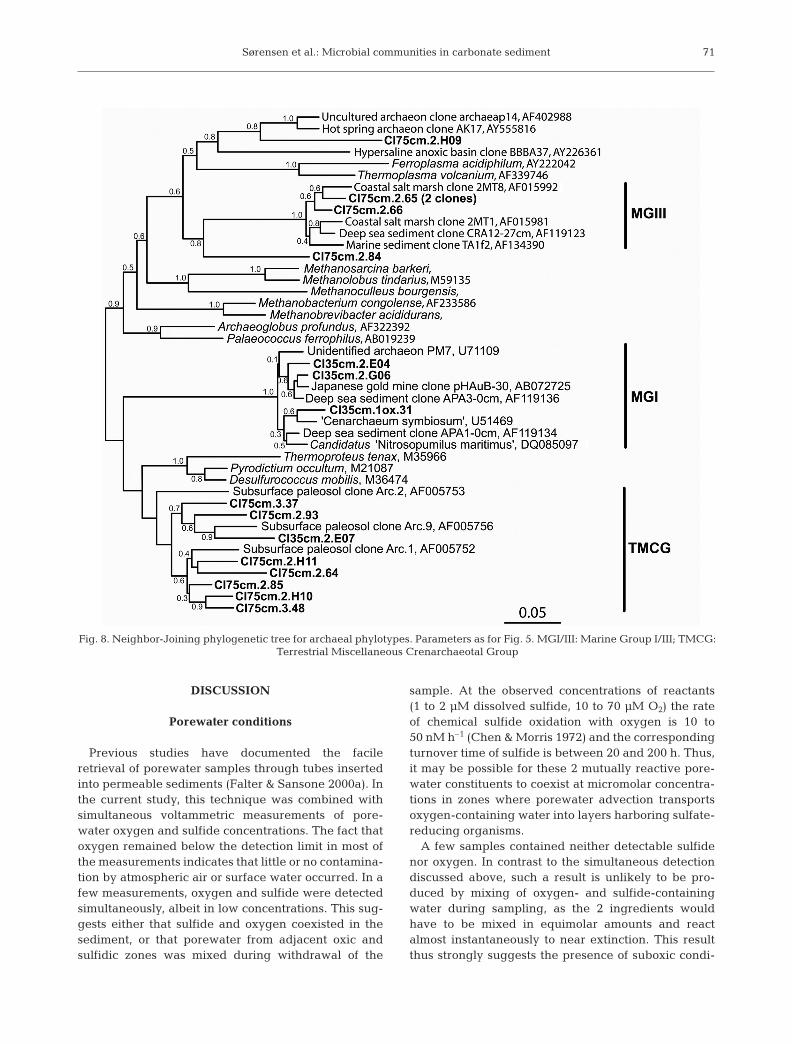
Both Eury- and Crenarchaeotal phylotypes wereretrieved from the sediment (Fig. 8). Most of thearchaeal clones from the 35 cm sample were affiliatedwith Marine Group I (MGI), a group of Crenarchaeota
which is widely distributed in ocean waters and sedi-ments (Fuhrman et al. 1992). Recently, a strain of MGIwas isolated and shown to grow by aerobic oxidationof ammonium to nitrite (Könneke et al. 2005). Most ofthe clones from 75 cm depth belonged to the Terres-trial Miscellaneous Crenarchaeal Group (TMCG)(Takai et al. 2001). Euryarchaeal clones affiliated withMarine Group III (MGIII) were also detected at 75 cmdepth (Delong 1998). The TMCG and MGIII consistsolely of environmental sequences.
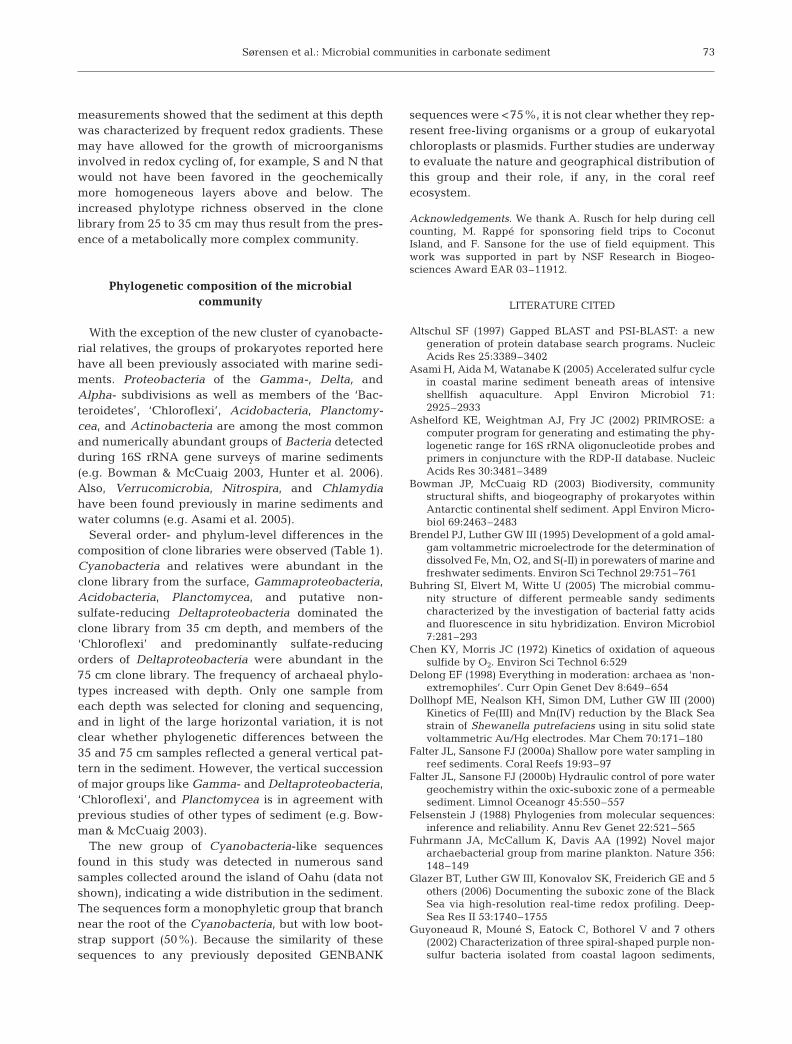
Diversity estimates
The total diversity in each sediment sample was eval-uated by calculating SChao1 estimators (Kemp & Aller
68
Fig. 6. Neighbor-joining phylogenetic tree for alpha-, beta-, and deltaproteobacterial phylotypes. Parameters as for Fig. 5
Sørensen et al.: Microbial communities in carbonate sediment
2004). The estimated phylotype richness in the clonelibrary from the surface sample was 33, with a 95%confidence interval between 24 and 68. In the clonelibraries from 25 to 35 and 70 to 80 cm depth, thenumbers of phylotypes were estimated to be 338 (95%confidence interval 163 to 798) and 187 (95% confi-
dence interval 104 to 393), respectively. To test therobustness of these numbers, similar calculations wereperformed on randomly selected subsets containing 1⁄4,1⁄2, or 3⁄4 of each clone collection (Kemp & Aller 2004).The resulting richness saturation curves are shown inFig. 9. In the case of the surface sample, the richness es-
69
Fig. 7. (Above and next page.) (a,b) Neighbor-Joining phylogenetic tree for bacterial phylotypes not affiliated with the Proteo-bacteria. Parameters as for Fig. 5
Mar Ecol Prog Ser 346: 61–74, 2007
timator remained constant when half (16 of 33) or moreof the clones were included in the calculation. This sug-gests that the estimated total number of phylotypes isreasonable. The same was the case for the clone library
from 70 to 80 cm depth. On the other hand, richness es-timates of the clone library from 25 to 35 cm depth didnot reach a plateau, indicating that sequencing of moreclones would increase the richness estimate.
70
Fig. 7 (continued)
Sørensen et al.: Microbial communities in carbonate sediment
DISCUSSION
Porewater conditions
Previous studies have documented the facileretrieval of porewater samples through tubes insertedinto permeable sediments (Falter & Sansone 2000a). Inthe current study, this technique was combined withsimultaneous voltammetric measurements of pore-water oxygen and sulfide concentrations. The fact thatoxygen remained below the detection limit in most ofthe measurements indicates that little or no contamina-tion by atmospheric air or surface water occurred. In afew measurements, oxygen and sulfide were detectedsimultaneously, albeit in low concentrations. This sug-gests either that sulfide and oxygen coexisted in thesediment, or that porewater from adjacent oxic andsulfidic zones was mixed during withdrawal of the
sample. At the observed concentrations of reactants(1 to 2 μM dissolved sulfide, 10 to 70 μM O2) the rateof chemical sulfide oxidation with oxygen is 10 to50 nM h–1 (Chen & Morris 1972) and the correspondingturnover time of sulfide is between 20 and 200 h. Thus,it may be possible for these 2 mutually reactive pore-water constituents to coexist at micromolar concentra-tions in zones where porewater advection transportsoxygen-containing water into layers harboring sulfate-reducing organisms.
A few samples contained neither detectable sulfidenor oxygen. In contrast to the simultaneous detectiondiscussed above, such a result is unlikely to be pro-duced by mixing of oxygen- and sulfide-containingwater during sampling, as the 2 ingredients wouldhave to be mixed in equimolar amounts and reactalmost instantaneously to near extinction. This resultthus strongly suggests the presence of suboxic condi-
71
Fig. 8. Neighbor-Joining phylogenetic tree for archaeal phylotypes. Parameters as for Fig. 5. MGI/III: Marine Group I/III; TMCG: Terrestrial Miscellaneous Crenarchaeotal Group
Mar Ecol Prog Ser 346: 61–74, 2007
tions in cm-sized zones in the sediment. It is possiblethat the extent of suboxia was even underestimateddue to mixing of sulfidic porewater from adjacentzones during sampling of the 200 ml sample.
Measurements of sulfide and oxygen revealed alarge degree of horizontal heterogeneity in porewaterconditions. This was also evident from the difference incolor of the sediment samples from 25 to 35 cm depth.Sediment porewater transport may be driven by bio-turbation or bioirrigation caused by in- or epifaunalactivity, or by pressure gradients introduced by watermovement and surface topographies. Sandy sedimentsare characterized by high permeabilities, and pres-sure-driven advection dominates the porewater trans-port (Huettel et al. 2003). In shallow sediments the rateof pressure-driven sediment ventilation varies with thewave pattern, and this may result in large temporalvariations in porewater redox conditions (Falter &Sansone 2000a,b). Furthermore, local variations inlabile carbon sources and faunal activity may affectrates of oxygen consumption and porewater redoxstate (Werner et al. 2006). These factors may all con-tribute to the observed horizontal variation in pore-water chemistry.
Microbial community structure
The detection of phylogenetic groups during DNA-based studies does not necessarily imply an in situactivity. This is because the procedure of DNA extrac-tion and amplification may not distinguish betweenactive, dormant, or dead cells. Furthermore, DNAadsorbed onto sediment particles may be released andco-extracted during sediment manipulations. Bias mayalso be introduced by the potentially selective extrac-tion and PCR amplification of some phylotypes at theexpense of others. In spite of these limitations, phylo-genetic studies have been employed successfully as asensitive tool for following prokaryotic populationshifts across temporal and spatial gradients in marinesediments (e.g. Bowman & McCuaig 2003, Yoza et al.2007). In this study, the DGGE band pattern was highlyreproducible in the surface sediment, but variedamong samples from deeper in the sediment. This pat-tern of increasing heterogeneity with depth is unlikelyto be caused by a background of particle-adsorbedDNA and/or inactive cells. Rather, it reflects a spatialdiversification of active microbial communities in thegeochemically heterogeneous sediment. The decreas-ing frequencies with depth of Cyanobacteria andincreasing frequencies of phylotypes related to anaer-obic organisms (like sulfate-reducing Deltaproteobac-teria in the 3 clone libraries) also suggest that theextracted DNA reflects to a large degree the activemicrobial population.
The clone library from 25 to 35 cm had a significantlyhigher diversity than similar clone libraries from thesurface or from deeper in the sediment. Geochemical
72
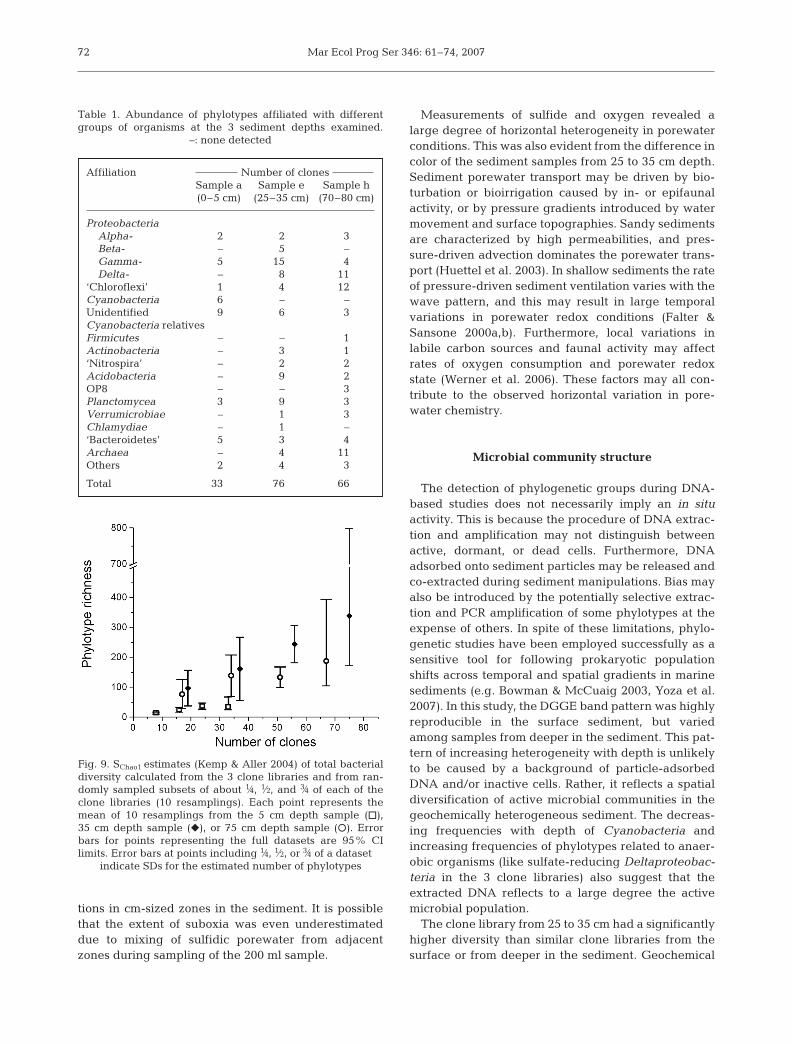
Table 1. Abundance of phylotypes affiliated with differentgroups of organisms at the 3 sediment depths examined.
–: none detected
Affiliation Number of clonesSample a Sample e Sample h(0–5 cm) (25–35 cm) (70–80 cm)
ProteobacteriaAlpha- 2 2 3Beta- – 5 –Gamma- 5 15 4Delta- – 8 11
‘Chloroflexi’ 1 4 12Cyanobacteria 6 – –Unidentified 9 6 3Cyanobacteria relatives Firmicutes – – 1Actinobacteria – 3 1‘Nitrospira’ – 2 2Acidobacteria – 9 2OP8 – – 3Planctomycea 3 9 3Verrumicrobiae – 1 3Chlamydiae – 1 –‘Bacteroidetes’ 5 3 4Archaea – 4 11Others 2 4 3
Total 33 76 66
Fig. 9. SChao1 estimates (Kemp & Aller 2004) of total bacterialdiversity calculated from the 3 clone libraries and from ran-domly sampled subsets of about 1⁄4, 1⁄2, and 3⁄4 of each of theclone libraries (10 resamplings). Each point represents themean of 10 resamplings from the 5 cm depth sample (h),35 cm depth sample (f), or 75 cm depth sample (s). Errorbars for points representing the full datasets are 95% CIlimits. Error bars at points including 1⁄4, 1⁄2, or 3⁄4 of a dataset
indicate SDs for the estimated number of phylotypes
Sørensen et al.: Microbial communities in carbonate sediment
measurements showed that the sediment at this depthwas characterized by frequent redox gradients. Thesemay have allowed for the growth of microorganismsinvolved in redox cycling of, for example, S and N thatwould not have been favored in the geochemicallymore homogeneous layers above and below. Theincreased phylotype richness observed in the clonelibrary from 25 to 35 cm may thus result from the pres-ence of a metabolically more complex community.
Phylogenetic composition of the microbial community
With the exception of the new cluster of cyanobacte-rial relatives, the groups of prokaryotes reported herehave all been previously associated with marine sedi-ments. Proteobacteria of the Gamma-, Delta, andAlpha- subdivisions as well as members of the ‘Bac-teroidetes’, ‘Chloroflexi’, Acidobacteria, Planctomy-cea, and Actinobacteria are among the most commonand numerically abundant groups of Bacteria detectedduring 16S rRNA gene surveys of marine sediments(e.g. Bowman & McCuaig 2003, Hunter et al. 2006).Also, Verrucomicrobia, Nitrospira, and Chlamydiahave been found previously in marine sediments andwater columns (e.g. Asami et al. 2005).
Several order- and phylum-level differences in thecomposition of clone libraries were observed (Table 1).Cyanobacteria and relatives were abundant in theclone library from the surface, Gammaproteobacteria,Acidobacteria, Planctomycea, and putative non-sulfate-reducing Deltaproteobacteria dominated theclone library from 35 cm depth, and members of the‘Chloroflexi’ and predominantly sulfate-reducingorders of Deltaproteobacteria were abundant in the75 cm clone library. The frequency of archaeal phylo-types increased with depth. Only one sample fromeach depth was selected for cloning and sequencing,and in light of the large horizontal variation, it is notclear whether phylogenetic differences between the35 and 75 cm samples reflected a general vertical pat-tern in the sediment. However, the vertical successionof major groups like Gamma- and Deltaproteobacteria,‘Chloroflexi’, and Planctomycea is in agreement withprevious studies of other types of sediment (e.g. Bow-man & McCuaig 2003).
The new group of Cyanobacteria-like sequencesfound in this study was detected in numerous sandsamples collected around the island of Oahu (data notshown), indicating a wide distribution in the sediment.The sequences form a monophyletic group that branchnear the root of the Cyanobacteria, but with low boot-strap support (50%). Because the similarity of thesesequences to any previously deposited GENBANK
sequences were <75%, it is not clear whether they rep-resent free-living organisms or a group of eukaryotalchloroplasts or plasmids. Further studies are underwayto evaluate the nature and geographical distribution ofthis group and their role, if any, in the coral reefecosystem.
Acknowledgements. We thank A. Rusch for help during cellcounting, M. Rappé for sponsoring field trips to CoconutIsland, and F. Sansone for the use of field equipment. Thiswork was supported in part by NSF Research in Biogeo-sciences Award EAR 03–11912.
LITERATURE CITED
Altschul SF (1997) Gapped BLAST and PSI-BLAST: a newgeneration of protein database search programs. NucleicAcids Res 25:3389–3402
Asami H, Aida M, Watanabe K (2005) Accelerated sulfur cyclein coastal marine sediment beneath areas of intensiveshellfish aquaculture. Appl Environ Microbiol 71:2925–2933
Ashelford KE, Weightman AJ, Fry JC (2002) PRIMROSE: acomputer program for generating and estimating the phy-logenetic range for 16S rRNA oligonucleotide probes andprimers in conjuncture with the RDP-II database. NucleicAcids Res 30:3481–3489
Bowman JP, McCuaig RD (2003) Biodiversity, communitystructural shifts, and biogeography of prokaryotes withinAntarctic continental shelf sediment. Appl Environ Micro-biol 69:2463–2483
Brendel PJ, Luther GW III (1995) Development of a gold amal-gam voltammetric microelectrode for the determination ofdissolved Fe, Mn, O2, and S(-II) in porewaters of marine andfreshwater sediments. Environ Sci Technol 29:751–761
Buhring SI, Elvert M, Witte U (2005) The microbial commu-nity structure of different permeable sandy sedimentscharacterized by the investigation of bacterial fatty acidsand fluorescence in situ hybridization. Environ Microbiol7:281–293
Chen KY, Morris JC (1972) Kinetics of oxidation of aqueoussulfide by O2. Environ Sci Technol 6:529
Delong EF (1998) Everything in moderation: archaea as ‘non-extremophiles’. Curr Opin Genet Dev 8:649–654
Dollhopf ME, Nealson KH, Simon DM, Luther GW III (2000)Kinetics of Fe(III) and Mn(IV) reduction by the Black Seastrain of Shewanella putrefaciens using in situ solid statevoltammetric Au/Hg electrodes. Mar Chem 70:171–180
Falter JL, Sansone FJ (2000a) Shallow pore water sampling inreef sediments. Coral Reefs 19:93–97
Falter JL, Sansone FJ (2000b) Hydraulic control of pore watergeochemistry within the oxic-suboxic zone of a permeablesediment. Limnol Oceanogr 45:550–557
Felsenstein J (1988) Phylogenies from molecular sequences:inference and reliability. Annu Rev Genet 22:521–565
Fuhrmann JA, McCallum K, Davis AA (1992) Novel majorarchaebacterial group from marine plankton. Nature 356:148–149
Glazer BT, Luther GW III, Konovalov SK, Freiderich GE and 5others (2006) Documenting the suboxic zone of the BlackSea via high-resolution real-time redox profiling. Deep-Sea Res II 53:1740–1755
Guyoneaud R, Mouné S, Eatock C, Bothorel V and 7 others(2002) Characterization of three spiral-shaped purple non-sulfur bacteria isolated from coastal lagoon sediments,
73
Mar Ecol Prog Ser 346: 61–74, 2007
saline sulfur springs, and microbial mats: emendeddescription of the genus Roseospira and description ofRoseospira marina sp. nov., Roseospira navarrensis sp.nov., and Roseospira thiosulfatophila sp. nov. Arch Micro-biol 178:315–324
Hewson I, Fuhrman JA (2006) Spatial and vertical biogeogra-phy of coral reef sediment bacterial and diazotroph com-munities. Mar Ecol Prog Ser 306:79–86
Hirsch P, Müller M (1985) Planctomyces limnophilus sp. nov.,a stalked and budding bacterium from freshwater. SystAppl Microbiol 6:276–280
Huber T, Faulkner G, Hugenholz P (2004) Bellerophon: a pro-gram to detect chimeric sequences in multiple sequencealignments. Bioinformatics 20:2317–2319
Huettel M, Ziebis W, Forster S, Luther GW III (1998) Advec-tive transport affecting metal and nutrient distributionsand interfacial fluxes in permeable sediments. GeochimCosmochim Acta 62:613–631
Huettel M, Røy H, Precht E, Ehrenhauss S (2003) Hydrody-namical impact on biogeochemical processes in aquaticsediments. Hydrobiologia 494:231–236
Hunter EM, Mills HJ, Kostka J (2006) Microbial communitydiversity associated with carbon and nitrogen cycling inpermeable shelf sediments. Appl Environ Microbiol 72:5689–5701
Imhoff JF (2001) True marine and halophilic anoxygenicphototrophic bacteria. Arch Microbiol 176:243–254
Jokiel PL, Hunter CL, Taguchi S, Watarai L (1993) Ecologicalimpact of a freshwater ‘reef kill’ in Kaneohe Bay, Oahu,Hawaii. Coral Reefs 12:177–184
Kemp PF, Aller JY (2004) Bacterial diversity in aquatic andother environments: what 16S rDNA libraries can tell us.FEMS Microbiol Ecol 47:161–177
Könneke M, Bernhard AE, de la Torre JR, Walker CB, Water-bury JB, Stahl DA (2005). Isolation of an autotrophic ammo-nia-oxidizing marine archaeon. Nature 437: 543–546
Luther GW III, Brendel PJ, Lewis BL, Sundby B, LefrancoisBL, Silverberg N, Nuzzio DB (1998) Simultaneous mea-surement of O2, Mn, Fe, I, and S(-II) in marine pore waterswith a solid-state voltammetric microelectrode. LimnolOceanogr 43:325–333
Marinelli RL, Jahnke RA, Craven DB, Nelson JR, Eckman JE(1998) Sediment nutrient dynamics on the South AtlanticBight continental shelf. Limnol Oceanogr 43:1305–1320
Muyzer G, de Waal EC, Uitterlinden AG (1993) Profiling ofcomplex microbial populations by denaturing gradient gelelectrophoresis analysis of polymerase chain reaction-amplified genes coding for 16S rRNA. Appl EnvironMicrobiol 59:695–700
Porter KC, Feig YS (1980) The use of DAPI for identifying andcounting aquatic microflora. Limnol Oceanogr 25:943–948
Rasheed M, Badran MI, Huettel M (2003) Particulate matterfiltration and seasonal nutrient dynamics in permeablecarbonate and silicate sands of the Gulf of Aqaba, Red
Sea. Coral Reefs 22:167–177Rasheed M, Wild C, Franke U, Huettel M (2004) Benthic
photosynthesis and oxygen consumption in permeablecarbonate sediments at Heron Island, Great Barrier Reef,Australia. Estuar Coast Shelf Sci 59:139–150
Sanford RA, Cole JR, Tiedje JM (2002) Characterization anddescription of Anaeromyxobacter dehalogenans gen. nov.,sp nov., an aryl-halorespiring facultative anaerobicmyxobacterium. Appl Environ Microbiol 68:893–900
Schlesner H (1986) Pirella marina sp. nov., a budding,peptidoglycan-less bacterium from brackish water. SystAppl Microbiol 8:177–180
Shashar N, Feldstein T, Cohen Y, Loya Y (1994) Nitrogen fix-ation (acetylene reduction) on a coral reef. Coral Reefs 13:171–174
Sorokin DY, Lysenko AM, Mityushina LL, Tourova TP, JonesBE, Rainey FA, Robertson LA, Kuenen GJ (2001) Thioal-kalimicrobium aerophilum gen. nov., sp. nov. and Thioal-kalimicrobium sibericum sp. nov., and Thioalkalivibrioversutus gen. nov., sp. nov., Thioalkalivibrio nitratis sp.nov. and Thioalkalivibrio denitrificans sp. nov., novelobligately alkaliphilic and obligately chemolithoauto-trophic sulfur-oxidizing bacteria from soda lakes. Int J SystEvol Microbiol 51:565–580
Takai K, Moser DP, DeFlaun M, Onstott TC, Fredrickson JK(2001) Archaeal diversity in waters from deep SouthAfrican gold mines. Appl Environ Microbiol 67:5750–5760
Thompson JD, Higgins DG, Gibson TJ (1994) CLUSTAL W:improving the sensitivity of progressive multiple sequencealignment through sequence weighting, position-specificgap penalties and weight matrix choice. Nucleic Acids Res22:4673–4680
Thompson JR, Marcelino LA, Polz MF (2002) Heteroduplexesin mixed-template amplifications: formation, consequenceand elimination by ‘reconditioning PCR’. Nucleic AcidsRes 30:2083–2088
Werner U, Bird P, Wild C, Ferdelman T and 5 others (2006)Spatial patterns of aerobic and anaerobic mineralizationrates and oxygen penetration dynamics in coral reef sedi-ments. Mar Ecol Prog Ser 309:93–105
Wild C, Rasheed M, Werner U, Franke U, Johnstone R, Huet-tel M (2004) Degradation and mineralization of coralmucus in reef environments. Mar Ecol Prog Ser 267:159–171
Wild C, Laforsch C, Huettel M (2006) Detection and enumer-ation of microbial cells within highly porous calcareousreef sands. Mar Freshw Res 57:415–420
Yamamoto N, Lopez G (1985) Bacterial abundance in relationto surface area and organic content of marine sediments.J Exp Mar Biol Ecol 90:209–220
Yoza BA, Harada RM, Nihous GC, Li QX, Masutani SM (2007)Impact of mariculture on microbial diversity in sedimentsnear open ocean farming of Polydactylus sexfilis. EcolIndicators 7:108–122
74
Editorial responsibility: Otto Kinne (Editor-in-Chief),Oldendorf/Luhe, Germany
Submitted: October 20, 2006; Accepted: March 21, 2007Proofs received from author(s): September 6, 2007