Embed Size (px)
Citation preview

Spatial Navigation in Virtual Reality Environments: An EEG Analysis
WALTER F. BISCHOF, Ph.D., and PIERRE BOULANGER, Ph.D.
ABSTRACT
Past research has linked theta oscillations (electroencephalographic activity in the 4–8-Hzrange) to spatial navigation in rodents and humans, and to the encoding and retrieval of spa-tial information in rodents. In the present study, electroencephalographic activity was mea-sured while humans navigated through virtual mazes. Results confirmed previous findingsthat the frequency of theta episodes is directly related to the difficulty of maze navigation.We were also able to show that theta episodes occur most likely at points in a maze wherenew hallways come into view, or after navigational mistakes have been realized and arebeing corrected. This indicates that, just as in rodents, theta episodes in humans are related tothe encoding and retrieval of spatial information.
487
CYBERPSYCHOLOGY & BEHAVIOR
Volume 6, Number 5, 2003© Mary Ann Liebert, Inc.
INTRODUCTION
OSCILLATORY PATTERNS OF ACTIVITY in the elec-troencephalogram (EEG) of animals and hu-
mans have long been linked to a number of cognitivefunctions. Theta oscillations (4–12 Hz in rodents)have been implicated in spatial navigation in ani-mals,1–4 and in particular have been linked in to theencoding and retrieval of spatial information in thehippocampus of rodents.2 More recently, task-re-lated characteristics of theta oscillations (4–8 Hz inhumans) have also been studied in humans. Kahanaet al.5 recorded subdurally from epileptic patientswhile they were navigating virtual mazes presentedon a computer screen, and found multiple episodesof high-amplitude theta activity in a number of cor-tical areas including the frontal and temporal cor-tex. They further found that the frequency oftheta-wave episodes occurred more frequently incomplex mazes and that they were more frequentin recall trials than in learning trials. These resultswere confirmed in a further study.6
Using scalp EEGs, Nishiyama and Yamaguchi7
identified two regions with bursts of high thetaactivity during virtual maze navigation, one in the
frontal region, possibly associated with spatialworking memory, and one in the parietal-temporalregion. The sequential theta activity of these areassuggests that information flow in the theta rangereflects connections between hippocampus, pre-frontal and parietal cortex, connections that are es-tablishing the cortical network involved in humanspatial cognition. Using magnetoencephalography(MEG), Araujo et al.8 found a strong increase oftheta activity in temporal regions for virtual mazenavigation, but not for either mental calculations orpassive viewing of maze navigation, supportingthe conclusion that theta activity is closely tied tospatial navigation.
Further evidence on the neural basis of naviga-tion in humans comes from a functional brainimaging (PET) study during navigation of virtualenvironments.9 Activation of the right hippocam-pus was strongly associated with knowing accu-rately where places were located and navigatingaccurately between them. Getting to those placesquickly was strongly associated with activation ofthe right caudate nucleus, while activity in otherregions was probably associated with non-spatialaspects of navigation.
Department of Computing Science, University of Alberta, Edmonton, Alberta, Canada.

In summary, these studies provide convergingevidence on the structure and function of thehuman cortical network involved in spatial naviga-tion, and on the role of theta oscillations in linkingthe activity of the cortical regions involved in thisnetwork. Further, they indicate that the occurrenceof theta episodes can be linked to characteristics ofthe navigational tasks, more specifically, that thefrequency of theta episodes as well as amplitude oftheta activity may be taken as an indicator of diffi-culty of maze navigation. In these studies, virtualreality (VR) environments were created and navi-gated in order to study the structure and functionof cortical navigational mechanisms. The correla-tion between theta activity and difficulty of mazenavigation also permits inferences in the other di-rection, namely to use theta activity to assess easeof navigation through virtual reality environments.Hence, theta activivity can be used as another mea-sure for evaluating VR environments, in additionto standard behavioral measures such as number oferrors, learning time, etc.
In navigating through the environment, we relyon a multitude of cues for planning large-scalemovements (such as walking through the envi-ronment), for combining trajectories of previouslytraveled paths into a mental representation of theenvironment, and for determining heading. Thesecues include both static cues (e.g., landmarks, dis-placement information, depth information) as wellas dynamic cues (e.g., optic flow patterns). Recentbehavioral studies indicate that the difficulty ofnavigating through virtual environments is closelyrelated to the number and types of visual cues thatare available for guiding navigation. For example,Kirschen et al.10 found that landmark informationand optic flow information significantly reducedthe time participants took to navigate a virtualmaze. These studies suggest that rendering of per-ceptually rich VR environments can make naviga-tion much easier than perceptually impoverishedrenderings, and thus can help to reduce the cogni-tive load in navigation tasks. However, perceptualenrichment of VR environments may not necessar-ily lead to easier navigation. In a perceptually im-poverished VR environment, we may rely muchmore on internally represented, cognitive maps ofthe environment, whereas in perceptually rich en-vironments one can rely more on landmark-basedguidance. This, in turn, may prevent the buildingof an efficient and easily accessible representationof the environment.
Many of the past EEG studies on navigation inVR environments have imposed fairly severe con-
straints on the movements that could be made.In the studies of Kahana et al.5 and Nishiyama andYamaguchi,7 for example, participants were trans-ported at fixed velocity through maze hallways andviewpoint changes were instantaneous and limitedto 90 degrees. This permitted equating movementpatterns across different participants, but it alsolead to highly artificial movment patterns that werenot under control of the observers. The presentstudy was aimed at overcoming this limitation bystudying navigation with more natural movementpatterns.
MATERIALS AND METHODS
The mazes used in the present experiment werecreated using the Mandala system,11 a reconfig-urable VR tool that allows the generation of com-plex VR environments using a simple markuplanguage and their display on range of VR hard-ware, including simple screens (as used in the pres-ent experiment), stereoscopic display systems, andVR caves. In the Mandala system, a VR environ-ment is made up of a large number of cubes(“cells”), and each cell can have a floor, a ceiling,visible and invisible walls, and can contain arbi-trary objects. Further, one can define a number ofevents for each cell (e.g., the avatar entering orleaving the cell, the avatar colliding with one of thewalls), and each of these events can trigger someaction (e.g., writing a message into a log file, send-ing a message to a sound server, or sending a signalto the EEG computer). Many of the features of theMandala system were developed for the presentstudy, and precautions were taken to ensure thatdisplay updates and refreshes were as efficient aspossible, so that temporal aspects of navigation incomplex mazes could be studied.
Participants
Fourteen graduate students (11 male, three female)from the Department of Computing Science partici-pated in this study. All had normal or corrected-to-normal vision.
Maze stimuli
All mazes consisted of a set of T-junctionsarranged in such as way that the goal positioncould be reached from the starting position in a se-quence of 10 left or right turns. The layout of onemaze is shown in Figure 1, with cell 0 (on the right
488 BISCHOF AND BOULANGER

hand side) indicating the starting position and cell94g (at the top) indicating the goal position. In thiscase, a sequence of left/right turns LLRRLRLRRLleads from the starting position to the goal position.A set of 10 different mazes was created, and ran-dom subsets of these mazes were presented in theexperiments.
Each T-junction consisted of either six or sevencells, a junction cell (e.g., cell 3), two cells each forthe left and right arm (e.g., cells 4/5 and 127/128f),and either one or two cells before the intersection(e.g., cells 1/2). From every junction, another junc-tion was visible along both, the left arm and theright arm. An invisible barrier prevented naviga-tion in the incorrect direction. For example, in the
first T-junction of Figure 1, a barrier was placed be-tween cells 128f and 129, so that the T-junction con-sisting of cells 129–135 could not be reached.
Several maze views are shown in Figure 2. De-pending on the experimental condition, the mazewalls could be either plain (Fig. 2a) or colored (Fig.2b), and could either have an arrow indicating thecorrect direction (Fig. 2c) or not (Fig. 2b). Finally, amessage on the wall at the end of a hallway indi-cated the goal position (Fig. 2d). Upon enteringa new maze, a participant started in the startingcell (cell 0 in Fig. 1) facing the first intersection (cell3). As soon as the goal cell (cell 94G in Fig. 1) wasentered, the maze was exited and a new maze wasentered.
SPATIAL NAVIGATION IN VIRTUAL REALITY ENVIRONMENTS 489
FIG. 1. Layout of a maze used in the experiments. The maze consists of a number of T-junctions, arranged such thatthe goal position (cell 94g) can be reached from the starting position (cell 0) in a sequence of 10 left/right turns LLR-RLRLRRL. Each T-junction consists of six or seven cells: one or two cells before the junction (e.g., cells 1 and 2), thejunction cell (e.g., cell 3), a correct arm consisting of two cells (e.g., cells 5 and 5), and an incorrect arm consisting oftwo cells (e.g., cells 127 and 128f). The path beyond an incorrect arm is blocked by a transparent screen (e.g., betweencells 128f and 129). The paths between other cells (e.g., cells 8 and 114) are blocked by visible walls.

Maze navigation
To travel through a maze, participants used thearrow keys of the keyboard, namely forward (),backward (¯), left (¬), and right (®). A single for-ward- or backward-key press changed the positionby about 0.05 cell width, and a single left- or right-key press changed the orientation by about 3 de-grees. By pressing the forward-key continuously,one could move forward at a velocity of about 1.2cells/sec, and by pressing the left- or right-key con-tinuously, one could rotate at a velocity of about 60deg/sec. Under optimal conditions, a maze couldthus be traversed in about 40 sec.
Response recording
During maze navigation, the following eventswere recorded: entering a cell, leaving a cell, collid-ing with a visible obstacle (i.e., walking into a wall),and colliding with an invisible obstacle (i.e., walking
into an invisible barrier). All events were recordedusing a time-stamp. It was thus possible to deter-mine in which cell the participant was located at anymoment in time, as well as how many errors weremade (i.e., how often collisions with an invisible bar-rier occurred), how often a path was backtracked,and how long it took to traverse a whole maze.
Maze variations
Two different types of mazes were presented,plain mazes and colored mazes. In plain mazes, allwalls had the same color (Fig. 2a), whereas in thecolor mazes, the color of each T-junction was cho-sen randomly from the set {blue, cyan, green, red,magenta, yellow}. All walls of a single T-maze hadthe same color (Fig. 2b). The texture of all walls, aswell as ceilings and floors did not change.
All mazes were generated in two versions, astraining mazes and as test mazes. In training mazes,
490 BISCHOF AND BOULANGER
FIG. 2. Four different maze views: (a) View of a hallway in a “plain” maze. (b) View of a hall-way in a “color” maze. (c) View of a hallway in a “plain” training maze, with arrows indicatingthe correct direction of navigation. (d) View of the goal position in a “color” maze.

a large yellow arrow indicated the correct directionat each intersection (Fig. 2c), whereas the arrowswere absent in the test mazes.
Apparatus
All stimuli were presented on a NEC MultiSyncLCD 1850E Screen with a refresh rate of 60 Hz and adisplay area of approximately 36 cm by 28.5 cm, or35 arc deg 3 28 arc deg at the viewing distance ofapproximately 57 cm. All manual responses wereentered on the keyboard.
EEG methods
EEG signals were collected from 38 gold elec-trodes embedded in an electrode cap and amplifiedusing a Neuroscan NuAmp amplifier. Recordinglocations were based on the electrode placementsystem of the American ElectroencephalographicSociety12 and included the following electrodes:FP1, FP2, F7, F3, FZ, F4, F8, FT9, FT7, FC3, FCZ,FC4, FT8, FT10, T7, C3, CZ, C4, T8, TP7, CP3, CPZ,CP4, TP8, P7, P3, PZ, P4, P8, PO1, PO2, O1, OZ, andO2. All channels were referenced to linked mas-toids with a forehead ground electrode (AFZ).Linked mastoids served as a reference. Horizontaleye movements were monitored with bipolar elec-trodes on the outer canthus of each eye, and verti-cal movements were monitored from electrodesplaced above and below the left eye. EEG and EOGwere recorded at a sampling rate of 500 Hz for theduration of the whole experiment.
Procedure
In each experimental condition, a participantlearned to walk through five randomly selectedT-mazes. Each maze was presented once as a trainingmaze, followed by a number of presentations as testmazes without arrows. A test maze was presented re-peatedly until the participant traversed it withouterror (i.e., without walking into an invisible barrier)or until the test maze had been presented eight times,whichever came first.
Upon entering a maze, participants were allowedto rest, but were instructed to traverse that mazewithout pause once they had left the starting cell.As soon as the goal cell was entered, the maze wasexited and the next maze was entered. No feedbackabout performance was given, but participantscould easily determine whether they had success-fully traversed a maze without error, since onlyafter an error-free traversal was the next training
maze (with arrows) presented. Participants wereinstructed to remain still and to not talk during theexperiment.
There were two experimental conditions, a “plain”condition and a “color” condition. In the plain condi-tion, all maze walls were plain (Fig. 2a), whereas inthe “color” condition, all walls were colored (Fig. 2b).Each participant traversed five different mazes, oncewith arrows in a training trial, followed by (at mosteight) test trials, so each participant traversed at least10 and most 45 mazes. These conditions were pre-sented in a between-subject design; that is, each par-ticipant traversed either plain or colored mazes.
RESULTS
Behavioral measures
The two experimental groups, color and plain,were compared with respect to a number of behav-ioral measures. For each of the five presented mazes,participants in the color group required on average3.18 test maze traversals, which was slightly higherthan the number of test maze traversals of 2.53 forthe plain group (t(13) = 0.727, p > 0.1). The averagenumber of errors (i.e., collisions with an invisiblebarrier after taking a wrong turn) was 4.59 for thecolor group, which is slightly higher than the aver-age number of errors of 2.66 for the plain group(t(13) = 1.00, p > 0.1). Finally, the average durationspent on traversing a single test maze was 70.5 secfor the color group, whereas it was 53.1 sec for theplain group (t(13) = 2.81, p < 0.05).
In summary, the participants who traversed thecolored mazes, spent longer time on traversing themazes, and, at least in tendency, made more navi-gation errors and had to traverse mazes more oftenbefore making an error-free traversal than did theparticipants in the plain condition.
Electroencephalographic measures
An EEG was recorded continuously for a com-plete experimental session. These data were seg-mented into episodes corresponding to the traversalof a single maze, beginning at the time the startingposition (e.g., cell 0 in Fig. 1) was left, and ending atthe time the goal position (e.g., cell 94g in Fig. 1)was entered. Each of these maze episodes was ana-lyzed independently.
For a given EEG channel, short-term spectro-grams were computed for each maze episode. Tothis end, discrete Fourier transforms were computed
SPATIAL NAVIGATION IN VIRTUAL REALITY ENVIRONMENTS 491
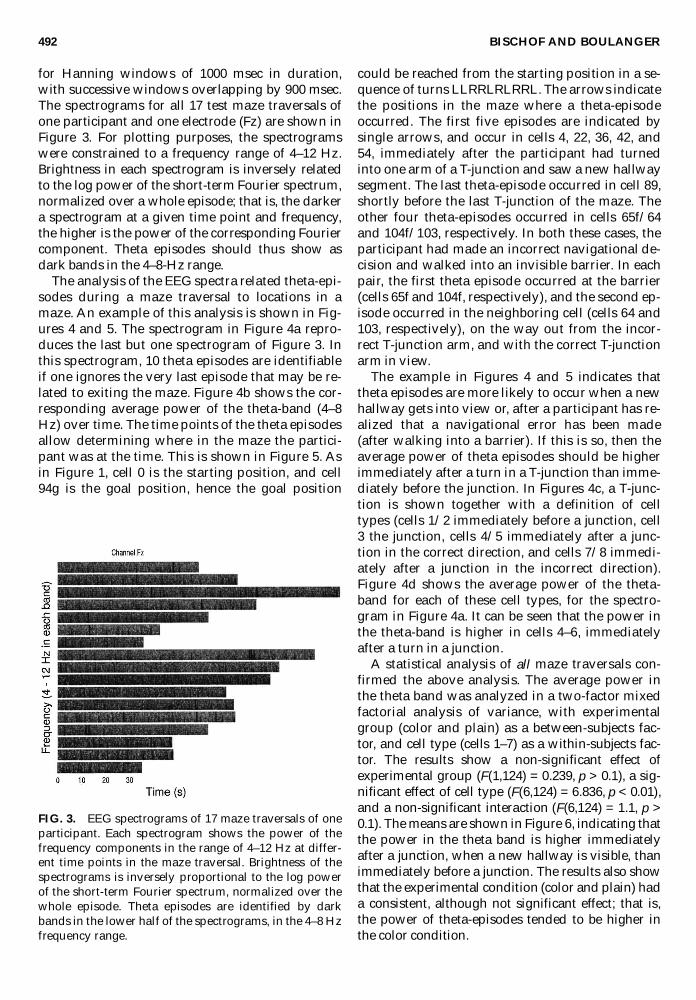
for Hanning windows of 1000 msec in duration,with successive windows overlapping by 900 msec.The spectrograms for all 17 test maze traversals ofone participant and one electrode (Fz) are shown inFigure 3. For plotting purposes, the spectrogramswere constrained to a frequency range of 4–12 Hz.Brightness in each spectrogram is inversely relatedto the log power of the short-term Fourier spectrum,normalized over a whole episode; that is, the darkera spectrogram at a given time point and frequency,the higher is the power of the corresponding Fouriercomponent. Theta episodes should thus show asdark bands in the 4–8-Hz range.
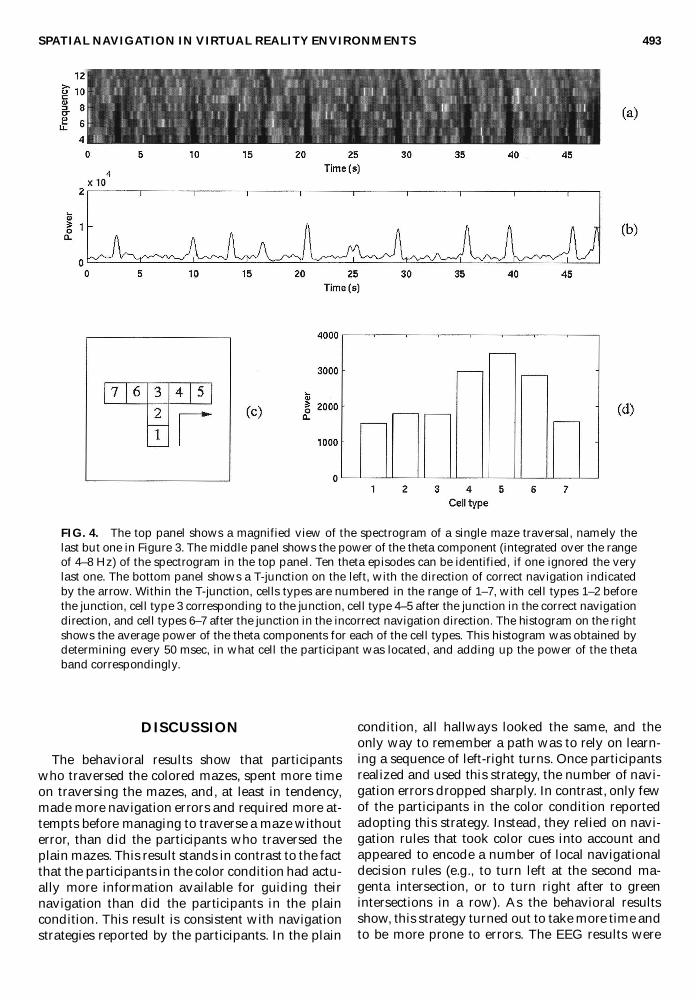
The analysis of the EEG spectra related theta-epi-sodes during a maze traversal to locations in amaze. An example of this analysis is shown in Fig-ures 4 and 5. The spectrogram in Figure 4a repro-duces the last but one spectrogram of Figure 3. Inthis spectrogram, 10 theta episodes are identifiableif one ignores the very last episode that may be re-lated to exiting the maze. Figure 4b shows the cor-responding average power of the theta-band (4–8Hz) over time. The time points of the theta episodesallow determining where in the maze the partici-pant was at the time. This is shown in Figure 5. Asin Figure 1, cell 0 is the starting position, and cell94g is the goal position, hence the goal position
could be reached from the starting position in a se-quence of turns LLRRLRLRRL. The arrows indicatethe positions in the maze where a theta-episodeoccurred. The first five episodes are indicated bysingle arrows, and occur in cells 4, 22, 36, 42, and54, immediately after the participant had turnedinto one arm of a T-junction and saw a new hallwaysegment. The last theta-episode occurred in cell 89,shortly before the last T-junction of the maze. Theother four theta-episodes occurred in cells 65f/64and 104f/103, respectively. In both these cases, theparticipant had made an incorrect navigational de-cision and walked into an invisible barrier. In eachpair, the first theta episode occurred at the barrier(cells 65f and 104f, respectively), and the second ep-isode occurred in the neighboring cell (cells 64 and103, respectively), on the way out from the incor-rect T-junction arm, and with the correct T-junctionarm in view.
The example in Figures 4 and 5 indicates thattheta episodes are more likely to occur when a newhallway gets into view or, after a participant has re-alized that a navigational error has been made(after walking into a barrier). If this is so, then theaverage power of theta episodes should be higherimmediately after a turn in a T-junction than imme-diately before the junction. In Figures 4c, a T-junc-tion is shown together with a definition of celltypes (cells 1/2 immediately before a junction, cell3 the junction, cells 4/5 immediately after a junc-tion in the correct direction, and cells 7/8 immedi-ately after a junction in the incorrect direction).Figure 4d shows the average power of the theta-band for each of these cell types, for the spectro-gram in Figure 4a. It can be seen that the power inthe theta-band is higher in cells 4–6, immediatelyafter a turn in a junction.
A statistical analysis of all maze traversals con-firmed the above analysis. The average power inthe theta band was analyzed in a two-factor mixedfactorial analysis of variance, with experimentalgroup (color and plain) as a between-subjects fac-tor, and cell type (cells 1–7) as a within-subjects fac-tor. The results show a non-significant effect ofexperimental group (F(1,124) = 0.239, p > 0.1), a sig-nificant effect of cell type (F(6,124) = 6.836, p < 0.01),and a non-significant interaction (F(6,124) = 1.1, p >0.1). The means are shown in Figure 6, indicating thatthe power in the theta band is higher immediatelyafter a junction, when a new hallway is visible, thanimmediately before a junction. The results also showthat the experimental condition (color and plain) hada consistent, although not significant effect; that is,the power of theta-episodes tended to be higher inthe color condition.
492 BISCHOF AND BOULANGER
FIG. 3. EEG spectrograms of 17 maze traversals of oneparticipant. Each spectrogram shows the power of thefrequency components in the range of 4–12 Hz at differ-ent time points in the maze traversal. Brightness of thespectrograms is inversely proportional to the log powerof the short-term Fourier spectrum, normalized over thewhole episode. Theta episodes are identified by darkbands in the lower half of the spectrograms, in the 4–8 Hzfrequency range.
DISCUSSION
The behavioral results show that participantswho traversed the colored mazes, spent more timeon traversing the mazes, and, at least in tendency,made more navigation errors and required more at-tempts before managing to traverse a maze withouterror, than did the participants who traversed theplain mazes. This result stands in contrast to the factthat the participants in the color condition had actu-ally more information available for guiding theirnavigation than did the participants in the plaincondition. This result is consistent with navigationstrategies reported by the participants. In the plain
condition, all hallways looked the same, and theonly way to remember a path was to rely on learn-ing a sequence of left-right turns. Once participantsrealized and used this strategy, the number of navi-gation errors dropped sharply. In contrast, only fewof the participants in the color condition reportedadopting this strategy. Instead, they relied on navi-gation rules that took color cues into account andappeared to encode a number of local navigationaldecision rules (e.g., to turn left at the second ma-genta intersection, or to turn right after to greenintersections in a row). As the behavioral resultsshow, this strategy turned out to take more time andto be more prone to errors. The EEG results were
SPATIAL NAVIGATION IN VIRTUAL REALITY ENVIRONMENTS 493
FIG. 4. The top panel shows a magnified view of the spectrogram of a single maze traversal, namely thelast but one in Figure 3. The middle panel shows the power of the theta component (integrated over the rangeof 4–8 Hz) of the spectrogram in the top panel. Ten theta episodes can be identified, if one ignored the verylast one. The bottom panel shows a T-junction on the left, with the direction of correct navigation indicatedby the arrow. Within the T-junction, cells types are numbered in the range of 1–7, with cell types 1–2 beforethe junction, cell type 3 corresponding to the junction, cell type 4–5 after the junction in the correct navigationdirection, and cell types 6–7 after the junction in the incorrect navigation direction. The histogram on the rightshows the average power of the theta components for each of the cell types. This histogram was obtained bydetermining every 50 msec, in what cell the participant was located, and adding up the power of the thetaband correspondingly.

consistent with the behavioral results: The power oftheta episodes tended to be higher in the in the colorcondition than in the plain condition.
The most interesting results were obtained in thedetailed analysis of the maze points where theta ep-isodes occurred. It was found that these episodesdid not occur either uniformly or at random pointsin the mazes. Rather, theta episodes occurred morelikely and the power of these episodes was higherimmediately after participants had made a turn in ajunction and a new hallway came into view. Second,they were also more likely and more powerful afterparticipants had walked into an invisible barrierand had to revise their navigational rules. In con-trast, theta episodes were less likely when the par-ticipants were simply moving down a hallway. In
the first case, participants were probably retrievinga stored view that could guide their further naviga-tion. In the second case, participants were mostlikely storing the view with a revised navigationrule. These results provide further evidence on therelation between theta waves and spatial navigationin humans: Theta waves may be directly related tothe storage and retrieval of spatial information fornavigation, not just in rodents,2 but also in humans.
ACKNOWLEDGMENTS
This project was supported by grants from theNational Engineeering and Research Council ofCanada. We would like to thank Reiko Graham,
494 BISCHOF AND BOULANGER
FIG. 5. Layout of the maze that was traversed in the maze traversal of Figure 4. The arrows indicate where in themaze each of the 10 theta episodes in Figure 4 occurred. The first five occur immediately after a T-junction, when anew hallway segment is in view, and the last episode occurs a little bit further down the hallway. The other four epi-sodes occur in pairs, in cells 103/104f and 64/65f, respectively. In both cases, the participant had taken a wrong turn,walked into a transparent barrier (between cells 65f/66 and 104f/105, respectively) and had to turn around to walkinto the other arm of the T-junction.

Sherry Zsoldos, and Rachel Thomas for their helpin running the experiments.
REFERENCES
1. Winson, J. (1978). Loss of hippocampal theta rythmsresults in spatial memory deficits in the rat. Science201:160–163.
2. O’Keefe, J., & Recce, M. (1993). Phase relationship be-tween hippocampal place units and the EEG thetarhythm. Hippocampus 3:317–330.
3. Skaggs, W.E., McNaughton, B.L., Wilson, M.A., et al.(1996). Theta phase precision in hippocampal neu-
ronal populations and the compression of temporalsequences. Hippocampus 6:149–172.
4. Gavrilov, V.V., Wiener, S.I., & Berthoz, A. (1995). En-hanced hippocampal theta EEG during whole bodyrotation in awake restrained rats. Neuroscience Letters197:239–241.
5. Kahana, M.J., Sekuler, R., Caplan, J.B., et al. (1999).Human theta oscillations exhibit task dependenceduring virtual maze navigation. Nature 399:781–784.
6. Caplan, J.B., Kahana, M.J., Sekuler, R., et al. (2000).Task dependence of human theta: the case for multiplecognitive functions. Neurocomputing 32–33:659–665.
7. Nishiyama, N., & Yamaguchi, Y. (2001). Human EEGtheta in the spatial recognition task. Presented at the5th World Multi-Conference on Systemics, Cybernet-ics and Informatics, Orlando, Florida.
8. De Araujo, D.B., Baffa, O., & Wakai, R.T. (2001).Theta and alpha oscillations: Dependency on naviga-tion taks. In: Nenonen, J., Ilmoniemi, R.J., Katila, T.,(eds.), Biomag2000. Proceedings of the 12th InternationalConference on Biomagnetism, Helskinki University of Tech-nology, Espoo, Finland. pp. 343–346. biomag2000.hut.fi/proceedings.html
9. McGuire, E.A., Burgess, N., Donnett, J.G., et al. (1998).Knowing where and getting there: a human naviga-tion network. Science 280:921–924.
10. Kirschen, M.P., Kahana, M.J., Sekuler, R., et al. (2000).Optic flow helps human learn to navigate throughsynthetic environments. Perception 29:801–818.
11. Torres, D. (2003). A reconfigurable VR tool for spatialnavigation (submitted).
12. American Electroencephalographic Society. (1991).Guidelines for standard electrode position nomen-clature. Journal of Clinical Neurophysiology 8:200–202.
Address reprint requests to:Walter F. Bischof, xx,
Department of Computing ScienceUniversity of Alberta
Edmonton, Alberta, T6G 2E9, Canada
E-mail: [email protected]
SPATIAL NAVIGATION IN VIRTUAL REALITY ENVIRONMENTS 495
FIG. 6. Average power in the theta band, separately foreach cell type, averaged over all participants and all testmaze traversals, graphed separately for the plain and thecolor condition. The results indicate that the power of thetheta band is higher for cells immediately after a junctionthan for cells before the junction, suggesting that theta epi-sodes are more likely and stronger when a new hallwaysegment becomes visible, or when an incorrect decision hasbeen made, than when simply moving down a hallway.