Embed Size (px)
Citation preview

© 2011 International Monetary Fund July 2011
IMF Country Report No. 11/215
Spain––Staff Report for the 2011 Article IV Consultation; Public Information Notice; Statement by the Staff Representative; and Statement by the Executive Director for Spain.
The following documents have been released and are included in this package: The staff report, prepared by a staff team of the IMF, following discussions that ended on
June 21, 2011 with the officials of the Spain on economic developments and policies. Based on information available at the time of these discussions, the staff report was completed on July 7, 2011. The views expressed in the staff report are those of the staff team and do not necessarily reflect the views of the Executive Board of the IMF.
A Public Information Notice
A Staff Supplement
A statement by the Executive Director for Spain
The document(s) listed below will be separately released. Selected Issues The policy of publication of staff reports and other documents allows for the deletion of market-sensitive information.
Copies of this report are available to the public from
International Monetary Fund ● Publication Services 700 19th Street, N.W. ● Washington, D.C. 20431
Telephone: (202) 623-7430 ● Telefax: (202) 623-7201 E-mail: [email protected] ● Internet: http://www.imf.org
International Monetary Fund Washington, D.C.
INTERNATIONAL MONETARY FUND
SPAIN
Staff Report for the 2011 Article IV Consultation
Prepared by Staff Representatives for the 2011 Consultation with Spain (in consultation with other departments)
Approved by Ajai Chopra and Martin Mühleisen
July 7, 2011
EXECUTIVE SUMMARY
Context: Spain’s policy response to its economic challenges over the last year has been strong and wide-ranging, helping strengthen market confidence. The economy is gradually recovering and the rebalancing is underway. Growth has picked up as strong exports outweighed weak domestic demand, reducing the current account deficit. But unemployment remains unacceptably high, inflation is again above the euro area average and sovereign and bank funding costs remain elevated and volatile. The recovery is likely to be modest and export-led, with significant downside risks dominating, especially that of further contagion from rising concerns about sovereign risks in the euro area.
Challenges: Unwinding imbalances accumulated during the long boom and reallocating resources across sectors will take years and will require determined policy action. And many of the underlying problems of the Spanish economy, especially weak productivity growth and a dysfunctional labor market, remain to be fully addressed.
Policies and staff views: The policy agenda remains challenging and urgent—there can be no let up in the reform momentum. Ambitious fiscal consolidation is underway but is based on optimistic macroeconomic projections and there is a risk of some regional governments missing their targets. Anchoring fiscal sustainability requires additional action. The financial sector reform needs to be decisively completed. This needs to be complemented by a bold strengthening of labor market reforms to substantially reduce unemployment, and following through on the structural reform agenda to spur productivity and employment. Such a comprehensive strategy would be helped by broad political and social support.
Authorities’ views: The recovery is likely to be stronger than staff envisages, led by continued export strength, and risks to the outlook are more balanced. Contagion risks are significant but the economy would prove resilient, as during past episodes. Fiscal policy is on track to achieve the ambitious targets and any slippage would be promptly met with additional measures. The ongoing financial sector reform will be soon completed and should substantially reduce banking sector pressures. Recent labor market reforms should produce good results over time as the recovery continues. Spain has made strong progress on liberalizing domestic markets recently, which is being continued.
2
Contents Pages
I. Context: Navigating the Storm ...............................................................................................4
II. Recent Developments: A Weak Recovery ............................................................................7
III. Outlook: A Modest Cyclical Recovery Amidst Headwinds and Tail Risks ......................12
IV. Policy Agenda: Enhancing Market Confidence and Moving to a New Growth Model ....15 A. Financial Sector: Completing the Reforms .............................................................16 B. Fiscal Policy: Achieving the Ambitious Consolidation Targets and Beyond .........19 C. Labor: Bolder Reform Needed ................................................................................25 D. Other Structural Reforms for the New Growth Model ...........................................27
V. Staff Appraisal ....................................................................................................................28 Boxes 1. Savings Bank Reform ............................................................................................................7 2. How Much Has Spain's Private Sector Rebalanced? .............................................................8 3. Spain's International Investment Position ............................................................................11 4. The Potential Size of Negative Spillovers from Spain ........................................................14 5. Pension Reform ....................................................................................................................23 Figures 1. Comparitive Indicators.........................................................................................................31 2. Financial Sector Indicators (I) .............................................................................................32 3. Financial Sector Indicators (II) ............................................................................................33 4. National Accounts ................................................................................................................34 5. High Frequency Indicators ...................................................................................................35 6. Labor Market Indicators ......................................................................................................36 7. Inflation ................................................................................................................................37 8. Fiscal Developments 1995–2010 .........................................................................................38 9. Balance of Payments ............................................................................................................39 10. A Weak Recovery ..............................................................................................................40 11. Labor Markets ....................................................................................................................41 12. Competitiveness .................................................................................................................42 13. Product Market Reform .....................................................................................................43 Tables 1. Main Economic Indicators ...................................................................................................44 2. Selected Financial Soundness Indicators .............................................................................45 3. Financial Soundness Indicators of the Non-banking Sectors ..............................................46 4. General Government Operations .........................................................................................47 5. General Government: Balance Sheet ...................................................................................48

3
6. Balance of Payments ............................................................................................................49 7. International Investment Position, 2004–2010 ....................................................................50 Annex 1. Fiscal and External Sustainability ........................................................................................51
4
I. CONTEXT: NAVIGATING THE STORM
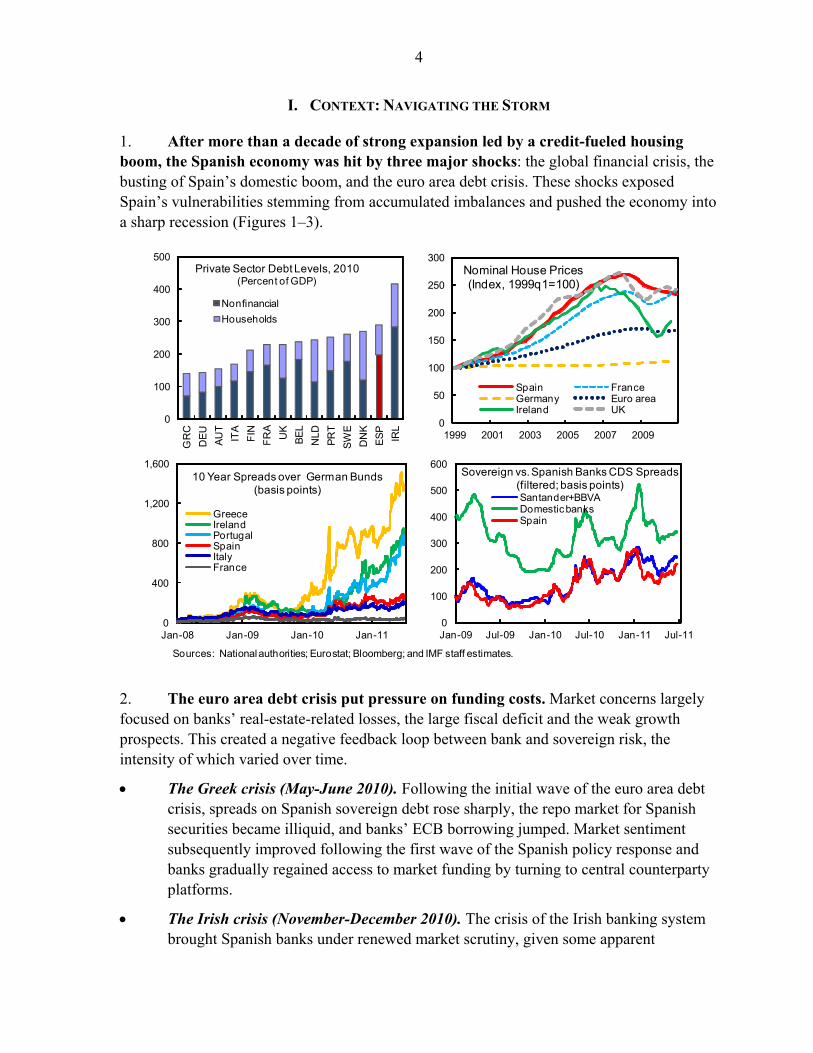
1. After more than a decade of strong expansion led by a credit-fueled housing boom, the Spanish economy was hit by three major shocks: the global financial crisis, the busting of Spain’s domestic boom, and the euro area debt crisis. These shocks exposed Spain’s vulnerabilities stemming from accumulated imbalances and pushed the economy into a sharp recession (Figures 1–3).
2. The euro area debt crisis put pressure on funding costs. Market concerns largely focused on banks’ real-estate-related losses, the large fiscal deficit and the weak growth prospects. This created a negative feedback loop between bank and sovereign risk, the intensity of which varied over time.
The Greek crisis (May-June 2010). Following the initial wave of the euro area debt crisis, spreads on Spanish sovereign debt rose sharply, the repo market for Spanish securities became illiquid, and banks’ ECB borrowing jumped. Market sentiment subsequently improved following the first wave of the Spanish policy response and banks gradually regained access to market funding by turning to central counterparty platforms.
The Irish crisis (November-December 2010). The crisis of the Irish banking system brought Spanish banks under renewed market scrutiny, given some apparent
0
100
200
300
400
500
GR
C
DE
U
AU
T
ITA
FIN
FR
A
UK
BE
L
NLD
PR
T
SW
E
DN
K
ES
P
IRL
Private Sector Debt Levels, 2010 (Percent of GDP)
Nonfinancial
Households
0
50
100
150
200
250
300
1999 2001 2003 2005 2007 2009
Nominal House Prices(Index, 1999q1=100)
Spain FranceGermany Euro areaIreland UK
Sources: National authorities; Eurostat; Bloomberg; and IMF staff estimates.
0
100
200
300
400
500
600
Jan-09 Jul-09 Jan-10 Jul-10 Jan-11 Jul-11
Santander+BBVADomestic banksSpain
Sovereign vs. Spanish Banks CDS Spreads (filtered; basis points)
0
400
800
1,200
1,600
Jan-08 Jan-09 Jan-10 Jan-11
GreeceIrelandPortugalSpainItalyFrance
10 Year Spreads over German Bunds(basis points)
5
similarities. To allay market concerns, the authorities, especially the Bank of Spain (BdE), required banks to enhance disclosure of their exposure to troubled sectors and raised capital requirements. Spanish banks maintained funding market access, although generally at less favorable conditions than peers.
The Portuguese crisis (March–April 2011). In contrast to the other episodes, as the Portuguese crisis deepened, Spanish spreads barely moved, reflecting Spain’s improved market perceptions and strengthening fundamentals. However, as concerns over a potential Greek restructuring surfaced in early summer, Spanish spreads widened again to around the previous highs amid a generalized increase in risk aversion, ECB borrowing by Spanish banks also increased slightly.
3. The policy response to Spain’s economic challenges over the last year has been strong and wide-ranging, helping strengthen market confidence. The economy was shown to be resilient and policymakers responsive. The resulting improvement in market confidence was critical not just for Spain, but, given Spain’s systemic size, for the euro area as a whole. From mid-2010, the Spanish authorities undertook a series of measures targeting the main economic problems facing the country, broadly in line with recommendations from previous Article IV consultations. Most importantly:
Fiscal. Consolidation was front-loaded in the May 2010 package, the 2010 deficit target was hit, a strong draft pension reform was agreed with social partners and approved by the lower house of Parliament, and transparency was enhanced.
Banks. The saving bank sector was substantially reshaped (while minimizing cost to the taxpayer), capital standards were strengthened, and transparency was improved (Box 1).
Labor. The 2010 reform increased hiring incentives by easing dismissal costs and criteria, and by granting firms greater flexibility to opt out of collective agreements. Collective bargaining was further reformed in June 2011.
4. But Spain is not out of the danger zone—there can be no let up in the reform momentum. Many of the imbalances and structural weaknesses accumulated during the boom remain to be fully addressed. The outlook is difficult and risks elevated. The overarching and self-reinforcing policy objectives should be to:
further enhance market confidence to ensure Spain continues to avoid being drawn into the euro area debt crisis, and
fully address the imbalances of the boom-bust cycle to move Spain to a new sustainable growth model.
6
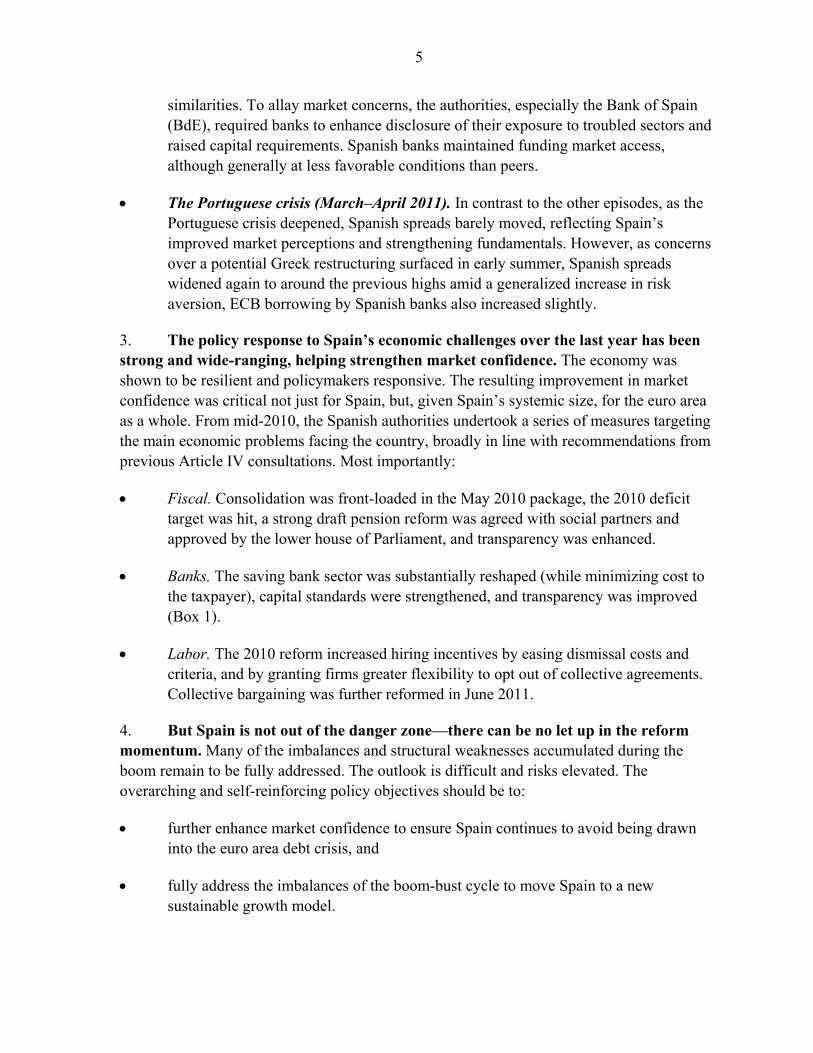
Spain: Main Policy Reforms Announced Since May 2010
Fiscal Financial Labor and Structural
• New law on savings banks: (i) giving the savings banks 4 organizational options, including to spin off banking operations to a commercial bank and to become a foundation, (ii) improvements in corporate governance requirements.
• Labor market reform: (i) reduction of severance pay (ii) financing of a portion of severance payments via a fund paid for by firms (iii) easing of the criteria for fair dismissals (iv) broadening the conditions under which firms can opt out of collective agreements.
• Comprehensive and transparent stress test as part of the EU-wide process• Reform of provisioning rules: (i) tightened allowances for repossessed real estate, (ii) unified and accelerated provisioning calendars, (iii) valuation haircuts for collateral (accounted for as mitigating factor).
• Pension reform: (i) increase in statutory retirement age from 65 to 67, (ii) gradual increase from 35 to 38.5 years of contribution for full pension rights, (iii) gradual increase in reference period from 15 to 25 years.
• Law to further strengthen the financial sector: (i) increase of core capital to 8 percent and to 10 percent for institutions reliant on wholesale funding and with limited private shareholding, (ii) individual recapitalization plans requested and approved by Bank of Spain, (iii) extended support of the FROB through the purchase of common equity.
• Sustainable Economy Law: (i) improvement in the process of issuance of new regulations, (ii) simplification of business registration, (iii) strengthening of the public procurement process, (iv) greater independence and powers of network industry regulators, (v) enhanced linkages between vocational training, businesses and the general education system, (vi)incentives for the housing rental market.
• Improved dissemination and transparency of regional budget execution.
• Enhanced bank-by-bank disclosure of exposure to troubled assets.
• Reform of active labor market policies : (i) reform of the public employment agencies, (ii) greater follow up of the unemployed and expanded training, (iii) multi annual plans with quantitative targets on employment, (iv) lowering of social contributions for the part time employment of the young and the long term unemployed.
• Removal of tax incentives for housing investment (2011 budget).
• Reform of the bankruptcy law: (i) introduction of alternatives to bankruptcy (such as refinancing agreements with preferred creditor status) and reduced reliance on judicial procedures, (ii) simplification of bankruptcy procedures in certain cases, (iii) increased powers for bankruptcy administrators, (iv) strengthened powers of judges on labour issues.
• Privatization of the Lottery and the Airports authority (AENA) and increase in excise taxes.
• Reform of collective bargaining: (i) increased prevalence of firm-level agreements, especially over provincial ones, (ii) reduction of the possibility of indefinite extension of previous agreements when social partners cannot agree on a new agreement, (iii) easing of opt-outs of collective agreements, (iv) options for firms to have greater internal flexibility.
Source: IMF staff .
First Phase: Spring/Summer 2010
Second Phase: Winter/Spring 2011
• Front-loaded consolidation, including 5 percent public wage cut, 10% hiring replacement rate, 2 percentage point increase in VAT rate effective July 1 (per 2010 budget).

7
Box 1. Savings Bank Reform
The savings bank landscape has been substantially reconfigured.
The number of institutions has been reduced from 45 to 18. Two small ailing savings banks were intervened and resolved. By mid-2010, the BdE approved seven mergers or takeovers and the creation of five institutional protection systems (“SIPs”), one of which subsequently broke up. Seven of the consolidation operations benefited from capital support in the form of convertible preference shares from the state bank support vehicle (“FROB”) for a total of €9.7 billion, equivalent to an average of 2 percent of total risk-weighted assets or 25 percent of Tier 1 capital of the seven. The associated restructuring plans envisage a reduction in the number of branches and staff ranging between 10–25 percent, and 12-18 percent, respectively. Progress is already being made, with the number of branches down 14 percent since the peak in 2008 and employees down 7 percent for the system as a whole.
New capital requirements prompted many savings banks to transfer their banking operations to commercial banks. In February 2011, a new law required by end-September an 8 percent minimum core capital ratio for all banks, but 10 percent for those that rely heavily on wholesale borrowing and without significant private shareholdings (in practice, savings banks). In March, the BdE notified that 12 banks, 8 of which were savings banks, must increase their capital by a total of €15 billion, with equity injections by the FROB as a backstop. Since March, commercial banks have raised the necessary capital; however, with the break-up of one SIP, the potential capital needs for savings banks to reach a 10-percent threshold rose to €16 billion. To facilitate private capital participation, most savings banks are reconfiguring their corporate structure by spinning off their banking operations into newly created commercial banks, and in some cases segregating part, or all of, their impaired real-estate assets in a separate company. Five of these new commercial banks, including the two largest, intend to raise capital from private sources. If these five processes to raise capital from private sources go through, the potential demand for FROB capital would be about €8 billion. To ensure the proper valuation of the beneficiary institutions, the FROB has established a comprehensive approach based upon the approval of a recapitalization plan; the carrying-out of financial and business due diligence; and the assessment of three independent investment firms. As customary, the whole process will be also subject to EC state aid oversight.
II. RECENT DEVELOPMENTS: A WEAK RECOVERY
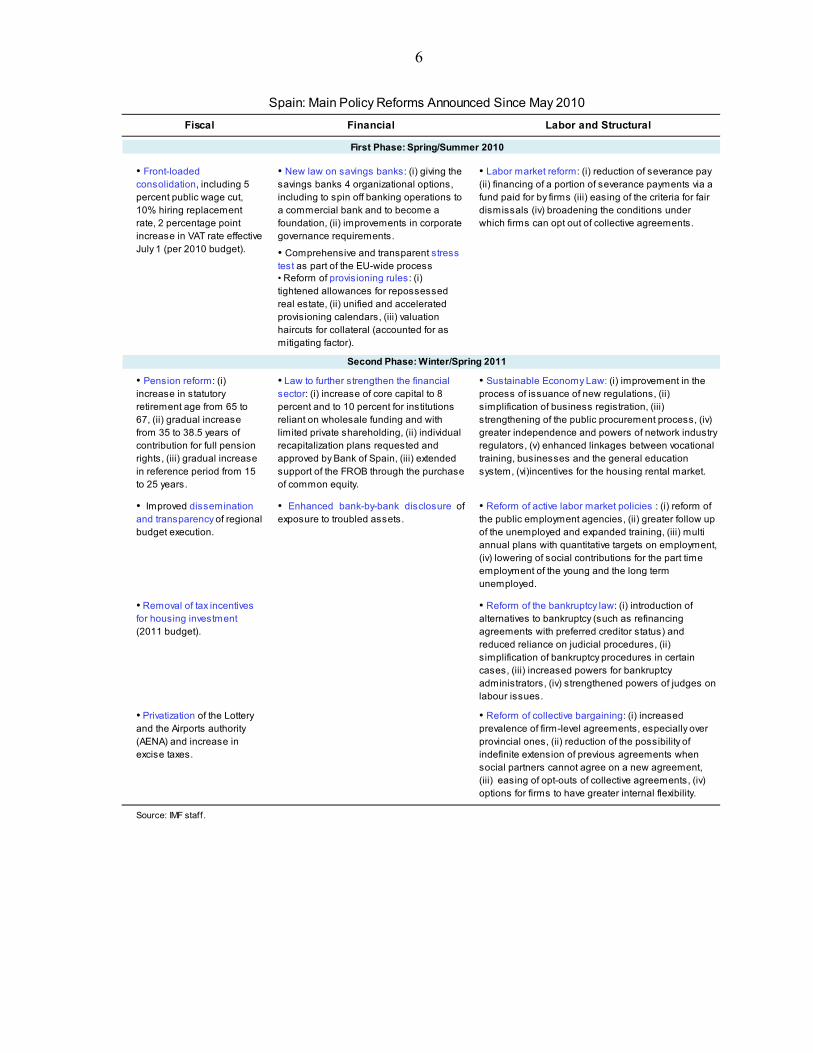
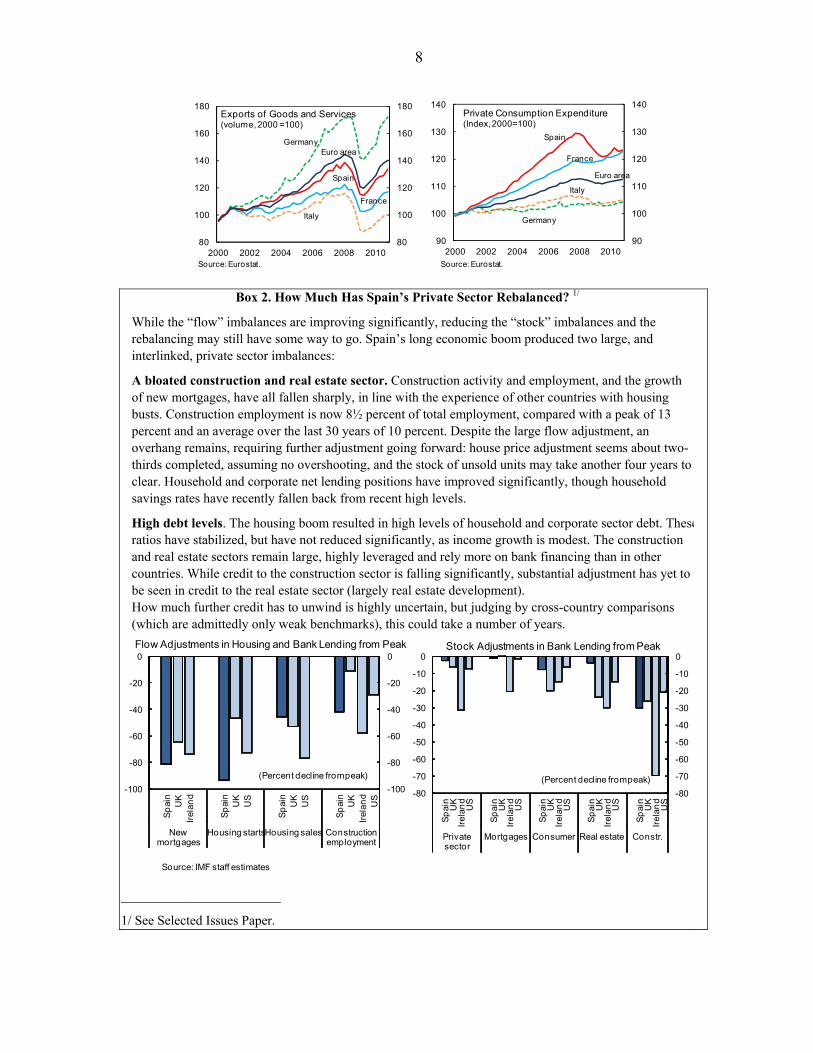
5. Output stabilized in 2010, led by net exports (Box 2, Table 1, and Figures 4–5). Exports rebounded strongly, as foreign demand recovered and domestic demand was weak, pushing firms to look for new outlets for their products abroad. Domestic demand’s contribution to growth was negative, dragged down by fiscal consolidation and the further downsizing of construction, and despite a fall in the household savings rate. Developments in Q1 2011 suggest a continuation of the modest, export led, recovery, with output growing only 0.3 percent quarter-on-quarter, compared to 0.8 percent for the euro area as a whole.
0
20
40
60
80
100
FROB 2 (Potential)
FROB 1
FROB Capital Support(percent of common equity Tier 1 ratio)1/
Sources: Banco de España; and IMF staff estimates.1/ Common equity Tier 1 capital consistent with a 10 percent risk-weighted asset ratio. FROB 2 contributions might be lower than reported in the chart (banks may raise capital from the market and then only be required to comply with 8 percent capital requirement).
8
Box 2. How Much Has Spain’s Private Sector Rebalanced? 1/
While the “flow” imbalances are improving significantly, reducing the “stock” imbalances and the rebalancing may still have some way to go. Spain’s long economic boom produced two large, and interlinked, private sector imbalances:
A bloated construction and real estate sector. Construction activity and employment, and the growth of new mortgages, have all fallen sharply, in line with the experience of other countries with housing busts. Construction employment is now 8½ percent of total employment, compared with a peak of 13 percent and an average over the last 30 years of 10 percent. Despite the large flow adjustment, an overhang remains, requiring further adjustment going forward: house price adjustment seems about two-thirds completed, assuming no overshooting, and the stock of unsold units may take another four years to clear. Household and corporate net lending positions have improved significantly, though household savings rates have recently fallen back from recent high levels.
High debt levels. The housing boom resulted in high levels of household and corporate sector debt. Theseratios have stabilized, but have not reduced significantly, as income growth is modest. The construction and real estate sectors remain large, highly leveraged and rely more on bank financing than in other countries. While credit to the construction sector is falling significantly, substantial adjustment has yet to be seen in credit to the real estate sector (largely real estate development). How much further credit has to unwind is highly uncertain, but judging by cross-country comparisons (which are admittedly only weak benchmarks), this could take a number of years.
________________________
1/ See Selected Issues Paper.
France
Germany
Italy
Spain
Euro area
80
100
120
140
160
180
80
100
120
140
160
180
2000 2002 2004 2006 2008 2010
Exports of Goods and Services (volume, 2000 =100)
Source: Eurostat.
90
100
110
120
130
140
90
100
110
120
130
140
2000 2002 2004 2006 2008 2010
Private Consumption Expenditure (Index, 2000=100)
Source: Eurostat.
Germany
Italy
Spain
Euro area
France
Source: IMF staff estimates
-100
-80
-60
-40
-20
0
-100
-80
-60
-40
-20
0
Sp
ain
UK
Irel
and
Sp
ain
UK
US
Sp
ain
UK
US
Sp
ain
UK
Irel
and
US
New mortgages
Housing startsHousing sales Construction employment
Flow Adjustments in Housing and Bank Lending from Peak
-80
-70
-60
-50
-40
-30
-20
-10
0
-80
-70
-60
-50
-40
-30
-20
-10
0
Sp
ain
UK
Irel
and
US
Sp
ain
UK
Irel
and
US
Sp
ain
UK
Irel
and
US
Sp
ain
UK
Irel
and
US
Sp
ain
UK
Irel
and
US
Private sector
Mortgages Consumer Real estate Constr.
(Percent decline from peak)
Stock Adjustments in Bank Lending from Peak
(Percent decline from peak)

9
6. The recovery has not been enough to reduce very high levels of unemployment. At around 21 percent, the unemployment rate is more than twice the euro area average. And while the adjustment through labor shedding has slowed, labor participation rose as the economy started to pick up—the increase in unemployment even accelerated in Q1 2011. Wage growth slowed in 2010, in particular as the effects of public sector wage cuts were felt, but adjustment clauses in existing collective agreements limited the trend of wage moderation since the beginning of 2011. Labor productivity rose in part due to labor shedding and the shift away from construction. This helped reduce unit labor costs, but they remain high, reflecting the accumulated increases of the boom years.
7. The housing market has continued to adjust. Housing activity has showed some signs of stabilization at a low level and housing sales have stabilized. But the adjustment in house prices has picked up somewhat in 2011, with a decline from peak ranging from 12 to 26 percent depending on the index. Inventory of unsold new units has stabilized, but remains large, with estimates ranging between 686,000–1½ million units.
8. Banks are deleveraging but asset quality remains a drag. The weak economy and the need for banks to delever led to a virtual standstill in lending to the private sector. Commercial banks increased their market share at the expense of the generally more troubled savings banks, possibly reflecting flight to quality and savings banks’ restructuring. Nonperforming loans have increased. Since January 2008, the banking sector has recognized losses of nearly 9 percent of GDP. Provisions have been bolstered but remain somewhat on the low side compared to peers when repossessed real estate assets are considered. Lower lending activity and increasing nonperforming assets have eaten into banks’ interest margins, while funding costs have been rising since end-2010, also reflecting higher deposit rates as banks fight for market share and stable funding sources. Banks’ profits have shrunk markedly, particularly for savings banks, while large international banks benefited from geographical (and business) diversification. Nonetheless, Spanish banks have bolstered their Tier 1 capital ratio from 8.4 percent in 2008 to 9.6 percent in 2010. However, Spanish banks’ capitalization remains somewhat on the low side compared to peers. To mitigate funding pressure, the authorities have extended, with EC approval, the bank bond debt guarantee scheme until end-2011 and increased banks’ deposit guarantee fund contributions on above-normal yield deposits.
Spain
Euro area
0
10
20
30
40
50
0
10
20
30
40
50
2005 2006 2007 2008 2009 2010 2011
Unemployment Rates
Euro area youth (<25 years)
Spain youth (<25 years)
0
5
10
15
20
25
-2
0
2
4
6
8
10
2005 2006 2007 2008 2009 2010 2011
Wage Costs and Unemployment (percent)
Unemployment rate (right scale)
Wage increase
Sources: Ministry of Labor and Immigration; Eurostat; and INE.
10
-30
-20
-10
0
10
20
30
40
0
40
80
120
160
200IT
A
GR
C
ES
P
PR
T
EA
…
BE
L
FR
A
IRL
NL
D
AU
T
DE
U
FIN
Average Payment Duration for Public Sector and Change in Average Payment
Delays in 2009-10
Duration (days)Change in delays (rhs)
Sources: European Payment Index
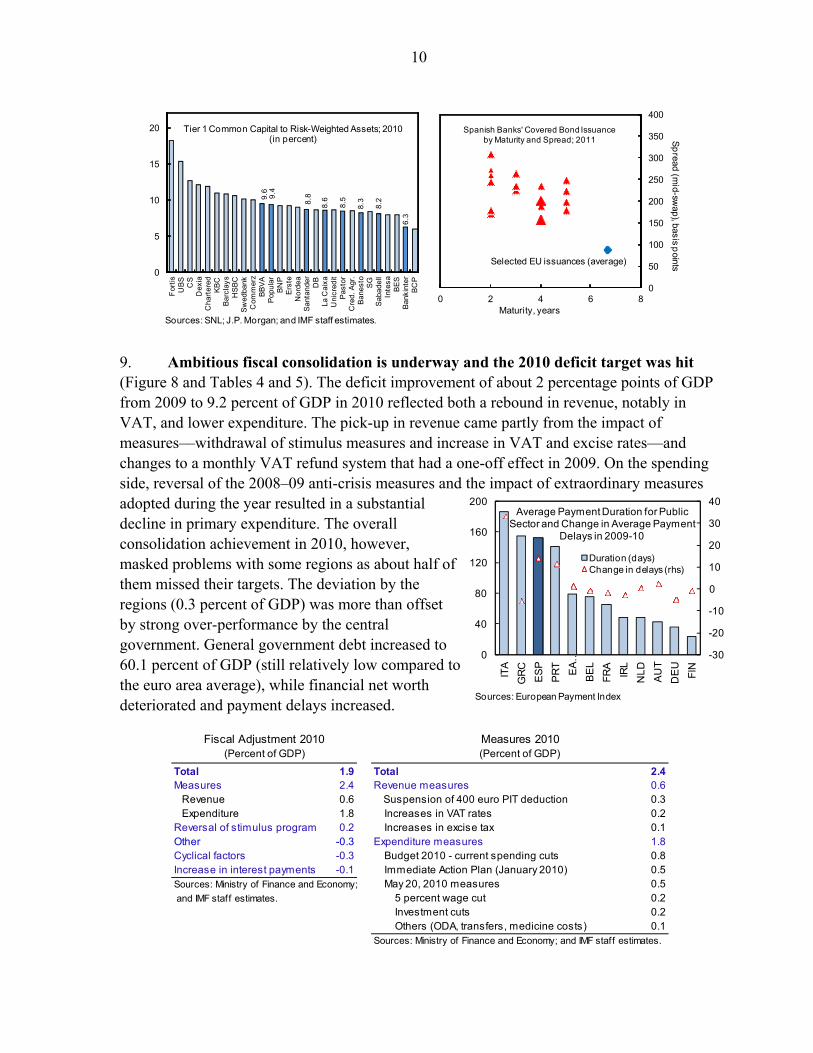
9. Ambitious fiscal consolidation is underway and the 2010 deficit target was hit (Figure 8 and Tables 4 and 5). The deficit improvement of about 2 percentage points of GDP from 2009 to 9.2 percent of GDP in 2010 reflected both a rebound in revenue, notably in VAT, and lower expenditure. The pick-up in revenue came partly from the impact of measures––withdrawal of stimulus measures and increase in VAT and excise rates—and changes to a monthly VAT refund system that had a one-off effect in 2009. On the spending side, reversal of the 2008–09 anti-crisis measures and the impact of extraordinary measures adopted during the year resulted in a substantial decline in primary expenditure. The overall consolidation achievement in 2010, however, masked problems with some regions as about half of them missed their targets. The deviation by the regions (0.3 percent of GDP) was more than offset by strong over-performance by the central government. General government debt increased to 60.1 percent of GDP (still relatively low compared to the euro area average), while financial net worth deteriorated and payment delays increased.
Sources: SNL; J.P. Morgan; and IMF staff estimates.
9.6 9.4
8.8
8.6
8.5
8.3 8.2
6.3
0
5
10
15
20
For
tis
UB
SC
SD
exia
Ch
arte
red
KB
CB
arc
lay
sH
SB
CS
wed
bank
Com
mer
zB
BV
AP
opul
ar
BN
PE
rste
No
rde
aS
ant
ande
rD
BLa
Cai
xa
Un
icre
dit
Pa
stor
Cre
d. A
gr.
Ba
nest
oS
GS
ab
adel
lIn
tes
aB
ES
Ba
nkin
ter
BC
P
Tier 1 Common Capital to Risk-Weighted Assets; 2010(in percent)
0
50
100
150
200
250
300
350
400
0 2 4 6 8
Sp
read (m
id-swap), basis p
oints
Maturity, years
Spanish Banks' Covered Bond Issuanceby Maturity and Spread; 2011
Selected EU issuances (average)
Total 1.9 Total 2.4Measures 2.4 Revenue measures 0.6 Revenue 0.6 Suspension of 400 euro PIT deduction 0.3 Expenditure 1.8 Increases in VAT rates 0.2Reversal of stimulus program 0.2 Increases in excise tax 0.1Other -0.3 Expenditure measures 1.8Cyclical factors -0.3 Budget 2010 - current spending cuts 0.8Increase in interest payments -0.1 Immediate Action Plan (January 2010) 0.5Sources: Ministry of Finance and Economy; May 20, 2010 measures 0.5 and IMF staff estimates. 5 percent wage cut 0.2
Investment cuts 0.2 Others (ODA, transfers, medicine costs) 0.1
Fiscal Adjustment 2010(Percent of GDP)
Measures 2010(Percent of GDP)
Sources: Ministry of Finance and Economy; and IMF staff estimates.
11
-150
-100
-50
0
50
-150
-100
-50
0
50
1999 2001 2003 2005 2007 2009
Net IIP Position(percent of GDP)
France GermanyGreece IrelandItaly PortugalSpain
Source: IFS.
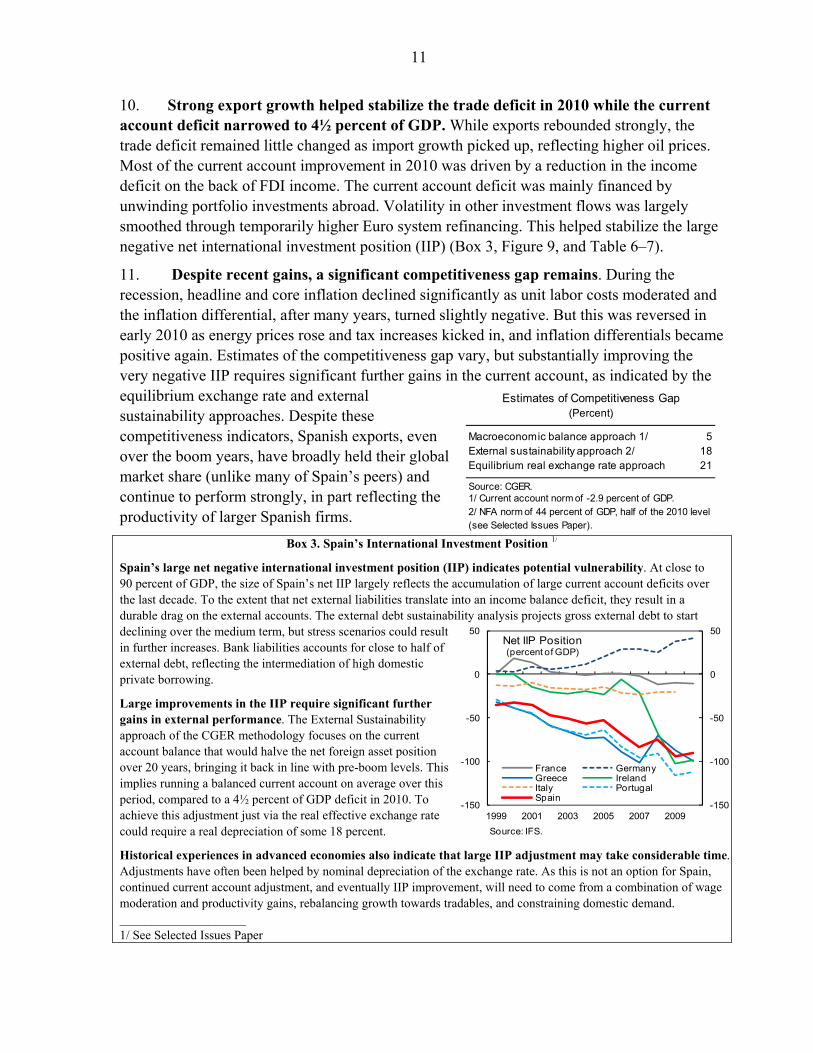
10. Strong export growth helped stabilize the trade deficit in 2010 while the current account deficit narrowed to 4½ percent of GDP. While exports rebounded strongly, the trade deficit remained little changed as import growth picked up, reflecting higher oil prices. Most of the current account improvement in 2010 was driven by a reduction in the income deficit on the back of FDI income. The current account deficit was mainly financed by unwinding portfolio investments abroad. Volatility in other investment flows was largely smoothed through temporarily higher Euro system refinancing. This helped stabilize the large negative net international investment position (IIP) (Box 3, Figure 9, and Table 6–7).
11. Despite recent gains, a significant competitiveness gap remains. During the recession, headline and core inflation declined significantly as unit labor costs moderated and the inflation differential, after many years, turned slightly negative. But this was reversed in early 2010 as energy prices rose and tax increases kicked in, and inflation differentials became positive again. Estimates of the competitiveness gap vary, but substantially improving the very negative IIP requires significant further gains in the current account, as indicated by the equilibrium exchange rate and external sustainability approaches. Despite these competitiveness indicators, Spanish exports, even over the boom years, have broadly held their global market share (unlike many of Spain’s peers) and continue to perform strongly, in part reflecting the productivity of larger Spanish firms.
Box 3. Spain’s International Investment Position 1/
Spain’s large net negative international investment position (IIP) indicates potential vulnerability. At close to 90 percent of GDP, the size of Spain’s net IIP largely reflects the accumulation of large current account deficits over the last decade. To the extent that net external liabilities translate into an income balance deficit, they result in a durable drag on the external accounts. The external debt sustainability analysis projects gross external debt to start declining over the medium term, but stress scenarios could result in further increases. Bank liabilities accounts for close to half of external debt, reflecting the intermediation of high domestic private borrowing.
Large improvements in the IIP require significant further gains in external performance. The External Sustainability approach of the CGER methodology focuses on the current account balance that would halve the net foreign asset position over 20 years, bringing it back in line with pre-boom levels. This implies running a balanced current account on average over this period, compared to a 4½ percent of GDP deficit in 2010. To achieve this adjustment just via the real effective exchange rate could require a real depreciation of some 18 percent.
Historical experiences in advanced economies also indicate that large IIP adjustment may take considerable time. Adjustments have often been helped by nominal depreciation of the exchange rate. As this is not an option for Spain, continued current account adjustment, and eventually IIP improvement, will need to come from a combination of wage moderation and productivity gains, rebalancing growth towards tradables, and constraining domestic demand. ____________________ 1/ See Selected Issues Paper
Estimates of Competitiveness Gap(Percent)
Macroeconomic balance approach 1/ 5External sustainability approach 2/ 18Equilibrium real exchange rate approach 21
Source: CGER.1/ Current account norm of -2.9 percent of GDP.2/ NFA norm of 44 percent of GDP, half of the 2010 level (see Selected Issues Paper).
12
III. OUTLOOK: A MODEST CYCLICAL RECOVERY AMIDST HEADWINDS AND TAIL RISKS
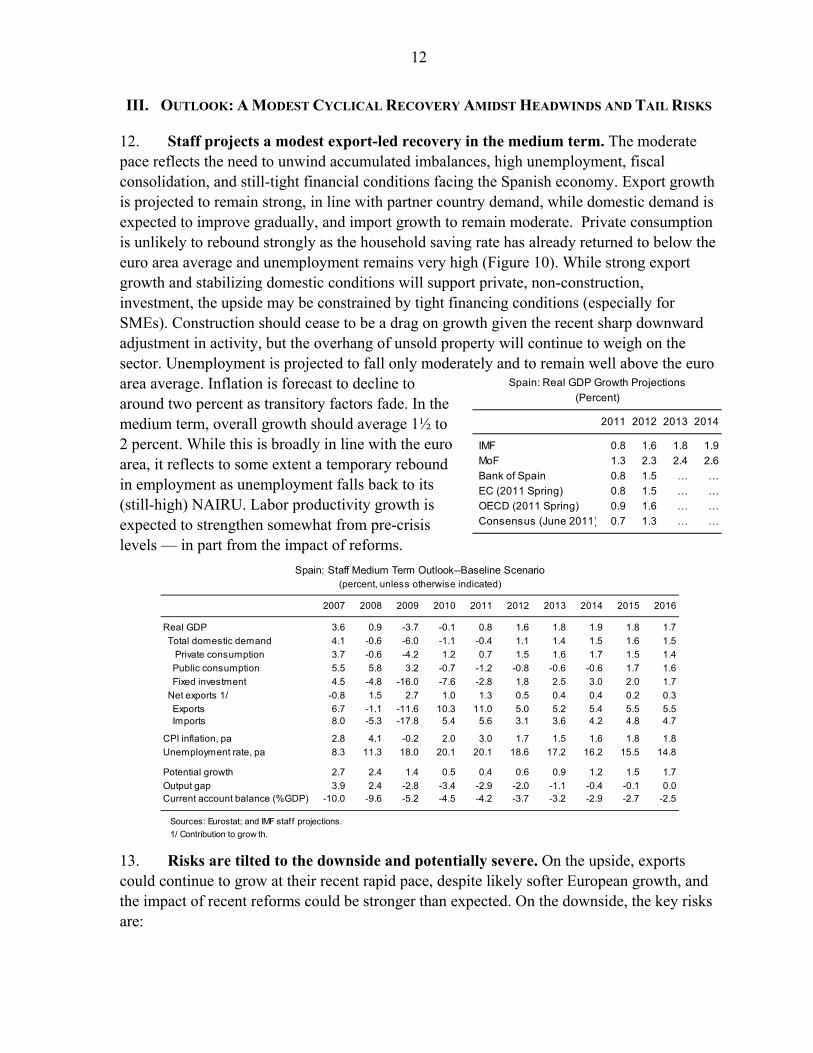
12. Staff projects a modest export-led recovery in the medium term. The moderate pace reflects the need to unwind accumulated imbalances, high unemployment, fiscal consolidation, and still-tight financial conditions facing the Spanish economy. Export growth is projected to remain strong, in line with partner country demand, while domestic demand is expected to improve gradually, and import growth to remain moderate. Private consumption is unlikely to rebound strongly as the household saving rate has already returned to below the euro area average and unemployment remains very high (Figure 10). While strong export growth and stabilizing domestic conditions will support private, non-construction, investment, the upside may be constrained by tight financing conditions (especially for SMEs). Construction should cease to be a drag on growth given the recent sharp downward adjustment in activity, but the overhang of unsold property will continue to weigh on the sector. Unemployment is projected to fall only moderately and to remain well above the euro area average. Inflation is forecast to decline to around two percent as transitory factors fade. In the medium term, overall growth should average 1½ to 2 percent. While this is broadly in line with the euro area, it reflects to some extent a temporary rebound in employment as unemployment falls back to its (still-high) NAIRU. Labor productivity growth is expected to strengthen somewhat from pre-crisis levels — in part from the impact of reforms.
13. Risks are tilted to the downside and potentially severe. On the upside, exports could continue to grow at their recent rapid pace, despite likely softer European growth, and the impact of recent reforms could be stronger than expected. On the downside, the key risks are:
Spain: Staff Medium Term Outlook--Baseline Scenario(percent, unless otherwise indicated)
2007 2008 2009 2010 2011 2012 2013 2014 2015 2016
Real GDP 3.6 0.9 -3.7 -0.1 0.8 1.6 1.8 1.9 1.8 1.7
Total domestic demand 4.1 -0.6 -6.0 -1.1 -0.4 1.1 1.4 1.5 1.6 1.5
Private consumption 3.7 -0.6 -4.2 1.2 0.7 1.5 1.6 1.7 1.5 1.4
Public consumption 5.5 5.8 3.2 -0.7 -1.2 -0.8 -0.6 -0.6 1.7 1.6
Fixed investment 4.5 -4.8 -16.0 -7.6 -2.8 1.8 2.5 3.0 2.0 1.7
Net exports 1/ -0.8 1.5 2.7 1.0 1.3 0.5 0.4 0.4 0.2 0.3
Exports 6.7 -1.1 -11.6 10.3 11.0 5.0 5.2 5.4 5.5 5.5 Imports 8.0 -5.3 -17.8 5.4 5.6 3.1 3.6 4.2 4.8 4.7
CPI inflation, pa 2.8 4.1 -0.2 2.0 3.0 1.7 1.5 1.6 1.8 1.8
Unemployment rate, pa 8.3 11.3 18.0 20.1 20.1 18.6 17.2 16.2 15.5 14.8
Potential growth 2.7 2.4 1.4 0.5 0.4 0.6 0.9 1.2 1.5 1.7
Output gap 3.9 2.4 -2.8 -3.4 -2.9 -2.0 -1.1 -0.4 -0.1 0.0Current account balance (%GDP) -10.0 -9.6 -5.2 -4.5 -4.2 -3.7 -3.2 -2.9 -2.7 -2.5
Sources: Eurostat; and IMF staff projections.
1/ Contribution to grow th.
Spain: Real GDP Growth Projections
(Percent)
2011 2012 2013 2014
IMF 0.8 1.6 1.8 1.9
MoF 1.3 2.3 2.4 2.6
Bank of Spain 0.8 1.5 … …
EC (2011 Spring) 0.8 1.5 … …
OECD (2011 Spring) 0.9 1.6 … …
Consensus (June 2011) 0.7 1.3 … …

13
In the near term, financial conditions could deteriorate further, reflecting rising concerns about sovereign risks in the euro area. While direct real and financial exposure to Greece, Ireland, and Portugal are limited, contagion may occur through confidence effects that can affect perception of credit risk. Given also the significant exposure of Spanish banks to their sovereign, this could put additional pressure on sovereign and bank funding costs for Spain, which in turn could feedback to the real economy. Spain’s financing needs also remain significant for the public sector in coming months and for banks in early 2012.
In the medium term, a protracted slow recovery in growth and, especially, stubbornly high unemployment. In this case, domestic headwinds could intensify, starting a negative cycle of greater-than-expected falls in house prices, delays in bank balance sheet repair, and faster household and corporate deleveraging. Combined with potentially unresponsive labor costs, this could undermine employment growth.
Scenarios of negative spillovers from Spain indicate a substantial impact on the rest of Europe and indeed globally, given the country’s systemic importance (Box 4).
14. The political context may prove challenging. The governing socialist party is in a minority and relies on an alliance with two small regional parties to pass legislation. The center-right main opposition party made substantial gains in the May local elections and has repeatedly called for an early general election (which is due by March 2012).
Authorities’ views
15. The authorities viewed the risks to Spain from further concern about sovereign risks in the euro area as significant but manageable, and pointed to Spain’s strong fundamentals and policy responsiveness. They firmly believed that Spain’s resilience, proven in previous episodes of contagion, has been further enhanced by structural reforms and strong delivery on policy commitments. Given the systemic nature of the risk, the
0
10
20
30
40
50
0
10
20
30
40
50
Jul-11 Oct-11 Jan-12 Apr-12 Jul-12 Oct-12
BanksLocal GovernmentCentral Government
Spain Government and Bank Debt Maturity Prof ile(billions of euro)
Sources: Bloomberg; and IMF staff estimates .
14
appropriate response should be at the system level, rather than at the level of individual countries, and the government was confident that the European response would indeed be sufficiently strong.
16. The government sees a stronger recovery with growth reaching 2.6 percent by 2014. This rebound is driven chiefly by substantial export growth, reflecting the continued dynamism of Spanish exports, and more robust domestic investment, especially in machinery and equipment. The government also projects higher potential growth than staff, due to the envisaged strong effects of the recent reforms. But despite stronger employment growth, they also projected unemployment to remain high (16 percent in 2014) in line with staff’s projections on the back of more resilient labor force participation. The BdE’s forecast for growth is more in line with that of staff, though with more robust investment and less private consumption.
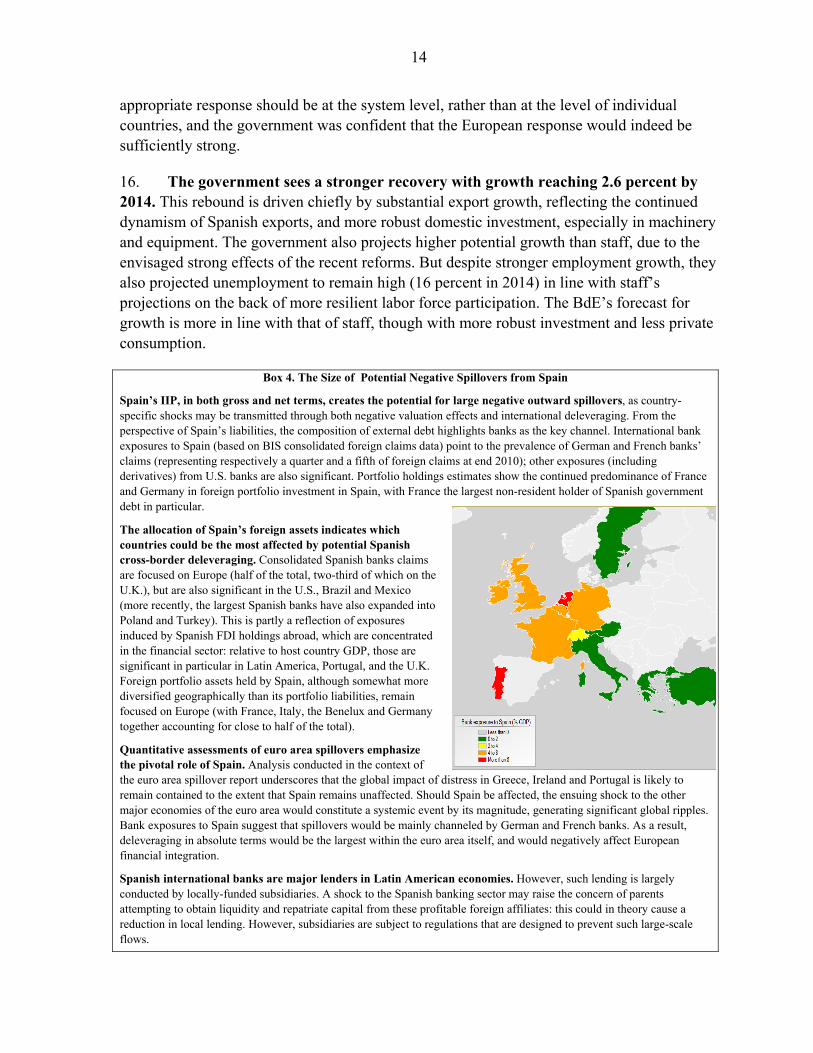
Box 4. The Size of Potential Negative Spillovers from Spain
Spain’s IIP, in both gross and net terms, creates the potential for large negative outward spillovers, as country-specific shocks may be transmitted through both negative valuation effects and international deleveraging. From the perspective of Spain’s liabilities, the composition of external debt highlights banks as the key channel. International bank exposures to Spain (based on BIS consolidated foreign claims data) point to the prevalence of German and French banks’ claims (representing respectively a quarter and a fifth of foreign claims at end 2010); other exposures (including derivatives) from U.S. banks are also significant. Portfolio holdings estimates show the continued predominance of France and Germany in foreign portfolio investment in Spain, with France the largest non-resident holder of Spanish government debt in particular.
The allocation of Spain’s foreign assets indicates which countries could be the most affected by potential Spanish cross-border deleveraging. Consolidated Spanish banks claims are focused on Europe (half of the total, two-third of which on the U.K.), but are also significant in the U.S., Brazil and Mexico (more recently, the largest Spanish banks have also expanded into Poland and Turkey). This is partly a reflection of exposures induced by Spanish FDI holdings abroad, which are concentrated in the financial sector: relative to host country GDP, those are significant in particular in Latin America, Portugal, and the U.K. Foreign portfolio assets held by Spain, although somewhat more diversified geographically than its portfolio liabilities, remain focused on Europe (with France, Italy, the Benelux and Germany together accounting for close to half of the total).
Quantitative assessments of euro area spillovers emphasize the pivotal role of Spain. Analysis conducted in the context of the euro area spillover report underscores that the global impact of distress in Greece, Ireland and Portugal is likely to remain contained to the extent that Spain remains unaffected. Should Spain be affected, the ensuing shock to the other major economies of the euro area would constitute a systemic event by its magnitude, generating significant global ripples. Bank exposures to Spain suggest that spillovers would be mainly channeled by German and French banks. As a result, deleveraging in absolute terms would be the largest within the euro area itself, and would negatively affect European financial integration.
Spanish international banks are major lenders in Latin American economies. However, such lending is largely conducted by locally-funded subsidiaries. A shock to the Spanish banking sector may raise the concern of parents attempting to obtain liquidity and repatriate capital from these profitable foreign affiliates: this could in theory cause a reduction in local lending. However, subsidiaries are subject to regulations that are designed to prevent such large-scale flows.

15
IV. POLICY AGENDA: ENHANCING MARKET CONFIDENCE AND MOVING TO A NEW
GROWTH MODEL
17. Unwinding the imbalances of the boom years and the legacy of the crisis will take years. While many of the “flow” imbalances are improving significantly (for example, the external and fiscal deficits and the size of the construction sector), the “stock” problems remain (stretched private sector and external balance sheets, high unemployment, the overvalued housing market and stock of unsold units). And some of the underlying problems of the Spanish economy — especially weak productivity growth and a dysfunctional labor market — remain to be fully addressed. Combined with the threat of further regional financial contagion, these weaknesses make the outlook both difficult and risky.
18. A new growth model is needed. The old model, based on credit and housing booms drawing employment and financial resources borrowed abroad into low productivity non-tradable sectors, was unsustainable and is unlikely (and undesirable) to resume. The new growth model will need to be more balanced between tradable and non-tradable sectors and based much more on boosting the supply side of the economy.
For the tradable sector, where labor productivity growth has been stronger but employment growth minimal, the challenge will be to encourage firms to expand and hire, while maintaining or improving productivity growth. This calls for strengthening the business environment and containing costs, which in turn means moderating the price of labor and reducing price pressure from the non-tradable sector.
For the non-tradable sector, where employment growth has been strong but productivity growth generally weak, the challenge will be to boost productivity, spur employment growth outside the construction and public administration sectors, and contain price pressures. Continuing to foster competition into the sector is critical for raising productivity and reducing mark-ups. This will need, especially in the nearer term, to be accompanied by significant moderation of labor costs to spur employment.
19. This means that while the policy response to date has been strong, this needs to go further, and there can be no let up in the reform momentum. The key now is to follow through on the measures already adopted while continuing to strengthen policy settings in other areas, in particular, fully addressing concerns about banking and fiscal sustainability to reduce borrowing costs and allow for a reallocation of credit, a bold strengthening of labor market reforms to substantially reduce unemployment, and fostering greater competition in domestic markets.
Authorities’ views
20. The government pointed to the challenges of moving to a new growth model, the importance of reforms already taken, and the need for continued implementation. They highlighted the challenges of reallocating significant amounts of labor and resources within
16
the economy, but noted the productivity potential existing in Spain, as evidenced by the dynamism of exports, the increasing share of exporting firms and the capacity of the economy to rebalance quicker than expected. They stressed that the priority is now strong implementation of the existing structural measures, which will take time to have full effect. While acknowledging the need for some deleveraging, they considered that stocks of private debt and external liabilities larger than the equilibrium levels before the euro could be appropriate given financial market integration.
A. Financial Sector: Completing the Reforms
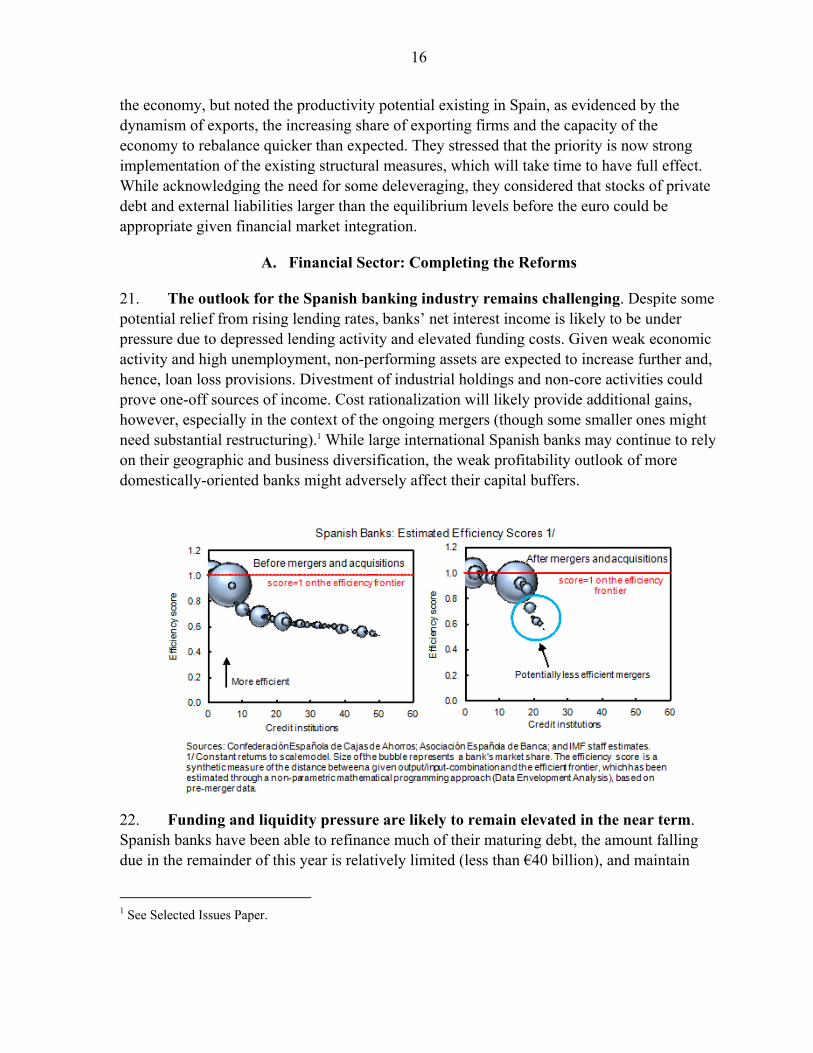
21. The outlook for the Spanish banking industry remains challenging. Despite some potential relief from rising lending rates, banks’ net interest income is likely to be under pressure due to depressed lending activity and elevated funding costs. Given weak economic activity and high unemployment, non-performing assets are expected to increase further and, hence, loan loss provisions. Divestment of industrial holdings and non-core activities could prove one-off sources of income. Cost rationalization will likely provide additional gains, however, especially in the context of the ongoing mergers (though some smaller ones might need substantial restructuring).1 While large international Spanish banks may continue to rely on their geographic and business diversification, the weak profitability outlook of more domestically-oriented banks might adversely affect their capital buffers.
22. Funding and liquidity pressure are likely to remain elevated in the near term. Spanish banks have been able to refinance much of their maturing debt, the amount falling due in the remainder of this year is relatively limited (less than €40 billion), and maintain
1 See Selected Issues Paper.
17
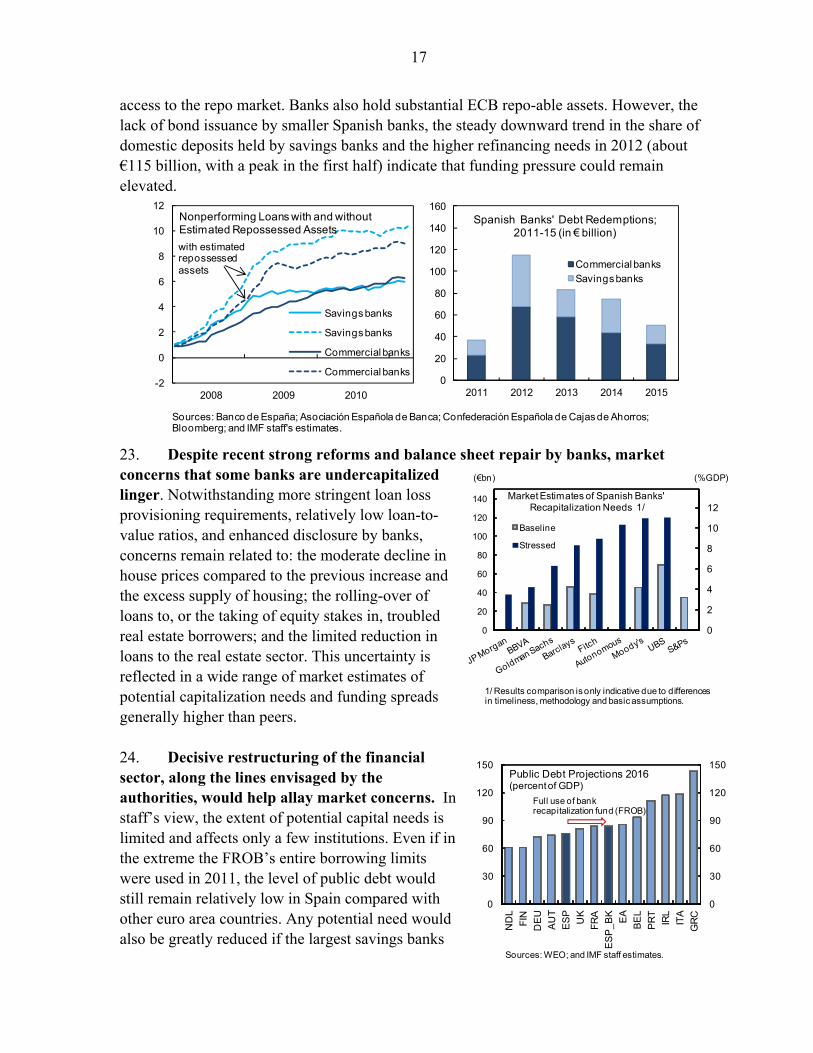
access to the repo market. Banks also hold substantial ECB repo-able assets. However, the lack of bond issuance by smaller Spanish banks, the steady downward trend in the share of domestic deposits held by savings banks and the higher refinancing needs in 2012 (about €115 billion, with a peak in the first half) indicate that funding pressure could remain elevated.
23. Despite recent strong reforms and balance sheet repair by banks, market concerns that some banks are undercapitalized linger. Notwithstanding more stringent loan loss provisioning requirements, relatively low loan-to-value ratios, and enhanced disclosure by banks, concerns remain related to: the moderate decline in house prices compared to the previous increase and the excess supply of housing; the rolling-over of loans to, or the taking of equity stakes in, troubled real estate borrowers; and the limited reduction in loans to the real estate sector. This uncertainty is reflected in a wide range of market estimates of potential capitalization needs and funding spreads generally higher than peers. 24. Decisive restructuring of the financial sector, along the lines envisaged by the authorities, would help allay market concerns. In staff’s view, the extent of potential capital needs is limited and affects only a few institutions. Even if in the extreme the FROB’s entire borrowing limits were used in 2011, the level of public debt would still remain relatively low in Spain compared with other euro area countries. Any potential need would also be greatly reduced if the largest savings banks
0
20
40
60
80
100
120
140
160
2011 2012 2013 2014 2015
Spanish Banks' Debt Redemptions; 2011-15 (in € billion)
Commercial banks
Savings banks
-2
0
2
4
6
8
10
12
2008 2009 2010
Savings banks
Savings banks
Commercial banks
Commercial banks
with estimated repossessed assets
Nonperforming Loans with and without Estimated Repossessed Assets
Sources: Banco de España; Asociación Española de Banca; Confederación Española de Cajas de Ahorros; Bloomberg; and IMF staff's estimates.
0
30
60
90
120
150
0
30
60
90
120
150
ND
L
FIN
DE
U
AU
T
ES
P
UK
FR
A
ES
P_
BK
EA
BE
L
PR
T
IRL
ITA
GR
C
Public Debt Projections 2016(percent of GDP)
Full use of bank recapitalization fund (FROB)
Sources: WEO; and IMF staff estimates.
0
2
4
6
8
10
12
0
20
40
60
80
100
120
140
Baseline
Stressed
Market Estimates of Spanish Banks' Recapitalization Needs 1/
(€bn) (%GDP)
1/ Results comparison is only indicative due to differences in timeliness, methodology and basic assumptions.
18
raise needed capital from the market. Nevertheless, it is also the case that there is a particularly high range of uncertainty around the valuation of many assets. A decisive restructuring of the financial sector, combined with robust capital and liquidity buffers, would reduce uncertainty, protect against tail risks, and foster a faster reallocation of credit across sectors.
Weak banks. The viability of those weak banks that have little prospect of tapping the capital market, should be carefully assessed on deliberately conservative assumptions. For instance, if the FROB were to end up holding a majority equity stake in a bank, there should be a presumption that the institution is swiftly resolved. Although FROB equity is already conditional on a restructuring plan, the conditionality could be strengthened. For example, to safeguard public funds and encourage a quick exit from FROB auspices, no profit distribution should be allowed until FROB equity stakes are repurchased (unless a significant portion of equity is sold to private investors and a rapid exit from FROB is guaranteed).
Buffers. Given the uncertainty about the operating environment, banks should be encouraged, via pillar II, to achieve capital buffers above the minimum requirements revised in February 2011, especially for those banks with more uncertain asset quality. A core Tier 1 ratio of at least 10 percent by the end of 2012, for example, would bring Spanish banks in line with most well-capitalized large European banks and could help improve market confidence and hence funding conditions. Provisioning buffers could also be further strengthened. Spain’s global and domestic systemically important financial institutions (SIFIs) should go further in building capital (and liquidity) buffers, in line with emerging international consensus.
Stress testing. The Europe-wide stress tests ought to underpin confidence about the extent of any potential capital needs. It is encouraging that the coverage of Spanish banks is, again, to be much wider than in the rest of Europe. To strengthen market confidence, it would be useful to fully disclose the underlying data and specific methodology behind the results. Consideration could be given to complementing future stress tests with a review of estimates of loan losses (especially real-estate related) by a leading independent firm. The results of this review could then be made public.
Transparency. Enhanced transparency should become a permanent feature of the Spanish system. The scope, granularity, and comparability of bank-by-bank information, especially on troubled real estate exposure and some prudential indicators, could be further improved and published under the aegis of the Bank of Spain.
Savings bank reform. Transferring banking business to newly-created commercial banks to be listed on the stock exchange is a crucial step forward, and should be done
19
Total 3.2Measures (impact of 2010-11 Budget) 2.8 Revenue 0.5 Expenditure (May package) 1.0 Wage (replacement rate) 0.3 Spending cuts (Central gov. Budget 2011) 0.7 Spending cuts (Regional gov. Budget 2011) 0.5Reversal of stimulus program 0.5Cyclical factors 0.1Increase in interest payments -0.3Sources: Ministry of Finance and Economy; and IMFstaff estimates.
Planned Fiscal Adjustment 2011(Percent of GDP)
promptly. Yet savings banks will retain their majority ownership in these newly-created, and in many cases very large, banking entities. Going forward, savings banks should become arms-length minority interest institutional investors, which would likely require their conversion into foundations, as envisaged by the law. To provide a sound and comprehensive legal and regulatory framework to these entities, consideration could thus be given to preparing a special law for foundations with substantial bank interests. Additional improvements to savings bank governance could be made more immediately, including: (1) further reducing public sector representation and increasing the number of independent members of executive boards; (2) applying robust fit-and-proper criteria to all managers and directors; and (3) ensuring the separation of managerial positions in the controlled and controlling entities.
Authorities’ views
25. The authorities reiterated their commitment to completing the ongoing financial sector strengthening. They were of the view that the new provision and capital requirements are sufficient to ensure the soundness of the Spanish banking system even in stressed conditions. In any event, they confirmed their intention to strongly address any shortfalls that could emerge. They concurred that transparency has proven to be a most useful tool to allay market sentiment in this uncertain environment, and they will consider ways to enhance further disclosure of the Spanish banking system, but consider that Spain is already at the forefront.
26. On savings banks, the authorities emphasized that the strategy has not been confined to a mere recapitalization. They stressed rather it has engineered an historic, far-reaching, and lasting transformation of the sector. In this regard, further legislative changes, including regarding foundations, were not viewed as a priority, while strengthening corporate governance was considered as an ineluctable consequence of the ongoing transformation. The authorities confirmed that FROB capital injections will be at market price and temporary; they also pointed out that FROB representatives will oversee strict implementation of the agreed recapitalization plan.
B. Fiscal Policy: Achieving the Ambitious Consolidation Targets and Beyond
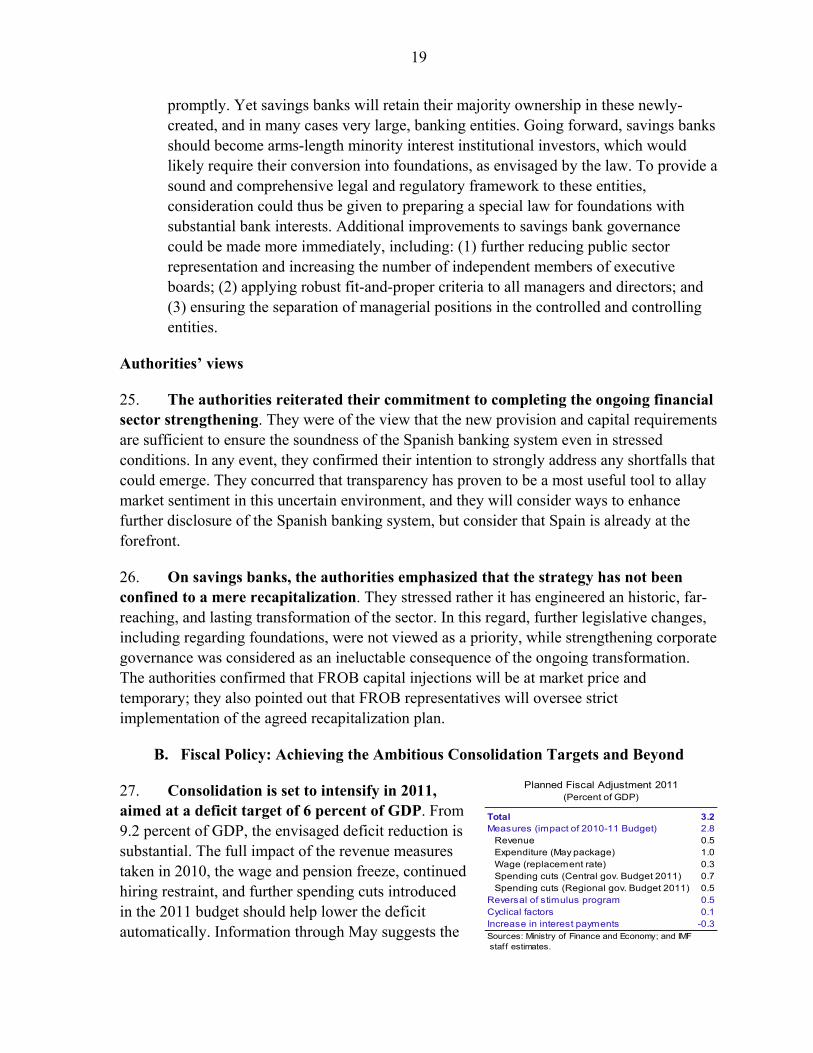
27. Consolidation is set to intensify in 2011, aimed at a deficit target of 6 percent of GDP. From 9.2 percent of GDP, the envisaged deficit reduction is substantial. The full impact of the revenue measures taken in 2010, the wage and pension freeze, continued hiring restraint, and further spending cuts introduced in the 2011 budget should help lower the deficit automatically. Information through May suggests the
20
central government is broadly on track. If near-term risks to the outlook materialize, some additional measures may be necessary (staff project a deficit of 6.2 percent of GDP without such measures). But the larger risk to the 2011 target is that some regional governments may again miss their targets.
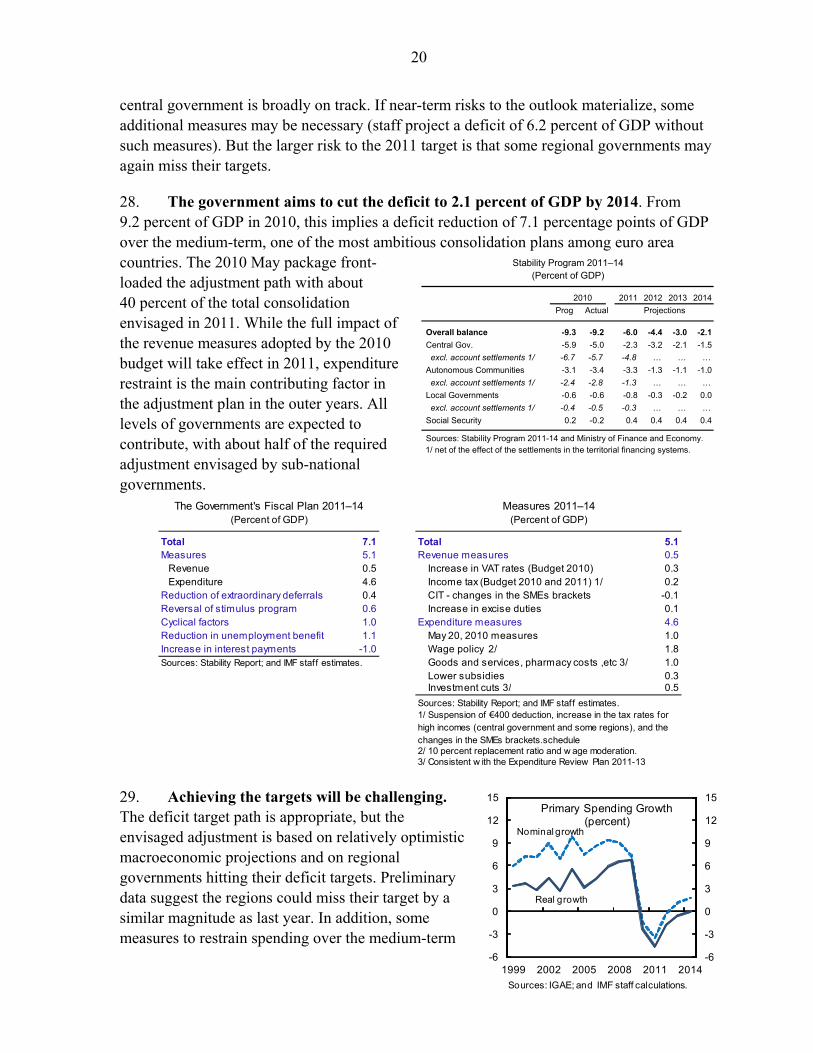
28. The government aims to cut the deficit to 2.1 percent of GDP by 2014. From 9.2 percent of GDP in 2010, this implies a deficit reduction of 7.1 percentage points of GDP over the medium-term, one of the most ambitious consolidation plans among euro area countries. The 2010 May package front-loaded the adjustment path with about 40 percent of the total consolidation envisaged in 2011. While the full impact of the revenue measures adopted by the 2010 budget will take effect in 2011, expenditure restraint is the main contributing factor in the adjustment plan in the outer years. All levels of governments are expected to contribute, with about half of the required adjustment envisaged by sub-national governments.
29. Achieving the targets will be challenging. The deficit target path is appropriate, but the envisaged adjustment is based on relatively optimistic macroeconomic projections and on regional governments hitting their deficit targets. Preliminary data suggest the regions could miss their target by a similar magnitude as last year. In addition, some measures to restrain spending over the medium-term
Total 7.1 Total 5.1Measures 5.1 Revenue measures 0.5 Revenue 0.5 Increase in VAT rates (Budget 2010) 0.3 Expenditure 4.6 Income tax (Budget 2010 and 2011) 1/ 0.2Reduction of extraordinary deferrals 0.4 CIT - changes in the SMEs brackets -0.1Reversal of stimulus program 0.6 Increase in excise duties 0.1Cyclical factors 1.0 Expenditure measures 4.6Reduction in unemployment benefit 1.1 May 20, 2010 measures 1.0Increase in interest payments -1.0 Wage policy 2/ 1.8Sources: Stability Report; and IMF staff estimates. Goods and services, pharmacy costs ,etc 3/ 1.0
Lower subsidies 0.3 Investment cuts 3/ 0.5
Sources: Stability Report; and IMF staff estimates.
2/ 10 percent replacement ratio and w age moderation.3/ Consistent w ith the Expenditure Review Plan 2011-13
The Government's Fiscal Plan 2011‒14 Measures 2011‒14(Percent of GDP) (Percent of GDP)
1/ Suspension of €400 deduction, increase in the tax rates for high incomes (central government and some regions), and the changes in the SMEs brackets.schedule
2010 2011 2012 2013 2014
Prog Actual
Overall balance -9.3 -9.2 -6.0 -4.4 -3.0 -2.1
Central Gov. -5.9 -5.0 -2.3 -3.2 -2.1 -1.5
excl. account settlements 1/ -6.7 -5.7 -4.8 … … …
Autonomous Communities -3.1 -3.4 -3.3 -1.3 -1.1 -1.0
excl. account settlements 1/ -2.4 -2.8 -1.3 … … …
Local Governments -0.6 -0.6 -0.8 -0.3 -0.2 0.0
excl. account settlements 1/ -0.4 -0.5 -0.3 … … …
Social Security 0.2 -0.2 0.4 0.4 0.4 0.4
Sources: Stability Program 2011-14 and Ministry of Finance and Economy. 1/ net of the effect of the settlements in the territorial financing systems.
(Percent of GDP)Stability Program 2011–14
Projections
-6
-3
0
3
6
9
12
15
-6
-3
0
3
6
9
12
15
1999 2002 2005 2008 2011 2014
Nominal growth
Real growth
Primary Spending Growth(percent)
Sources: IGAE; and IMF staff calculations.

21
have not been fully identified and implementing the envisaged spending containment requires a decisive break with the past (for example, the public sector wage bill is projected to decline by ½ percent of GDP a year). Spain’s annual financing requirements are also projected to remain substantial in the next few years, around 20 percent of GDP, underscoring the need for maintaining market confidence.
30. Additional measures may thus be required. Staff projects the deficit to decline to about 4 percent of GDP in 2014. Taking into account the risk stemming from the potentially weaker growth outlook and the need to build buffers to offset the potential slippage by the regions, additional measures of about 2 percent of GDP (cumulative through 2014) would be required to achieve the government’s targets. General government debt would continue to increase to about 74 percent of GDP. To ensure the debt ratio is on a firmly declining path by 2014 and anchor longer-term sustainability and market expectations, pro-active management of below-the-line operations (such as privatization) is warranted. And while staff believes the central government remains committed to taking necessary measures to achieve the overall targets, the credibility and quality of fiscal policy could be further enhanced by more prudent macroeconomic projections and spelling out specific measures to ensure the targets are attained. There is considerable scope for additional measures, including:
further reducing current spending (for example, the wage bill still remains higher than the euro area average because of hefty past increases in public employment),
cutting investment (which has been well above the EU average levels), and
raising the still relatively low VAT and excise rates especially on petroleum products.
Sources: WEO and IMF staff estimates.1/ Projected debt ratio assuming the SGP deficit targets are met under the unchanged staff macro projections.
-9.2
-6.0
-4.4
-3.0-2.1
-6.2
-5.1-4.3
-3.9 -3.9 -3.8
-10
-8
-6
-4
-2
0
2010 2011 2012 2013 2014 2015 2016
Authorities'(SGP)
Staff
Gap
Authorities' and Staf f Fiscal Def icit Projections
(percent of GDP)
67.368.5
69.3 68.9
60.1
67.5
69.7
72.1
73.9
70.0 70.1
58
62
66
70
74
78
2010 2011 2012 2013 2014
Authorities (SGP)
Staff
Staff "adjustment" scenario 1/
Medium-term Debt Projections (percent of GDP)
22
0
100
200
300
400
500
0
100
200
300
400
500
2000 2010 2020 2030 2040 2050 2060
General Government Debt (Percent of GDP)
Unchanged policies and no pension reformAdjustment to MTO by 2016 and no pension reformMTO by 2016 and pension reform
60% of GDP
Sources: IGAE; European Commission Ageing Report 2009; and IMF staff estimates.
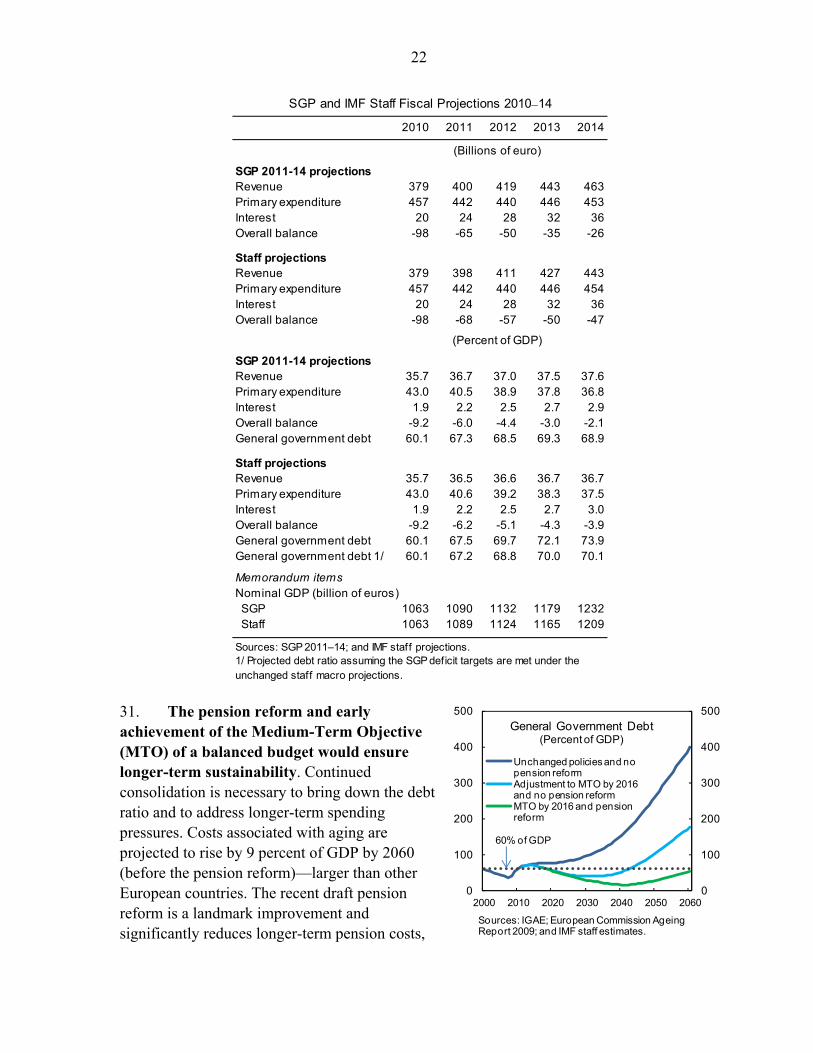
31. The pension reform and early achievement of the Medium-Term Objective (MTO) of a balanced budget would ensure longer-term sustainability. Continued consolidation is necessary to bring down the debt ratio and to address longer-term spending pressures. Costs associated with aging are projected to rise by 9 percent of GDP by 2060 (before the pension reform)—larger than other European countries. The recent draft pension reform is a landmark improvement and significantly reduces longer-term pension costs,
SGP and IMF Staff Fiscal Projections 2010‒14
2010 2011 2012 2013 2014
(Billions of euro)
SGP 2011-14 projectionsRevenue 379 400 419 443 463Primary expenditure 457 442 440 446 453Interest 20 24 28 32 36Overall balance -98 -65 -50 -35 -26
Staff projectionsRevenue 379 398 411 427 443Primary expenditure 457 442 440 446 454Interest 20 24 28 32 36Overall balance -98 -68 -57 -50 -47
(Percent of GDP)
SGP 2011-14 projectionsRevenue 35.7 36.7 37.0 37.5 37.6Primary expenditure 43.0 40.5 38.9 37.8 36.8Interest 1.9 2.2 2.5 2.7 2.9Overall balance -9.2 -6.0 -4.4 -3.0 -2.1General government debt 60.1 67.3 68.5 69.3 68.9
Staff projectionsRevenue 35.7 36.5 36.6 36.7 36.7Primary expenditure 43.0 40.6 39.2 38.3 37.5Interest 1.9 2.2 2.5 2.7 3.0Overall balance -9.2 -6.2 -5.1 -4.3 -3.9General government debt 60.1 67.5 69.7 72.1 73.9General government debt 1/ 60.1 67.2 68.8 70.0 70.1
Memorandum itemsNominal GDP (billion of euros) SGP 1063 1090 1132 1179 1232 Staff 1063 1089 1124 1165 1209
Sources: SGP 2011‒14; and IMF staff projections.1/ Projected debt ratio assuming the SGP deficit targets are met under the unchanged staff macro projections.
23
but could be further enhanced during the parliamentary approval process (Box 5). In particular, the transition period could be shortened, incentives for early retirement further reduced, the link of pension parameters to life expectancy (the “sustainability factor”) could be made automatic, and the reference period extended to life-time earnings. But securing long-term sustainability also requires additional adjustment efforts to attain Spain’s MTO of a balanced budget over the cycle and further reforms to address the pressures from aging especially healthcare. To help anchor expectations, the government should thus commit to achieving early its MTO by no later than 2016.1
Box 5. Pension Reform
A draft pension reform was approved by the Lower House in end-June 2011. Key elements include:
raising the statutory retirement age from 65 to 67, phased in gradually between 2013–27; increasing the numbers of years to calculate the earnings base (reference period) from 15 to
25 years and the numbers of contribution years to qualify for the full pension from 35 to 38.5 years;
tightening eligibility criteria for early retirement with the minimum retirement age raised from 61 to 63 years (at least 33 years of contribution, and an increase in the penalty rate; and
introducing a sustainability factor aimed at reassessing the parameters of the system every 5 years starting in 2027 to factor in any impact of higher life expectancy.
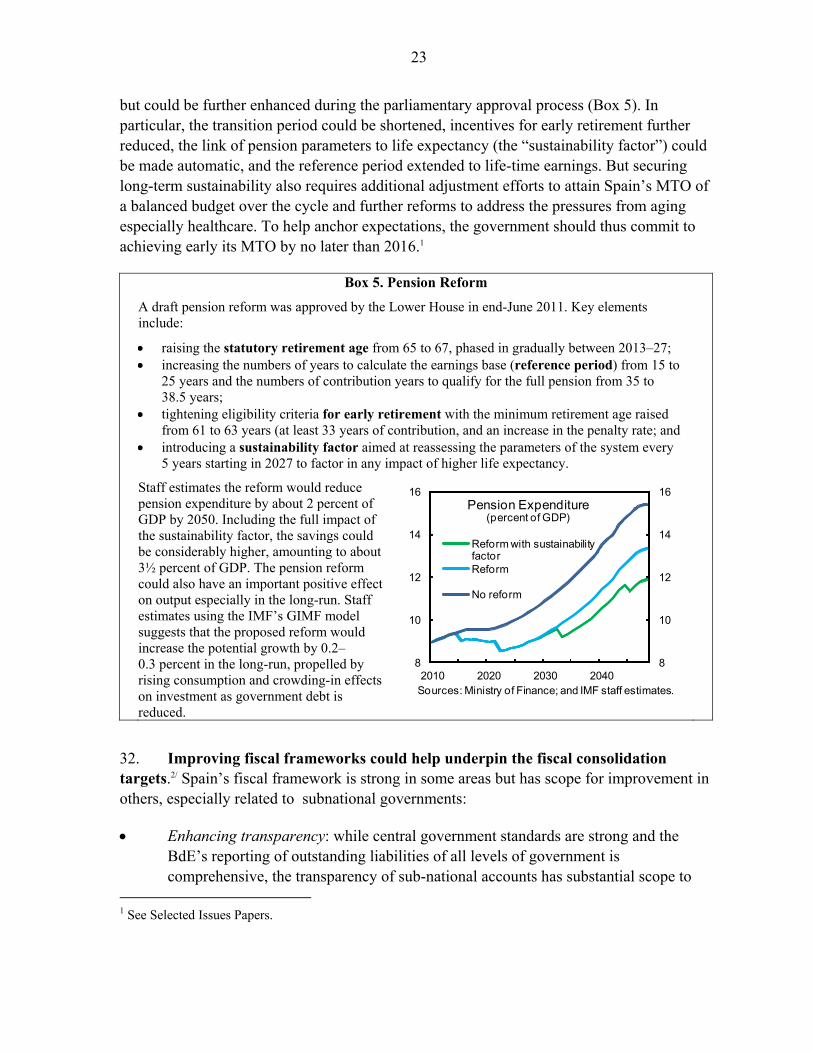
Staff estimates the reform would reduce pension expenditure by about 2 percent of GDP by 2050. Including the full impact of the sustainability factor, the savings could be considerably higher, amounting to about 3½ percent of GDP. The pension reform could also have an important positive effect on output especially in the long-run. Staff estimates using the IMF’s GIMF model suggests that the proposed reform would increase the potential growth by 0.2–0.3 percent in the long-run, propelled by rising consumption and crowding-in effects on investment as government debt is reduced.
32. Improving fiscal frameworks could help underpin the fiscal consolidation targets.2/ Spain’s fiscal framework is strong in some areas but has scope for improvement in others, especially related to subnational governments:
Enhancing transparency: while central government standards are strong and the BdE’s reporting of outstanding liabilities of all levels of government is comprehensive, the transparency of sub-national accounts has substantial scope to
1 See Selected Issues Papers.
8
10
12
14
16
8
10
12
14
16
2010 2020 2030 2040
Reform with sustainability factorReform
No reform
Pension Expenditure(percent of GDP)
Sources: Ministry of Finance; and IMF staff estimates.
24
improve. Specifically, sub-national accounts should be available at the same frequency and coverage as the central government, and quarterly reporting on a national accounts basis should be an immediate goal. The Fiscal and Financial Policy Council (CPFF) should also accelerate the timetable for approving regional fiscal adjustment plans and should start publishing them alongside the assessment of the Ministry of Finance.
Strengthening mechanisms to ensure subnational compliance with deficit targets. The current mechanism relies on “naming and shaming” and withholding debt authorizations from regions that miss agreed targets. These debt authorization restrictions should be strictly applied. Further enhancements to the system could also be considered, such as increasing the frequency of CPFF monitoring, widening the scope for cutting joint investment and discretionary expenditure transfer to regions, and securing voluntarily commitments specifying that regions missing their targets would implement certain concrete consolidation measures.
An independent fiscal council could help strengthen credibility by providing the macroeconomic parameters for the budget; estimating the cost of proposed legislation; and providing long-term fiscal projections including eventually for the social security sustainability adjustments.
Institutionalizing periodic public-sector-wide review of major spending programs, using existing mechanisms, to improve the quality and durability of the necessary multi-year adjustment, and benchmark best practices across subnational governments. This could also be complemented by integrating the general government budgetary process, the SGP Updates, and the three-year rebalancing plans into a fully-fledged medium-term budget framework. Enacting spending control mechanisms, including expenditure rules (as envisaged), at all levels of government would also complement the deficit rule.
Authorities’ views
33. The government emphasized its commitment to the deficit targets. They viewed staff’s macroeconomic scenario as pessimistic noting that their growth forecast projections for 2010 had proven more correct than staff’s. The government was confident that the debt authorization mechanism and rebalancing plans were sufficient to deliver the required consolidation at the regional level and that any possible overshooting by some regions would be limited in size and likely offset by over-performance in others. The government also stressed they stand ready and committed to taking additional actions required to meet the general government target, which was unconditional. They agreed the importance of aiming for the MTO beyond 2014 to ensure fiscal sustainability. The pension reform has already gone through Congress and is expected to be passed into law shortly.
25
34. While the government considered the existing fiscal frameworks to be sufficient to achieve their objectives, they saw some scope for improvement over the medium term. They agreed on the need for further subnational fiscal transparency, building on recent progress in this area, while stressing the importance of accountability of all governments to achieve the deficit objective. The government is also considering spending control mechanisms at all levels of government. The government did not view an independent fiscal council or a full-fledged medium-term budgeting framework as playing a major supporting role in Spain.
C. Labor: Bolder Reform Needed
35. Structural flaws in Spain’s labor market play a large role in explaining the heavy unemployment cost of the crisis. Unemployment soared to above 20 percent, despite an output loss broadly in line with the euro area, as most of the adjustment was pushed onto employment (Figure 11). Wage flexibility was hamstrung by the wage bargaining system, which includes inflation indexation, and the protection of permanent contracts (which can foster wage demands detrimental to employment). And wage agreements negotiated at the industry and province levels are automatically extended to the entire province and industry, without much scope to opt-out for individual firms or workers. Prior to the crisis, the bargaining system and high employment protection also significantly contributed to the large and persistent inflation differential of Spain with the euro area during the boom years and hence the deterioration in competitiveness.1
36. The labor market is being reformed in the right direction. The 2010 reform increased hiring incentives by easing dismissal costs and criteria, and by granting firms greater flexibility to opt out of collective agreements. In June 2011, collective bargaining was further reformed toward greater firm-level flexibility through: (1) establishing the prevalence of firm-level agreements, especially over provincial ones; (2) reducing the possibility of indefinite extension of previous agreements when social partners cannot agree on a new agreement; (3) further easing opt-outs of collective agreements; and (4) giving firms more internal flexibility. Most interlocutors including social partners, the International Labor Organization (ILO), and academics broadly agreed the labor market reforms to date were in the right direction. Nevertheless, as many of the interlocutors also underscored, the reforms were incomplete and remain a work in progress. For example, they did not directly address inflation indexation and leave open the possibility to make sectoral agreements prevail over firm-level agreements if social partners agree to do so. And the success of these reforms will depend on implementation by social partners and by the courts.
37. A bold strengthening of these reforms is needed to substantially reduce unemployment. The results to date do not provide sufficient confidence that the reforms will 1 See Selected Issues Paper.

26
quickly deliver an improvement in labor market dynamics that is as strong as the severity of the problem requires. Despite some positive effects from the 2010 reform (in terms of use of opt-outs and reduction of dismissal costs), unemployment is at very high levels and still increasing and the share of permanent contracts in total new hiring remains low. Spain’s unemployed need a decisive improvement in employment prospects, without which Spain could face persistently high unemployment and labor market duality, with the young especially affected by joblessness and revolving temporary contracts. A bolder reform would also help counter the headwinds from the deleveraging of the economy and prompt the reallocation of labor across sectors. Policy should thus err on the side of boldness rather than gradualism.
38. This calls for deepening and broadening the reforms to date. In particular:
Collective bargaining needs to be effectively decentralized to the firm level to allow wages to adjust to firm-specific conditions and foster employment and the reallocation of labor. The scope for firm-level flexibility offered by the June 2011 reform should be actively pursued by social partners and ideally should also be strengthened during the Parliamentary approval process. But if there are not clear and immediate signs the reform is delivering the necessary firm level flexibility, a more radical reform should be introduced.
Social partners should move away from inflation indexation, which is endemic compared with other countries. It is inconsistent with the functioning of a currency union and especially damaging during times of high unemployment, structural shocks, and cost-push inflation. Instead, reference could be made to guidelines based on productivity and regaining competitiveness with main trading partner countries. The elimination of indexation should be accompanied by stronger competition in the nontradable sector to keep price increases moderate.
Severance payments should be further lowered to at least EU average levels and should be better designed to make permanent hires more attractive. Despite the 2010 reform, severance payments remain high and still likely constitute a significant deterrent to the use of permanent contracts once employment growth strengthens.
These measures should be supported by broader reforms, including further improving the retraining of workers with mismatched skills, supporting youth employment, and ensuring that the incentives to return to work are sufficient. Recent improvements in active labor market policies, such as allowing private placement firms, should be especially useful in this regard.
Authorities’ views
39. The government argued that the labor market reforms have been strong. They acknowledged the relatively limited evidence so far that the 2010 reform is improving

27
employment prospects and reducing labor market duality. However, they expect the impact of the reform to strengthen over time as the recovery continues. The recent collective bargaining reform is seen as a major step forward that will greatly enhance the opportunities for firm-level flexibility. The government recognized that the success of the reform will very much depend on implementation by social partners. They also stressed inflation indexation is considered a prerogative of social partners and cannot be legislated against. The BdE also saw the need for a bold strengthening of reforms, though they also saw significant potential in the recent collective bargaining reform.
D. Other Structural Reforms for the New Growth Model
40. Achieving strong and sustainable growth requires, over the longer term, strong productivity gains. This was not achieved even during the boom period with GDP growth dependent on the extensive use of labor and, to a lesser extent, capital. The lack of productivity growth at the aggregate level is only partly due to a high weight of low-productivity sectors (like construction) in the economy. More than half of the productivity differential with the rest of the EU is not explained by the sectoral composition of the economy, and weak productivity growth is prevalent in almost all sectors (Figures 12 and 13).
41. This weak productivity growth has been attributed to a number of factors. These include:
policy and regulatory rigidities limiting competition and hindering the business environment (e.g. firm startup costs are particularly high),
low efficiency linked to the preponderance of SMEs that are unable to exploit fully economies of scale (e.g. similarly to Italy, only 24 percent of businesses have more than 250 employees versus 57 percent in Germany and 46 percent in France, and productivity is lower),
limited R&D and innovation (e.g. spending on R&D is well below the EU average and Spain has one the lowest number of patents per capita), and
an inefficient accumulation of human and technological capital (e.g. Spain has a high proportion of university graduates, but dropout rates are high, completion times are long and the return to education is low), worsened by the duality of the labor market (with low incentives for firms to invest in human capital) and barriers to mobility from the under-developed housing rental market. The loss in human capital is amplified the longer high unemployment persists, in particular for the young.
42. Spain has taken productivity-enhancing measures but more needs to be done. Positive steps have been taken over the past year, such as the ongoing implementation of the Services Directive, measures to lower start up costs of firms, and the removal of the
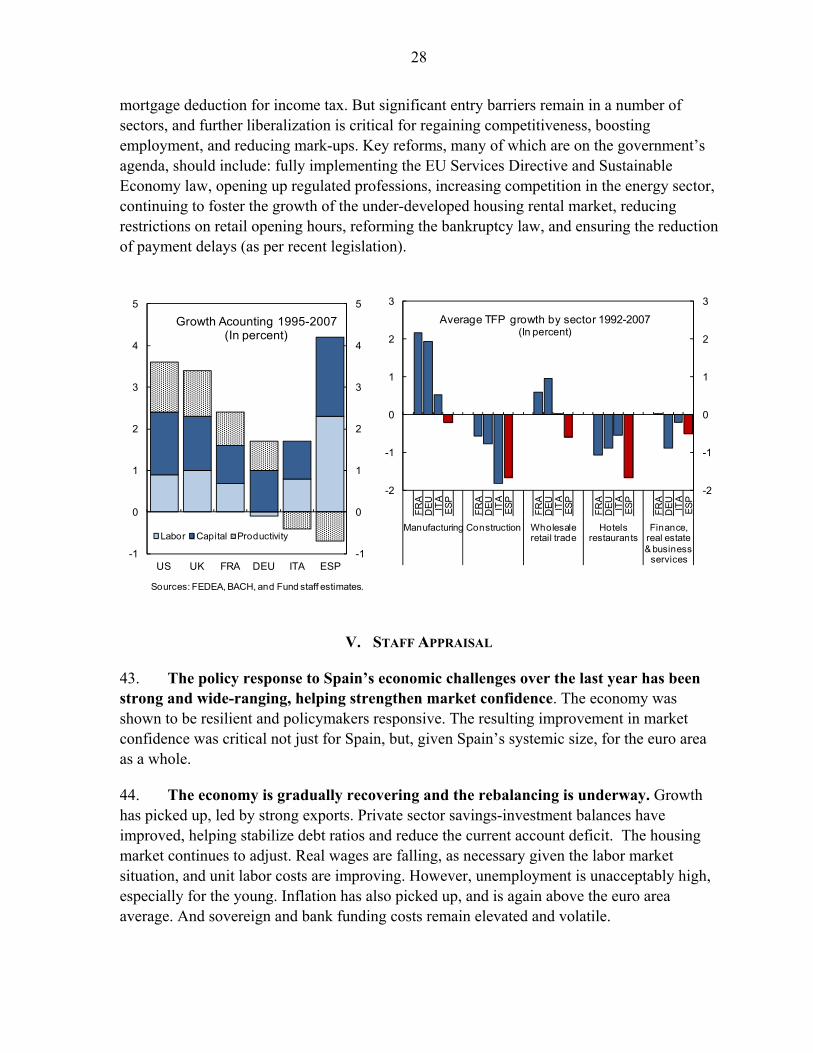
28
mortgage deduction for income tax. But significant entry barriers remain in a number of sectors, and further liberalization is critical for regaining competitiveness, boosting employment, and reducing mark-ups. Key reforms, many of which are on the government’s agenda, should include: fully implementing the EU Services Directive and Sustainable Economy law, opening up regulated professions, increasing competition in the energy sector, continuing to foster the growth of the under-developed housing rental market, reducing restrictions on retail opening hours, reforming the bankruptcy law, and ensuring the reduction of payment delays (as per recent legislation).
V. STAFF APPRAISAL
43. The policy response to Spain’s economic challenges over the last year has been strong and wide-ranging, helping strengthen market confidence. The economy was shown to be resilient and policymakers responsive. The resulting improvement in market confidence was critical not just for Spain, but, given Spain’s systemic size, for the euro area as a whole.
44. The economy is gradually recovering and the rebalancing is underway. Growth has picked up, led by strong exports. Private sector savings-investment balances have improved, helping stabilize debt ratios and reduce the current account deficit. The housing market continues to adjust. Real wages are falling, as necessary given the labor market situation, and unit labor costs are improving. However, unemployment is unacceptably high, especially for the young. Inflation has also picked up, and is again above the euro area average. And sovereign and bank funding costs remain elevated and volatile.
-1
0
1
2
3
4
5
-1
0
1
2
3
4
5
US UK FRA DEU ITA ESP
Growth Acounting 1995-2007(In percent)
Labor Capital Productivity
-2
-1
0
1
2
3
-2
-1
0
1
2
3
FR
AD
EU
ITA
ES
P
FR
AD
EU
ITA
ES
P
FR
AD
EU
ITA
ES
P
FR
AD
EU
ITA
ES
P
FR
AD
EU
ITA
ES
P
Manufacturing Construction Wholesale retail trade
Hotels restaurants
Finance, real estate & business
services
Average TFP growth by sector 1992-2007(In percent)
Sources: FEDEA, BACH, and Fund staff estimates.
29
45. The recovery is likely to be modest and export-led over the medium term. Export growth is projected to remain strong, in line with partner country demand, while domestic demand is expected to improve gradually. Unemployment is projected to fall only moderately in the medium term and to remain well above the euro area average. Inflation is forecast to decline to around two percent as transitory factors fade. And while house prices likely have further to adjust, the drag on output from the residential property sector should cease.
46. Downside risks dominate. On the upside, exports could continue to grow at their recent rapid pace, despite likely softer European growth, and the impact of recent reforms could prove stronger than expected. On the downside, the key medium term risk is an intensification of domestic headwinds, and in the near term, rising concerns about sovereign risks in the euro area.
47. The policy agenda remains challenging and urgent – there can be no let up in the reform momentum. Unwinding accumulated imbalances and reallocating resources across sectors will take years and many difficult policy choices. Combined with the risks to the outlook, this means that the reforms to date need to be strengthened. Such a comprehensive strategy would be helped by broad political and social support.
48. A decisive implementation of the envisaged financial sector reform strategy would help allay lingering market concerns. Banks that need to raise capital should do so promptly from the market. Those that have no prospect of covering their shortfalls from the market should be rapidly restructured or quickly resolved. As envisaged, FROB support should be seen as a last resort, provided at market terms and strictly temporary. In light of the uncertain operating environment and comparing with other jurisdictions, staff sees merit in further building capital, liquidity and provisioning buffers in the system over time. Building on recent improvements in transparency would help market participants to form a sounder view of the actual situation of the Spanish banking sector. Further improvements in corporate governance would provide an additional impulse to the ongoing transformation of the savings bank sector.
49. Ambitious fiscal consolidation is underway. If near-term risks to the outlook materialize, some additional measures may be necessary. But the larger risk to the 2011 target is that some regional governments may again miss their targets. This needs to be avoided: the general government fiscal target should remain the overarching objective, hence, all levels of government should deliver on their commitments.
50. Achieving the medium-term fiscal targets will likely require further action. First, the targets are based on strong spending restraint. Second, under staff’s less optimistic macroeconomic projections, additional fiscal measures of about two percent of GDP will be required through 2014, which also argues for building strong buffers in the 2012, and future, budgets. Third, to ensure the debt ratio is on a firmly declining path by 2014 and to anchor

30
longer-term expectations, the government should commit to an early date to achieve the MTO of a balanced budget and should pro-actively manage below-the-line operations (such as privatization). The draft pension reform should also be quickly passed and implemented, and ideally strengthened in some areas.
51. Improving fiscal frameworks would help underpin the consolidation targets. In the short term, the focus should be on sub-national finances. In particular, by improving the transparency of subnational accounts and by strictly applying existing policy levers to ensure subnational government compliance with deficit targets. In the medium term: institutionalizing a nationwide comprehensive review of major spending programs could help identify high-quality expenditure savings; an independent fiscal council could bolster fiscal credibility; and spending control mechanisms, including spending rules, could be usefully implemented at all levels of government.
52. A bold strengthening of labor market reforms is needed to substantially reduce unacceptably high unemployment. The labor market is being reformed in the right direction. But the results to date do not provide sufficient confidence that the reforms will quickly deliver an improvement in labor market dynamics that is as strong as the severity of the problem requires. This calls for deepening and broadening the reforms so far. In particular: collective bargaining needs to be effectively decentralized to the firm level; social partners should move away from inflation indexation; and severance payments should be further lowered to at least EU average levels. These measures should be supported by broader reforms, such as retraining.
53. Further progress needs to be made on enhancing competition in nontradable sectors. Key reforms, many of which are on the government’s agenda, should include: fully implementing the Services Directive and Sustainable Economy law, opening up regulated professions, greater competition in the energy sector, continuing to foster the growth of the under-developed housing rental market, reducing restrictions on retail opening hours, reforming the bankruptcy law, and ensuring the reduction of payment delays (as per recent legislation).
54. It is proposed to hold the next Article IV consultation on the regular 12-month cycle.

31
Figure 1. Spain: Comparative Indicators
Source: WEO; OECD; Bloomberg; Bank of Spain; ECB; and IMF staff estimates.
0
200
400
600
800
1000
1200
1400
1600
1/2/2008 1/2/2009 1/2/2010 1/2/2011
GreeceIrelandPortugalSpainItalyFrance
10 Year Spreads over German Bunds
(basis points)
0
1
2
3
4
5
6
7
8
9
0
1
2
3
4
5
6
7
8
9
2006 2007 2008 2009 2010
Gross ECB Borrowing(in percent of MFI total assets)
SpainIrelandGermany (RHS)Euro areaPortugal
EA
FRA
DEU
GRCIRL
ITA
PRT
ESP
-12
-10
-8
-6
-4
-2
0
2
40 60 80 100 120 140 160
Structural Balance and Public Debt 2010
Public Debt
Str
uct
ura
l B
ala
nce
(Percent of GDP)
EA
FRA
DEU
GRC
IRL
ITA
PRT
ESP
-12
-8
-4
0
4
8
-150 -100 -50 0 50
Current Account Balance and Net IIP(percent of GDP)
Net IIP (2009)
Cur
ren
tAcc
ount
Bal
ance
(201
0)
FRA
DEU
GRC
IRL
ITA
PRT
ESP
1.0
1.5
2.0
2.5
3.0
3.5
0.5 1.0 1.5 2.0 2.5
Product Market and Labor Market 2008
Str
ictn
ess
of E
mp
loym
ent P
rote
ctio
n
Produce Market Regulation Index
) Stricter FRA
DEU
GRC IRL
ITA
PRT
ESP0.0
0.5
1.0
1.5
2.0
2.5
3.0
3.5
0 2 4 6 8
Real GDP and Labor Productivity GrowthAverage 1995-2007 (Percent)
La
bo
r Pro
du
ctiv
ityG
row
th
Real GDP Growth
)
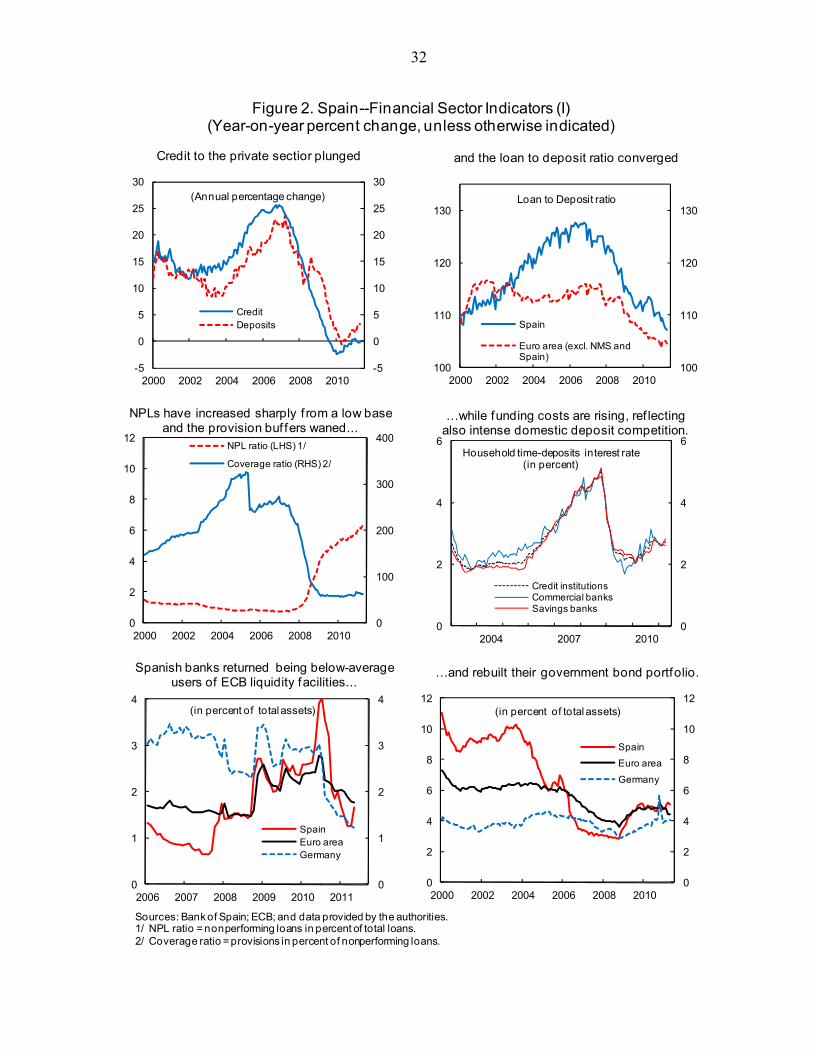
32
Figure 2. Spain--Financial Sector Indicators (I)(Year-on-year percent change, unless otherwise indicated)
Sources: Bank of Spain; ECB; and data provided by the authorities.1/ NPL ratio = nonperforming loans in percent of total loans.2/ Coverage ratio = provisions in percent of nonperforming loans.
-5
0
5
10
15
20
25
30
-5
0
5
10
15
20
25
30
2000 2002 2004 2006 2008 2010
CreditDeposits
(Annual percentage change)
100
110
120
130
100
110
120
130
2000 2002 2004 2006 2008 2010
Loan to Deposit ratio
Spain
Euro area (excl. NMS and Spain)
0
100
200
300
400
0
2
4
6
8
10
12
2000 2002 2004 2006 2008 2010
NPL ratio (LHS) 1/
Coverage ratio (RHS) 2/
0
2
4
6
0
2
4
6
2004 2007 2010
Credit institutionsCommercial banksSavings banks
Household time-deposits interest rate(in percent)
0
1
2
3
4
0
1
2
3
4
2006 2007 2008 2009 2010 2011
(in percent of total assets)
SpainEuro areaGermany
0
2
4
6
8
10
12
0
2
4
6
8
10
12
2000 2002 2004 2006 2008 2010
Spain
Euro area
Germany
(in percent of total assets)
Credit to the private sectior plunged and the loan to deposit ratio converged
NPLs have increased sharply f rom a low base and the provision buf fers waned...
…while funding costs are rising, ref lecting also intense domestic deposit competition.
Spanish banks returned being below-average users of ECB liquidity facilities...
…and rebuilt their government bond portfolio.

33
Figure 3. Spain: Financial Sector Indicators (II)
Sources: Bank of Spain; Bloomberg; J.P. Morgan; Moody's; and IMF staff estimates.1/ Includes Unicredit, Intesa-San Paolo, Commerzbank, Deutsche Bank, BNP, Société Générale, ING, HSBC, Barclays, UBS, and Credit Suisse. 2/ Includes Banco Popular, Bankinter, Banco Sabadell, and Banco Pastor.3/ Includes La Caixa, Caja Madrid, Caja del Mediterraneo, Unicaja, and BBK.
-20
0
20
40
60
80
-20
0
20
40
60
80
Jan-09 Jul-09 Jan-10 Jul-10 Jan-11 Jul-11
Spread Interbank - OIS(basis points; f iltered)
0
50
100
150
200
250
300
350
0
50
100
150
200
250
300
350
Jan-09 Jul-09 Jan-10 Jul-10 Jan-11
SantanderBBVASpainPeers 1/
EUR 5 Year Senior (basis points; f iltered)
0
200
400
600
800
1000
1200
0
200
400
600
800
1000
1200
Jan-09 Jul-09 Jan-10 Jul-10 Jan-11
EUR 5 Year Senior (basis points; f iltered)
La Caixa
Bancaja
Caja Madrid
0
50
100
150
200
250
300
350
0
50
100
150
200
250
300
350
Jan-10 Apr-10 Jul-10 Oct-10 Jan-11 Apr-11
Asset swap spreads(basis points; f iltered)
iBoxxSantanderBBVAOther commercial banks 2/Savings banks 3/
0
20
40
60
80
100
120
140
0
20
40
60
80
100
120
140
Jan-09 Apr-09 Jul-09 Oct-09 Jan-10 Apr-10 Jul-10 Oct-10 Jan-11 Apr-11
(Index, 1/1/10=100; f iltered)
Ibex Santander
BBVA Peers 1/
Other commercial banks 2/
Although improving, liquidity conditions have remained volatile ..
... Santander and BBVA CDS spreads have diverged f rom those of peers ....
... the cost of insurance for some cajas has remained elevated ..
... spreads have widened especially for domestically-oriented banks ...
...stock prices have lost ground returning to levels of a year ago.

34
Figure 4. Spain: National Accounts
Sources: WEO; Bank of Spain; Eurostat; and IMF staff calculations.
-8
-6
-4
-2
0
2
4
6
2004Q1 2006Q1 2008Q1 2010Q1 2012Q1
Spain
Euro area
Germany
France
Real GDP (Annual percent change)
projections
Output fell but also recovered less than the euro area average...
...and the output gap is improving.
Domestic demand remains weak... ...while exports rebounded more than imports.
The contribution of net exports became strongly positive, providing some offset.
While industry has stabilized, construction is still contracting.
-6
-4
-2
0
2
4
6
1995 1997 1999 2001 2003 2005 2007 2009 2011
Spain
Euro area
Germany
France
Output Gap(Percent of potential output)
-20
-15
-10
-5
0
5
10
15
2000 2002 2004 2006 2008 2010 2012
Public consumption
Private consumption
Fixed investment
(Year-on-year percent change)
proj.-30
-20
-10
0
10
20
2000 2002 2004 2006 2008 2010 2012
Exports
Imports
proj.
(Year-on-year percent change)
-10
-5
0
5
10
2005 2006 2007 2008 2009 2010 2011 2012
Net foreign demand Gross investmentPublic consumption Private consumptionGDP growth
Contributions to GDP Growth (Percentage points)
projections
-6
-3
0
3
6
2000 2002 2004 2006 2008 2010
Agriculture Trade, Transport
Construction Industry
Fin Intermediation and Real Estate GDP growth
Contributions to GDP Growth (Percentage points)

35
Figure 5. Spain: High Frequency Indicators(Year-on-year percent change, unless otherwise indicated)
Sources: Eurostat; and MF staff calculations based on data provided by the authorities.
-30
-25
-20
-15
-10
-5
0
5
10
15
2001 2003 2005 2007 2009 2011
Industrial production
Retail trade
20
30
40
50
60
70
2001 2003 2005 2007 2009 2011
(Index, 50=neutral)
PMI Manufacturing
PMI Services
The recovery in industrial production and retail trade has stalled.
PMI's point to stabilization......
...and so does the synthetic indicator of economic activity.
The rebound in consumer confidence is lagging
with low conf idence in services... ...and a renewed decline in construction.
-6
-4
-2
0
2
4
6
2001 2003 2005 2007 2009 2011
Synthetic Indicator Economic Activity
Real GDP growth
-60
-45
-30
-15
0
15
30
2000 2002 2004 2006 2008 2010
Service Sector Conf idence(Percent Balance, seasonally
adjusted)
Spain
EU-15
-60
-45
-30
-15
0
15
30
45
2000 2002 2004 2006 2008 2010
Construction Sector Conf idence(Percent Balance, seasonally
adjusted)
Spain
EU-15
-40
-30
-20
-10
0
10
20
30
2000 2002 2004 2006 2008 2010
Consumer Conf idence(Percent Balance, seasonally
adjusted)
Spain
EU-15
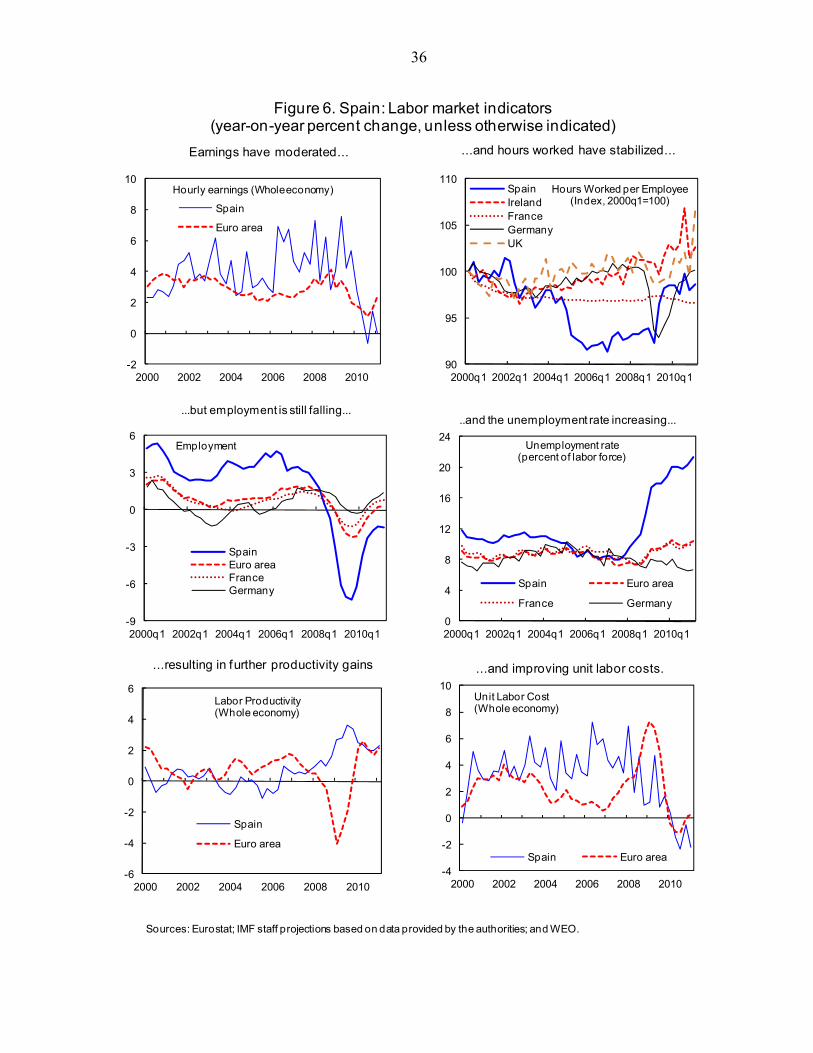
36
Figure 6. Spain: Labor market indicators(year-on-year percent change, unless otherwise indicated)
Sources: Eurostat; IMF staff projections based on data provided by the authorities; and WEO.
-2
0
2
4
6
8
10
2000 2002 2004 2006 2008 2010
Hourly earnings (Whole economy)
Spain
Euro area
Earnings have moderated... ...and hours worked have stabilized...
...but employment is still falling.....and the unemployment rate increasing...
...resulting in further productivity gains ...and improving unit labor costs.
-4
-2
0
2
4
6
8
10
2000 2002 2004 2006 2008 2010
Unit Labor Cost(Whole economy)
Spain Euro area
-6
-4
-2
0
2
4
6
2000 2002 2004 2006 2008 2010
Labor Productivity(Whole economy)
Spain
Euro area
90
95
100
105
110
2000q1 2002q1 2004q1 2006q1 2008q1 2010q1
Hours Worked per Employee(Index, 2000q1=100)
SpainIrelandFranceGermanyUK
-9
-6
-3
0
3
6
2000q1 2002q1 2004q1 2006q1 2008q1 2010q1
Employment
SpainEuro areaFranceGermany
0
4
8
12
16
20
24
2000q1 2002q1 2004q1 2006q1 2008q1 2010q1
Unemployment rate(percent of labor force)
Spain Euro area
France Germany
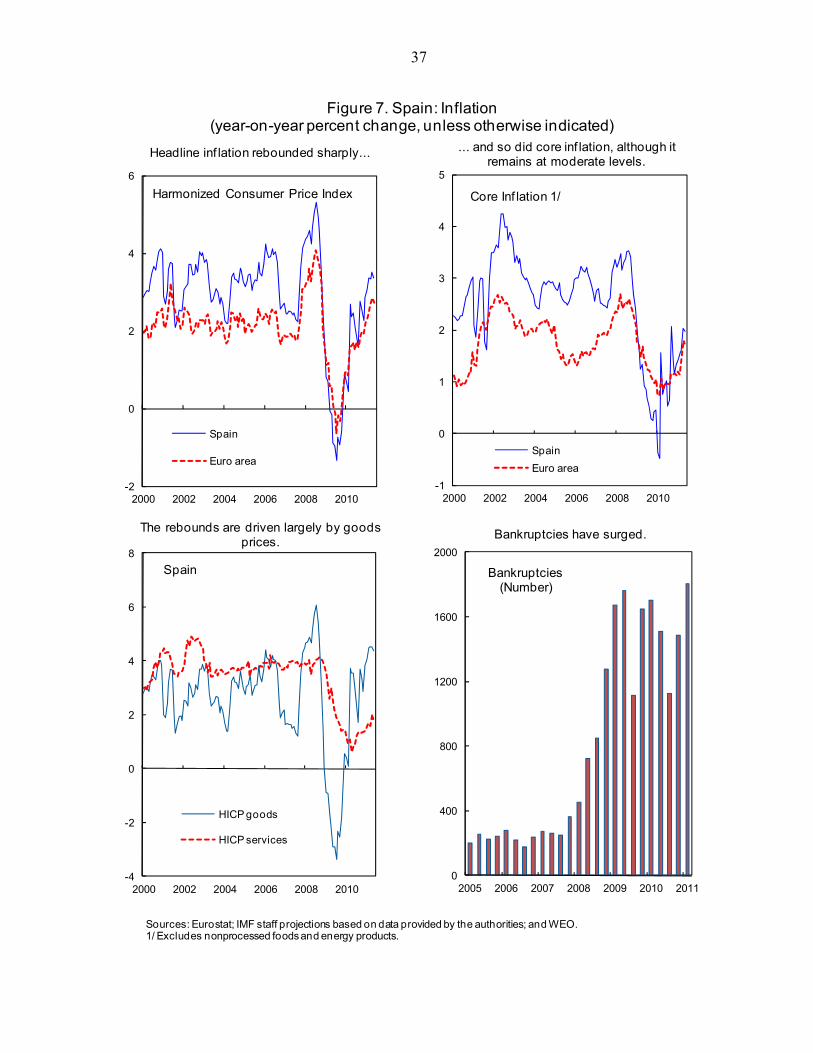
37
Figure 7. Spain: Inflation(year-on-year percent change, unless otherwise indicated)
Sources: Eurostat; IMF staff projections based on data provided by the authorities; and WEO.1/ Excludes nonprocessed foods and energy products.
Headline inf lation rebounded sharply... ... and so did core inf lation, although it remains at moderate levels.
The rebounds are driven largely by goods prices.
Bankruptcies have surged.
0
400
800
1200
1600
2000
2005 2006 2007 2008 2009 2010 2011
Bankruptcies(Number)
-2
0
2
4
6
2000 2002 2004 2006 2008 2010
Harmonized Consumer Price Index
Spain
Euro area
-1
0
1
2
3
4
5
2000 2002 2004 2006 2008 2010
Core Inf lation 1/
Spain
Euro area
-4
-2
0
2
4
6
8
2000 2002 2004 2006 2008 2010
Spain
HICP goods
HICP services
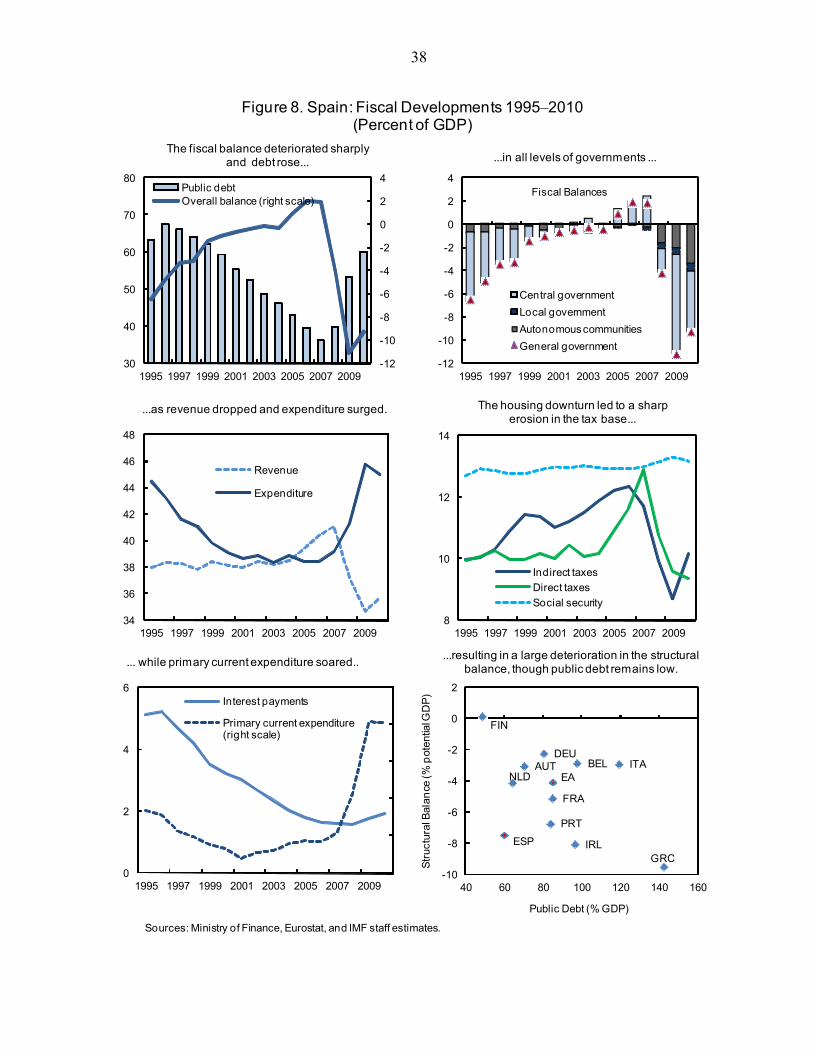
38
Figure 8. Spain: Fiscal Developments 1995‒2010(Percent of GDP)
Sources: Ministry of Finance, Eurostat, and IMF staff estimates.
-12
-10
-8
-6
-4
-2
0
2
4
30
40
50
60
70
80
1995 1997 1999 2001 2003 2005 2007 2009
Public debtOverall balance (right scale)
The fiscal balance deteriorated sharply and debt rose... ...in all levels of governments ...
...as revenue dropped and expenditure surged. The housing downturn led to a sharp erosion in the tax base...
... while primary current expenditure soared.....resulting in a large deterioration in the structural
balance, though public debt remains low.
0
2
4
6
1995 1997 1999 2001 2003 2005 2007 2009
Interest payments
Primary current expenditure (right scale)
-12
-10
-8
-6
-4
-2
0
2
4
1995 1997 1999 2001 2003 2005 2007 2009
Fiscal Balances
Central government
Local government
Autonomous communities
General government
34
36
38
40
42
44
46
48
1995 1997 1999 2001 2003 2005 2007 2009
Revenue
Expenditure
8
10
12
14
1995 1997 1999 2001 2003 2005 2007 2009
Indirect taxes
Direct taxes
Social security
EAAUT BEL
FIN
FRA
DEU
GRCIRL
ITANLD
PRT
ESP
-10
-8
-6
-4
-2
0
2
40 60 80 100 120 140 160
Public Debt (% GDP)
Str
uctu
ral B
alan
ce (%
pot
entia
l GD
P)
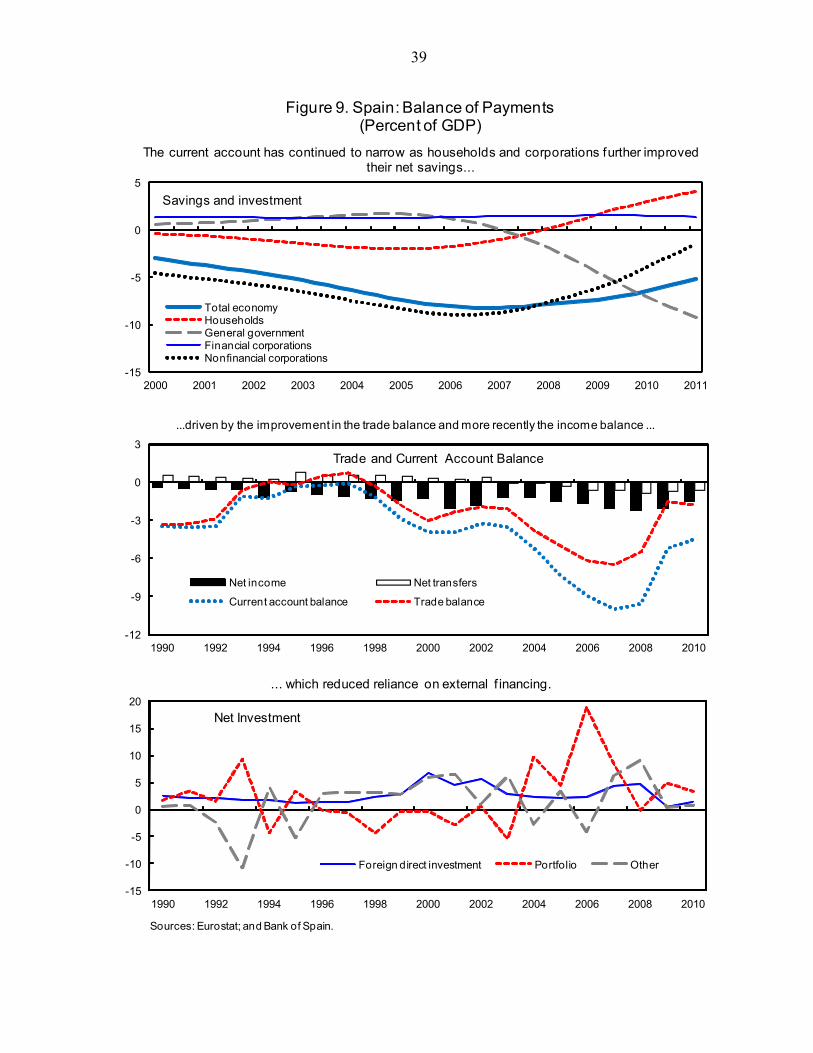
39
Figure 9. Spain: Balance of Payments (Percent of GDP)
Sources: Eurostat; and Bank of Spain.
The current account has continued to narrow as households and corporations further improved their net savings...
...driven by the improvement in the trade balance and more recently the income balance ...
... which reduced reliance on external f inancing.
-12
-9
-6
-3
0
3
1990 1992 1994 1996 1998 2000 2002 2004 2006 2008 2010
Trade and Current Account Balance
Net income Net transfers
Current account balance Trade balance
-15
-10
-5
0
5
10
15
20
1990 1992 1994 1996 1998 2000 2002 2004 2006 2008 2010
Net Investment
Foreign direct investment Portfolio Other
-15
-10
-5
0
5
2000 2001 2002 2003 2004 2005 2006 2007 2008 2009 2010 2011
Savings and investment
Total economyHouseholdsGeneral governmentFinancial corporationsNonfinancial corporations
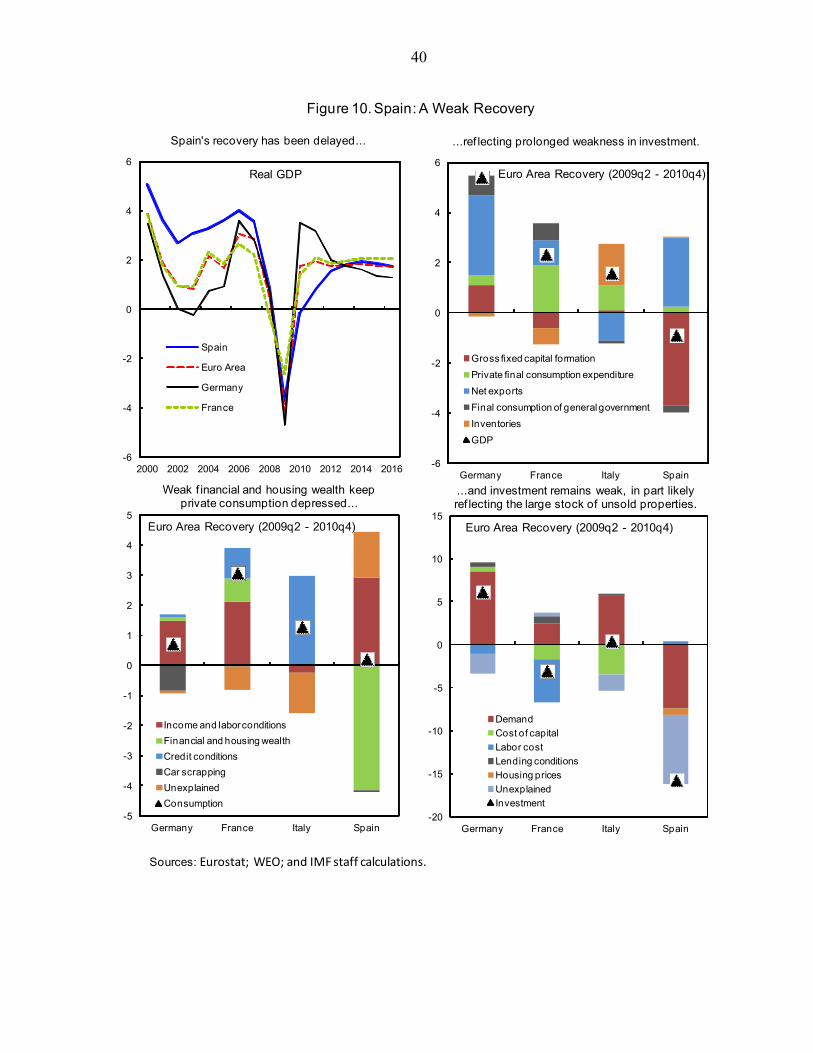
40
Figure 10. Spain: A Weak Recovery
Sources: Eurostat; WEO; and IMF staff calculations.
-6
-4
-2
0
2
4
6
2000 2002 2004 2006 2008 2010 2012 2014 2016
Real GDP
Spain
Euro Area
Germany
France
-5
-4
-3
-2
-1
0
1
2
3
4
5
Germany France Italy Spain
Euro Area Recovery (2009q2 - 2010q4)
Income and labor conditions
Financial and housing wealth
Credit conditions
Car scrapping
Unexplained
Consumption
Spain's recovery has been delayed... ...ref lecting prolonged weakness in investment.
Weak f inancial and housing wealth keep private consumption depressed...
...and investment remains weak, in part likelyref lecting the large stock of unsold properties.
-20
-15
-10
-5
0
5
10
15
Germany France Italy Spain
Euro Area Recovery (2009q2 - 2010q4)
Demand
Cost of capital
Labor cost
Lending conditions
Housing prices
Unexplained
Investment
-6
-4
-2
0
2
4
6
Germany France Italy Spain
Euro Area Recovery (2009q2 - 2010q4)
Gross fixed capital formation
Private final consumption expenditure
Net exports
Final consumption of general government
Inventories
GDP
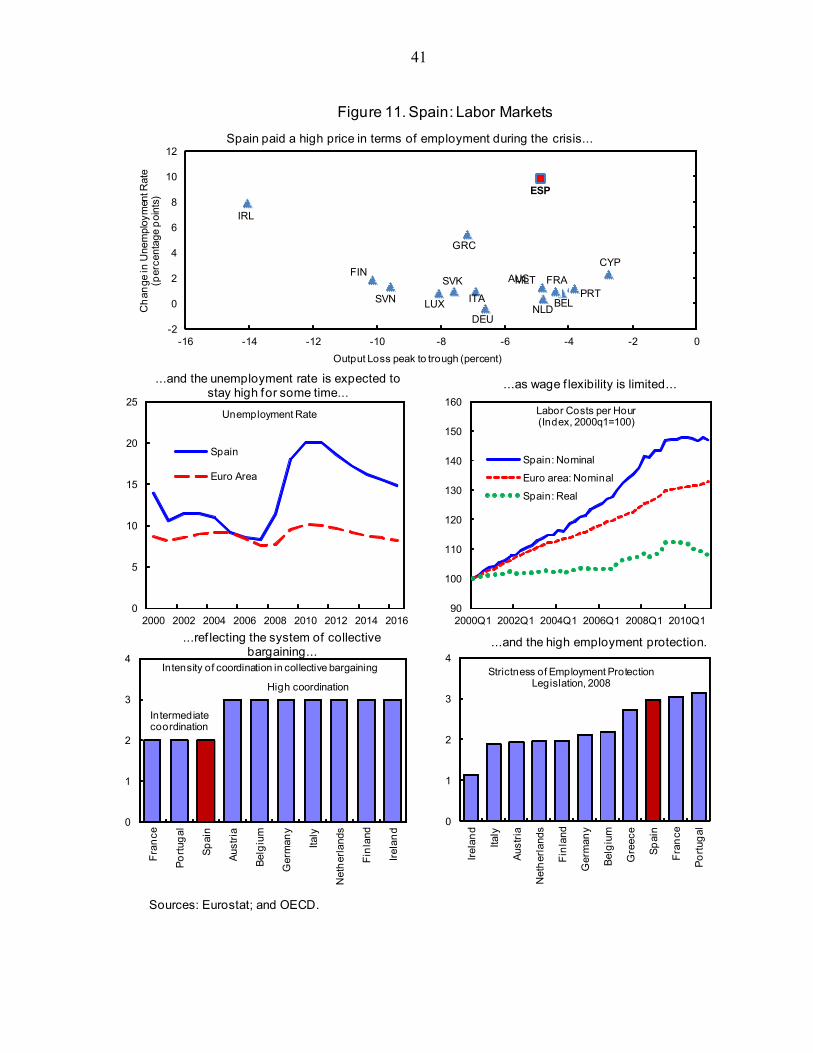
41
Sources: Eurostat; and OECD.
AUS
BEL
CYPFIN
FRA
DEU
GRC
IRL
ITALUX
MLT
NLD
PRTSVK
SVN
ESP
-2
0
2
4
6
8
10
12
-16 -14 -12 -10 -8 -6 -4 -2 0
Ch
ange
in U
nem
ploy
men
t Rat
e (p
erce
ntag
e p
oint
s)
Output Loss peak to trough (percent)
0
5
10
15
20
25
2000 2002 2004 2006 2008 2010 2012 2014 2016
Unemployment Rate
Spain
Euro Area
90
100
110
120
130
140
150
160
2000Q1 2002Q1 2004Q1 2006Q1 2008Q1 2010Q1
Labor Costs per Hour(Index, 2000q1=100)
Spain: Nominal
Euro area: Nominal
Spain: Real
0
1
2
3
4
Fra
nce
Po
rtug
al
Sp
ain
Aus
tria
Bel
giu
m
Ger
man
y
Italy
Net
her
land
s
Fin
land
Irel
and
Intensity of coordination in collective bargaining
Intermediate coordination
High coordination
0
1
2
3
4
Irel
and
Italy
Aus
tria
Net
her
land
s
Fin
land
Ger
man
y
Bel
giu
m
Gre
ece
Sp
ain
Fra
nce
Po
rtug
al
Strictness of Employment Protection Legislation, 2008
Spain paid a high price in terms of employment during the crisis...
...and the unemployment rate is expected to stay high for some time...
...as wage f lexibility is limited...
...ref lecting the system of collective bargaining...
...and the high employment protection.
Figure 11. Spain: Labor Markets
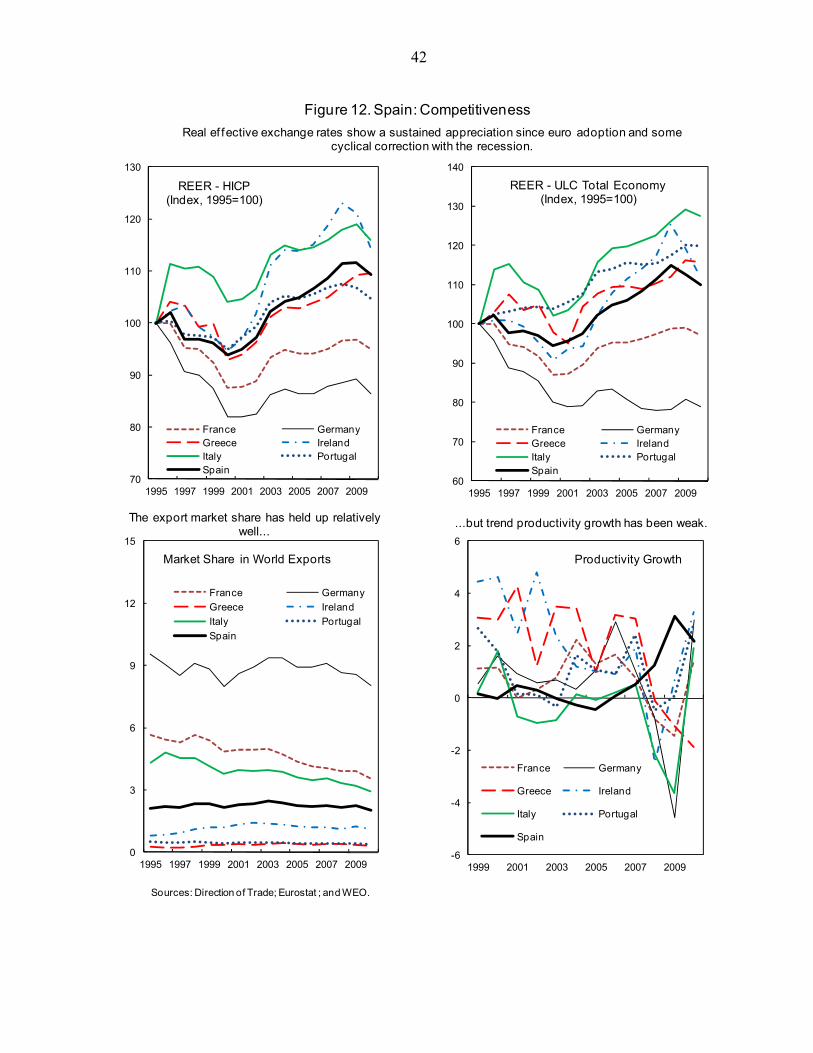
42
Figure 12. Spain: Competitiveness
Sources: Direction of Trade; Eurostat ; and WEO.
70
80
90
100
110
120
130
1995 1997 1999 2001 2003 2005 2007 2009
REER - HICP(Index, 1995=100)
France GermanyGreece IrelandItaly PortugalSpain
60
70
80
90
100
110
120
130
140
1995 1997 1999 2001 2003 2005 2007 2009
REER - ULC Total Economy(Index, 1995=100)
France GermanyGreece IrelandItaly PortugalSpain
Real ef fective exchange rates show a sustained appreciation since euro adoption and some cyclical correction with the recession.
The export market share has held up relatively well...
...but trend productivity growth has been weak.
0
3
6
9
12
15
1995 1997 1999 2001 2003 2005 2007 2009
Market Share in World Exports
France Germany
Greece Ireland
Italy Portugal
Spain
-6
-4
-2
0
2
4
6
1999 2001 2003 2005 2007 2009
Productivity Growth
France Germany
Greece Ireland
Italy Portugal
Spain

43
Figure 13. Spain: Product Market Reform
Source: OECD.
AUS
AUT
BELCAN
CZE
DNKFIN
FRADEU
HUN
ISL
ITA
JPN KOR
LUX
MEX
NLD
NZL
NOR
POL
PRT
ESP
SWE
CHE
TUR
GBR
USA
-0.8
-0.6
-0.4
-0.2
0.0
0.2
0.0 1.0 2.0 3.0
Ch
ange
200
3-20
08 in
OE
CD
PM
R
Level 2003 of OECD PMR
0
1
2
3
4
5
6
7
PM
R
Ad
min
Bur
den
Ret
ail
Pro
fess
ion
Air
lines
Tel
eco
m
Ele
cric
ity
Gas
Po
st
Rai
l
Ro
ad
Product market regulation
SpainOECD averageMaxMin
Airlines
Telecom
Elecricity
Gas Post
RailRoad Retail
Prof. services
-1.0
-0.8
-0.6
-0.4
-0.2
0.0
0.2
0.0 1.0 2.0 3.0 4.0 5.0 6.0
Ch
ange
200
3-20
07 in
regu
latio
n
Level 2003 of regulation
Spain
Administrative burdens remain heavy while regulation is still high in rail, post, retail, and professional services.
...especially in railways , road, and retail.Spain has made much progress ...
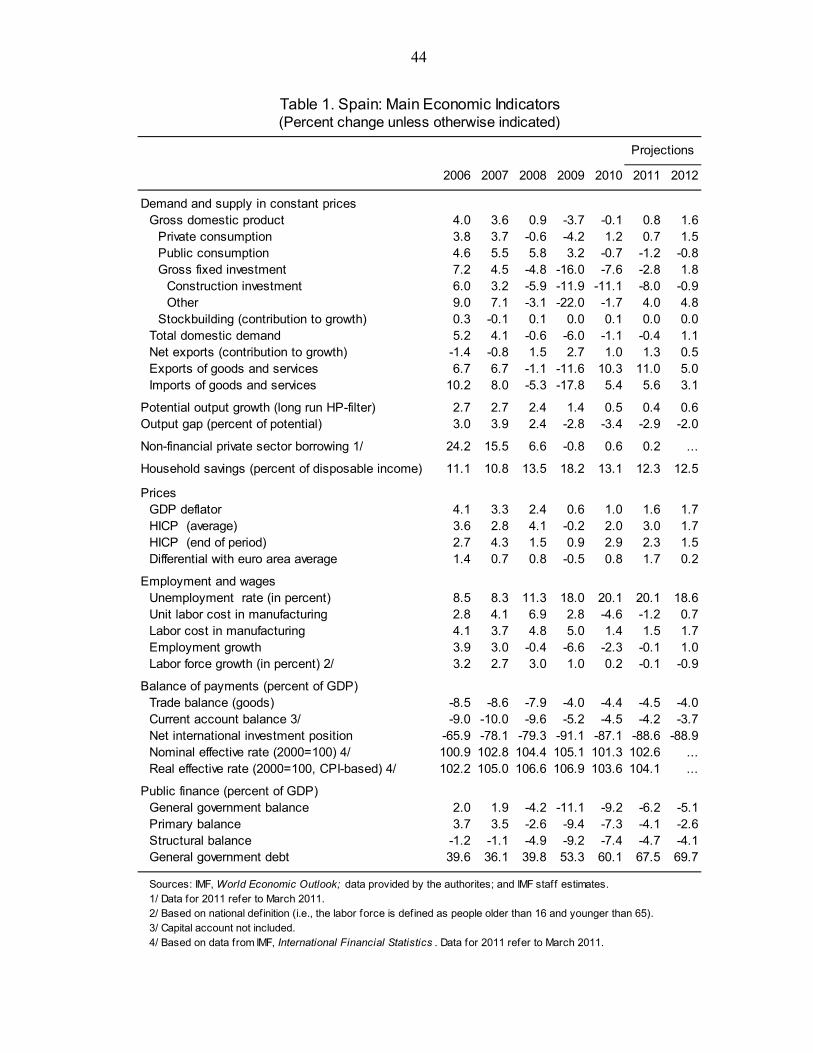
44
Table 1. Spain: Main Economic Indicators(Percent change unless otherwise indicated)
Projections
2006 2007 2008 2009 2010 2011 2012
Demand and supply in constant pricesGross domestic product 4.0 3.6 0.9 -3.7 -0.1 0.8 1.6
Private consumption 3.8 3.7 -0.6 -4.2 1.2 0.7 1.5Public consumption 4.6 5.5 5.8 3.2 -0.7 -1.2 -0.8Gross fixed investment 7.2 4.5 -4.8 -16.0 -7.6 -2.8 1.8
Construction investment 6.0 3.2 -5.9 -11.9 -11.1 -8.0 -0.9Other 9.0 7.1 -3.1 -22.0 -1.7 4.0 4.8
Stockbuilding (contribution to growth) 0.3 -0.1 0.1 0.0 0.1 0.0 0.0Total domestic demand 5.2 4.1 -0.6 -6.0 -1.1 -0.4 1.1Net exports (contribution to growth) -1.4 -0.8 1.5 2.7 1.0 1.3 0.5Exports of goods and services 6.7 6.7 -1.1 -11.6 10.3 11.0 5.0Imports of goods and services 10.2 8.0 -5.3 -17.8 5.4 5.6 3.1
Potential output growth (long run HP-filter) 2.7 2.7 2.4 1.4 0.5 0.4 0.6Output gap (percent of potential) 3.0 3.9 2.4 -2.8 -3.4 -2.9 -2.0
Non-financial private sector borrowing 1/ 24.2 15.5 6.6 -0.8 0.6 0.2 ...
Household savings (percent of disposable income) 11.1 10.8 13.5 18.2 13.1 12.3 12.5
PricesGDP deflator 4.1 3.3 2.4 0.6 1.0 1.6 1.7HICP (average) 3.6 2.8 4.1 -0.2 2.0 3.0 1.7HICP (end of period) 2.7 4.3 1.5 0.9 2.9 2.3 1.5Differential with euro area average 1.4 0.7 0.8 -0.5 0.8 1.7 0.2
Employment and wagesUnemployment rate (in percent) 8.5 8.3 11.3 18.0 20.1 20.1 18.6Unit labor cost in manufacturing 2.8 4.1 6.9 2.8 -4.6 -1.2 0.7Labor cost in manufacturing 4.1 3.7 4.8 5.0 1.4 1.5 1.7Employment growth 3.9 3.0 -0.4 -6.6 -2.3 -0.1 1.0Labor force growth (in percent) 2/ 3.2 2.7 3.0 1.0 0.2 -0.1 -0.9
Balance of payments (percent of GDP)Trade balance (goods) -8.5 -8.6 -7.9 -4.0 -4.4 -4.5 -4.0Current account balance 3/ -9.0 -10.0 -9.6 -5.2 -4.5 -4.2 -3.7Net international investment position -65.9 -78.1 -79.3 -91.1 -87.1 -88.6 -88.9Nominal effective rate (2000=100) 4/ 100.9 102.8 104.4 105.1 101.3 102.6 ...Real effective rate (2000=100, CPI-based) 4/ 102.2 105.0 106.6 106.9 103.6 104.1 ...
Public finance (percent of GDP)General government balance 2.0 1.9 -4.2 -11.1 -9.2 -6.2 -5.1Primary balance 3.7 3.5 -2.6 -9.4 -7.3 -4.1 -2.6Structural balance -1.2 -1.1 -4.9 -9.2 -7.4 -4.7 -4.1General government debt 39.6 36.1 39.8 53.3 60.1 67.5 69.7
Sources: IMF, World Economic Outlook; data provided by the authorites; and IMF staff estimates.1/ Data for 2011 refer to March 2011.2/ Based on national definition (i.e., the labor force is defined as people older than 16 and younger than 65).3/ Capital account not included.4/ Based on data from IMF, International Financial Statistics . Data for 2011 refer to March 2011.
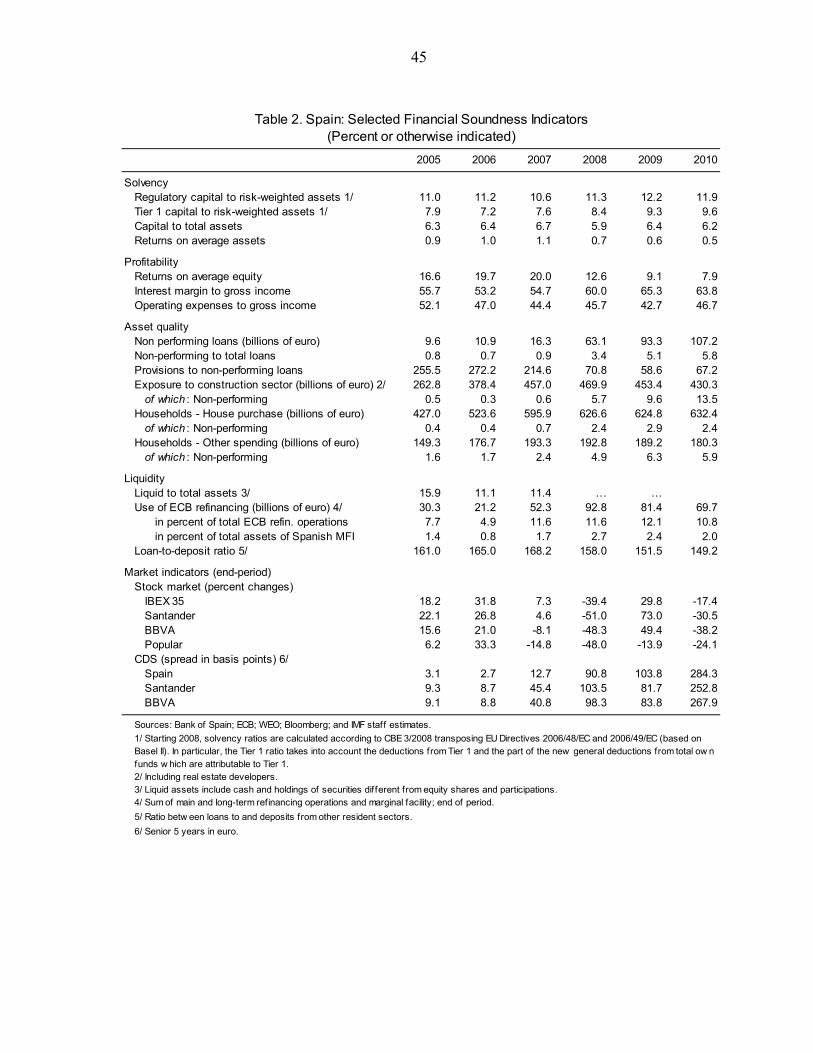
45
2005 2006 2007 2008 2009 2010
SolvencyRegulatory capital to risk-weighted assets 1/ 11.0 11.2 10.6 11.3 12.2 11.9Tier 1 capital to risk-weighted assets 1/ 7.9 7.2 7.6 8.4 9.3 9.6Capital to total assets 6.3 6.4 6.7 5.9 6.4 6.2Returns on average assets 0.9 1.0 1.1 0.7 0.6 0.5
ProfitabilityReturns on average equity 16.6 19.7 20.0 12.6 9.1 7.9Interest margin to gross income 55.7 53.2 54.7 60.0 65.3 63.8Operating expenses to gross income 52.1 47.0 44.4 45.7 42.7 46.7
Asset qualityNon performing loans (billions of euro) 9.6 10.9 16.3 63.1 93.3 107.2Non-performing to total loans 0.8 0.7 0.9 3.4 5.1 5.8Provisions to non-performing loans 255.5 272.2 214.6 70.8 58.6 67.2Exposure to construction sector (billions of euro) 2/ 262.8 378.4 457.0 469.9 453.4 430.3
of which : Non-performing 0.5 0.3 0.6 5.7 9.6 13.5Households - House purchase (billions of euro) 427.0 523.6 595.9 626.6 624.8 632.4
of which : Non-performing 0.4 0.4 0.7 2.4 2.9 2.4Households - Other spending (billions of euro) 149.3 176.7 193.3 192.8 189.2 180.3
of which : Non-performing 1.6 1.7 2.4 4.9 6.3 5.9
LiquidityLiquid to total assets 3/ 15.9 11.1 11.4 … …Use of ECB refinancing (billions of euro) 4/ 30.3 21.2 52.3 92.8 81.4 69.7
in percent of total ECB refin. operations 7.7 4.9 11.6 11.6 12.1 10.8in percent of total assets of Spanish MFI 1.4 0.8 1.7 2.7 2.4 2.0
Loan-to-deposit ratio 5/ 161.0 165.0 168.2 158.0 151.5 149.2
Market indicators (end-period)Stock market (percent changes)
IBEX 35 18.2 31.8 7.3 -39.4 29.8 -17.4Santander 22.1 26.8 4.6 -51.0 73.0 -30.5BBVA 15.6 21.0 -8.1 -48.3 49.4 -38.2Popular 6.2 33.3 -14.8 -48.0 -13.9 -24.1
CDS (spread in basis points) 6/Spain 3.1 2.7 12.7 90.8 103.8 284.3Santander 9.3 8.7 45.4 103.5 81.7 252.8BBVA 9.1 8.8 40.8 98.3 83.8 267.9
Sources: Bank of Spain; ECB; WEO; Bloomberg; and IMF staff estimates.
2/ Including real estate developers.3/ Liquid assets include cash and holdings of securities different from equity shares and participations.4/ Sum of main and long-term refinancing operations and marginal facility; end of period.
5/ Ratio betw een loans to and deposits from other resident sectors.
6/ Senior 5 years in euro.
Table 2. Spain: Selected Financial Soundness Indicators(Percent or otherwise indicated)
1/ Starting 2008, solvency ratios are calculated according to CBE 3/2008 transposing EU Directives 2006/48/EC and 2006/49/EC (based on Basel II). In particular, the Tier 1 ratio takes into account the deductions from Tier 1 and the part of the new general deductions from total ow n funds w hich are attributable to Tier 1.
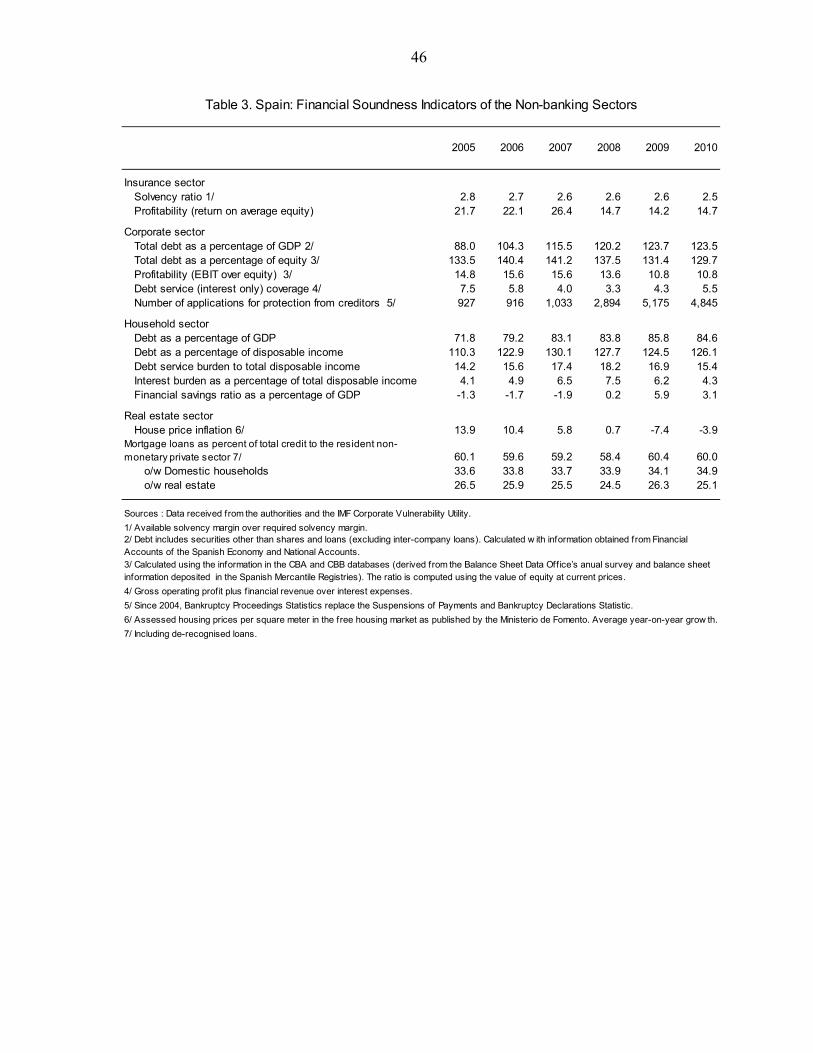
46
Table 3. Spain: Financial Soundness Indicators of the Non-banking Sectors
2005 2006 2007 2008 2009 2010
Insurance sectorSolvency ratio 1/ 2.8 2.7 2.6 2.6 2.6 2.5Profitability (return on average equity) 21.7 22.1 26.4 14.7 14.2 14.7
Corporate sectorTotal debt as a percentage of GDP 2/ 88.0 104.3 115.5 120.2 123.7 123.5Total debt as a percentage of equity 3/ 133.5 140.4 141.2 137.5 131.4 129.7Profitability (EBIT over equity) 3/ 14.8 15.6 15.6 13.6 10.8 10.8Debt service (interest only) coverage 4/ 7.5 5.8 4.0 3.3 4.3 5.5Number of applications for protection from creditors 5/ 927 916 1,033 2,894 5,175 4,845
Household sectorDebt as a percentage of GDP 71.8 79.2 83.1 83.8 85.8 84.6Debt as a percentage of disposable income 110.3 122.9 130.1 127.7 124.5 126.1Debt service burden to total disposable income 14.2 15.6 17.4 18.2 16.9 15.4Interest burden as a percentage of total disposable income 4.1 4.9 6.5 7.5 6.2 4.3Financial savings ratio as a percentage of GDP -1.3 -1.7 -1.9 0.2 5.9 3.1
Real estate sectorHouse price inflation 6/ 13.9 10.4 5.8 0.7 -7.4 -3.9
Mortgage loans as percent of total credit to the resident non-monetary private sector 7/ 60.1 59.6 59.2 58.4 60.4 60.0
o/w Domestic households 33.6 33.8 33.7 33.9 34.1 34.9 o/w real estate 26.5 25.9 25.5 24.5 26.3 25.1
Sources : Data received from the authorities and the IMF Corporate Vulnerability Utility.
1/ Available solvency margin over required solvency margin.
4/ Gross operating profit plus f inancial revenue over interest expenses.
5/ Since 2004, Bankruptcy Proceedings Statistics replace the Suspensions of Payments and Bankruptcy Declarations Statistic.
6/ Assessed housing prices per square meter in the free housing market as published by the Ministerio de Fomento. Average year-on-year grow th.
7/ Including de-recognised loans.
2/ Debt includes securities other than shares and loans (excluding inter-company loans). Calculated w ith information obtained from Financial Accounts of the Spanish Economy and National Accounts.3/ Calculated using the information in the CBA and CBB databases (derived from the Balance Sheet Data Off ice’s anual survey and balance sheet information deposited in the Spanish Mercantile Registries). The ratio is computed using the value of equity at current prices.

47
Table 4. General Government Operations
2008 2009 2010 2011 2012 2013 2014 2015 2016
Projections
(Billions of euros)
Revenue 404.1 365.4 379.5 397.5 411.3 427.2 443.0 460.4 478.7Taxes 230.5 196.8 211.1 224.4 232.9 242.7 253.9 265.5 276.7Social contributions 143.1 140.3 140.0 141.6 145.1 149.3 153.7 158.2 164.4Grants 4.3 5.8 5.8 5.9 6.1 6.4 6.6 6.9 7.1Other revenue 26.2 22.5 22.6 25.6 27.2 28.8 28.8 29.8 30.5
Expenditure 449.2 482.7 477.8 465.6 468.4 477.1 490.0 508.8 528.4Expense 423.8 453.7 456.2 452.3 456.8 465.6 478.5 496.9 516.0
Compensation of employees 118.4 125.2 124.0 122.1 121.1 120.2 119.5 124.1 128.7Use of goods and services 60.1 60.7 58.3 55.6 55.5 55.4 56.7 58.8 61.0Consumption of fixed capital 18.7 18.9 19.7 20.2 20.9 21.6 22.4 23.3 24.2Interest 17.3 18.7 20.4 23.8 27.9 31.5 36.4 40.5 45.2Subsidies 12.0 11.9 12.0 10.7 10.2 9.9 9.6 10.0 10.3Grants 10.3 11.0 11.1 11.4 11.8 12.2 12.7 13.1 13.6Social benefits 164.3 184.1 192.8 195.2 198.4 204.1 211.9 217.3 222.9Other expense 22.8 23.3 17.8 13.4 11.0 10.6 9.3 9.7 10.0
Net acquisition of nonfinancial assets 25.4 29.0 21.6 13.2 11.6 11.4 11.5 11.9 12.4
Gross operating balance -19.7 -88.3 -76.7 -54.8 -45.5 -38.4 -35.5 -36.5 -37.4Net lending / borrowing -45.2 -117.3 -98.3 -68.0 -57.1 -49.9 -47.0 -48.4 -49.7
Financing Net acquisition of financial assets 15.0 25.5 ... ... ... ... ... ... ...
Net acquisition of financial liabilities 60.2 142.7 ... ... ... ... ... ... ...
(Percent of GDP)
Revenue 37.1 34.7 35.7 36.5 36.6 36.7 36.7 36.7 36.8Taxes 21.2 18.7 19.9 20.6 20.7 20.8 21.0 21.2 21.3Social contributions 13.2 13.3 13.2 13.0 12.9 12.8 12.7 12.6 12.6Grants 0.4 0.5 0.5 0.5 0.5 0.5 0.5 0.5 0.5Other revenue 2.4 2.1 2.1 2.4 2.4 2.5 2.4 2.4 2.3
Expenditure 41.3 45.8 45.0 42.8 41.7 41.0 40.5 40.5 40.6Expense 38.9 43.0 42.9 41.5 40.6 40.0 39.6 39.6 39.6
Compensation of employees 10.9 11.9 11.7 11.2 10.8 10.3 9.9 9.9 9.9Use of goods and services 5.5 5.8 5.5 5.1 4.9 4.8 4.7 4.7 4.7Consumption of fixed capital 1.7 1.8 1.9 1.9 1.9 1.9 1.9 1.9 1.9Interest 1.6 1.8 1.9 2.2 2.5 2.7 3.0 3.2 3.5Subsidies 1.1 1.1 1.1 1.0 0.9 0.9 0.8 0.8 0.8Grants 0.9 1.0 1.0 1.0 1.0 1.0 1.0 1.0 1.0Social benefits 15.1 17.5 18.1 17.9 17.7 17.5 17.5 17.3 17.1Other expense 2.1 2.2 1.7 1.2 1.0 0.9 0.8 0.8 0.8
Net acquisition of nonfinancial assets 2.3 2.7 2.0 1.2 1.0 1.0 1.0 1.0 1.0
Gross operating balance -1.8 -8.4 -7.2 -5.0 -4.0 -3.3 -2.9 -2.9 -2.9Net lending / borrowing -4.2 -11.1 -9.2 -6.2 -5.1 -4.3 -3.9 -3.9 -3.8
Net acquisition of financial assets 1.4 2.4 … … … … … … …Net acquisition of financial liabilities 5.5 13.5 … … … … … … …
Memorandum item:Primary balance -2.6 -9.4 -7.3 -4.1 -2.6 -1.6 -0.9 -0.6 -0.3Structural balance -4.9 -9.2 -7.4 -4.7 -4.1 -3.8 -3.7 -3.9 -3.8Change in structural balance -3.8 -4.3 1.8 2.7 0.6 0.4 0.1 -0.1 0.0General governemnt gross debt (Maastricht) 39.8 53.3 60.1 67.5 69.7 72.1 73.9 75.1 76.2
Sources: Ministry of Finance; Eurostat; and IMF staff estimates and projections.
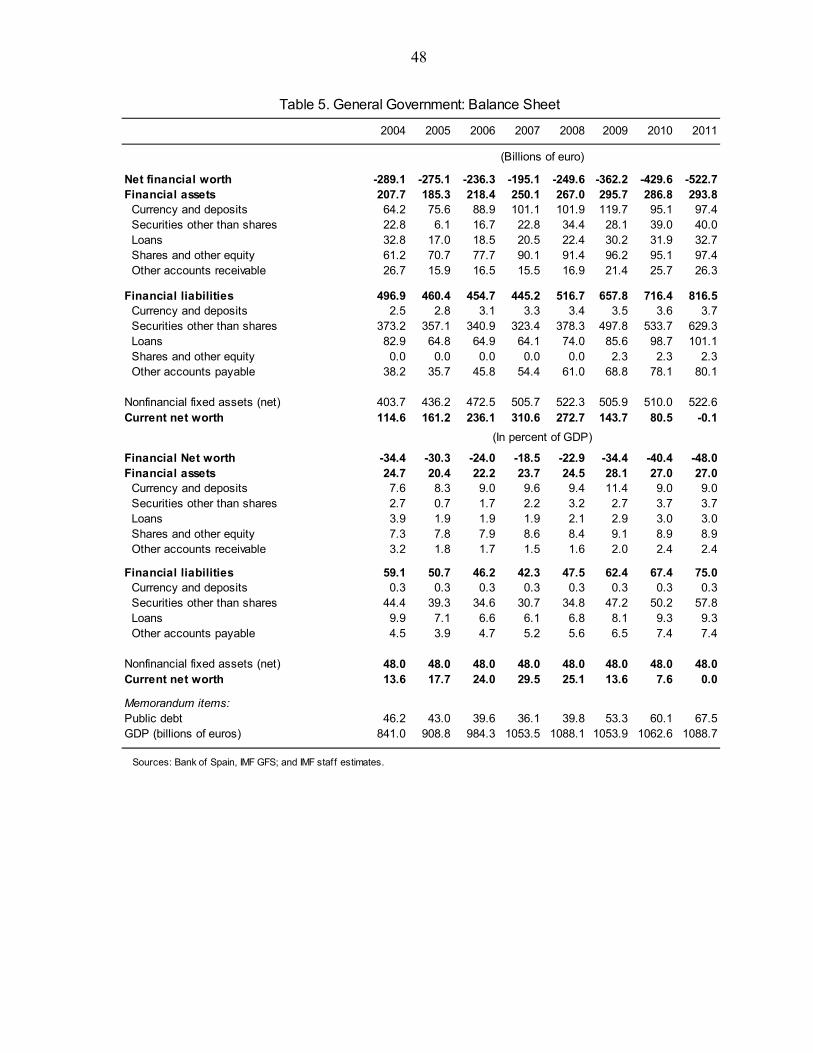
48
Table 5. General Government: Balance Sheet
2004 2005 2006 2007 2008 2009 2010 2011
Net financial worth -289.1 -275.1 -236.3 -195.1 -249.6 -362.2 -429.6 -522.7Financial assets 207.7 185.3 218.4 250.1 267.0 295.7 286.8 293.8 Currency and deposits 64.2 75.6 88.9 101.1 101.9 119.7 95.1 97.4 Securities other than shares 22.8 6.1 16.7 22.8 34.4 28.1 39.0 40.0 Loans 32.8 17.0 18.5 20.5 22.4 30.2 31.9 32.7 Shares and other equity 61.2 70.7 77.7 90.1 91.4 96.2 95.1 97.4 Other accounts receivable 26.7 15.9 16.5 15.5 16.9 21.4 25.7 26.3
Financial liabilities 496.9 460.4 454.7 445.2 516.7 657.8 716.4 816.5 Currency and deposits 2.5 2.8 3.1 3.3 3.4 3.5 3.6 3.7 Securities other than shares 373.2 357.1 340.9 323.4 378.3 497.8 533.7 629.3 Loans 82.9 64.8 64.9 64.1 74.0 85.6 98.7 101.1 Shares and other equity 0.0 0.0 0.0 0.0 0.0 2.3 2.3 2.3 Other accounts payable 38.2 35.7 45.8 54.4 61.0 68.8 78.1 80.1
Nonfinancial fixed assets (net) 403.7 436.2 472.5 505.7 522.3 505.9 510.0 522.6Current net worth 114.6 161.2 236.1 310.6 272.7 143.7 80.5 -0.1
(In percent of GDP)
Financial Net worth -34.4 -30.3 -24.0 -18.5 -22.9 -34.4 -40.4 -48.0Financial assets 24.7 20.4 22.2 23.7 24.5 28.1 27.0 27.0 Currency and deposits 7.6 8.3 9.0 9.6 9.4 11.4 9.0 9.0 Securities other than shares 2.7 0.7 1.7 2.2 3.2 2.7 3.7 3.7 Loans 3.9 1.9 1.9 1.9 2.1 2.9 3.0 3.0 Shares and other equity 7.3 7.8 7.9 8.6 8.4 9.1 8.9 8.9 Other accounts receivable 3.2 1.8 1.7 1.5 1.6 2.0 2.4 2.4
Financial liabilities 59.1 50.7 46.2 42.3 47.5 62.4 67.4 75.0 Currency and deposits 0.3 0.3 0.3 0.3 0.3 0.3 0.3 0.3 Securities other than shares 44.4 39.3 34.6 30.7 34.8 47.2 50.2 57.8 Loans 9.9 7.1 6.6 6.1 6.8 8.1 9.3 9.3 Other accounts payable 4.5 3.9 4.7 5.2 5.6 6.5 7.4 7.4
Nonfinancial fixed assets (net) 48.0 48.0 48.0 48.0 48.0 48.0 48.0 48.0Current net worth 13.6 17.7 24.0 29.5 25.1 13.6 7.6 0.0
Memorandum items:Public debt 46.2 43.0 39.6 36.1 39.8 53.3 60.1 67.5GDP (billions of euros) 841.0 908.8 984.3 1053.5 1088.1 1053.9 1062.6 1088.7
Sources: Bank of Spain, IMF GFS; and IMF staff estimates.
(Billions of euro)
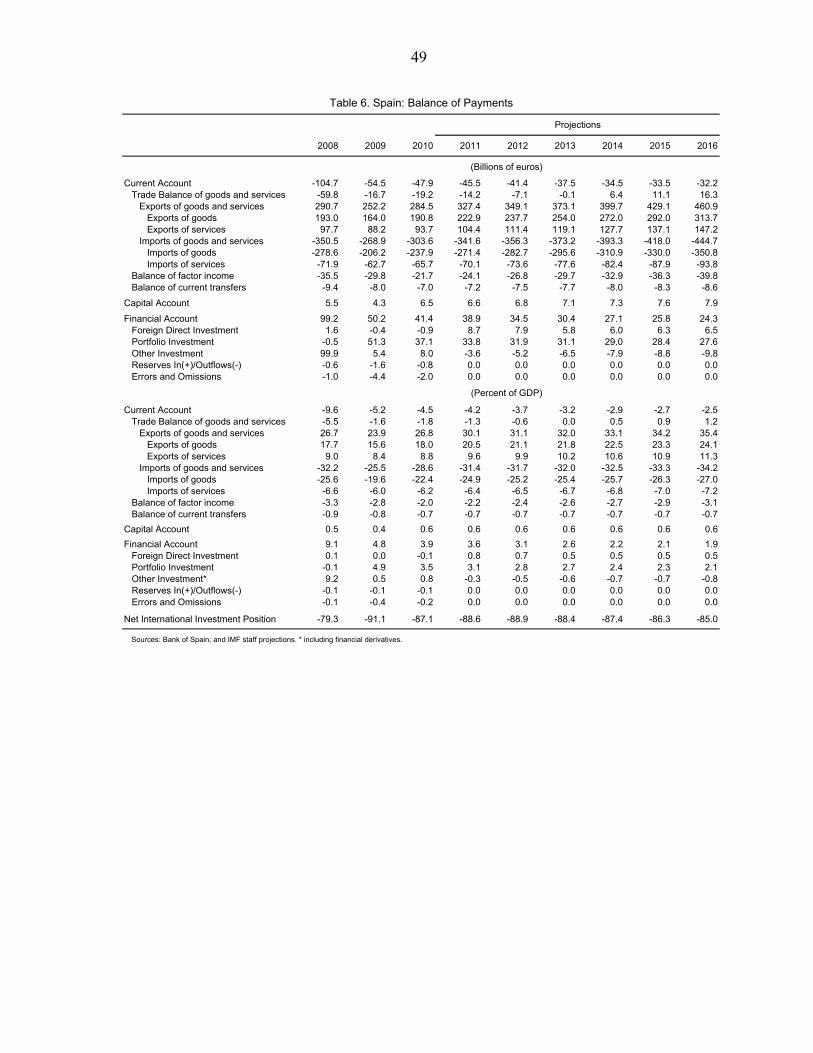
49
2008 2009 2010 2011 2012 2013 2014 2015 2016
Current Account -104.7 -54.5 -47.9 -45.5 -41.4 -37.5 -34.5 -33.5 -32.2 Trade Balance of goods and services -59.8 -16.7 -19.2 -14.2 -7.1 -0.1 6.4 11.1 16.3 Exports of goods and services 290.7 252.2 284.5 327.4 349.1 373.1 399.7 429.1 460.9 Exports of goods 193.0 164.0 190.8 222.9 237.7 254.0 272.0 292.0 313.7 Exports of services 97.7 88.2 93.7 104.4 111.4 119.1 127.7 137.1 147.2 Imports of goods and services -350.5 -268.9 -303.6 -341.6 -356.3 -373.2 -393.3 -418.0 -444.7 Imports of goods -278.6 -206.2 -237.9 -271.4 -282.7 -295.6 -310.9 -330.0 -350.8 Imports of services -71.9 -62.7 -65.7 -70.1 -73.6 -77.6 -82.4 -87.9 -93.8 Balance of factor income -35.5 -29.8 -21.7 -24.1 -26.8 -29.7 -32.9 -36.3 -39.8 Balance of current transfers -9.4 -8.0 -7.0 -7.2 -7.5 -7.7 -8.0 -8.3 -8.6
Capital Account 5.5 4.3 6.5 6.6 6.8 7.1 7.3 7.6 7.9
Financial Account 99.2 50.2 41.4 38.9 34.5 30.4 27.1 25.8 24.3 Foreign Direct Investment 1.6 -0.4 -0.9 8.7 7.9 5.8 6.0 6.3 6.5 Portfolio Investment -0.5 51.3 37.1 33.8 31.9 31.1 29.0 28.4 27.6 Other Investment 99.9 5.4 8.0 -3.6 -5.2 -6.5 -7.9 -8.8 -9.8 Reserves In(+)/Outflows(-) -0.6 -1.6 -0.8 0.0 0.0 0.0 0.0 0.0 0.0 Errors and Omissions -1.0 -4.4 -2.0 0.0 0.0 0.0 0.0 0.0 0.0
Current Account -9.6 -5.2 -4.5 -4.2 -3.7 -3.2 -2.9 -2.7 -2.5 Trade Balance of goods and services -5.5 -1.6 -1.8 -1.3 -0.6 0.0 0.5 0.9 1.2 Exports of goods and services 26.7 23.9 26.8 30.1 31.1 32.0 33.1 34.2 35.4 Exports of goods 17.7 15.6 18.0 20.5 21.1 21.8 22.5 23.3 24.1 Exports of services 9.0 8.4 8.8 9.6 9.9 10.2 10.6 10.9 11.3 Imports of goods and services -32.2 -25.5 -28.6 -31.4 -31.7 -32.0 -32.5 -33.3 -34.2 Imports of goods -25.6 -19.6 -22.4 -24.9 -25.2 -25.4 -25.7 -26.3 -27.0 Imports of services -6.6 -6.0 -6.2 -6.4 -6.5 -6.7 -6.8 -7.0 -7.2 Balance of factor income -3.3 -2.8 -2.0 -2.2 -2.4 -2.6 -2.7 -2.9 -3.1 Balance of current transfers -0.9 -0.8 -0.7 -0.7 -0.7 -0.7 -0.7 -0.7 -0.7
Capital Account 0.5 0.4 0.6 0.6 0.6 0.6 0.6 0.6 0.6
Financial Account 9.1 4.8 3.9 3.6 3.1 2.6 2.2 2.1 1.9 Foreign Direct Investment 0.1 0.0 -0.1 0.8 0.7 0.5 0.5 0.5 0.5 Portfolio Investment -0.1 4.9 3.5 3.1 2.8 2.7 2.4 2.3 2.1 Other Investment* 9.2 0.5 0.8 -0.3 -0.5 -0.6 -0.7 -0.7 -0.8 Reserves In(+)/Outflows(-) -0.1 -0.1 -0.1 0.0 0.0 0.0 0.0 0.0 0.0 Errors and Omissions -0.1 -0.4 -0.2 0.0 0.0 0.0 0.0 0.0 0.0
Net International Investment Position -79.3 -91.1 -87.1 -88.6 -88.9 -88.4 -87.4 -86.3 -85.0
Sources: Bank of Spain; and IMF staff projections. * including financial derivatives.
Projections
(Billions of euros)
(Percent of GDP)
Table 6. Spain: Balance of Payments

50
2004 2005 2006 2007 2008 2009 2010
International Investment Position -436.4 -505.5 -648.2 -822.8 -863.1 -960.1 -925.6Direct Investment -91.9 -67.1 -19.3 -2.6 1.3 11.6 38.8
Assets 207.2 258.9 331.1 395.4 424.4 447.7 490.5Liabilities 299.1 326.0 350.4 398.0 423.2 436.1 451.7
Portfolio Investment -203.2 -273.6 -508.9 -648.5 -603.7 -688.1 -650.2Assets 359.3 454.7 455.7 438.4 354.2 379.7 320.4Liabilities 562.5 728.4 964.6 1086.9 958.0 1067.8 970.6
Financial Derivatives 0.0 0.0 -9.6 -18.8 -6.4 -1.0 2.7Other Investment -209.4 -236.5 -206.1 -231.8 -305.1 -326.9 -347.2
Assets 222.2 268.2 324.9 379.5 386.6 370.5 373.5Liabilities 431.6 504.7 530.9 611.3 691.8 697.4 720.7
Bank of Spain 68.1 71.7 95.7 78.9 50.9 44.1 30.3o/w Reserve Assets 14.5 14.6 14.7 12.9 14.5 19.6 23.9
International Investment Position -51.9 -55.6 -65.9 -78.1 -79.3 -91.1 -87.1Direct Investment -10.9 -7.4 -2.0 -0.2 0.1 1.1 3.6
Assets 24.6 28.5 33.6 37.5 39.0 42.5 46.2Liabilities 35.6 35.9 35.6 37.8 38.9 41.4 42.5
Portfolio Investment -24.2 -30.1 -51.7 -61.6 -55.5 -65.3 -61.2Assets 42.7 50.0 46.3 41.6 32.6 36.0 30.2Liabilities 66.9 80.1 98.0 103.2 88.0 101.3 91.3
Financial Derivatives 0.0 0.0 -1.0 -1.8 -0.6 -0.1 0.3Other Investment -24.9 -26.0 -20.9 -22.0 -28.0 -31.0 -32.7
Assets 26.4 29.5 33.0 36.0 35.5 35.2 35.1Liabilities 51.3 55.5 53.9 58.0 63.6 66.2 67.8
Bank of Spain 8.1 7.9 9.7 7.5 4.7 4.2 2.9o/w Reserve Assets 1.7 1.6 1.5 1.2 1.3 1.9 2.2
Memorandum Item:Nominal GDP (Euro billions) 841.0 908.8 984.3 1053.5 1088.1 1053.9 1062.6
Source: Bank of Spain.
Table 7. Spain: International Investment Position, 2004‒10
(Billions of euros)
(Percent of GDP)
51
ANNEX I: FISCAL AND EXTERNAL SUSTAINABILITY
Spain has large public sector and external funding needs for the next few years. External funding needs are largely driven by bank debt. The government’s funding pressure arises largely from amortization payments. On a year-to-date basis, the central government has raised roughly half of net funding needs for 2011, in line with its pattern from 2010. Relative to its European peers the public sector debt-to-GDP ratio is relatively low. And, debt rollover is a limited portion of central government debt – the average maturity has lengthened in recent years to 6.7 years. Still, market scrutiny of its ability to meet its financing needs is high and interest costs on newly-issued debt have risen. While the standard debt sustainability analysis (DSA) framework is limited by its medium-term horizon and relatively mechanistic assumptions, it provides a useful assessment that can be complemented by longer-term analysis.1 Under unchanged policies, the public DSA for Spain projects further increase in the debt-to-GDP ratio over the medium term. Although expected additional measures would contribute to stabilize that ratio, stress scenarios could result in further increases. The external debt sustainability analysis projects gross external debt to start declining over the medium term, but stress scenarios could result in further increases. Baseline Scenarios In the baseline scenario for the fiscal sustainability assessment, the underlying fiscal position is projected to improve slightly over the medium-term, with the gross financing need-to-GDP ratio is projected to fall gradually from 30.4 percent in 2011. Still, though improving, relative to history, gross government financing need is expected to remain large. On the external side, the consolidation of external liabilities observed in 2010, and the narrowing in the current account deficit that is projected to continue, both contribute to stabilizing Spain’s external debt and eventually putting in on a downward path. Alternative Scenarios for Fiscal Sustainability Interest rate. Real interest rates in the baseline scenario are assumed to average
2.4 percent over the projection period. The impact of an increase in interest rate is not expected to have a significant effect on interest expenditure. Should real interest rates increase above the historical average of 1.3 percent (the historical average is depressed in large part by relatively high GDP deflators in the mid 2000s) and reach 3.4 percent (representing a ½ standard deviation shock), debt would increase to 78.7 percent of GDP by 2016, about 2½ percentage points of GDP above the baseline.
1 See Selected Issues Paper
52
The modest impact on interest payment reflects the long average life of central government debt, whose average maturity has risen from 5.6 years in 2000 to 6.6 years in 2010. As a result, debt rollover over the forecasting period is expected to modest.
Growth. Relative to interest rates, Spain’s public debt profile is more sensitive to shocks to growth. Should growth fall by about a little over 1 percentage point over the forecasting period, the debt-to-GDP ratio could reach 91.8 percent by 2016, about16 percentage points higher relative to the baseline.
Euro depreciation and contingent liabilities. In the case of a 30 percent nominal depreciation of the euro, after adjusting for domestic inflation, and a contingent liability shock of 10 percent of GDP, the debt-to-GDP trajectory is expected to increase to 86½ percent. It is notable that the portion of the government’s liabilities denominated in foreign currencies is small, at less than 2 percent. Thus, all else being equal, the impact of a sudden depreciation in the euro exchange rate on the debt profile would be modest.
Alternative Scenarios for External Sustainability Interest rate. The impact of a permanent ½ standard deviation shock to the interest
rate for all outstanding external debt – a 40 basis point increase from the baseline – would increase debt compared to the baseline by roughly 7 percentage points of GDP by 2016.
Growth shock. A permanent ½ standard deviation shock to the projected real growth rate – corresponding to a prolonged period of anemic growth of 0.6 percent on average - would increase debt compared to the baseline by roughly 14 percentage points of GDP at the projection horizon.
Standard combined shock. A permanent ¼ standard deviation shock applied to the projected interest rate, real growth rate and current account balance would increase debt compared to the baseline by about 13 percentage points of GDP by 2016.
Country specific combined shock. Given Spain specific circumstances, a tail-risk scenario is also examined, where a permanent one standard deviation shock is applied to the interest rate – 80 basis points above the baseline-, and a ½ standard deviation shocks to the growth rate. In this stress-test, by 2016 external debt would surge compared to the baseline by about 21 percentage points of GDP.
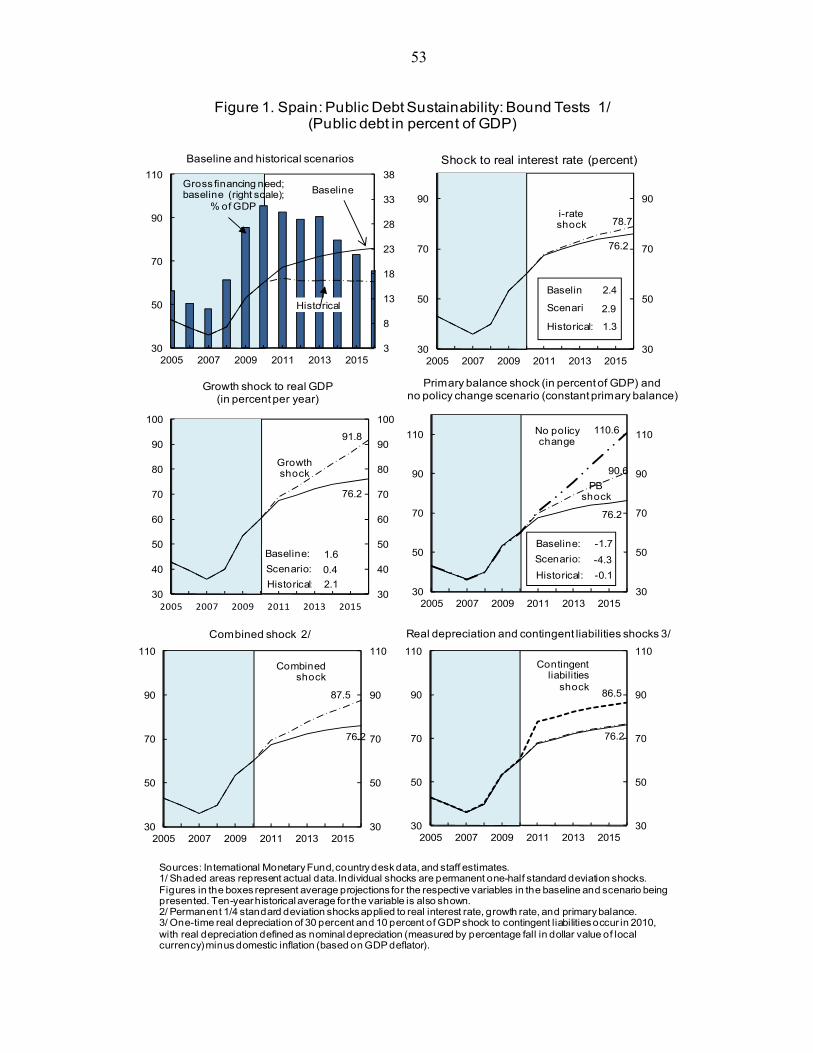
53
Growth shock
91.8
76.2
30
40
50
60
70
80
90
100
30
40
50
60
70
80
90
100
2005 2007 2009 2011 2013 2015
PB shock
90.6
76.2
110.6
30
50
70
90
110
30
50
70
90
110
2005 2007 2009 2011 2013 2015
i-rate shock 78.7
76.2
30
50
70
90
30
50
70
90
2005 2007 2009 2011 2013 2015
Shock to real interest rate (percent)
Figure 1. Spain: Public Debt Sustainability: Bound Tests 1/ (Public debt in percent of GDP)
Sources: International Monetary Fund, country desk data, and staff estimates.1/ Shaded areas represent actual data. Individual shocks are permanent one-half standard deviation shocks. Figures in the boxes represent average projections for the respective variables in the baseline and scenario being presented. Ten-year historical average for the variable is also shown.2/ Permanent 1/4 standard deviation shocks applied to real interest rate, growth rate, and primary balance.3/ One-time real depreciation of 30 percent and 10 percent of GDP shock to contingent liabilities occur in 2010, with real depreciation defined as nominal depreciation (measured by percentage fall in dollar value of local currency) minus domestic inflation (based on GDP deflator).
Historical
Baseline
3
8
13
18
23
28
33
38
30
50
70
90
110
2005 2007 2009 2011 2013 2015
Baseline and historical scenarios
87.5
76.2
30
50
70
90
110
30
50
70
90
110
2005 2007 2009 2011 2013 2015
Combined shock 2/
76.2
86.5
30
50
70
90
110
30
50
70
90
110
2005 2007 2009 2011 2013 2015
Real depreciation and contingent liabilities shocks 3/
Gross financing need; baseline (right scale);
% of GDP
Primary balance shock (in percent of GDP) andno policy change scenario (constant primary balance)
No policy change
Baseline: -1.7
Scenario: -4.3
Historical: -0.1
Baseline: 1.6
Scenario: 0.4
Historical: 2.1
Baselin 2.4
Scenari 2.9
Historical: 1.3
Contingent liabilities
shock
Combined shock
Growth shock to real GDP (in percent per year)
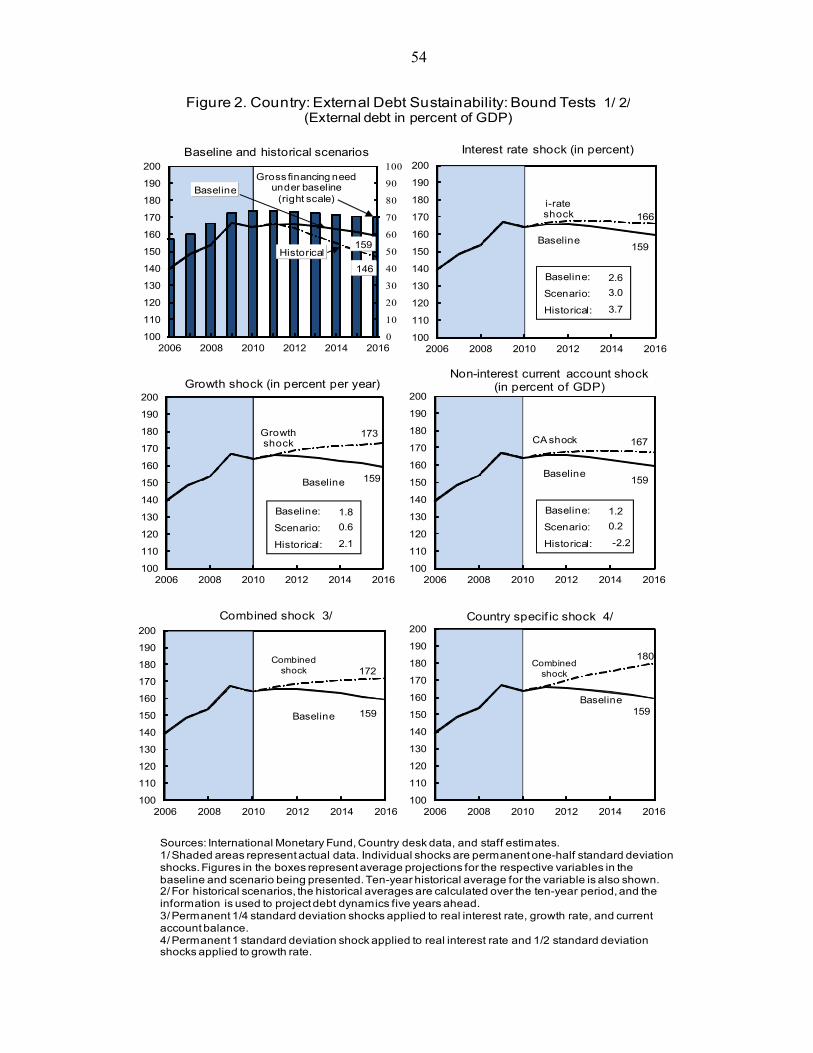
54
i-rate shock 166
Baseline159
100
110
120
130
140
150
160
170
180
190
200
2006 2008 2010 2012 2014 2016
Interest rate shock (in percent)
Figure 2. Country: External Debt Sustainability: Bound Tests 1/ 2/(External debt in percent of GDP)
Sources: International Monetary Fund, Country desk data, and staff estimates.1/ Shaded areas represent actual data. Individual shocks are permanent one-half standard deviation shocks. Figures in the boxes represent average projections for the respective variables in the baseline and scenario being presented. Ten-year historical average for the variable is also shown. 2/ For historical scenarios, the historical averages are calculated over the ten-year period, and the information is used to project debt dynamics five years ahead.3/ Permanent 1/4 standard deviation shocks applied to real interest rate, growth rate, and current account balance.4/ Permanent 1 standard deviation shock applied to real interest rate and 1/2 standard deviation shocks applied to growth rate.
Historical
146
Baseline
159
0
10
20
30
40
50
60
70
80
90
100
100
110
120
130
140
150
160
170
180
190
200
2006 2008 2010 2012 2014 2016
Baseline and historical scenarios
CA shock 167
Baseline159
100
110
120
130
140
150
160
170
180
190
200
2006 2008 2010 2012 2014 2016
Combinedshock 172
Baseline 159
100
110
120
130
140
150
160
170
180
190
200
2006 2008 2010 2012 2014 2016
Combined shock 3/
Combinedshock
180
Baseline159
100
110
120
130
140
150
160
170
180
190
200
2006 2008 2010 2012 2014 2016
Country specif ic shock 4/
Gross financing need under baseline
(right scale)
Non-interest current account shock (in percent of GDP)
Growth shock
173
Baseline 159
100
110
120
130
140
150
160
170
180
190
200
2006 2008 2010 2012 2014 2016
Growth shock (in percent per year)
Baseline:
Scenario:
Historical:
2.6
3.0
3.7
Baseline:
Scenario:
Historical:
1.8
0.6
2.1
Baseline:
Scenario:
Historical:
1.2
0.2
-2.2

INTERNATIONAL MONETARY
SPAIN
Staff Report for the 2011 Article IV Consultation—Informational Annex
Prepared by the European Department
July 6, 2011
Contents Page Appendices I. Fund Relations ...............................................................................................................2 II. Statistical Issues .............................................................................................................4
2
APPENDIX I. SPAIN: FUND RELATIONS (As of May 31, 2011)
I. Membership Status: Joined September 15, 1958.
II. General Resources Account: SDR Million Percent of Quota Quota 4,023.40 100.00 Fund holdings of currency 2,912.78 72.40 Reserve position in Fund 1,110.65 27.60
III. SDR Department: SDR Million Percent of Allocation Net cumulative allocation 2827.56 100.00
Holdings 2951.89 104.4
IV. Projected Payments to Fund (SDR Million):
Forthcoming
2011 2012 2013 2014 2015 Charges/Interest 0.48 0.99 0.99 0.99 0.99
Total 0.48 0.99 0.99 0.99 0.99
V. 2011 Article IV Consultation: A staff team comprising J. Daniel (Head), K. Honjo, F. Jaumotte, J. Vacher (all EUR), A. Giustiniani (MCM); E. Vidon (SPR); and R. Romeu (FAD) visited Madrid on June 9–21, 2011 to conduct the 2011 Article IV Consultation discussions. Ms. Balsa, Mr. De Las Casas, and Ms. Aparici from the Spanish Executive Director’s office, joined the discussions. For outreach, the mission met with parliamentarians, trade unions, employers’ organizations, bankers, and independent analysts. The concluding statement was published and the staff report is expected to be published as well. The consultation includes an annex on Spain’s Fiscal and External Sustainability. Spain is on a standard 12-month cycle. The last Article IV consultation discussions were concluded on July 30, 2010 (EBM/10/72-4).
VI. Exchange Rate Arrangements and Restrictions: Spain’s currency is the euro, which floats freely and independently against other currencies. Spain has accepted the obligations of Article VIII, Sections 2, 3, and 4, and maintains an exchange rate system free of restrictions on payments and transfers for current international transactions, other than restrictions notified to the Fund under Decision No. 144 (52/51).
3
APPENDIX II. SPAIN: STATISTICAL ISSUES
As of July 1, 2011
I. Assessment of Data Adequacy for Surveillance General: Data provision is adequate for surveillance. Fiscal sector: Spain does not report the fiscal accounts of the autonomous communities (the sub-national governments which are wholly responsible for education, health and other social expenditure) on a quarterly national accounts basis. While the aggregate sub-national accounts can be derived from the general government accounts that the Spanish authorities report on a quarterly basis, the balances of the 17 individual autonomous communities remain unavailable, which is at variance with the Concluding Statement calling for the reporting of individual autonomous communities on a national accounts basis.
II. Data Standards and QualitySubscriber to the Fund’s Special Data Dissemination Standard (SDDS) since September 1996.
No data ROSC available.
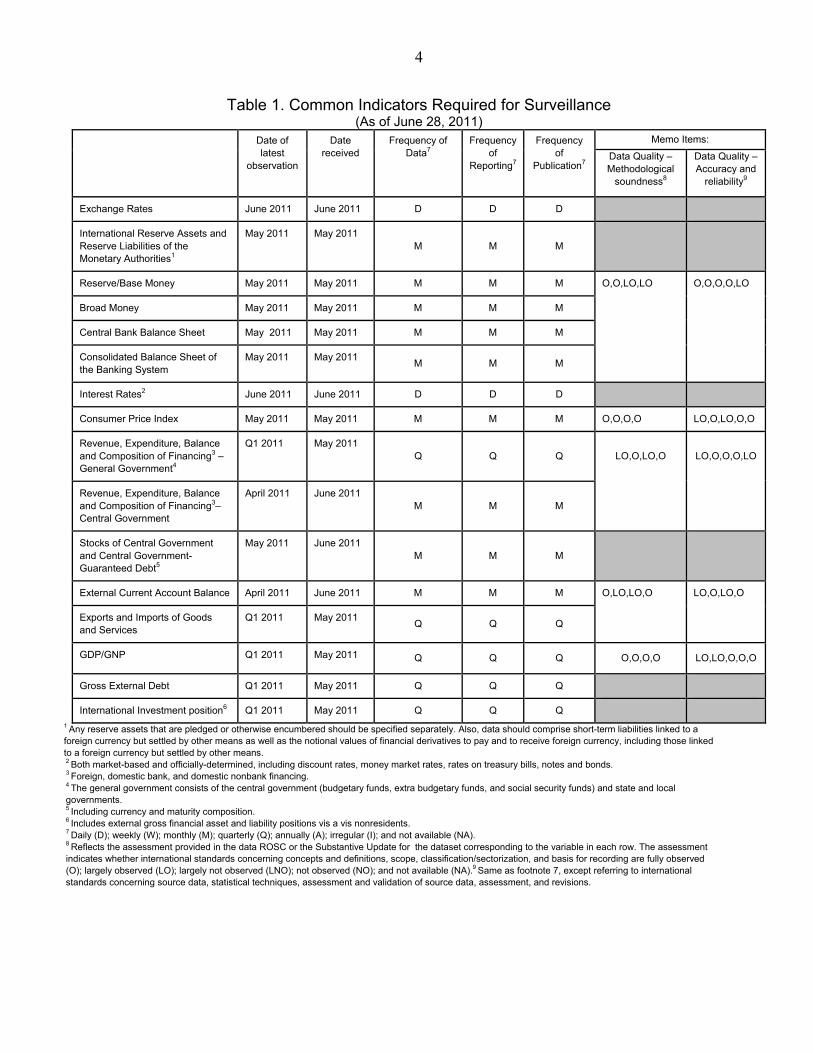
4
Table 1. Common Indicators Required for Surveillance (As of June 28, 2011)
Date of latest
observation
Date received
Frequency of Data7
Frequency of
Reporting7
Frequency of
Publication7
Memo Items:
Data Quality – Methodological
soundness8
Data Quality – Accuracy and
reliability9
Exchange Rates June 2011 June 2011 D D D
International Reserve Assets and Reserve Liabilities of the Monetary Authorities1
May 2011 May 2011 M M M
Reserve/Base Money May 2011 May 2011 M M M O,O,LO,LO O,O,O,O,LO
Broad Money May 2011 May 2011 M M M
Central Bank Balance Sheet May 2011 May 2011 M M M
Consolidated Balance Sheet of the Banking System
May 2011 May 2011 M M M
Interest Rates2 June 2011 June 2011 D D D
Consumer Price Index May 2011 May 2011 M M M O,O,O,O LO,O,LO,O,O
Revenue, Expenditure, Balance and Composition of Financing3 – General Government4
Q1 2011 May 2011 Q Q Q LO,O,LO,O LO,O,O,O,LO
Revenue, Expenditure, Balance and Composition of Financing3– Central Government
April 2011 June 2011 M M M
Stocks of Central Government and Central Government-Guaranteed Debt5
May 2011 June 2011 M M M
External Current Account Balance April 2011 June 2011 M M M O,LO,LO,O LO,O,LO,O
Exports and Imports of Goods and Services
Q1 2011 May 2011 Q Q Q
GDP/GNP Q1 2011 May 2011 Q Q Q O,O,O,O LO,LO,O,O,O
Gross External Debt Q1 2011 May 2011 Q Q Q
International Investment position6 Q1 2011 May 2011 Q Q Q
1 Any reserve assets that are pledged or otherwise encumbered should be specified separately. Also, data should comprise short-term liabilities linked to a foreign currency but settled by other means as well as the notional values of financial derivatives to pay and to receive foreign currency, including those linked to a foreign currency but settled by other means. 2 Both market-based and officially-determined, including discount rates, money market rates, rates on treasury bills, notes and bonds. 3 Foreign, domestic bank, and domestic nonbank financing. 4 The general government consists of the central government (budgetary funds, extra budgetary funds, and social security funds) and state and local governments. 5 Including currency and maturity composition. 6 Includes external gross financial asset and liability positions vis a vis nonresidents. 7 Daily (D); weekly (W); monthly (M); quarterly (Q); annually (A); irregular (I); and not available (NA). 8 Reflects the assessment provided in the data ROSC or the Substantive Update for the dataset corresponding to the variable in each row. The assessment indicates whether international standards concerning concepts and definitions, scope, classification/sectorization, and basis for recording are fully observed (O); largely observed (LO); largely not observed (LNO); not observed (NO); and not available (NA).9 Same as footnote 7, except referring to international standards concerning source data, statistical techniques, assessment and validation of source data, assessment, and revisions.

Public Information Notice (PIN) No. 11/102 FOR IMMEDIATE RELEASE July 29, 2011 IMF Executive Board Concludes 2011 Article IV Consultation with Spain
On July 22, 2011, the Executive Board of the International Monetary Fund (IMF) concluded the Article IV consultation with Spain.1
Background After more than a decade of strong expansion led by a credit-fueled housing boom, the Spanish economy was hit by three major shocks: the global financial crisis, the busting of Spain’s domestic boom, and the euro area debt crisis. These shocks exposed Spain’s vulnerabilities stemming from accumulated imbalances and pushed the economy into a sharp recession, with the euro area debt crisis subsequently putting pressure on funding costs. The economy has been gradually recovering and rebalancing.
Growth has gradually picked up from the first quarter of 2010, led by strong exports as the rebalancing to external demand proceeded. Private sector savings-investment balances have improved, helping stabilize debt ratios and reduce the current account deficit. The housing market continued to adjust. Real wages moderated and unit labor costs improved. However, at around 21 percent, the unemployment rate is more than twice the euro area average. Inflation has picked up, led by energy prices and indirect taxes, and is again above the euro area average. A reform of collective bargaining aiming at greater firm-level flexibility was presented to Parliament in June 2011, complementing the June 2010 labor market reform.
1 Under Article IV of the IMF's Articles of Agreement, the IMF holds bilateral discussions with members, usually every year. A staff team visits the country, collects economic and financial information, and discusses with officials the country's economic developments and policies. On return to headquarters, the staff prepares a report, which forms the basis for discussion by the Executive Board. At the conclusion of the discussion, the Managing Director, as Chairman of the Board, summarizes the views of Executive Directors, and this summary is transmitted to the country's authorities. An explanation of any qualifiers used in summing up can be found here: http://www.imf.org/external/np/sec/misc/qualifiers.htm.
International Monetary Fund 700 19th
Washington, D. C. 20431 USA Street, NW
2 Fiscal consolidation is underway, aimed at achieving a deficit target of 3 percent of GDP in 2013. The fiscal deficit improved by about 2 percentage points of GDP from 2009 to 9.2 percent of GDP in 2010, and the 2010 deficit target was reached - reflecting both a rebound in revenue, notably in VAT, and lower expenditure. About half of the regions missed their targets, which was more than offset by over-performance by the central government. A comprehensive draft pension reform was agreed with social partners, and the dissemination of fiscal data at the regional level was enhanced. Banks are deleveraging and increasing their capital buffers but asset quality has continued to deteriorate. Lower lending activity and increasing nonperforming assets have reduced banks’ interest margins, as funding costs have been rising since end-2010. Nonetheless, Spanish banks have increased their Tier 1 capital ratio from 8.4 percent in 2008 to 9.6 percent in 2010, with large international banks continuing to benefit from geographical and business diversification. The saving bank sector was reshaped through a merger/integration process that led the number of savings banks to decline from 45 to 18. Capital standards were strengthened through a decree approved in February 2011 that prompted savings banks to transfer their banking activities to commercial bank entities and prepare plans for recapitalization through IPOs or participation of the Fund for Orderly Bank Restructuring (Fondo de Reestructuración Ordenada Bancaria—FROB). Transparency was also improved through enhanced disclosure of individual banks’ real estate exposures and funding profiles. Executive Board Assessment Executive Directors noted the authorities’ strong and wide ranging policy response to the economic challenges, which has helped strengthen market confidence. Directors underscored, however, that downside risks still dominate and that unwinding imbalances and reallocating resources across sectors will need the support of continued and decisive policy action. Directors commended the authorities for the reconfiguration of the savings bank sector, enhanced capital standards, and the greater transparency in individual bank exposures. They also welcomed the wide participation of Spanish financial institutions in the recent EU stress tests, and noted that the results highlight the importance of the backstop provided by the authorities. In this regard, Directors agreed that decisive implementation of the reform strategy for the financial sector is critical to allay lingering market concerns. Directors also saw scope for further strengthening provisioning and capital buffers, and building on recent transparency efforts. Directors noted that an improved policy framework would facilitate the achievement of the fiscal targets. They welcomed the authorities’ commitment to reduce the fiscal deficit, and the recent enactment of pension reform. Directors emphasized that steadfast fiscal adjustment is key, and noted that, if near-term risks to the outlook materialize, additional measures may be needed. Noting the reliance of the adjustment on measures at the sub-national level, Directors urged all levels of government to deliver on their fiscal commitments. They encourage the authorities to

3 be vigilant and consider further fiscal measures as needed to achieve medium-term targets and put the debt ratio on a firmly declining path. Directors recognized the authorities’ efforts to address entrenched rigidities in the labor market and encouraged them to persevere with reforms to reduce the unacceptably high level of unemployment. In particular, Directors called for more decentralized wage bargaining as well as less indexation and further lowering severance payments. Directors agreed that structural reforms in the non-tradable sector aimed at raising productivity and the growth potential should complement labor market adjustments. In particular, priority should be given to establishing a more efficient regulatory environment and further opening up regulated professions and services.
Public Information Notices (PINs) form part of the IMF's efforts to promote transparency of the IMF's views and analysis of economic developments and policies. With the consent of the country (or countries) concerned, PINs are issued after Executive Board discussions of Article IV consultations with member countries, of its surveillance of developments at the regional level, of post-program monitoring, and of ex post assessments of member countries with longer-term program engagements. PINs are also issued after Executive Board discussions of general policy matters, unless otherwise decided by the Executive Board in a particular case. The staff report (use the free Adobe Acrobat Reader to view this pdf file) for the 2011 Article IV Consultation with Spain is also available.
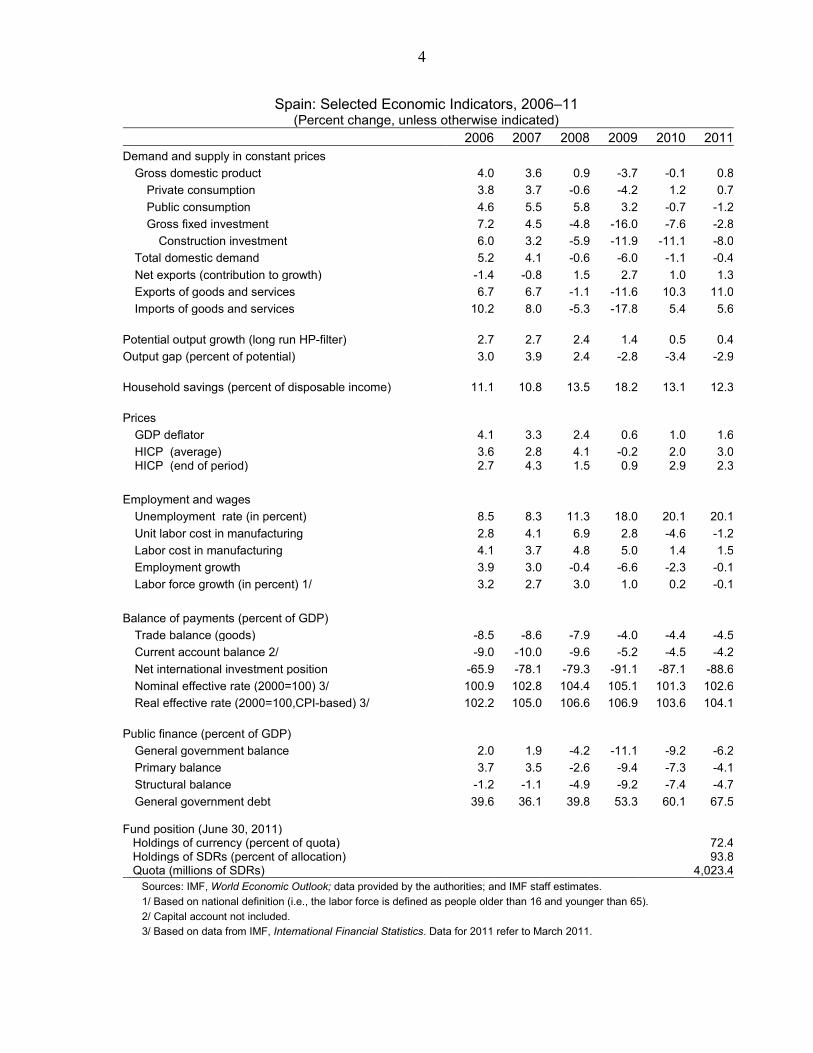
4
Spain: Selected Economic Indicators, 2006–11 (Percent change, unless otherwise indicated)
2006 2007 2008 2009 2010 2011 Demand and supply in constant prices
Gross domestic product 4.0 3.6 0.9 -3.7 -0.1 0.8 Private consumption 3.8 3.7 -0.6 -4.2 1.2 0.7 Public consumption 4.6 5.5 5.8 3.2 -0.7 -1.2 Gross fixed investment 7.2 4.5 -4.8 -16.0 -7.6 -2.8
Construction investment 6.0 3.2 -5.9 -11.9 -11.1 -8.0 Total domestic demand 5.2 4.1 -0.6 -6.0 -1.1 -0.4 Net exports (contribution to growth) -1.4 -0.8 1.5 2.7 1.0 1.3 Exports of goods and services 6.7 6.7 -1.1 -11.6 10.3 11.0 Imports of goods and services 10.2 8.0 -5.3 -17.8 5.4 5.6
Potential output growth (long run HP-filter) 2.7 2.7 2.4 1.4 0.5 0.4 Output gap (percent of potential) 3.0 3.9 2.4 -2.8 -3.4 -2.9 Household savings (percent of disposable income) 11.1 10.8 13.5 18.2 13.1 12.3 Prices
GDP deflator 4.1 3.3 2.4 0.6 1.0 1.6 HICP (average) 3.6 2.8 4.1 -0.2 2.0 3.0 HICP (end of period) 2.7 4.3 1.5 0.9 2.9 2.3
Employment and wages
Unemployment rate (in percent) 8.5 8.3 11.3 18.0 20.1 20.1 Unit labor cost in manufacturing 2.8 4.1 6.9 2.8 -4.6 -1.2 Labor cost in manufacturing 4.1 3.7 4.8 5.0 1.4 1.5 Employment growth 3.9 3.0 -0.4 -6.6 -2.3 -0.1 Labor force growth (in percent) 1/ 3.2 2.7 3.0 1.0 0.2 -0.1
Balance of payments (percent of GDP)
Trade balance (goods) -8.5 -8.6 -7.9 -4.0 -4.4 -4.5 Current account balance 2/ -9.0 -10.0 -9.6 -5.2 -4.5 -4.2 Net international investment position -65.9 -78.1 -79.3 -91.1 -87.1 -88.6 Nominal effective rate (2000=100) 3/ 100.9 102.8 104.4 105.1 101.3 102.6 Real effective rate (2000=100,CPI-based) 3/ 102.2 105.0 106.6 106.9 103.6 104.1
Public finance (percent of GDP)
General government balance 2.0 1.9 -4.2 -11.1 -9.2 -6.2 Primary balance 3.7 3.5 -2.6 -9.4 -7.3 -4.1 Structural balance -1.2 -1.1 -4.9 -9.2 -7.4 -4.7 General government debt 39.6 36.1 39.8 53.3 60.1 67.5
Fund position (June 30, 2011) Holdings of currency (percent of quota) 72.4 Holdings of SDRs (percent of allocation) 93.8 Quota (millions of SDRs) 4,023.4
Sources: IMF, World Economic Outlook; data provided by the authorities; and IMF staff estimates. 1/ Based on national definition (i.e., the labor force is defined as people older than 16 and younger than 65). 2/ Capital account not included. 3/ Based on data from IMF, International Financial Statistics. Data for 2011 refer to March 2011.

INTERNATIONAL MONETARY FUND
SPAIN
Staff Report for the Article IV Consultation—Supplementary Information
Prepared by the European Department (In Consultation with Other Departments)
Approved by Ajai Chopra and Martin Mühleisen
July 19, 2011
This supplement provides information that has become available since the staff report was issued. The new information does not alter the thrust of the staff appraisal.
1. The European Banking Authority (EBA) released the results of the EU-wide stress test on July 15. The coverage of the Spanish system (93 percent) is, again, commendably much higher than the EBA requirement of at least 50 percent, and 25 Spanish institutions participated. The analysis incorporates measures through April 2011, including, critically for the weaker institutions, existing and committed FROB support. The results show 5 out of the 25 institutions as falling below the benchmark under the adverse scenario, representing 9 percent of total banking assets and for a combined shortfall of €1.6 billion (less than 0.2 percent of GDP). However, for comparability, some country specific balance sheet elements, such as generic provisions and mandatory convertible bonds in Spain, were not taken into account as loss-absorbing instruments. If they are, the Spanish authorities indicate that no additional capital is required as a result of the exercise. In staff’s view, the results underscore the importance of: the FROB capital backstop; the need to decisively implement the envisaged financial sector reforms, in particular, swiftly addressing the few small weak banks; and, in light of current market tension, further strengthening capital buffers.

2
2. The Bankia IPO was concluded on July 18. In the context of difficult market conditions, the amount and price were lowered compared to the initial target ranges, implying a substantial discount to book value. Nevertheless, slightly more than €3 billion was raised, which, critically, means that there is no need to resort to FROB resources to meet minimum capital standards. The share of institutional investors was 40 percent (reportedly, mainly domestic), and half of Bankia’s capital would be held private investors.
3. An expenditure rule has been enacted. The July 1 Royal Decree modifies the budget stability law to include a rule for central and local governments to keep the increase in nominal public expenditure (excluding interest and unemployment benefits) below the growth in nominal GDP (defined as the average of the past 5 years, the estimate for the current year, and projections for the next 3 years from the SGP). Its use by regional governments will be discussed in the next meeting of the Fiscal and Financial Policy Council (scheduled for July 27). Staff views an expenditure rule as a useful complement to the deficit rule, which should be applied to all levels of government.
4. The draft pension reform is scheduled for final approval by Congress on Thursday, July 21.
Sources: European Banking Authority; Bank of Spain; and IMF staff estimates.1/ Spanish institutions in red, with the largest 5 named; mitigating factors in yellow.
-2
2
6
10
14
18
22
26
30
-2
2
6
10
14
18
22
26
30
1 4 7 10 13 16 19 22 25 28 31 34 37 40 43 46 49 52 55 58 61 64 67 70 73 76 79 82 85 88
Core Tier 1 Ratio in Adverse Scenario, 2012(percent; including mitigating measures) 1/
BBVA
Popular
La Caixa
BFA-Bankia
Santander
simple average = 8.9%
5%
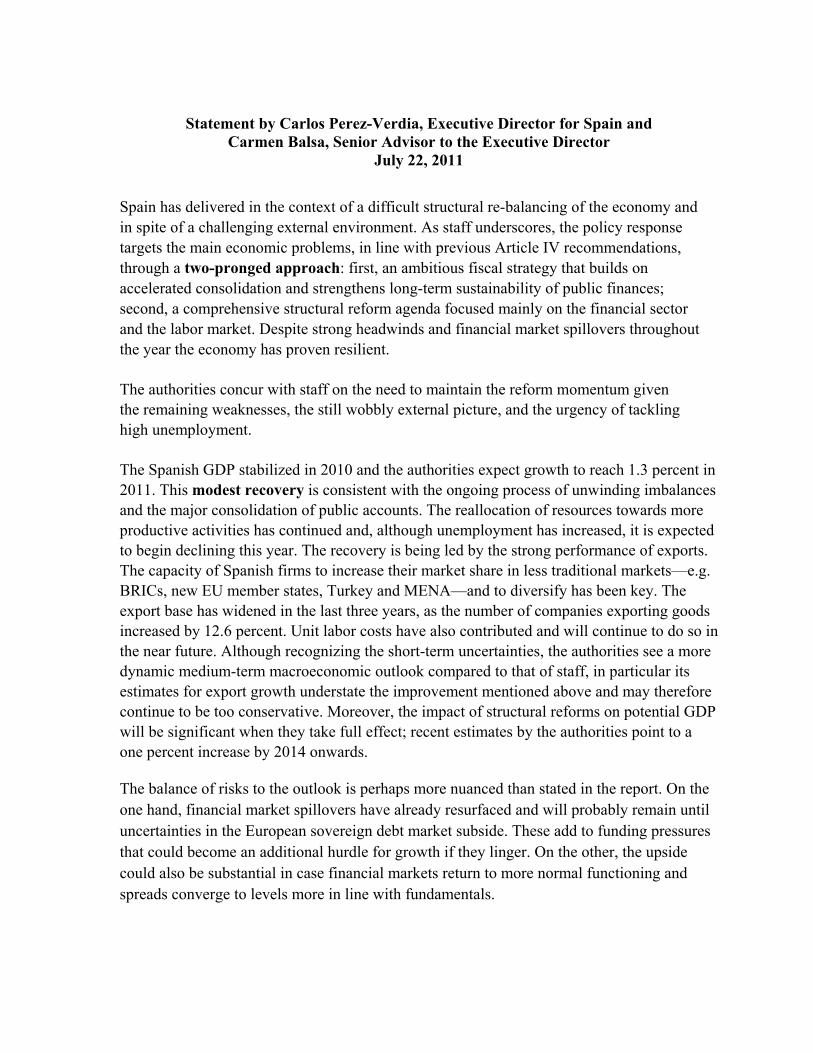
Statement by Carlos Perez-Verdia, Executive Director for Spain and
Carmen Balsa, Senior Advisor to the Executive Director July 22, 2011
Spain has delivered in the context of a difficult structural re-balancing of the economy and in spite of a challenging external environment. As staff underscores, the policy response targets the main economic problems, in line with previous Article IV recommendations, through a two-pronged approach: first, an ambitious fiscal strategy that builds on accelerated consolidation and strengthens long-term sustainability of public finances; second, a comprehensive structural reform agenda focused mainly on the financial sector and the labor market. Despite strong headwinds and financial market spillovers throughout the year the economy has proven resilient.
The authorities concur with staff on the need to maintain the reform momentum given the remaining weaknesses, the still wobbly external picture, and the urgency of tackling high unemployment.
The Spanish GDP stabilized in 2010 and the authorities expect growth to reach 1.3 percent in 2011. This modest recovery is consistent with the ongoing process of unwinding imbalances and the major consolidation of public accounts. The reallocation of resources towards more productive activities has continued and, although unemployment has increased, it is expected to begin declining this year. The recovery is being led by the strong performance of exports. The capacity of Spanish firms to increase their market share in less traditional markets—e.g. BRICs, new EU member states, Turkey and MENA—and to diversify has been key. The export base has widened in the last three years, as the number of companies exporting goods increased by 12.6 percent. Unit labor costs have also contributed and will continue to do so in the near future. Although recognizing the short-term uncertainties, the authorities see a more dynamic medium-term macroeconomic outlook compared to that of staff, in particular its estimates for export growth understate the improvement mentioned above and may therefore continue to be too conservative. Moreover, the impact of structural reforms on potential GDP will be significant when they take full effect; recent estimates by the authorities point to a one percent increase by 2014 onwards. The balance of risks to the outlook is perhaps more nuanced than stated in the report. On the one hand, financial market spillovers have already resurfaced and will probably remain until uncertainties in the European sovereign debt market subside. These add to funding pressures that could become an additional hurdle for growth if they linger. On the other, the upside could also be substantial in case financial markets return to more normal functioning and spreads converge to levels more in line with fundamentals.
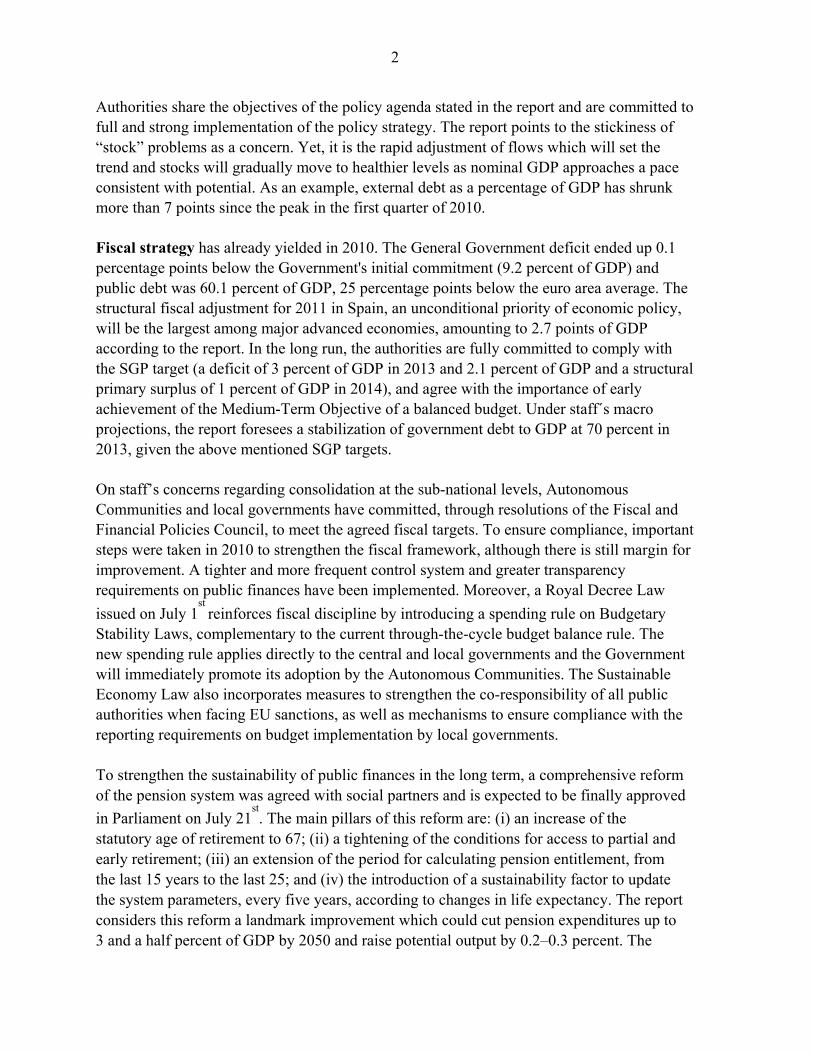
2
Authorities share the objectives of the policy agenda stated in the report and are committed to full and strong implementation of the policy strategy. The report points to the stickiness of “stock” problems as a concern. Yet, it is the rapid adjustment of flows which will set the trend and stocks will gradually move to healthier levels as nominal GDP approaches a pace consistent with potential. As an example, external debt as a percentage of GDP has shrunk more than 7 points since the peak in the first quarter of 2010.
Fiscal strategy has already yielded in 2010. The General Government deficit ended up 0.1 percentage points below the Government's initial commitment (9.2 percent of GDP) and public debt was 60.1 percent of GDP, 25 percentage points below the euro area average. The structural fiscal adjustment for 2011 in Spain, an unconditional priority of economic policy, will be the largest among major advanced economies, amounting to 2.7 points of GDP according to the report. In the long run, the authorities are fully committed to comply with the SGP target (a deficit of 3 percent of GDP in 2013 and 2.1 percent of GDP and a structural primary surplus of 1 percent of GDP in 2014), and agree with the importance of early achievement of the Medium-Term Objective of a balanced budget. Under staff´s macro projections, the report foresees a stabilization of government debt to GDP at 70 percent in 2013, given the above mentioned SGP targets.
On staff’s concerns regarding consolidation at the sub-national levels, Autonomous Communities and local governments have committed, through resolutions of the Fiscal and Financial Policies Council, to meet the agreed fiscal targets. To ensure compliance, important steps were taken in 2010 to strengthen the fiscal framework, although there is still margin for improvement. A tighter and more frequent control system and greater transparency requirements on public finances have been implemented. Moreover, a Royal Decree Law
issued on July 1st
reinforces fiscal discipline by introducing a spending rule on Budgetary Stability Laws, complementary to the current through-the-cycle budget balance rule. The new spending rule applies directly to the central and local governments and the Government will immediately promote its adoption by the Autonomous Communities. The Sustainable Economy Law also incorporates measures to strengthen the co-responsibility of all public authorities when facing EU sanctions, as well as mechanisms to ensure compliance with the reporting requirements on budget implementation by local governments.
To strengthen the sustainability of public finances in the long term, a comprehensive reform of the pension system was agreed with social partners and is expected to be finally approved
in Parliament on July 21st. The main pillars of this reform are: (i) an increase of the
statutory age of retirement to 67; (ii) a tightening of the conditions for access to partial and early retirement; (iii) an extension of the period for calculating pension entitlement, from the last 15 years to the last 25; and (iv) the introduction of a sustainability factor to update the system parameters, every five years, according to changes in life expectancy. The report considers this reform a landmark improvement which could cut pension expenditures up to 3 and a half percent of GDP by 2050 and raise potential output by 0.2–0.3 percent. The

3
Government has also introduced far-reaching measures to reduce health spending by rationalizing the use of prescriptions, and increasing efficiency in the provision of health services.
The authorities have proceeded steadfastly with the ambitious restructuring of the financial sector. Moreover, transparency was further enhanced and capital requirements increased under the February 2011 Royal Decree Law. Indeed, recent stress tests by the EBA show the Spanish financial sector, once generic provisions are taken into account, is robust even under very adverse scenarios. The 100 percent participation of Spanish banks and savings banks in the exercise demonstrates their commitment to transparency to dispel any remaining doubts.
In response to the weaknesses revealed by the crisis, the authorities set in motion an unprecedented process of transformation, which will replace the old savings banks’ model by modern commercial banks subject to full market discipline and capitalization mechanisms. This transformation is aimed at enhancing the institutions’ competitive position and market perception, while minimizing the cost to the taxpayer and avoiding distortions in the sector’s functioning.
The first phase of this transformation process, which is almost complete, pursued an increase in the sector’s efficiency through consolidation and restructuring. The results are remarkable: (i) new entities’ solvency has been strengthened with €10.1 billion funds from the Fund for Orderly Bank Restructuring (FROB); (ii) write-downs and provisions have been increased (additional €22 billion provisions have been constituted by the entities that requested FROB’s support), (iii) the number of entities has been reduced from 45 to 18, through mergers and acquisitions, allowing the resulting institutions to benefit from lower operating costs and improved access to wholesale markets; and (iv) excess capacity is being tackled by cutting, on average, 25 percent of branches and 15 percent of staff.
The second phase of the process aims at improving governance, increasing obligations on transparency—already very high by all measures—and reinforcing solvency and capital quality requirements. In a nutshell, beyond EBA’s thresholds, the new regulation requires a capital principal1
ratio of at least 8 percent of risk-weighted-assets, by end-September. For those entities considered heavily dependent on wholesale markets (20 percent threshold) this ratio is increased to 10 percent. The FROB will, if necessary, subscribe the banks’ shares to allow compliance with the new capital requirements. It is foreseen that only four savings banks—representing eight percent of total assets of the Spanish banking system—will require this support. FROB’s interventions will be, according to law, temporary, market based, and backed by a demanding restructuring plan approved by Banco de España, the EC
1 Capital principal = core capital + convertible preference shares subscribed by FROB + debt instruments mandatorily convertible into common shares before end-2014.

4
and the FROB itself. Furthermore, these plans will be independently audited by renowned international firms.
The restructuring of the financial sector is approaching completion. It has repaired previous flaws and strengthens institutions looking forward—for instance, by providing more information and building buffers and backstops—in a still uncertain environment. However, there is no complacency on the side of authorities. They remain aware of the risks and will ensure the achievement of targets, both by adopting the necessary measures and by ensuring market discipline is allowed to work fully.
Staff adequately describes the traditional problems of duality and inflexibility of the Spanish labor market, which, together with the downsizing of the residential real estate sector, led to a severe quantity adjustment during the crisis. Reform momentum in this difficult area has also been strong over last year. With the ultimate aim of removing the burden on growth of an inefficient labor market, initiatives have fostered the use of permanent and training contracts and clarified grounds for objective dismissal. More recently, relevant changes have been introduced in the collective bargaining framework. Their objective is to ease the process and reduce remaining rigidities by incentivizing bargaining at the company level, linking agreements to economic conditions, encouraging prompt and swift renegotiation, and making opt-out clauses more available.
Admittedly, there is more to be done and the authorities are already working on further improvements, in many cases along the lines proposed by staff. Nevertheless, reforms in the labor market accomplished so far constitute very important steps to improve Spain’s potential growth.
Additional structural measures have been adopted in other areas. Among them, the full transposition of the European Service Directive stands out in terms of foreseen productivity gains and reduction of administrative burdens. The Sustainable Economy Law, enacted last March, also introduces far-reaching improvements in competitiveness-related fields, such as the economic environment, innovation, education and the energy mix. Airport management and state lotteries are being revamped through a process that includes a modern regulatory framework, the introduction of private management systems, and partial privatization of previous public monopolies. Finally, the telecommunications sector regulation is also being improved in order to achieve a more efficient use of the spectrum by reallocating and auctioning parts of that spectrum. In conclusion, in a very difficult year, Spain has laid the ground for a new growth model; a more sustainable, higher productivity model, which delivers the level of flexibility required in a monetary union. Despite these achievements, authorities recognize there is no room for complacency and it is crucial to maintain the reform momentum with the overarching goals of fostering growth and creating employment.