Embed Size (px)
Citation preview
Reports equipment and carries out verification tasks. In any case, a decision to build a European space capability could con- tribute to independent verification and CSBM systems. This, in turn, would enable Europeans to obtain early warning of an attack. Finally, access to observations from space would enable the European nations to participate fully and on an equal basis in arms control processes.
Bhupendra Jasani Department of War Studies
King's College London, WC2R 2LS UK
1 Belgium, France, FR Germany, Italy, Luxembourg, the Netherlands and the UK. 2 The Military Use of Space, Report by the Committee on Scientific, Technical and Aerospace Questions, Document 976, 15 May 1984; and WEU and the Strategic Defence Initiative - Guidelines Drawn from the Colloquy on the Space Challenge for Europe, Report by the Committee on Sci- entific, Technical and Aerospace Ques- tions, Document 1036, 6 November 1985. 3 Verification: a Future European Satellite
Agency, Assembly of Western European Union Report, Document 1159, 3 Novem- ber 1988; and Scientific and Technical Aspects of Arms Control Verification by Satellites - Reply to the Thirty-Third Annual Report of the Council, Document 1160, 7 November 1988. 4 Speech by the President of the WEU Assembly, Charles Goerens, at the WEU Assembly Symposium on Satell i tes- a European Means of Verifying Disarma- ment, 27-28 March 1990, Rome, Italy. s Excerpts from Webster's speech to the National Press Club, USIA European Wire- less File, 30 November 1989, pp 33-34. 6 C. Thomas, 'Threat to US satellite budget', The Times, 8 October 1989. 7 Convention for the Establishment of a European Space Agency, Art It. a B. Jasani, 'A regional satellite monitoring agency', Environmental Conservation, Vol 10, No 3, 1983, pp 255-256. 9 B. Starr, 'Resource pool for CFE verifica- tion', Jane's Defence Weekly, Vol 12, No 24, 16 December 1989, p 1317. 1°Address by Helmut Kohl, European Space Agency Bulletin, No 58, May 1989, p 22. 11 'Action plan on a stepwise development of a European Armament Market', IEPG/ NAD/D-22, 23 September 1988. 12 Estoril communique, IEPG/MON/D-12, 28 June 1989.
Space industry- 10-year survey
Space Policy reprints here the Executive Summary of a report by Euroconsult: World Space Industry Survey: Ten Year Outlook, 1989/90 Edition. It summa- rizes worldwide trends in space activity as they appeared at the end of 1989 and analyses them in terms of their economic, financial and industrial aspects. The analyses are centred on the development of space applications and growth prospects in the corresponding markets for the upcoming lO-year period.
Confidence has finally been restored to the world space industry, nearly four years after the Challenger disas- ter, which set off the most serious worldwide space crisis, and the en- suing series of accidents that grounded vir tual ly all launch systems. The strong comeback of expendable US launch vehicles and increasing capabi- lities of Ariane are eliminating the spectre of non-access to space that loomed over the Western world in 1987.
On the strength of renewed confi- dence in space technology, projects
postponed during the crisis have been resumed and new projects are being defined. The outlook clearly points to resumption in telecommunications, the leading space application, with 173 satellites planned between 1989 and the year 2000. Growth in the Earth observation market, which is essen- tially public and parapublic, has been more qualitative than quantitative, with increased international coordina- tion of systems and their improvement rather than their proliferation. Most of the market for microgravity ap- plications over the next ten years con-
cerns the basic and applied research, as well as the creation of instruments to conduct experiments.
Space science programmes, which had suffered most from the launcher crisis and budgetary restraints, are de- veloping anew. The military market, which had grown considerably in re- cent years, is expanding more slowly in line with East-West d6tente, among the superpowers and other countries as well.
All major future space infrastruc- ture pro jec ts current ly being de- veloped or defined have accumulated budget authorization delays over the past two years. Moreover, the scope of tomorrow's major projects necessi- tates extensive international coopera- tion, as shown by the difficult discus- sions surrounding the International Space Stat ion. A new consensus should yet emerge on a new phase of space exploration, the implications of which extend far beyond the space
, community. Overall, space activity is still highly
concentrated in the USA and the USSR. Nonetheless, the other indus- trialized nations - Japan and especial- ly Europe - are steadily narrowing the gap with increasingly sophisticated and ambitious programmes. They are becoming major partners in major in- ternational cooperative programmes.
International breakdown
The USA, the USSR, Europe, Japan and China represent the five principal centres for space activity in the world today. Among these five leaders, public-sector space budgets and pro- duction levels vary significantly (see Figures 1 and 2).
On the whole, there has been a great increase in space activity over the past decade, based essentially on the explosion of US and Soviet milit- ary activities, and to a lesser extent (in terms of volume) on the extension of commercial markets and the develop- ment of European, Japanese and Chinese space involvement.
Public-sector organizations still play an essential role in the development of space activities, and the expansion of the space industry remains closely tied to space budget levels in each country.
250 SPACE POLICY August 1990
30000
c-
O
20000
10000
5000
1000 - -
5 0 0 - -
I00 - -
50 --
I0
USA
SA (services excluded)1~b- --I"
Europe { unconsolidate
~urope / / I / (consolidated) / / / I
I I 1 I I I I I I I 1 I I I 74 75 76 77 78 79 80 81 82 83 84 85 86 87 88
F i g u r e 1. Space production in the USA, Europe, a Japan and India, 1974--88.
a Production values in Europe for 1987 and 1988 are Euroconsult's estimates. b Including military production, propulsion excluded. c Ground segment excluded. Source: Euroconsult's database, ECOSPACE. Primary data: US Department of Com- merce, SJAC, EEC, ISRO. Exchange rates: IMF and EEC. © Euroconsult, 1989.
There was a hiatus in the growth of applications markets resulting from the launch systems crisis. Confidence has now been restored, and the out- look is one of increasing investment, primarily in telecommunications.
Space budgets
With a total budget for space of $26.4 billion for 1988, divided almost entire- ly between the Department of De- fense ($17.2 billion) and NASA ($8.7 billion), the USA clearly holds the leadership position.
The USSR has released its space budget figures for the first time, re- vealing expenditure of nearly $9 bil- lion on space programmes for 1989.
The third centre for space activity comprises the member countries of the European Space Agency (ESA). Their combined budgets totalled roughly $3.6 billion in 1988, with $2.2 billion under ESA control.
France is the leader among the ESA member states, with $1.063 billion earmarked for the Centre Nationale d'Etude Spatiales (CNES). It is fol-
Reports
lowed by FR Germany ($678 million), Italy ($594 million), the UK ($231 million), Belgium ($80 million), the Netherlands ($65 million) and Sweden ($60 million).
The space budget of Japan, the fourth centre of space activity, totalled $1.24 billion in 1988, of which $887 million was managed by NASDA. Japan's space budget has grown 15% in yen terms, and also in relative terms due to the strengthening of the yen against the dollar.
The fifth centre is China, whose space programme is undergoing full expansion in all areas, and which is currently participating in the world market by offering launching services. Considering its accomplishments, Chi- na probably devotes an amount of money comparable with France and Japan to its space budget.
India has a space budget of $311 million (mostly adminstered by ISRO, the national space agency that is cur- rently developing a comprehensive space programme), and Canada had a space budget of $180 million in 1988, making both important players. Else- where in the world, Brazil has a space programme that should attain laun- ching capability in the mid-1990s. Its space budget can be estimated at $50- 100 million.
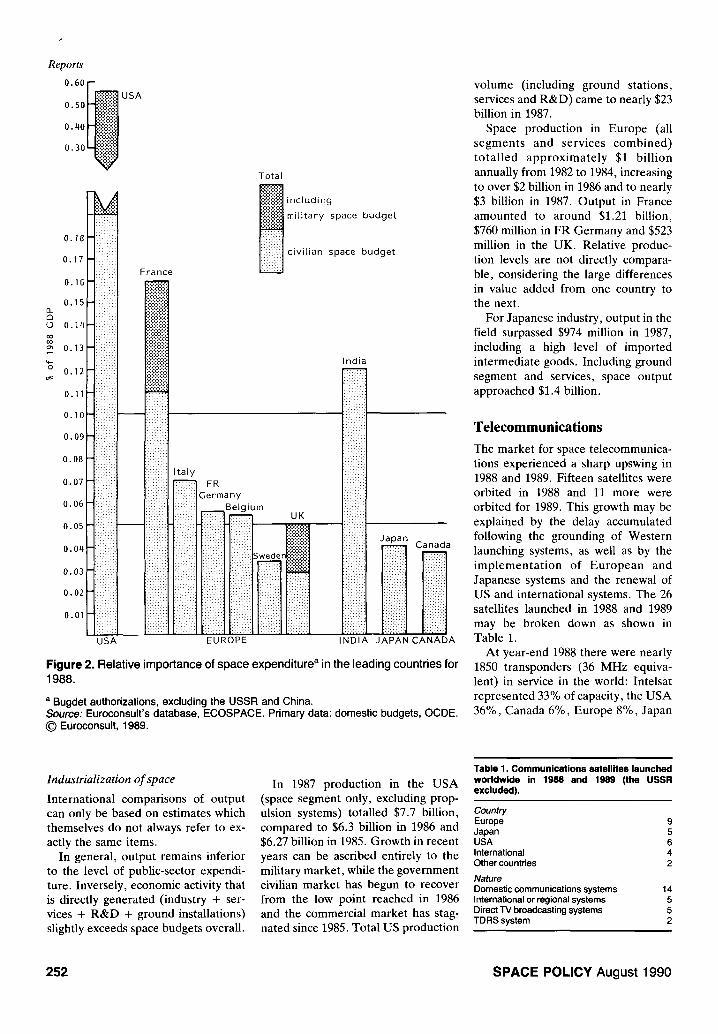
Comparative growth trends in space expenditure are skewed by monetary fluctuations: the strong appreciation of the US dollar, which appeared to accentuate the significant gap between the USA and other countries from 1982 to 1985, did not reflect tangible trends. That gap has narrowed since 1986 with a drop in the exchange value of the dollar. Nevertheless, efforts on the part of the USA will continue to be considerably more developed than those of other countries. The import- ance of the US space budget is far greater than that of the European countries, with 0.19% of its GDP de- voted to civilian space, as opposed to an average of 0.05% for the European countries.
Within Europe, France's efforts are greater than those of other countries (0.11% of GDP devoted to civilian space, as opposed to 0.07% for Italy, 0.055% for FR Germany and 0.03% for the UK).
S P A C E P O L I C Y A u g u s t 1 9 9 0 2 5 1
Reports
° '6°[~us A 0'50~ 1
0 . 3 0 ~
0 . 1 8
0 . 1 7
0 . 1 6
0 . 1 5
0 . 1 4
0 . 1 3
0 . 1 2
0 . 1 1
0 . 1 0
0 . 0 9
0 . 0 8
0 . 0 7
0 . 0 6
0 . 0 5
0 . 0 q
0 . 0 3
0 . 0 2
0 . 0 1
M . . ,
. . : : :
• ::::::
:.::. : x.:.:
:: .::: ......
......
. . : : : :
: :.: :.:
::::%:
:::::%: :::: : : :
. . . .
. . . . .
USA
France
i i i : : iiiiii;ii •
i i i i i
Total
~ i n c l u d i n g
m i l i t a r y s p a c e b u d g e t
civilian space b u d g e t
Italy i:i:i:i:i:i i FR i:i ::::::i I G e r m a n y
ii::ii : B e l g i u m
. . . . . . . : : : ; ; . . . . . . . . . . . . . . . . . . . . . . . . . . . . .
i: i i i! i i !:i:i:i:i:i :::i:!:i:i:: :/.i!:.i !i:i!iii iii?i!:: .~
..... /! :i!tlilil . . . . . . . . . . . . . .
iiiiiii:ii iiiiii:iii ?i:?i:2:: %~::ii ii::::::iii:: iiiii::i
• . : ; : : : : . . . . . .
. . . . . . . . . x : : . : . ......::: .:::,::. : : : : ; ; ' . . . . ... . . . . . .
iiiiiii:i: iiii:,ili:2 :i:i:2:i:i:: EUROPE
India . . . . . . . i:i:i:i:i:i: :i:i:i:i:i . . . . . .
iiiiii!!ii~ii iiiiiii~iiiii iiiiiiiiiiiil iii~iiii!!iii ::iiiiiii!i
iiiiiiii~:~:i i:T::i:i: . . . . . . , . . . . . •
ili!i:iiiiiii Canada ..... , .......,
. . .H. . ........ . ......... . ........... ......... . . . . . .
iiiiiiii%:i . ........... ....., ..... ......., - • , . . . . H ., ....... . , . . . . .
I N D I A J A P A N C A N A D A
Figure 2. Relative importance of space expenditure a in the leading countries for 1988.
a Bugdet authorizations, excluding the USSR and China. Source: Euroconsult's database, ECOSPACE. Primary data: domestic budgets, OCDE. © Euroconsult, 1989.
volume (including ground stations, services and R&D) came to nearly $23 billion in 1987.
Space production in Europe (all segments and services combined) totalled approximately $1 billion annually from 1982 to 1984, increasing to over $2 billion in 1986 and to nearly $3 billion in 1987. Output in France amounted to around $1.21 billion, $760 million in FR Germany and $523 million in the UK. Relative produc- tion levels are not directly compara- ble, considering the large differences in value added from one country to the next.
For Japanese industry, output in the field surpassed $974 million in 1987, including a high level of imported intermediate goods. Including ground segment and services, space output approached $1.4 billion.
T e l e c o m m u n i c a t i o n s
The market for space telecommunica- tions experienced a sharp upswing in 1988 and 1989. Fifteen satellites were orbited in 1988 and 11 more were orbited for 1989. This growth may be explained by the delay accumulated following the grounding of Western launching systems, as well as by the implementation of European and Japanese systems and the renewal of US and international systems. The 26 satellites launched in 1988 and 1989 may be broken down as shown in Table 1.
At year-end 1988 there were nearly 1850 transponders (36 MHz equiva- lent) in service in the world: Intelsat represented 33% of capacity, the USA 36%, Canada 6%, Europe 8%, Japan
Industrialization of space
International comparisons of output can only be based on estimates which themselves do not always refer to ex- actly the same items.
In general, output remains inferior to the level of public-sector expendi- ture. Inversely, economic activity that is directly generated (industry + ser- vices + R&D + ground installations) slightly exceeds space budgets overall.
In 1987 production in the USA (space segment only, excluding prop- ulsion systems) totalled $7.7 billion, compared to $6.3 billion in 1986 and $6.27 billion in 1985. Growth in recent years can be ascribed entirely to the military market, while the government civilian market has begun to recover from the low point reached in 1986 and the commercial market has stag- nated since 1985. Total US production
Table 1. Communications satellites launched worldwide in 1988 and 1989 (the USSR excluded).
Country Europe 9
Japan 5
USA 6
International 4
Other countries 2
Nature Domestic communications systems 1 4
International or regional systems 5
Direct TV broadcasting systems 5
TDRS system 2
252 S P A C E P O L I C Y August 1990
4%, and the rest of the world (exclud- ing the USSR and China) 13%.
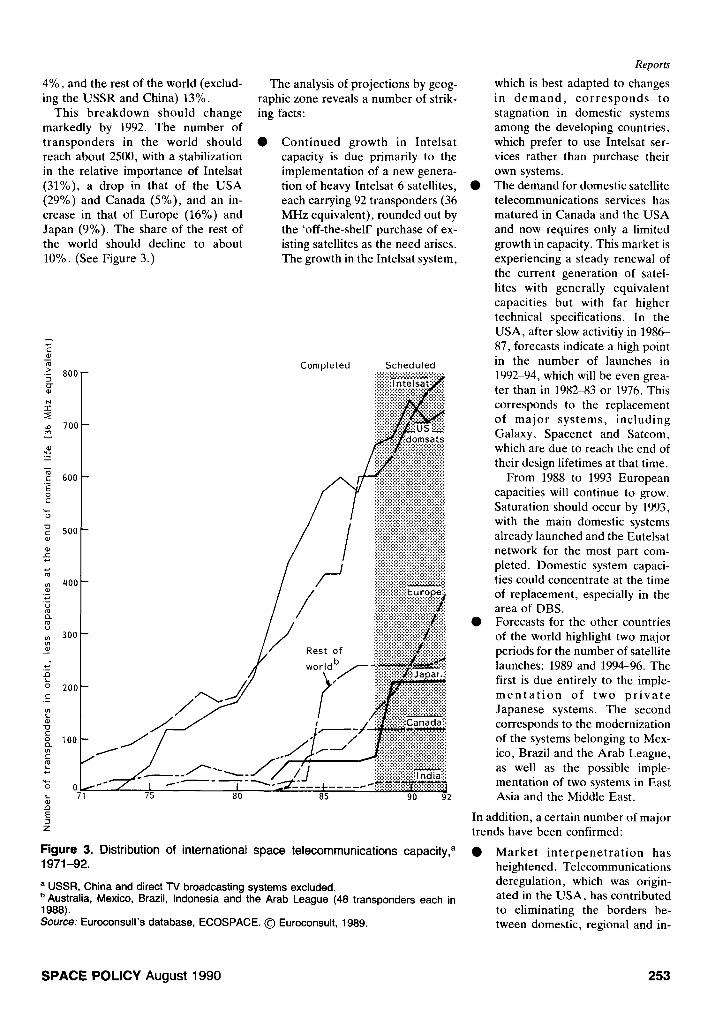
This breakdown should change markedly by 1992. The number of transponders in the world should reach about 2500, with a stabilization in the relative importance of Intelsat (31%), a drop in that of the USA (29%) and Canada (5%), and an in- crease in that of Europe (16%) and Japan (9%). The share of the rest of the world should decline to about 10%. (See Figure 3.)
The analysis of projections by geog- raphic zone reveals a number of strik- ing facts:
Cont inued growth in Intelsat capacity is due primarily to the implementation of a new genera- tion of heavy lntelsat 6 satellites, each carrying 92 transponders (36 MHz equivalent), rounded out by the 'off-the-shelF purchase of ex- isting satellites as the need arises. The growth in the Intelsat system,
E 0)
• -> 800 g N
"r"
700
c 600
c- o)
a)
t - o
E
E
E
E 3
Z
5 0 0
400
3 0 0
2 0 0
100
/
Completed
/ / /
Scheduled . . . . . . . . . . . . . . . ~.:::::::...
ii~i~:i: [ nte lsa t::" .-:: ::::::::::::::::::::::::::::::::::::::::::::: ~:~:~:~:~:~:~I
::':US ~ : domsats
=============================
Rest o f
wor ld b
...........................................
iiiiiiiiiiiiiiiiiiiiiiiiiiiiiiiMiiiiiiii ::::::::::::::::::::::::::::::::::::::::::::
:~:i:~:~:~:i:~:i:~:i:~:i:1:~:~:~:i:1:i:i:i:!
iiiiiiiiiiiiii!iii!iiiiiiiiiii!i!iiiiiiiiii! :!:!:!:!:!:!:!:!:!:~:!:!:!:!:!:i:~:~71:1:1
iiiiiiiiiiiiiiiiiiiiiiiiiiiiiiiiiiiiii
Japar,~!
0 ~ ~ ~ ~ ~ - ~ 71 75 80 85 90 92
Figure 3. Dis t r ibut ion of international space t e l ecommun i ca t i ons capaci ty , a 1971-92.
a USSR, China and direct "IV broadcasting systems excluded. b Australia, Mexico, Brazil, Indonesia and the Arab League (48 transponders each in 1988). Source: Euroconsult's database, ECOSPACE. © Euroconsult, 1989.
Reports
which is best adapted to changes in d e m a n d , c o r r e s p o n d s to stagnation in domestic systems among the developing countries, which prefer to use Intelsat ser- vices rather than purchase their own systems.
• The demand for domestic satellite telecommunications services has matured in Canada and the USA and now requires only a limited growth in capacity. This market is experiencing a steady renewal of the current generation of satel- lites with generally equivalent capacities but with far higher technical specifications. In the USA, after slow activitiy in 1986- 87, forecasts indicate a high point in the number of launches in 1992-94, which will be even grea- ter than in 1982-83 or 1976. This corresponds to the replacement of ma jo r systems, including Galaxy, Spacenet and Satcom, which are due to reach the end of their design lifetimes at that time.
From 1988 to 1993 European capacities will continue to grow. Saturation should occur by 1993, with the main domestic systems already launched and the Eutelsat network for the most part com- pleted. Domestic system capaci- ties could concentrate at the time of replacement, especially in the area of DBS.
• Forecasts for the other countries of the world highlight two major periods for the number of satellite launches: 1989 and 1994-96. The first is due entirely to the imple- m e n t a t i o n o f two p r i v a t e Japanese systems. The second corresponds to the modernization of the systems belonging to Mex- ico, Brazil and the Arab League, as well as the possible imple- mentation of two systems in East Asia and the Middle East.
In addition, a certain number of major trends have been confirmed:
• Marke t i n t e rpene t r a t ion has heightened. Telecommunications deregulation, which was origin- ated in the USA, has contributed to eliminating the borders be- tween domestic, regional and in-
SPACE POLICY August 1990 253
Reports
INTELSAT 6 and 7 3rd GENERATION
Domsats being instalIed
INTELSAT 5 and ~d GENERATION
Domm~ completed
INTELSAT 4 and lrst GENERATION
Domsau completed
LAUNCH PERIODS
:DEMAND::* ! ...... I:::::': ::: ........ " : :: : : .... SYSTEMS 'SATELLITES , :::::SySTF~S :/S.~TZta.rr2s,
USD 10.7 to 13.7 billion (USD 88) DIII~
USD 5.6 billion (USD 88) \ \ ~hV -xlm,lm UNITED~
bmaon i4 ii: (USD 88"~
1972-79 1980-88 1989-2000 SYSTEMS SATELLITES
SYSTEMS S ATELLTI'ES LDWLIKELY I-I]GH L£~:LIKEL'~ HIGH
UNITED STATES
Ihq'KRNATIONAL
EUROPE
OTHER COUNTRIES
1 cx / 3 op
I op
2 cx
3 cx / 2op
(including HP DBS systems °) ( 2 )
TOTAL ~ 12
I0 II op
14 3 op
4 I cx 15 op
9 I ¢x/9 op
(2) (3 op)
37 30
33
17
13
26
(4)
89
9 12 15
5 6 8
11 13 14
15 17 19
(6) (9) (9)
40 48 56
,42 4 6 55
29 3 4 38
39 4 4 48
43 4 9 54
(13) (16) 1(17)
153 173 195
* Agency systems included o HP DBS : high power direct broadcasting satellite systems # excluding ground spare
I:: :::::::::::::::::::::::::::::::::: I BREAKDOWN BY PRIME CONTRACTORSHIP , : PRINCIPAL.PLATF0~S., MILITARY PLATFORMS INDICATED 1N ITALICS
UNITED
~TATES
.'ANADAi
EUROPE
H U G H ~ S [ I N - - A T 4 MARISAT HS 333 HS 376 LEASAT
R C A CTS SATCOM SATCOM 3000/4000
INTELSAT 6 HS 393 HS 601
SATCOM 5000/7000
FORD NATO 2, 3 SKYNET 1, 2 INTELSAT 5 INSAT FS 1300
T R W DSCS 2 FLF_.ETSATCOM FLEETSATCOM TDK.~ TDRSS
GF-. B S DSCS 3 BS 2 'llfformes RCANAVSTAR GPS Block 2R
R O C K W ' E I T . NAVSTAR GPS Block l&2
LOCY-d'q'b-~I') M I LSTA R
SPAR CTS HZa:MZS AXaX D o-ruoHES) A~n( E (RCA)
OTS
ARABSAT
• --]' TDF I/TV SAT, ff'~..E -X --
/ E C S ct DER/VES SIO:NET 4
/ SYMPHON"IE
M B B
BAe
MATRA / MELL-"O c..s (FOP.D) CS 2 (FORD)
,JAPAN TOSHIBA BS (o E) BS 2 (o E)
NEC
~ _ F.u~.]sat 2
~.~ CEBUS 1 0 0 / 2 0 0 / 3 0 0 -
N • NATO4 OLYMPUS Innm~ 2
- EUROSTAR "I'IR.EL~M 2
cs 3 (FORD) ETS 5'~
BS 3 ~CA) / ETS6
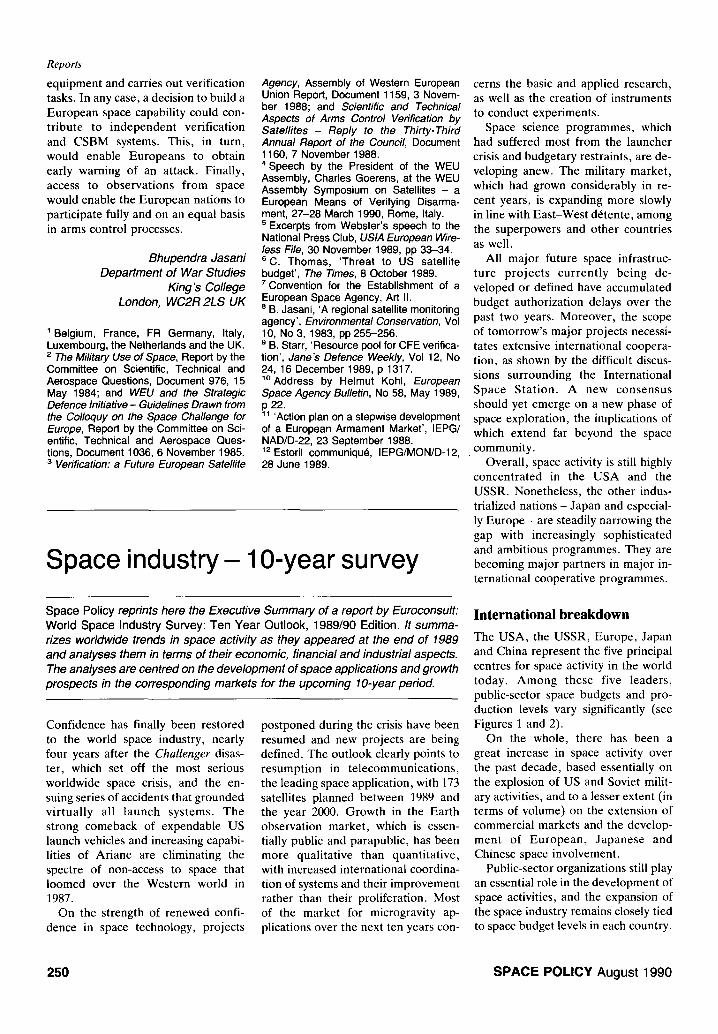
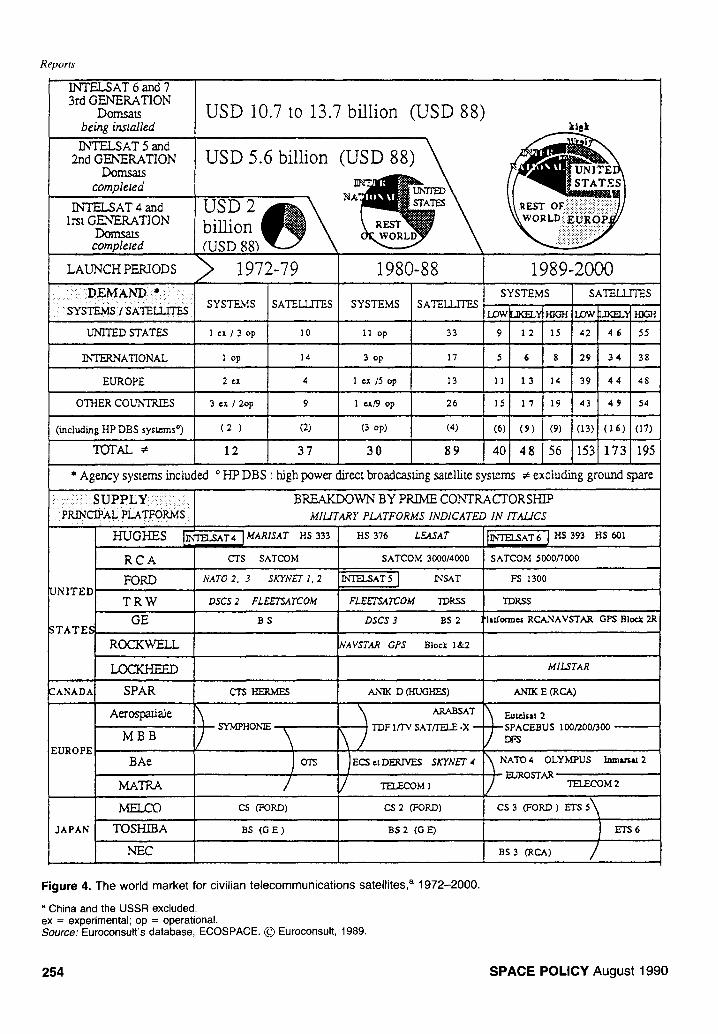
Figure 4. The world market for civi l ian te lecommunicat ions satell i tes, a 1972-2000.
a China and the USSR excluded. ex = experimental; op = operational. Source: Euroconsult's database, ECOSPACE. © Euroconsult, 1989.
254 S P A C E P O L I C Y August 1990

ternational systems. New satellite systems are increasingly multipur- pose, providing all types of ser- vices: telephony, TV broadcast- ing, data t ransfer and com- munications with mobile units.
• Continued growth of space tele- communications depends on the development of new services, in- cluding decentralized digital busi- ness communications, direct TV broadcasting and communica- tions with mobile units. Those systems are costly to implement. In the area of business com- munications the US market for private dispersed networks con- tinues to grow rapidly. That growth has been made possible by considerable progress in ground station technology and a relaxa- tion of regulations. As of mid- 1989 the ten largest end-users of VSAT networks in the USA own- ed 25 000 VSATs combined. That is a growing market in which space technology is fundamental- ly competitive, yet its worldwide expansion is hindered by regula- tions that are still too restrictive; European telecommunicat ions monopolies, in particular, are ex- ercising caution with respect to this new type of network.
• Despite the launching of several DBS satellites between 1988 and 1990, the outlook for this market is still uncertain. Rapid advances in receiving antenna technology will also encourage the use of satellites that are less powerful and less costly than those initially planned.
• In the business communications and DBS markets, strong adv- ances in cable systems technology have challenged the validity of certain investments in space seg- ment, although both technologies (satellite and cable) are competi- tive and complementary at the same time. In addition, the com- plementarity of the two technolo- gies enables them to serve as back-ups for one another. Intel- sat, for example, has supplied res- toration capacity several times following cable breakages (in- cluding TAT 8).
The competitiveness of optical fibres is increasing rapidly over the important market segment of high-speed point-to-point com- munications on trunk lines. In- vestments made to install optical- fibre cables over long distances now largely exceed those in- volved in satellite systems in the USA, Japan, and across the Paci- fic and Atlantic Oceans, whereas the trend was the opposite over the past ten years. The market for mobile telecom- munications services is not sub- ject to competition from optical- fibre cables, but ground systems are developing very rapidly (par- t icularly cellular te lephone) . Several competing satellite pro- jects have been proposed with different designs, depending on the type and quality of services to be p r o v i d e d . N e v e r t h e l e s s , although the long-term outlook for the market of mobile satellite systems is promising, in terms of value, it concerns primari ly ground equipment, as little orbit- al capacity is required.
World market competition
On the whole, the world market for telecommunications nearly tripled be- tween the first and second generation of satellites, moving up from $2 billion for 37 satellites with an average design lifetime of eight years to nearly $6 billion for 89 satellites with an average design lifetime of nine years (Figure 4). At the same time, average satellite price has increased to $63 million from $54 million between the two periods.
Forecasts for the period 1989-2000 project a market of $10.7-13.7 billion, which is nearly twice that of the pre- vious period. This market represents between 153 and 195 satellites, with an average price per telecommunications satellite (all categories combined) of $70 million. For the first time in eight years , a net upswing has been observed with respect to previous forecasts, which were marked by regu- lar delays in projects.
The supply of telecommunications satellites at the international level can be described as limited to the biggest
Reports
US companies : Genera l Motors (which took control of Hughes Air- craft in 1985), Ford and GE (which took control of RCA early in 1986). Those three companies alone have supplied three-fourths of the world's commerc i a l marke t for second- generation satellites.
Current trends favour US industry, which benefits from the position it has achieved at the international level, the advance of the US commercial market and the substantial growth of the milit- ary market. The military market in the USA, which is nearly ten times larger than the civilian market, is essential to the US communications satellite in- dustry by virtue of its size. It indirectly strengthens that industry's position in civilian systems through funding of R&D and induced economies of scale achieved in platforms and subsystems.
Considering the high risk inherent in the launching and orbiting phase of satellites, demand is now shifting to- wards the supply of operational satel- lites available in orbit (see BSB and Aussat 2). The shift towards placing launching responsibility on satellite prime contractors gives an edge to leading US manufacturers, who have the necessary financial muscle and can spread risks out over longer series.
At the same time, the European satellite industry is strengthening its presence both in the European domes- tic market and internationally. On the whole, European manufacturers, like their US counterparts, dominate their domestic market, cooperate on the supply of international systems and do battle on the domestic markets of non- manufacturing countries.
There are some exceptions to this situation, however. In the first place, US industry has entered the European market with the supply of four 'off- the-shelf' satellites for private systems (BSB and Astra). Secondly, while European industry has begun to emerge internationally (Arabsat, In- marsat 2), it has yet to break into the US market.
Whereas Eu ropean industry is booming, buoyed by the growth of its market, integration of supply is still far from the degree existing in the USA; six European prime contractors share roughly one-fourth of the world
SPACE POLICY August 1990 255
Reports
71 72 73 74 75 76 77 78 79 80 81 82 83 84 85 86 87 88 89 90 91 92 93 94 95 96 97 98 99 2000
USA Completed iiiii!!i:~:i~i~'~;~i iiiiiiiii!iiii!iii!i!i!i!!!i! ~iiiiiiiiiiii iiiiiiiii!i!i!!!!i!ilili~ii~ii~i iii!ii!!i!i!i!i!!!!!!iiiiii Nimbus GEl • • • i i i i i i i i i i i i i i i i !!~Eiii i i i i i i i i i i~E~iiiiiiiiii ii~'"i'iiiiiiiiil Seasat(sea) " Lockheed i~ i~ I ::i::!::!i!i!iiii::ili!iiiiiiiiiiii i i i i i i i i i ! i!{! i l i i i i i i i i i i i i ! i i i : 'i" 'ii'i'i'i'i' Landsat(Earth) GE @l •2 • 3 14 15 i {E 'os ' a {~ i~i~i i~i~i i i i i !!:!::::::::::i i: i i i~ i Topex(sea) !:i:!:!l:'girchild ~ : i : i : ! : :::i::::i ::::::::::::::::::::::::::: i:i: :!:.:[::::[:i::: POp ::iiiiiiiiiiiiiill iii iiii S: ! iiiiiiiiiiil EUROPE iil l i " i i i i ::i::i::!iiiiiii iiiiiiiiiii:: ESA ~i!::!!!i!!!i!i!i!i!i!iiiiiiiiiii! iiii!ii!ii!!!!~::!i~i~::~i iiiiiiii ::::::i::i::iiiiiiiiiiiiiiiiiii iiiiii!i!i!i!i!!i!i:i !I
• '.'.'.'.'.'.'.'.'.'.:::::: :::::::::::: :::::::: ',:::::::::::: ;:::: ::::::', ERS (sea) Dorn er J~i.::,!.!,i:i,::::: i:i:i:i:i:!.i.i.~,,,:,,,~,S,,,2,,,:,i,i,i,i,i,i,i,i,i,i,i,i,i,:,:,:,i,i,i,i,i ::-::-::-::-i-i.::
POP :::::::::::::::::::::::: : ::::: :::::: ::: : i i i i i '~i~i ' i i i i i i i i i i i i! i iiiii 1 F R A N C E ii!!~ ~::iiii::iiii::i::::i ::i::::::i::ii!!!ii ~!i!iiiiiiii iiiiiiiiiiiiiiiiiiiiiiiiiiii!iiiiiiiiiiiii!. !i:;:;!~ i~ S P O T ( E a r t h ) M a t r a ~ S P 0 T 1 • ~ . 3 . . . , , . . . . , , D.4. iiiiiiiiiiiiiiiiiiiiiiiiiiiiiii::iiiii::ii~i5iiiiiiiiiiiiiii
Poseid o n ( sea ) J ~n~:i:i::::i:i:i~i~::!~!~::~!~i~!~!~!~!~i~::!~!~!~!~!:::::!~::!~i!i~i~i]
JAPAN M 0 S ( sea ) . . . . . . . . N E C ~ ! ~ ! ! ! ! i ! !!!! !!!i!i!i!i! ii'~ ~'~'~'~ i ~ i i i iiiii i i~i,.~,-'i i i i i i i i l i i i
JERS (Earth)
I N D I A J • planned ~ii:iiiiiiiiiiiiiiiiiiiiiiiiiiiiiiiiiiiiiii~i~i:i:i~i~!~!~!!!!i!iii!iiiiiiiiiiiii iii i i iii ii iiiiiiiiiiiiiiiii:~i~iiiiiiiiiiiiiil Baskhara ' : : 2 ! ! i iiii i iii iiii i i i i iiii iiiiiiiiiiiii::iiiiii~::!i!::~::~il L ii i ii i !i i iiii i iii iiii i iii ~ I RS Baskhara 1 ~ v ' . v ' . " " " : : i : i : i : i : : ::: :::::::::::::::::::" HAL ~ :::::::::::::::::::::::::::::: c A N A D A ~:~i:~:~::::~:~:.:: . . . . . . . . . . . :::!!iii!iiiiiiiiiiiiiiiiiiiiiiiiiiiiiiiiiiiiiiiiiiiiiiiiiiiii'
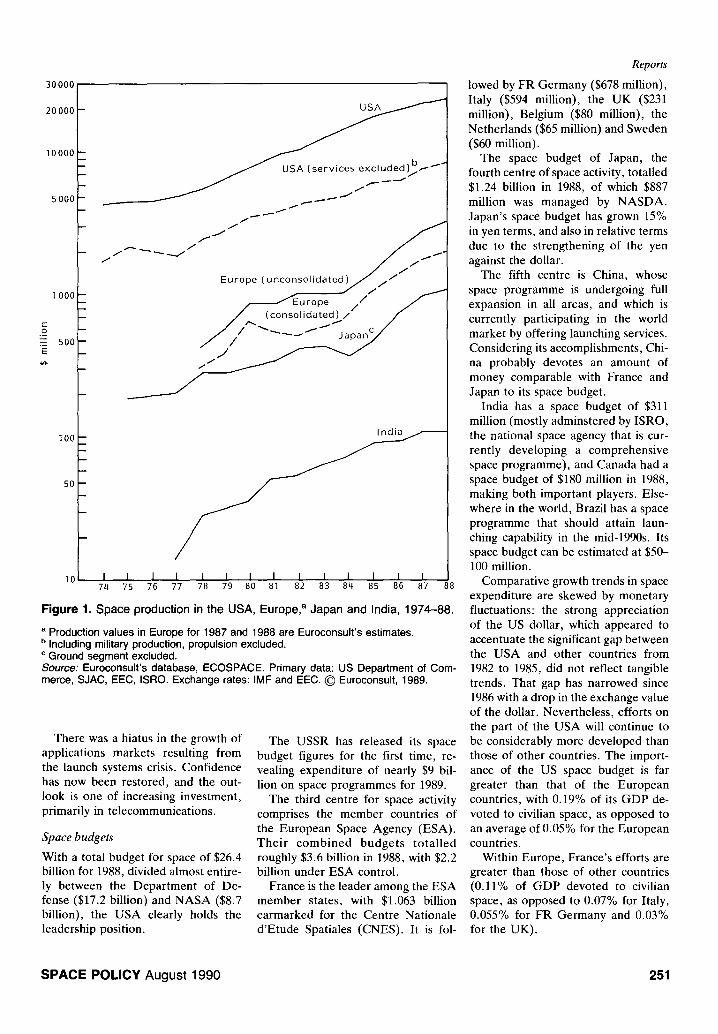
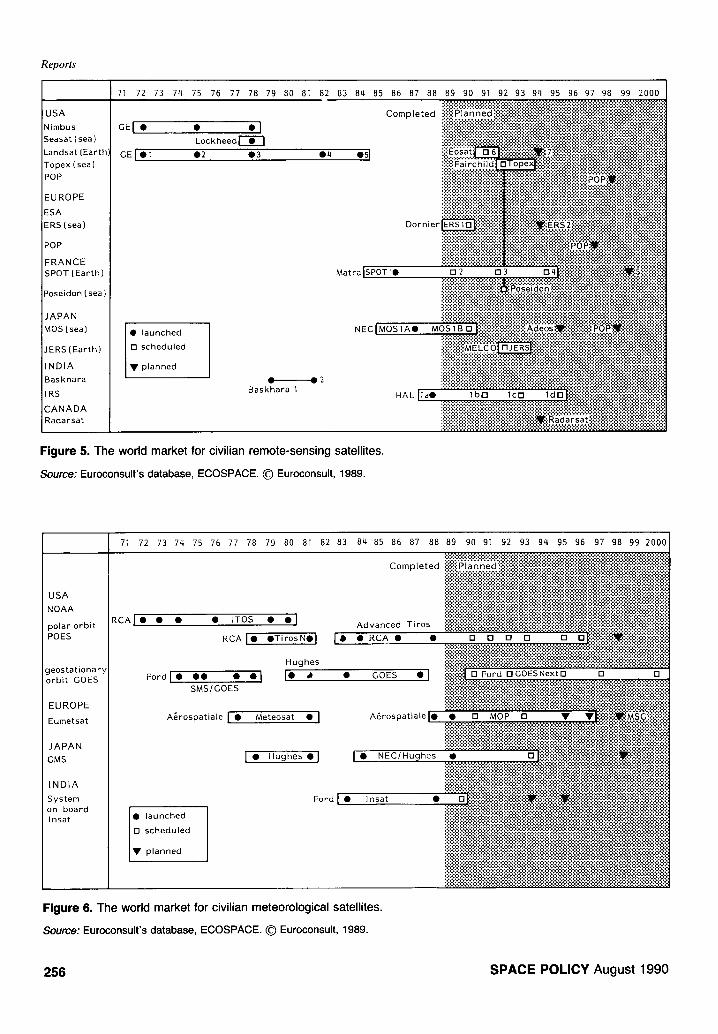
Figure 5. The world market for civilian remote-sensing satellites.
Source: Euroconsult's database, ECOSPACE. © Euroconsult, 1989.
71 72 73 74 75 76 77 78 79 80 81 82 83 84 85 86 87 88 89 90 91 92 93 94 95 96 97 98 99 20001
USA NOAA
RCAI • • • • TOS • • I . . . . . !!i!!Ziiiii i i i i i i i~Z!i! ==iiiiiiiiiiiiiiiiiiiiiiiii~iiiiiz:;::~i~:;!iiiiiiiiiiiiiii~i!z!i!iii polar orbit ~avancea l l ros :::::::::::::::::::::::: •:•:••••••••••':•:•:•:•:•:•••:•:•:':•:•:•••••••••:•••••:•:•:•:•:•••:•:•:•:•:•:•:'••• poEs RGA • RGA • • ' = ........
Hughes :: :: i :: ! :: ! ! ! !iiiiii i iiii::iii::i::i::i~iii!i !i!!!iiiiiiiiiii::i::i::iii::ill iiiiiii i i i i!il i iiiiil i lilili i iiiiiiiiiiiiiiiii!iiiiii!ii i iii geostationary F o r d ~ ~ I • ~ • GOES •1 ~ ! ! ~ .. . . . . . . . . . . a'"
EUROPE Eumetsat A~rospatiale I • Meteosat • I A ~ r o s p a t i a l e ~ ::::::::::::::::::::::::::::::::::::::::::
JAPAN ~ ! i ~ i iiiiiiiii!~!i .u hes, I iiiiiiiiiiiiiiiiiii!il
INDIA System Ford ['O" ~ O~'i!! i !! i i i i i i i i i i i i i i i~!!!~!!! i ! i~i:: i i i : i ! i i~i ::im!ii::ii!iiiii!i!!i!i!i!i!i!i!iiii on board ~ 'i ~ili~iiiiiii~!:!~i~: i!i !~iiil iii iii iii i~i~i~i~i~ii~i~iii
• launched iiiii i i i i i ::::::::::::::::::::::::::::: ::::: ~ :i:: :~::::::::::::::::::::::f: Inset rl scheduled i!i!;iiiiiiiii:~iii~iii~::~:iiii~i~!~!~!~!!!~!~!~!~!~!~!~!~!~!~!~i:!~:i!~!~i~iii::i~i~i iiiii~iiii!i!{!iiiiliifliii{iii~
• p la n ned iiiiiii:ji!ii!:: iii!iiiiiiiii!iiiili::i::i::ili::ii!:!i i!i!i!i!i!i!i!i!i ::iiiii i:: iii ::~iiii ::iii~iiiiiiiiiiii :i!ii;i::iii!i ::i!ii i
Figure 6. The world market for civilian meteorological satellites.
Source: Euroconsult 's database, ECOSPACE. (~ Euroconsult, 1989.
256 SPACE POLICY August 1990
market. Yet the process of concentrat- ing supply has begun with the creation of European consortia.
The combination of cross-border cooperation and industrial concentra- tion within the individual countries has enabled European space com- panies to tender for the supply of international systems to an increasing extent. Although the European space industry supplied only six telecom- munications satellites in the world be- tween 1981 and 1985, it supplied 14 between 1985 and 1989, and 17 are planned for the period to 1994.
Japan's telecommunications satel- lite industry is now emerging as a resul t of coope ra t ion agreements signed with US companies and of the creation of a series of technological satellites (ETS). However, it has been unable to establish a place for itself on the private domestic market. Though it cannot yet compete on the interna- tional market, Japanese industry will become a full-fledged competitor by the mid-1990s thanks to expertise it is gaining in today's ETS-5 and 6 ex- perimental satellites.
Earth observation market
The Earth observation market is the second most important field of space a p p l i c a t i o n s , fo l lowing t e l ecom- munications (see Figures 5 and 6). Only now is it entering the commercial phase. Ear th observat ion systems (meteorology and remote sensing) should not reach the break-even point before the second half of the 1990s.
The market represented by the supply of space segment for these sys- tems is relatively closed. Programmes are financed by agencies, and thus they are most often carried out by the c o r r e s pond ing na t iona l indus t r ia l companies. The market is relatively limited and at the worldwide level (excluding the USSR) represents an average of two satellites per year for the upcoming decade for civilian meteorology, and two or three satel- lites a year for civilian remote-sensing applications.
A n o p e r a t i o n a l m e t e o r o l o g i c a l satellite system has been in service for over 20 years in the USA, and perma- nent systems have recently been im-
plemented in Europe, Japan and In- dia. The data from these systems are extensively used and for the most part they are distributed on a cost-free basis. Private operation does not seem possible. Supply and demand for meteorological data do not follow classical market laws. The move to- wards payment for space data runs up against a proliferation of interme- diaries concerned by the end use of forecasts and who rarely contribute directly to offsetting costs. Neverthe- less, the economic efficiency of these systems, gauged in terms of savings achieved in all user sectors and com- pared to their overall cost (manufac- ture, launching and operation) is the highest of space applications, with an estimated ratio of 10:1.
For a long time offer was characte- rized by the US monopoly, until the commissioning of the SPOT system in 1986. Thanks to its high resolution, SPOT represented a major step in the d e v e l o p m e n t of c ivi l ian r e mo te - sensing systems.
The situation has been steadily moving towards stiffer competition with the entry of countries such as the USSR into the commercial market. There should be a proliferation of remote-sensing systems in the 1990s. In light of operating costs there is little certainty that all systems will be re- placed. In the short run these systems are increasing the services available to receiving stations, which are becoming m u l t i p u r p o s e and for which the amount and quality of equipment is increasing as compatibility between systems is sought. Clearly, however, Landsat, using relay satellites, and SPOT, with its considerable storage and transmission capability, are the only systems of worldwide and com- mercial scope.
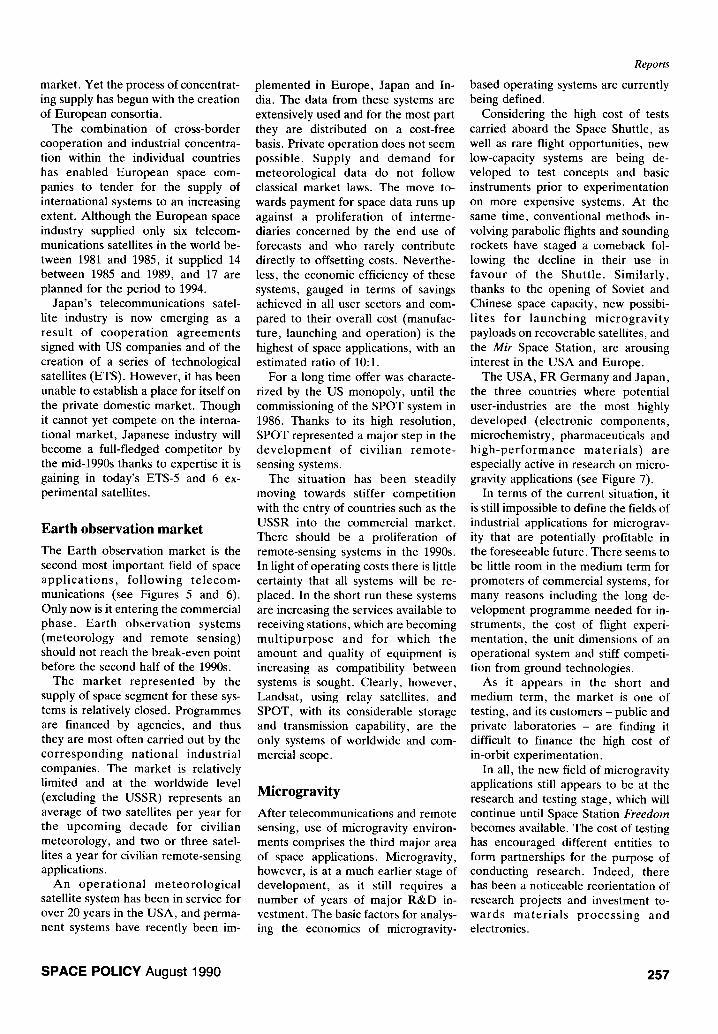
Microgravity
After telecommunications and remote sensing, use of microgravity environ- ments comprises the third major area of space applications. Microgravity, however, is at a much earlier stage of development, as it still requires a number of years of major R&D in- vestment. The basic factors for analys- ing the economics of microgravity-
Reports
based operating systems are currently being defined.
Considering the high cost of tests carried aboard the Space Shuttle, as well as rare flight opportunities, new low-capacity systems are being de- veloped to test concepts and basic instruments prior to experimentation on more expensive systems. At the same time, conventional methods in- volving parabolic flights and sounding rockets have staged a comeback fol- lowing the decline in their use in favour of the Shutt le . Similar ly , thanks to the opening of Soviet and Chinese space capacity, new possibi- l i tes for l aunch ing m i c r o g r a v i t y payloads on recoverable satellites, and the Mir Space Station, are arousing interest in the USA and Europe.
The USA, FR Germany and Japan, the three countries where potential user-industries are the most highly developed (electronic components , microchemistry, pharmaceuticals and h i g h - p e r f o r m a n c e ma te r i a l s ) are especially active in research on micro- gravity applications (see Figure 7).
In terms of the current situation, it is still impossible to define the fields of industrial applications for micrograv- ity that are potentially profitable in the foreseeable future. There seems to be little room in the medium term for promoters of commercial systems, for many reasons including the long de- velopment programme needed for in- struments, the cost of flight experi- mentation, the unit dimensions of an operational system and stiff competi- tion from ground technologies.
As it appears in the short and medium term, the market is one of testing, and its customers - public and private laboratories - are finding it difficult to finance the high cost of in-orbit experimentation.
In all, the new field of microgravity applications still appears to be at the research and testing stage, which will continue until Space Station Freedom becomes available. The cost of testing has encouraged different entities to form partnerships for the purpose of conducting research. Indeed, there has been a noticeable reorientation of research projects and investment to- w a r d s m a t e r i a l s p r o c e s s i n g and electronics.
SPACE POLICY August 1990 257
Reports
70 71 72 73 74 75 76 77 78 79 80 81 82 83 8q 85 86 87 88 89 90 91 92 93 94 95 96 97 98
FRG/MBB FRGIOHB
FRG/Dornier
Sweden/ESA
Sweden/FRG/ESA
FRG/DFVLR
FRGIMBB
ESA MBB/GE/BMFT
ESA FRG/ESA
-ESAINASA--
NASA/
international
NASA
NASA/ companies
NASA
NASA/private sector
NASA
N A S D A
Completed ~!~Sc h.ed u ~ e ~ i ~ i ~ i ~ i ~ i ~ i ~ i ~
. . . . . . . . . • ................................... W::::iiiiiiiiiii~i~iii~i~iiii;#!iii ii!iiii!iiiii!!iii!i T e x u s s o u n d i n g r o c k e t
M i k r o b a " ' " : ' : ' ':':':'" "i?!'!?!!?~:! i:i:i:i:i:i:i:i:i:i:i:i:i:i:i:i:!:i:i:i:i:i:i:i:i:i:i ::: , :,: • .,. •, ,.................................>
S p a c e c o u r i e r :C::i:i:::i:ii:i]:i~iii:!:iiiii!!iiii!i!iiii!iii!ii!iii!iiiii!iii!iiiiiiiiiill
M A U S c o n t a i
S P A S ph
Eurec
A Apollo
Skylab GAS on $1 on each fli,
Spar soun l w v w
T T 5 0 0 A O - 0
Figure 7. Microgravity experimentation programmes in Europe, the USA and Japan, 1970-89 and 1989-98. a
a As programmed at rnid-1989. Source: Euroconsult's database ECOSPACE. © Euroconsult, 1989.
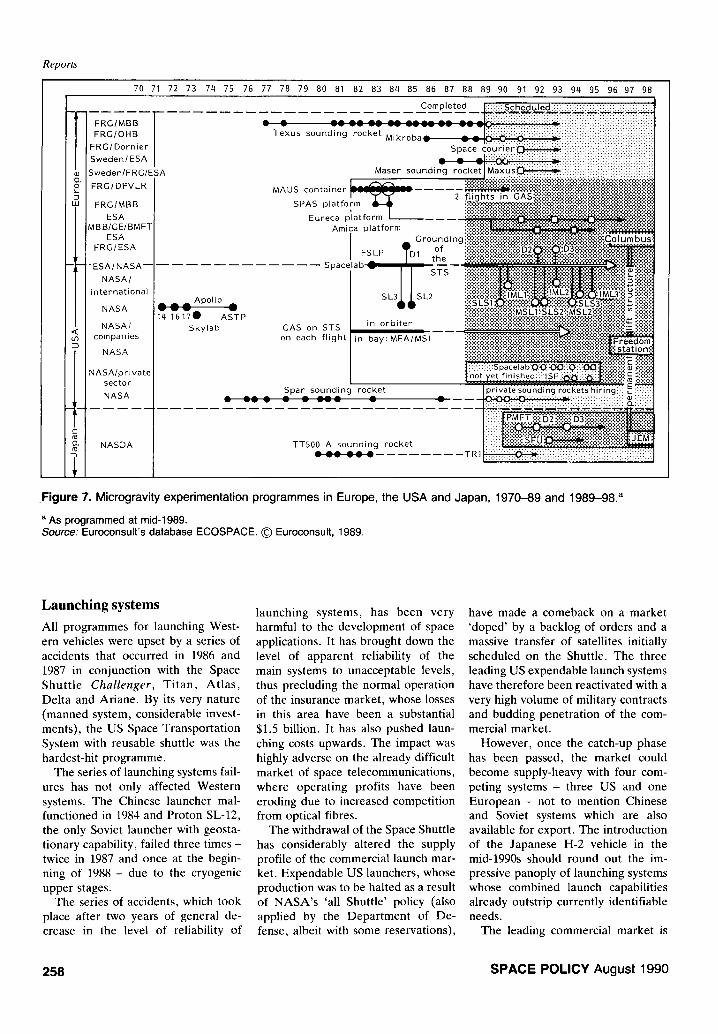
Launching systems All programmes for launching West- ern vehicles were upset by a series of accidents that occurred in 1986 and 1987 in conjunction with the Space Shuttle Challenger, Titan, Atlas, Delta and Ariane. By its very nature (manned system, considerable invest- ments), the US Space Transportation System with reusable shuttle was the hardest-hit programme.
The series of launching systems fail- ures has not only affected Western systems. The Chinese launcher mal- functioned in 1984 and Proton SL-12, the only Soviet launcher with geosta- tionary capability, failed three times - twice in 1987 and once at the begin- ning of 1988 - due to the cryogenic upper stages.
The series of accidents, which took place after two years of general de- crease in the level of reliability of
launching systems, has been very harmful to the development of space applications. It has brought down the level of apparent reliability of the main systems to unacceptable levels, thus precluding the normal operation of the insurance market, whose losses in this area have been a substantial $1.5 billion. It has also pushed laun- ching costs upwards. The impact was highly adverse on the already difficult market of space telecommunications, where operating profits have been eroding due to increased competition from optical fibres.
The withdrawal of the Space Shuttle has considerably altered the supply profile of the commercial launch mar- ket. Expendable US launchers, whose production was to be halted as a result of NASA's 'all Shuttle' policy (also applied by the Department of De- fense, albeit with some reservations),
have made a comeback on a market 'doped' by a backlog of orders and a massive transfer of satellites initially scheduled on the Shuttle. The three leading US expendable launch systems have therefore been reactivated with a very high volume of military contracts and budding penetration of the com- mercial market.
However, once the catch-up phase has been passed, the market could become supply-heavy with four com- peting systems - three US and one European - not to mention Chinese and Soviet systems which are also available for export. The introduction of the Japanese H-2 vehicle in the mid-1990s should round out the im- pressive panoply of launching systems whose combined launch capabilities already outstrip currently identifiable needs.
The leading commercial market is
258 SPACE POLICY August 1990
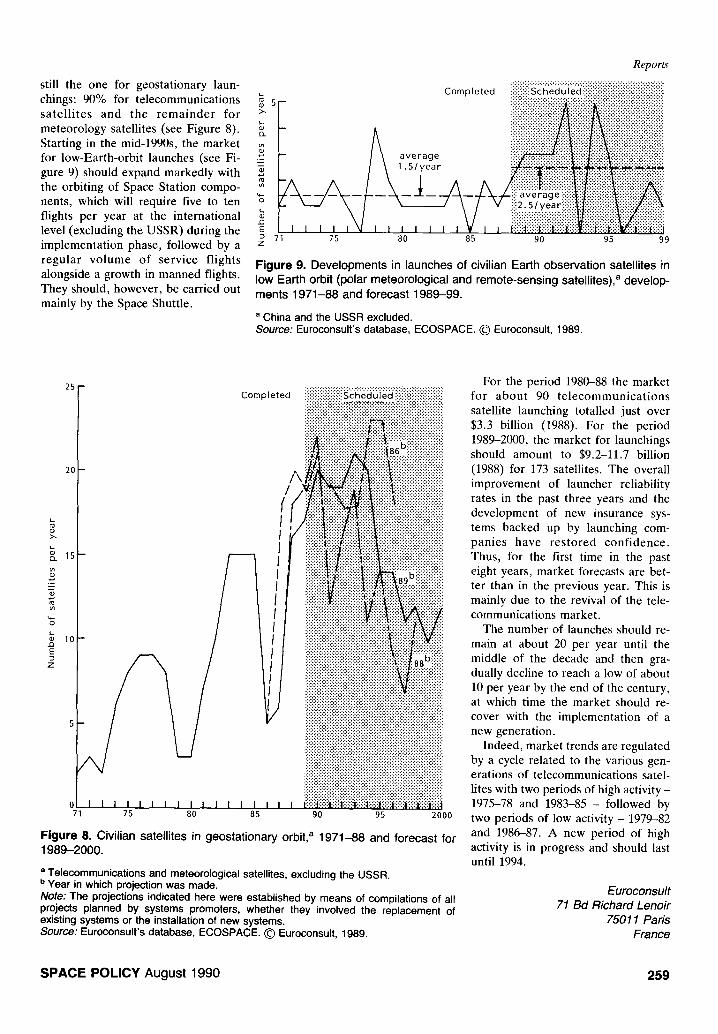
still the one for geostationary laun- L
chings: 90% for telecommunications ~ 5~ sa te l l i t e s and the r e m a i n d e r for > meteorology satellites (see Figure 8). Q .
Starting in the mid-1990s, the market for low-Earth-orbit launches (see Fi- .Z gure 9) should expand markedly with the orbiting of Space Station compo-
q_
nents, which will require five to ten o flights per year at the international .~ level (excluding the USSR) during the E
71 implementation phase, followed by a z regular volume of service flights alongside a growth in manned flights. They should, however, be carried out mainly by the Space Shuttle.
Reports •;•;;:;:••:•:•:.:•;•;•;•••;•••:•:•;•;•;•;•;•:•••••••••2;•:•:•••:•••;•;•••;•;.:•••:•••:•;•;•
_ /~ average ~ ! ~ ii!i!i!iiiiiiiiiiiiiiiiiii: Completed ! iiii:ili:iii!!iiiiiiiiiii!i i~u.,iiiiiii!iiii!ii,,iiiiiiiiiiiiiiiii.iiiiii!iiii!ii!ii!i
75 80 85 90 95 99 Figure 9. Developments in launches of civilian Earth observation satellites in low Earth orbit (polar meteorological and remote-sensing satellites), a develop- ments 1971-88 and forecast 1989-99.
a China and the USSR excluded. Source: Euroconsult's database, ECOSPACE. © Euroconsult, 1989.
F
2C
>.
JD E
Z
Completed
0 71 75 80 85 90 95 2000 Figure 8. Civilian satellites in geostationary orbit, a 1971-88 and forecast for 1989-2000.
a Telecommunications and meteorological satellites, excluding the USSR. b Year in which projection was made. Note: The projections indicated here were established by means of compilations of all projects planned by systems promoters, whether they involved the replacement of existing systems or the installation of new systems. Source: Euroconsult's database, ECOSPACE. © Euroconsult, 1989.
For the period 1980-88 the market for abou t 90 t e lecommunica t ions satellite launching totalled just over $3.3 billion (1988). For the period 1989-2000, the market for launchings should amount to $9.2-11.7 billion (1988) for 173 satellites. The overall improvement of launcher reliability rates in the past three years and the development of new insurance sys- tems backed up by launching com- panies have res to red confidence. Thus, for the first time in the past eight years, market forecasts are bet- ter than in the previous year. This is mainly due to the revival of the tele- communications market.
The number of launches should re- main at about 20 per year until the middle of the decade and then gra- dually decline to reach a low of about 10 per year by the end of the century, at which time the market should re- cover with the implementation of a new generation.
Indeed, market trends are regulated by a cycle related to the various gen- erations of telecommunications satel- lites with two periods of high activity - 1975-78 and 1983-85 - followed by two periods of low activity - 1979-82 and 1986-87. A new period of high activity is in progress and should last until 1994.
Euroconsult 71 Bd Richard Lenoir
75011 Paris France
S P A C E P O L I C Y August 1990 259