Embed Size (px)
Citation preview
Soybean Outlook
Cory WaltersUniversity of Kentucky
Extension Section Crops OutlookAAEA, Pittsburgh July 24-26, 2011
19
70
19
72
19
74
19
76
19
78
19
80
19
82
19
84
19
86
19
88
19
90
19
92
19
94
19
96
19
98
20
00
20
02
20
04
20
06
20
08
0.00
2.50
5.00
7.50
10.00
12.50
15.00
17.50
20.00
22.50
25.00
27.50
30.00
0.00
2.00
4.00
6.00
8.00
10.00
12.00
14.00
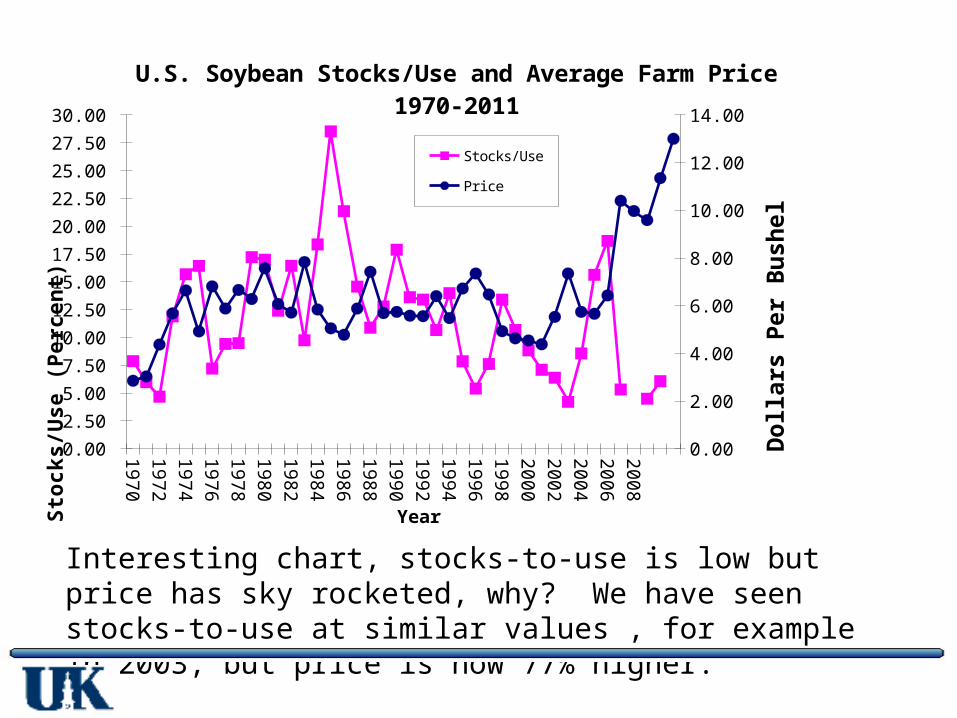
U.S. Soybean Stocks/Use and Average Farm Price 1970-2011
Stocks/Use
Price
Year
Sto
ck
s/U
se
(P
erc
en
t)
Do
llar
s P
er B
ush
el
Interesting chart, stocks-to-use is low but price has sky rocketed, why? We have seen stocks-to-use at similar values , for example in 2003, but price is now 77% higher.
Should we expect to maintain the current price level in the foreseeable future?
– Need to answer a few questions to get towards an answer
• Have there been production shortfalls?• Increased demand?
– From who?» Importing Countries?» Domestic demand?
• Is this year’s crop in jeopardy? • Is it speculators?
19
71
19
73
19
75
19
77
19
79
19
81
19
83
19
85
19
87
19
89
19
91
19
93
19
95
19
97
19
99
20
01
20
03
20
05
20
07
20
09
20
11
0
500
1,000
1,500
2,000
2,500
3,000
3,500
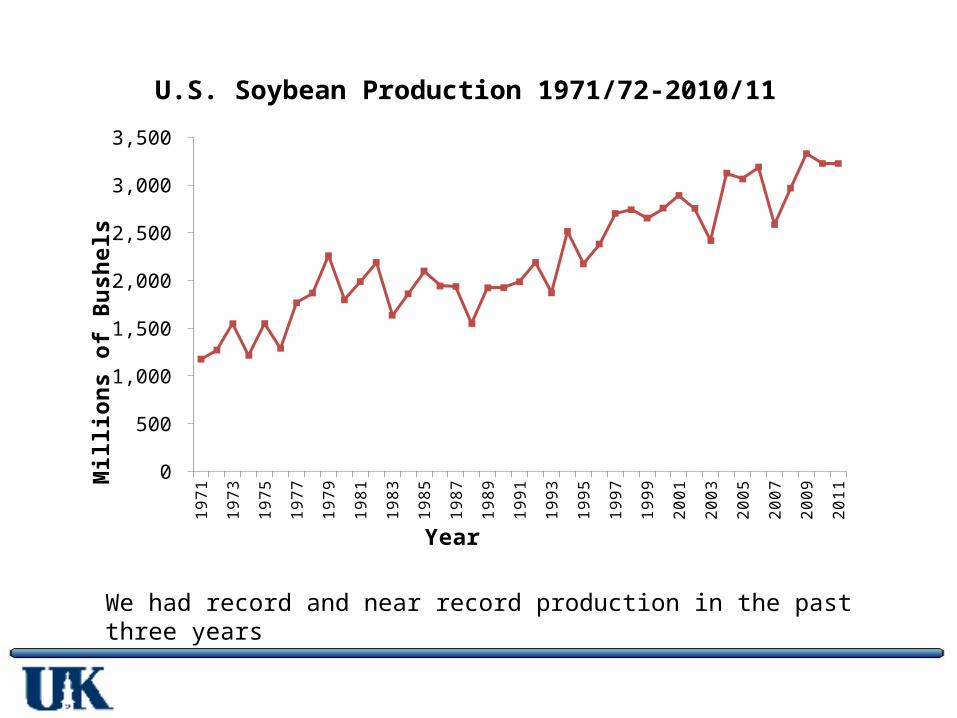
U.S. Soybean Production 1971/72-2010/11
Year
Mill
ion
s o
f B
us
he
ls
We had record and near record production in the past three years
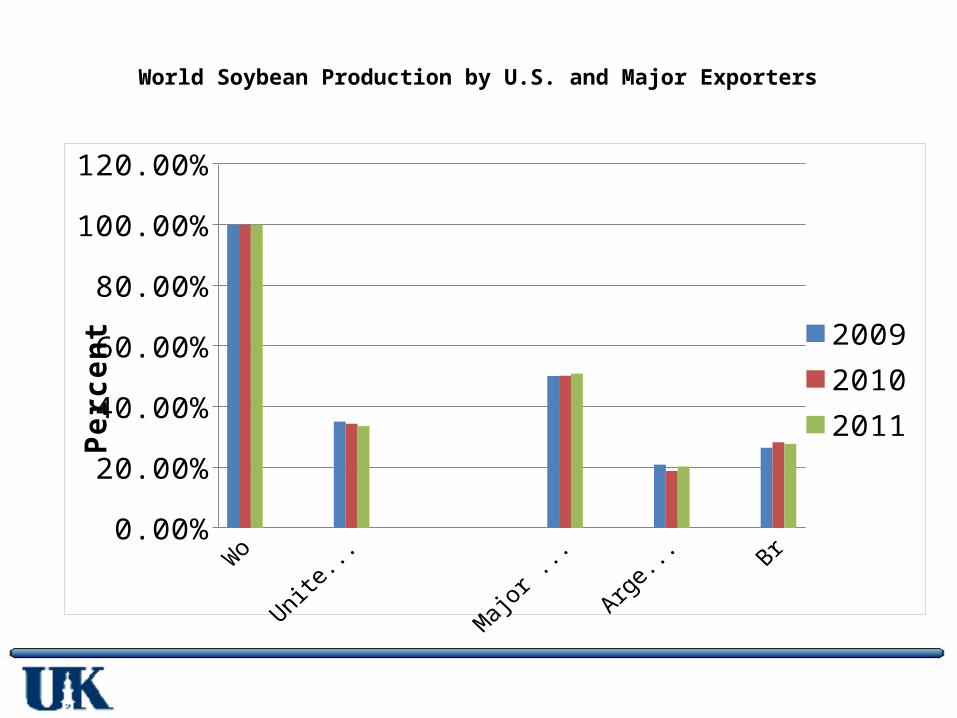
World Soybean Production by U.S. and Major Exporters
0.00%
20.00%
40.00%
60.00%
80.00%
100.00%
120.00%
200920102011Pe
rcen
t
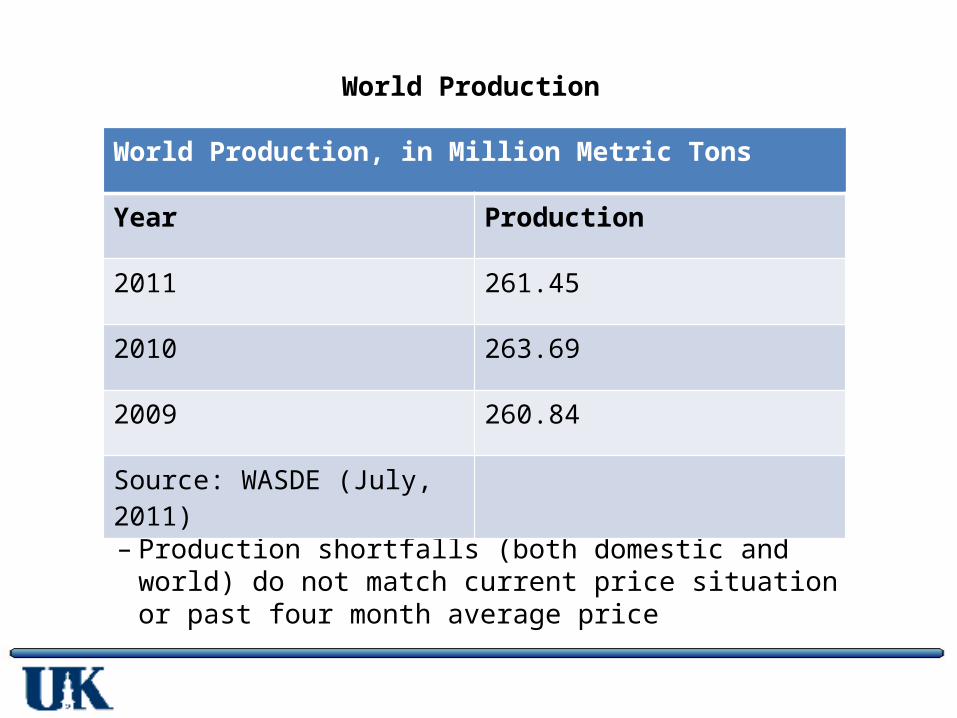
World Production
– Production shortfalls (both domestic and world) do not match current price situation or past four month average price
World Production, in Million Metric Tons
Year Production
2011 261.45
2010 263.69
2009 260.84
Source: WASDE (July, 2011)
19
71
19
73
19
75
19
77
19
79
19
81
19
83
19
85
19
87
19
89
19
91
19
93
19
95
19
97
19
99
20
01
20
03
20
05
20
07
20
09
20
11
0
500
1,000
1,500
2,000
2,500
3,000
3,500
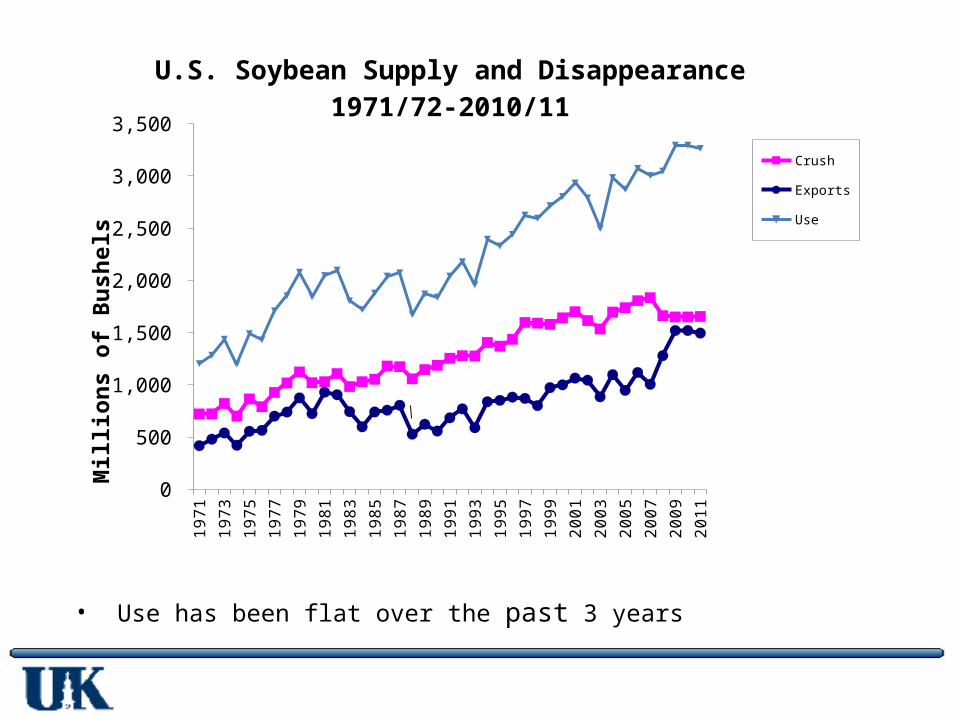
U.S. Soybean Supply and Disappearance 1971/72-2010/11
Crush
Exports
Use
Mill
ion
s o
f B
us
he
ls
• Use has been flat over the past 3 years
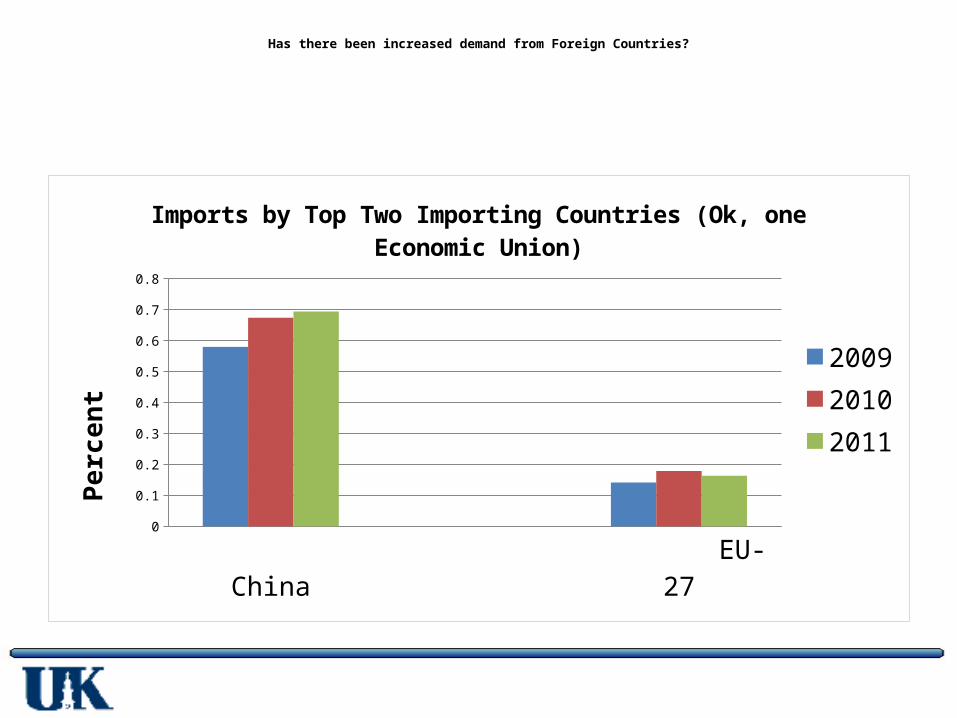
Has there been increased demand from Foreign Countries?
China EU-270
0.1
0.2
0.3
0.4
0.5
0.6
0.7
0.8
Imports by Top Two Importing Countries (Ok, one Economic Union)
200920102011
Perc
ent
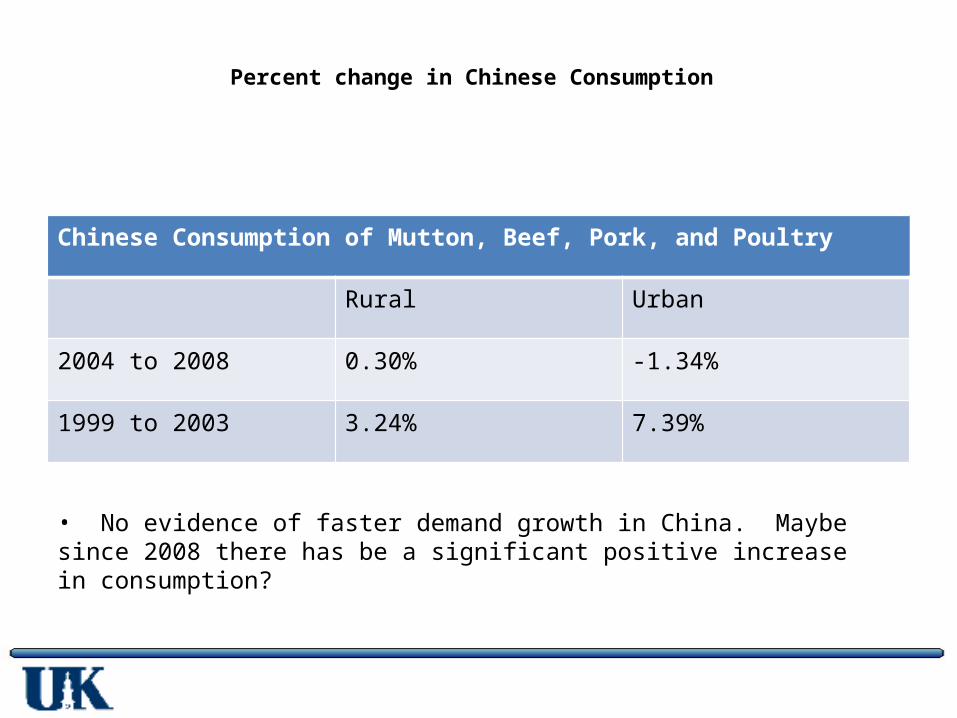
Percent change in Chinese Consumption
Chinese Consumption of Mutton, Beef, Pork, and Poultry
Rural Urban
2004 to 2008 0.30% -1.34%
1999 to 2003 3.24% 7.39%
• No evidence of faster demand growth in China. Maybe since 2008 there has be a significant positive increase in consumption?
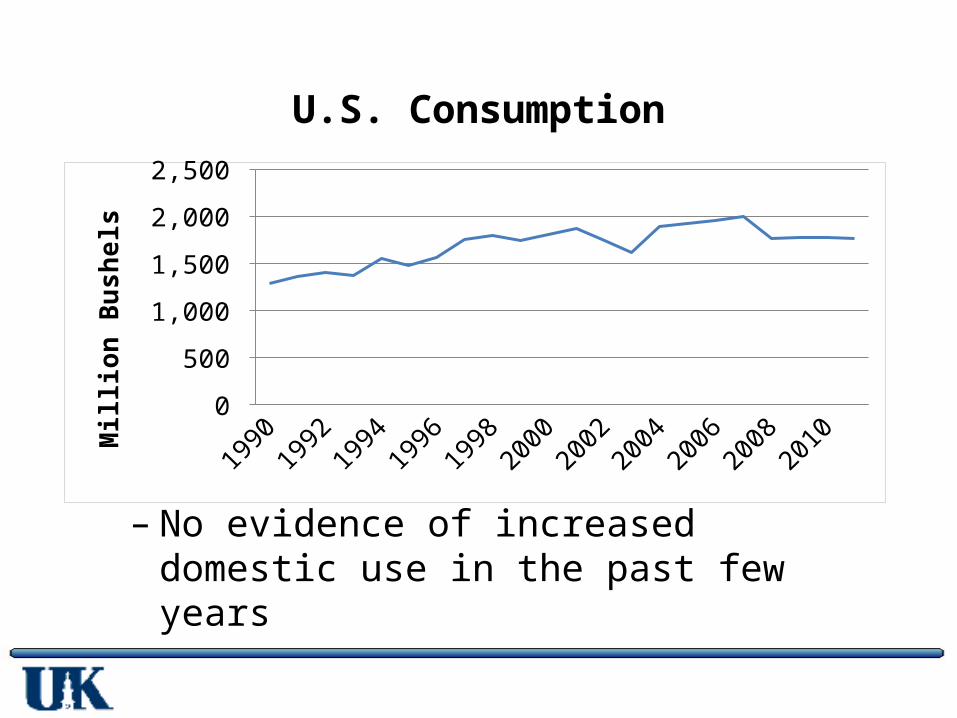
U.S. Consumption
– No evidence of increased domestic use in the past few years
19901992
19941996
19982000
20022004
20062008
20100
500
1,000
1,500
2,000
2,500
Mill
ion
Bush
els
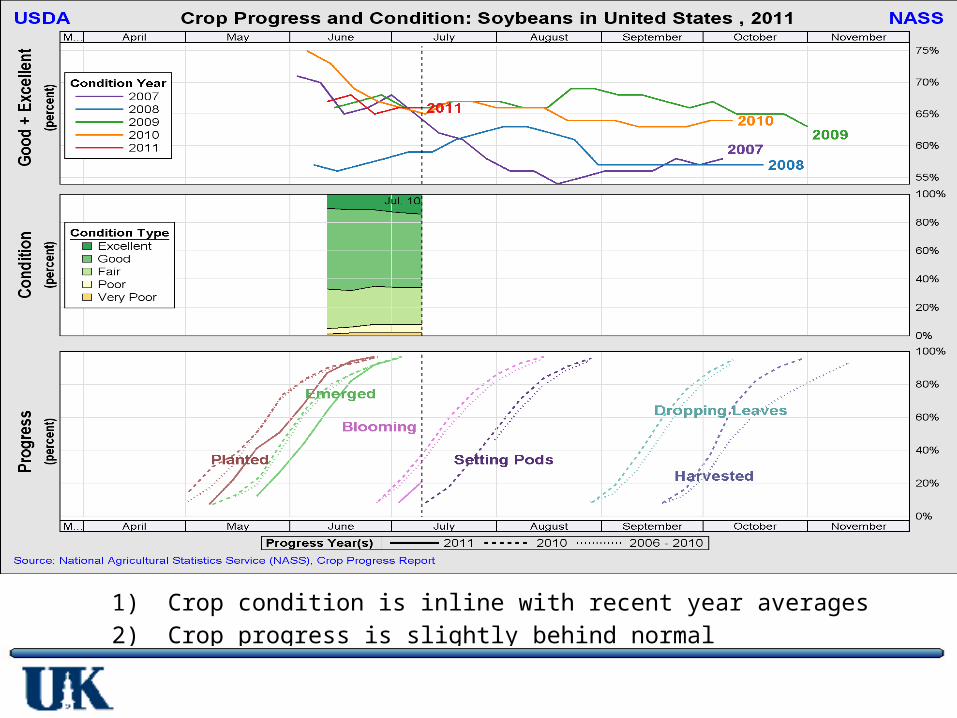
2011 Crop Conditions
1) Crop condition is inline with recent year averages2) Crop progress is slightly behind normal
10/16/2
007
1/15/2
008
4/15/2
008
7/15/2
008
10/14/2
008
1/13/2
009
4/14/2
009
7/14/2
009
10/13/2
009
1/26/2
010
4/27/2
010
7/27/2
010
10/26/2
010
1/25/2
011
4/26/2
011
-100,000
-50,000
0
50,000
100,000
150,000
200,000
250,000
300,000
350,000
400,000
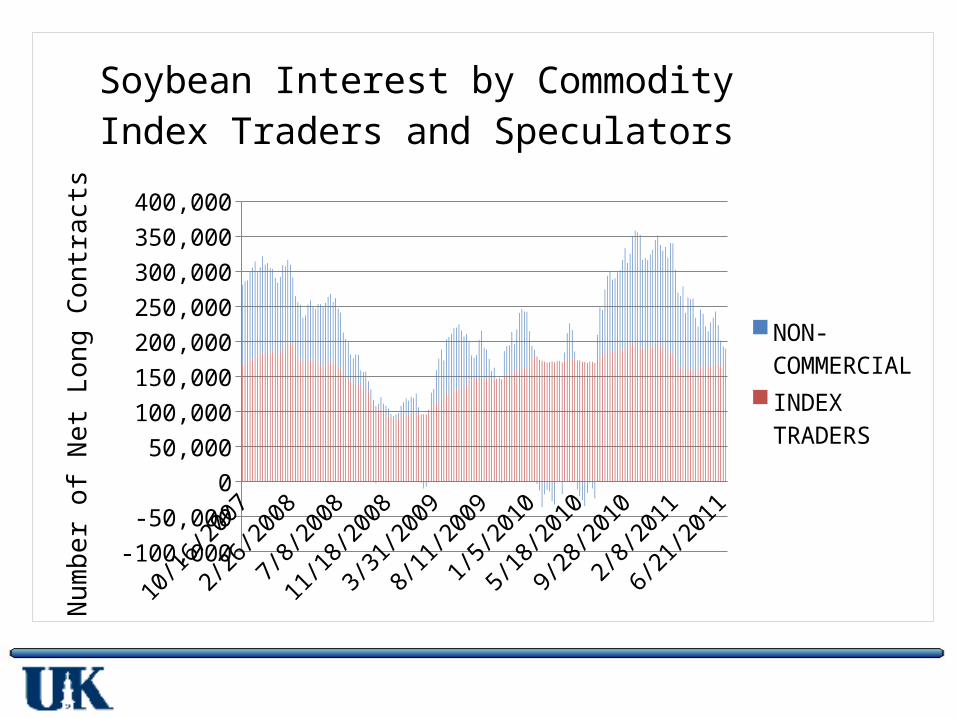
Soybean Interest by Commodity Index Traders and Speculators
NON- COMMER-CIALINDEX TRADERS
Num
ber o
f Net
Lon
g Co
ntra
cts
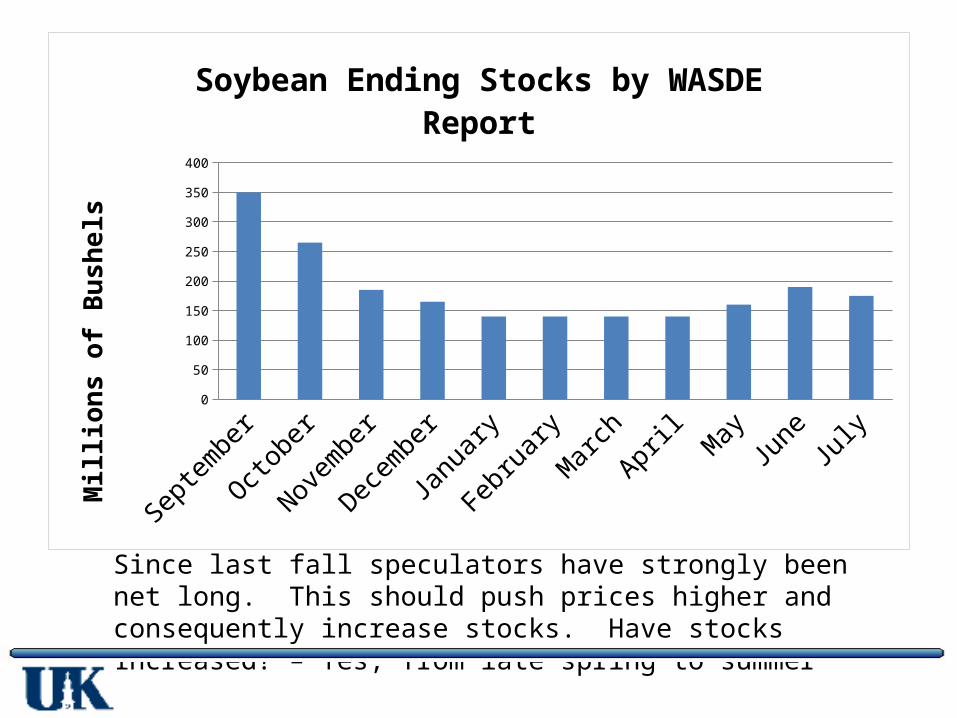
Since last fall speculators have strongly been net long. This should push prices higher and consequently increase stocks. Have stocks increased? – Yes, from late spring to summer
September
October
November
December
January
February
March AprilMay
JuneJuly
0
50
100
150
200
250
300
350
400
Soybean Ending Stocks by WASDE ReportM
illio
ns o
f Bus
hels
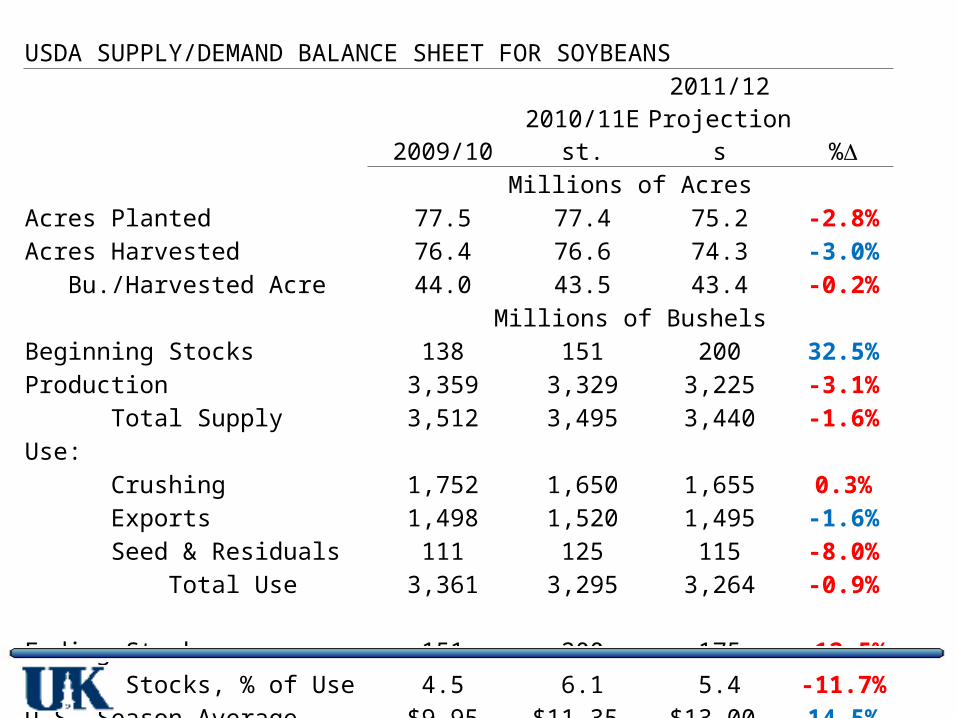
USDA SUPPLY/DEMAND BALANCE SHEET FOR SOYBEANS
2009/10 2010/11Est.2011/12
Projections %D Millions of AcresAcres Planted 77.5 77.4 75.2 -2.8%Acres Harvested 76.4 76.6 74.3 -3.0% Bu./Harvested Acre 44.0 43.5 43.4 -0.2% Millions of BushelsBeginning Stocks 138 151 200 32.5%Production 3,359 3,329 3,225 -3.1% Total Supply 3,512 3,495 3,440 -1.6%Use: Crushing 1,752 1,650 1,655 0.3% Exports 1,498 1,520 1,495 -1.6% Seed & Residuals 111 125 115 -8.0% Total Use 3,361 3,295 3,264 -0.9% Ending Stocks 151 200 175 -12.5%Ending Stocks, % of Use 4.5 6.1 5.4 -11.7%U.S. Season Average Farm Price, $/Bu
$9.95 $11.35 $13.00 14.5%
Source: USDA, WASDE
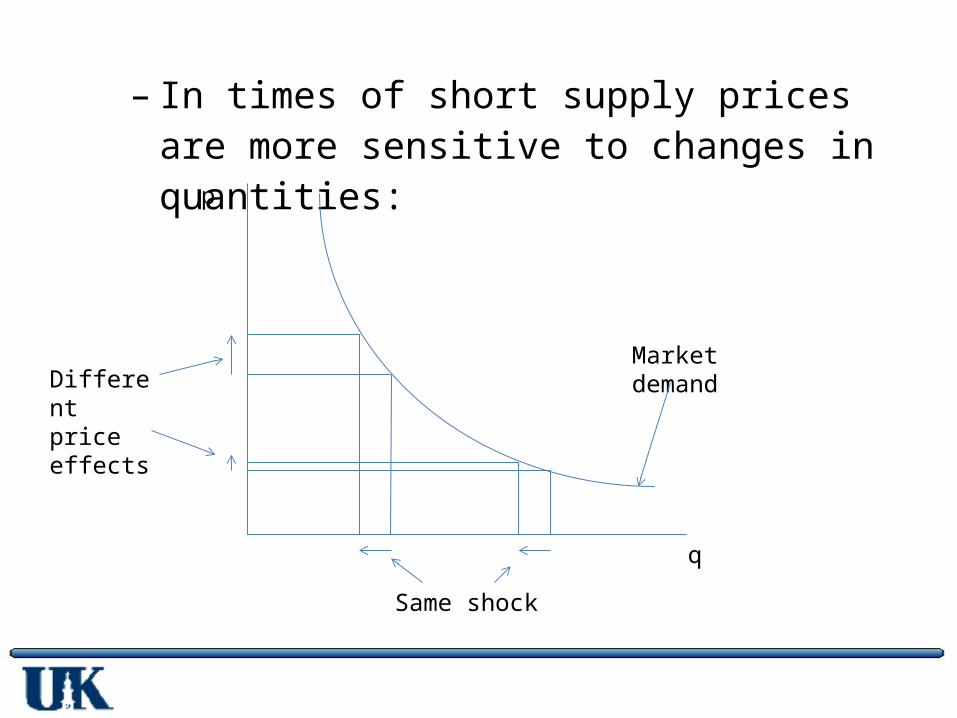
– In times of short supply prices are more sensitive to changes in quantities:
p
q
Market demand
Same shock
Different priceeffects
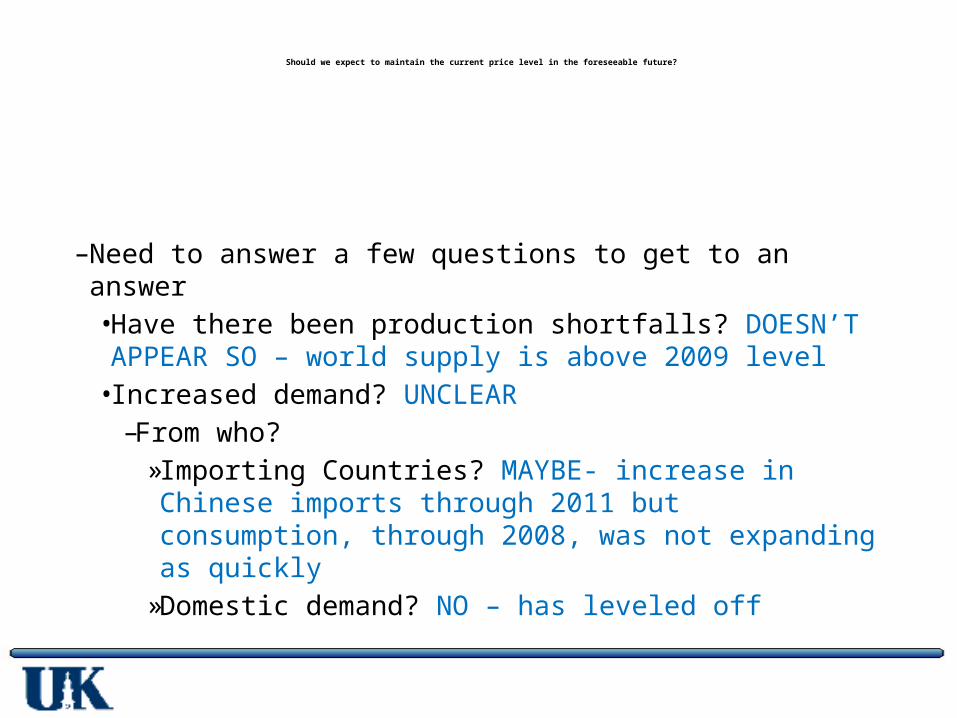
Should we expect to maintain the current price level in the foreseeable future?
– Need to answer a few questions to get to an answer• Have there been production shortfalls? DOESN’T
APPEAR SO – world supply is above 2009 level • Increased demand? UNCLEAR
– From who?» Importing Countries? MAYBE- increase in
Chinese imports through 2011 but consumption, through 2008, was not expanding as quickly
» Domestic demand? NO – has leveled off
Is this year’s crop in jeopardy? NOT YET- good to excellent rating is in line with last couple of years – Still have lots of weather uncertainty remaining in the growing season
• Is it speculators? SLIGHTLY – stocks increased 50 million bushels between April and June. But they have now removed their net long position
– In times of short stocks, prices are more sensitive to changes in quantity – thus could experience a spike
– Maybe other crops have influenced soybean price through acreage – i.e., the corn market
• Currently takes almost 34 times the Kentucky corn crop to meet ethanol demand for one year
Su m m ary
– No evidence of a lack of production– No clear evidence of an increase in demand from China– 2011 weather seems to be keeping crop progress and
condition within a “normal” range– Low stocks-to-use implies strong price changes– Soybean price keeping up with corn price can lead to
price spikes
– Have we really encountered at true shortage in world food markets? I don’t think so.