Embed Size (px)
Citation preview
gva.co.uk
Report
Report
GVA 10 Stratton Street London W1J 8JR
Southampton & Eastleigh
Retail Study
Southampton City Council & Eastleigh Borough Council
July 2011

July 2011 I gva.co.uk
Prepared By.Susie Rolls........................... Status..Final ..........................Date July 2011.......................... Reviewed By Chris Goddard ................ Status..Final ..........................Date July 2011..........................
For and on behalf of GVA Grimley Ltd
Southampton City Council and Eastleigh Borough Council Contents
July 2011 I gva.co.uk
CONTENTS
1. Introduction ...............................................................................................................1
2. Policy Framework .....................................................................................................3
3. National Trends........................................................................................................17
4. Sub-Regional Context ............................................................................................30
5. Southampton City Centre Health Check .............................................................38
6. Eastleigh Town Centre Health Check ...................................................................53
7. Other Shopping Provision.......................................................................................62
8. Quantitative Methodology & Data Inputs ............................................................66
9. Convenience Goods Capacity Forecasts ...........................................................71
10. Comparison Goods Capacity Forecasts .............................................................90
11. Conclusions & Recommendations........................................................................97
Southampton City Council and Eastleigh Borough Council Contents
July 2011 I gva.co.uk
Plans
Plan I Survey Area & Household Survey Zones
Plan II Study Area and Key Centres
Plan III Comparison Goods Expenditure Flows to Competing Centres
Plan IV Foodstore Provision
Plan V Retail Warehouse Provision
Plan VI Southampton City Centre Market Share
Plan VII Southampton Retail Warehousing Market Share
Plan VIII Eastleigh Town Centre Market Share
Plan IX Eastleigh Retail Warehousing Market Share
Appendices
Appendix I Competing Centres Key Indicators
Appendix II Competing Centres Market Share
Appendix III Convenience Goods Capacity Projections - Baseline
Appendix IV Convenience Goods Capacity Projections - Scenario 1
Appendix V Convenience Goods Capacity Projections - Scenario 2
Appendix VI Comparison Goods Capacity Projections - Baseline
Appendix VII Comparison Goods Capacity Projections - Scenario 1
Appendix VIII Comparison Goods Capacity Projections - Scenario 2
Southampton City Council and Eastleigh Borough Council Retail Study
July 2011 I gva.co.uk 1
1. Introduction
1.1 In December 2010, GVA was instructed by Southampton City Council and Eastleigh
Borough Council to build on previous studies undertaken on behalf of the Councils and
the Partnership for Urban South Hampshire (PUSH). The document will inform retail
planning in Southampton and Eastleigh during the period up to 2026 in accordance with
guidance set out in PPS4: ‘Planning for Sustainable Economic Growth’ (December 2009).
This study provides a robust and sound evidence base to inform the Councils emerging
Local Development Framework (LDF) and to assist in reaching conclusions on shorter term
proposals for the development of town centre uses.
1.2 The scope of the study therefore is to provide up to date advice on the need and
capacity for new retail development across the study area up to 2026, identify qualitative
deficiencies in existing provision, and advise the Councils on how to best meet any
identified need. This is informed by a detailed up to date health check assessments of
Southampton city centre and Eastleigh town centre.
1.3 Our approach draws on the recommendations of the Good Practice Guidance on Need,
Impact and the Sequential Approach, produced by GVA in conjunction with the DCLG,
to accompany PPS4. We have adopted a transparent approach, where the key steps of
our analysis, data inputs and assumptions are clearly set out and justified. In accordance
with the Good Practice Guidance, our approach is also underpinned by household
telephone survey data to establish shopping patterns, town centre catchments and
market share estimates for both comparison and convenience goods retailing.
1.4 This study will examine Southampton and Eastleigh’s capacity for new convenience and
comparison floorspace over the period between 2011 and 2026 and provide an update
of previous capacity projections. It will be a key piece of evidence to inform the
preparation of LDF documents such as the Southampton City Centre Action Plan and
Eastleigh Core Strategy. As part of this study we have also assessed the town and district
centres of Shirley, Portswood, Bitterne, Woolston and Lordshill in Southampton and
Chandler’s Ford and Hedge End in Eastleigh and consider capacity and scope for
additional convenience retailing these centres. We have not, as part of this study,
undertaken detailed health checks of these centres or considered their function in terms
of comparison goods shopping.
Southampton City Council and Eastleigh Borough Council Retail Study
July 2011 I gva.co.uk 2
Structure
1.5 This report draws together the results of our research, incorporating the findings of the
detailed survey-based technical analysis and health check assessment. The report is
structured as follows:-
• Section 2 summarises the national, regional and local planning policies relevant to
retail planning in Southampton and Eastleigh;
• In Section 3, we consider national trends in the retail sector, and in particular the
implications of the recent recession and the economic outlook going forwards
specifically in relation to previous estimates of population and expenditure growth;
• Section 4 reviews the sub-regional context and in particular the influence of
competing centres in the wider sub-region, and potential changes in influence in the
future;
• Sections 5, 6 and 7 presents our qualitative assessment of the role and performance of
Southampton and Eastleigh town centres and provides a broad overview of the
smaller shopping centres in the Boroughs and out-of-centre shopping provision.
• Section 8 sets out our approach and methodology underpinning our quantitative
analysis building on the results of the household survey;
• In Sections 9 and 10 we present our capacity forecasts for additional convenience
and comparison goods floorspace in the Southampton and Eastleigh, taking account
of recent/committed developments and the economic climate up to 2026;
• Finally Section 11 draws the analysis together and sets out the conclusions and
recommendations in respect of the key policy considerations, the current health and
composition of Southampton and Eastleigh town centres and the need and
opportunities for future growth.
Southampton City Council and Eastleigh Borough Council Retail Study
July 2011 I gva.co.uk 3
2. Policy Framework
2.1 This section sets out the key points of relevance from policy changes since the previous
retail capacity assessments, focusing specifically on retail planning and policies for
Southampton city centre and Eastleigh town centre. This latest national, regional and
local policy framework provides the context for our study.
National Policy
PPS4: Planning for Sustainable Economic Growth (December 2009)
2.2 Planning Policy Statement 4 (PPS4) was published in December 2009 and replaces
Planning Policy Statement 6: Planning for Town Centres, which informed the earlier studies.
The central message of PPS4 is the need for a more proactive approach to securing new
investment in centres, and achieving more sustainable patterns of development. The
Government’s key objective for town centres is to promote their vitality and viability by:
• Focusing new economic growth and development of main town centre uses in
existing centres and remedying deficiencies in provision in areas with poor access to
facilities;
• Allowing competition between retailers and enhanced consumer choice through the
provision of innovative and efficient shopping, leisure, tourism and local services in
town centres which allow genuine choice to meet the needs of the entire community
(particularly socially excluded groups).
2.3 The statement advises that Local Planning Authorities (LPAs) should plan positively for
growth and development by assessing the need for further main town centre uses and
ensure there is capacity to accommodate them (taking account of the role of centres in
the hierarchy); and to identify any deficiencies in the provision of local convenience
shopping and other facilities which serve people’s day-to-day needs. In assessing need
for retail and leisure development LPAs should take account of both quantitative and
qualitative need, giving additional weight to the latter in deprived areas.
2.4 In assessing quantitative need for retail and leisure development LPAs should have regard
to relevant market information and economic data, including a realistic assessment of
Southampton City Council and Eastleigh Borough Council Retail Study
July 2011 I gva.co.uk 4
population and future growth, forecast expenditure and forecast improvements in retail
sales density. In assessing qualitative need LPAs should assess whether provision and
distribution of shopping, leisure and local services allows genuine choice to meet the
needs of the whole community (particularly those in deprived areas), in light of the
objective to promote vitality and viability of town centres and the application of the
sequential approach. LPAs should also take into account the degree to which shops may
be overtrading and whether there is need to increase competition and retail mix.
2.5 PPS4 states that, in planning for centres, local planning authorities should set out a strategy
for the management and growth of centres over the plan period, setting flexible policies
allowing centres to respond to changing economic circumstances. LPAs should define
the network and hierarchy of centres that is resilient to anticipated future economic
changes to meet the needs of their catchments. Choices should be made about which
centres will accommodate any identified need for growth in town centre uses,
considering their expansion where necessary and the need to avoid an over
concentration of growth in centres. Identified deficiencies in the network of centres
should also be addressed, giving consideration to the appropriateness of designating new
centres; reclassifying existing centres; planning for extensions; or scope for consolidation.
2.6 In addition to defining the extent of the primary shopping area for their centres, LPAs are
encouraged to distinguish between primary and secondary frontages (defined in Annex B
of PPS4). Having regard to the need to encourage diversification of uses in town centres
as a whole, PPS4 states that primary frontages should contain a high proportion of retail
uses, while secondary frontages provide greater opportunities for a diversity of uses.
Where frontages are identified, the appropriate local development documents should
include policies that make clear which uses will be permitted in such locations.
2.7 PPS4 encourages LPAs to proactively plan to promote competitive town centre
environments and provide consumer choice by:
• supporting a diverse range of uses (including complementary evening and night-time
uses) which appeal to a wide range of age and social groups;
• planning for a strong retail mix so that the range and quality of the comparison and
convenience retail offer meets the requirements of the local catchment area,
recognising that smaller shops can significantly enhance the character and vibrancy
of the area;
Southampton City Council and Eastleigh Borough Council Retail Study
July 2011 I gva.co.uk 5
• supporting shops, services and other important small scale economic uses in local
centres and villages;
• identifying sites in the centre, or failing that on the edge of the centre, capable of
accommodating larger format developments where a need for such development
has been identified;
• retaining and enhancing existing markets and, where appropriate, re-introducing or
creating new ones, ensuring that markets remain attractive and competitive by
investing in their improvement;
• taking measures to conserve, where appropriate, and enhance the established
character and diversity of their town centres.
2.8 LPAs should identify an appropriate range of sites to accommodate at least the first five
years identified need. Sites for main town centre uses should be identified through a
sequential approach to site selection giving preference to locations in appropriate
existing centres in the first instance, followed by edge-of-centre locations and out-of-
centre sites, with preference given to those that are more accessible or have a higher
likelihood of forming links with an existing centre.
2.9 The impact of proposed locations for development on existing centres will also need to be
assessed by the LPA, taking into account impact considerations set out in Policy EC16
which include impact on town centre vitality and viability; in-centre trade/turnover;
investment in centres; delivery of development on allocated sites; and any locally
important impacts on centres identified by the LPA.
2.10 In the determination of planning applications for main town centre uses that are not in a
centre and not in accordance with an up to date development plan, PPS4 requires
applicants to demonstrate compliance with the sequential approach and impact
assessment taking into account the impact considerations set out in Policy EC16.
Assessments of impact should focus on the first 5 years after the implementation of a
proposal and should be proportionate to the scale, nature and detail of the proposed
development.
2.11 Policy EC17.1 directs LPAs to refuse planning permission where an applicant fails to
demonstrate compliance with the sequential approach or the proposal is likely to lead to
a significant impact. Judgements about the extent and significance of any impacts
should be informed by the development plan (where this is up to date) or recent local
Southampton City Council and Eastleigh Borough Council Retail Study
July 2011 I gva.co.uk 6
assessments of the health of town centres and any other published local information e.g.
a town centre or retail strategy.
PPS4 Good Practice Guide (December 2009)
2.12 The Good Practice Guide is a government document published alongside PPS4. It does
not constitute a statement of Government policy, but forms guidance to support the
interpretation of town centre policies set out in PPS4.
2.13 Of most relevance to this study is the advice directed towards assisting LPAs in adopting a
more proactive approach to planning for town centres, and particularly the role of
evidence in the plan making process to identify the need for new development and
inform the preparation of proactive town centre strategies. Central to PPS4 Policy EC1 the
guidance sets out alternative approaches to assessing and identifying quantitative and
qualitative needs for retail and other town centre uses. Building on the assessment of
needs, the practice guidance explains how LPAs can plan positively and promote new
retail-led and other town centre uses through their LDFs; setting out the ‘tools’ needed to
prepare effective town centre strategies, including how to identify appropriate locations,
and how to assess the effects of alternative policy options and specific proposals.
2.14 Having identified and evaluated the various policy options, LPAs should develop a clear
vision and strategy for the network of centres, and strategies for individual centres where
appropriate. In terms of the LDF, this is likely to include clear guidance on the appropriate
scale and form of new development involving main town centre uses; allocation of sites to
meet identified need; identification of the extent of key development opportunities; a
clear statement of the approach to be taken to bringing forward development and the
LPAs attitude to other competing developments.
2.15 It is added that strategies for individual centres can be prepared at any time but they
should be incorporated into the LDF at the earliest opportunity. This is likely to be
important where key site allocations are involved, either through strategic allocations in
the Core Strategy, or through sites allocated in an Area Action Plan or other document.
Promoting town centre strategies through the LDF process ensures that the evidence base
which underpins the strategy will be properly tested. A strategy which has been
progressed through the LDF process, and been subject to effective public and
stakeholder consultation and tested through independent examination will ensure that
Southampton City Council and Eastleigh Borough Council Retail Study
July 2011 I gva.co.uk 7
proposals must be determined in accordance with the plan unless material considerations
indicate otherwise.
2.16 When preparing their LDFs, LPAs should identify what they regard as the Primary Shopping
Area (PSA) to provide clarity to applicants about the policy status of different sites. In
defining the PSA, it may be appropriate to take into account the anticipated future role of
the centre, and in particular the scope for growth and expansion. In centres where major
expansion is planned, it may be appropriate to indicate where the PSA is likely to be
extended to, having regard to the potential for achieving effectively integrated new
development.
2.17 LPAs should also identify an appropriate ‘town centre boundary’ within which they should
seek to locate other main town centre uses. It may also be appropriate to define other
areas within the town centre but outside the PSA where specific uses are encouraged e.g.
specialist retail, offices bars/restaurants etc. In addition to defining the PSA and town
centre boundary, where LPAs identify a need for new development to accommodate
main town centre uses, they should allocate sites which are suitable, viable and likely to
be available within a reasonable timescale to accommodate such needs.
Regional / Sub-Regional Policy
2.18 On 6th July 2010 the Secretary of State for Communities and Local Government
announced the Government’s decision to revoke Regional Strategies so that they no
longer formed part of the development plan. This decision was challenged by CALA
Homes and this challenge was supported by the High Court in November 2010.
2.19 The Court of Appeal has clarified that the Government’s abolition plans should not be a
factor in plan-making decisions and development plan documents must therefore be in
general conformity with the relevant regional strategy.
South East Plan
2.20 The South East Plan policy objectives for town centres and retail include the sustainable
growth of a balanced network of centres which complement each other whilst being self
sufficient in terms of employment provision, retail, leisure and culture. A strategic network
of centres is outlined for the South East in Policy TC1. Southampton is categorised as a
Southampton City Council and Eastleigh Borough Council Retail Study
July 2011 I gva.co.uk 8
Primary Regional Centre, and also a Centre for Significant Change. Eastleigh is identified
as a Secondary Regional Centre.
2.21 Policy TC2, which relates to new development and redevelopment in town centres, states
that Centres for Significant Change (e.g. Southampton) are expected to undergo the
most significant change across the range of town centre uses during the plan period and
proactive, integrated strategies for their development will be particularly important. Major
retail developments, and other town centre uses of a large scale, should be located in
these centres. However, LPAs should consider whether there is a need to re-balance the
network of centres to ensure that it is not overly dominated by the largest centres.
Authorities should also consider whether there are areas where investment should be
stimulated in town centres with deficiencies, deprived areas, or areas that will undergo
significant housing and employment growth.
2.22 Policy TC3 states that no need has been identified for any further out-of-centre regional or
sub-regional shopping centres or large-scale extensions to such centres during the period
to 2026. The role and regeneration of existing centres should not be undermined by an
intensification of out-of-centre development.
2.23 Within the South Hampshire Sub Regional Strategy Area, the priority is for sustainable
economic growth and urban regeneration. Policy SH4 outlines the strategy for main town
centres in the sub-region, which is to develop centres’ individual character and
complementary roles.
2.24 In Southampton, the city should expand its retail, leisure, office, employment and cultural
facilities through the consolidation of the existing primary shopping area, integrating
redevelopment of the major city centre sites to the west (in the medium term to 2016) and
the possible expansion towards the waterfront (in the longer term to 2026). In Eastleigh,
the priority is to accommodate identified capacity through redevelopment of the town
centre to provide high density, high quality retail, leisure and office employment schemes.
South Hampshire Town Centres: Sub Regional Study (March 2006)
2.25 In March 2006, DTZ on behalf of the Partnership for Urban South Hampshire (PUSH)
undertook a need and capacity assessment across the sub-region and developed a
strategy for town centre uses. The main centres in the PUSH area included Southampton,
Eastleigh, Portsmouth, Fareham, Gosport, Southsea and Havant. Southampton was
Southampton City Council and Eastleigh Borough Council Retail Study
July 2011 I gva.co.uk 9
identified as the dominant centre within the sub-region and considered a healthy and
viable city centre. Eastleigh was found to be a compact town centre, dominated by the
Swan Centre and the main foodstores (Tesco and Sainsbury’s), which help generate trips
and market share for the town centre. Eastleigh was considered to be ‘punching below
its weight’ in the network of centres and would benefit from new investment and
development of its retail offer.
2.26 Indicative comparison goods floorspace capacity forecasts (using mid-range values)
indentified capacity in Southampton in the region of 19,400-29,100 sqm net between 2005-
2011; 43,900-65,900 sqm net between 2005-2016; 72,400-108,800 sqm net between 2005-
2021; and 105,700-158,900 sqm net between 2005-2026.
2.27 In Eastleigh indicative comparison goods floorspace capacity forecasts (using mid-range
values) indentified capacity for 3,600-5,600 sqm net between 2005-2011; 7,500-11,200 sqm
net between 2005-2016; 11,800-17,700 sqm net between 2005-2021; and 16,800-25,300 sqm
net between 2005-2026.
PUSH Economic Development Strategy (November 2010)
2.28 In November 2010, DTZ on behalf of the Partnership for Urban South Hampshire (PUSH)
undertook a review of the previous economic strategy, in light of the impact of the
recession on the sub-region. The document sets out the context for economic growth and
specifies priority actions up to 2026.
2.29 The report highlights that one of the key sectors to focus on to achieve the economic
strategy is the ‘underpinning quality of life and place’ to ensure that South Hampshire is a
great place to live and work. The retail sector is crucial to the sub-region, providing
around 50,000 jobs to residents and providing a range of shops available to both residents
and visitors. The quality of the retail offer plays a significant role in the tourism and visitor
economy in South Hampshire.
2.30 More specifically, the Strategy finds that there are further opportunities to develop the
retail offer of Southampton, so that the centre serves the population of the sub-region as a
whole, as well as visitors from outside the sub-region. The retail sector plays a role in the
ambitions of the Strategy to deliver thriving cities and PUSH is committed to supporting city
centre regeneration to support the delivery of this.
Southampton City Council and Eastleigh Borough Council Retail Study
July 2011 I gva.co.uk 10
Southampton City Council
Southampton Core Strategy (January 2010)
2.31 Southampton’s Core Strategy was formally adopted by the Council on 20 January 2010
and sets out planning policy for the city. Southampton is recognised as a major city within
central southern England and the Plan’s policies seek to build on its role as the region’s
economic, social and cultural driver. The Core Strategy sets out the city centre and retail
policy in Section 4. We highlight the key policies below.
2.32 One of the main spatial visions for Southampton is for a growing regional centre for
economic growth and as a social and cultural hub with a thriving night time economy
focused on the city centre (130,000 sqm gross additional comparison shopping
floorspace). This vision will be delivered through several strategic objectives (S), including
S3 which is to create a vibrant, high quality regional city centre that is the focus for major
retail; tourism; leisure; cultural and office investment and connects with the waterfront.
2.33 There are two specific policies which aim to maintain the vitality and viability of the city
centre. Policy CS1 outlines the city centre approach to enhance the centre’s regional
status. Major development will be focused within the defined city centre (as outlined on
the Proposals Map). Development in this area will be informed by a City Centre Action
Plan (currently being developed), and will include:
• a Major Development Quarter in the west of the city centre and other development
sites;
• approximately 130,000 sqm (gross) of comparison retail floorspace;
• 322,000 sqm (gross) of office floorspace;
• further leisure/cultural/hotel development (including restaurants, bars, cinema, events
area, cultural quarter); and
• approximately 5,450 new dwellings.
2.34 There are several specific initiatives to enhance the city including a public realm
improvement of the QE2 Mile linking the city centre to the waterfront; improved public
transport facilities, including the central railway station; and the creation of a cultural
quarter in Northern Above Bar.
Southampton City Council and Eastleigh Borough Council Retail Study
July 2011 I gva.co.uk 11
2.35 The major development quarter is a strategic site to the west of Portland Terrace, the West
Quay Mall and Western Esplanade, north of the port and south of the railway. Policy CS2
outlines policy specifically for the major development quarter, an area earmarked for
major commercial intensification. A mix of uses is anticipated across the quarter including
retail, offices, leisure, hotel, cultural, tourism, residential and community uses. The focus of
retail development will be within the city centre’s existing primary shopping area first.
Retail development outside the primary shopping area but within the major development
quarter will be facilitated through the City Centre Action Plan if it can be demonstrated
that:
• It is part of a coherent expansion of the primary shopping area, linked to the existing
primary shopping area by good/clear pedestrian links and lined where possible by
‘shop’ windows; and
• There is a need for the development which is unlikely to be met within the existing
primary shopping area. This test will be judged by looking at additional needs from
2005, through to both five years ahead (from the determination of a planning
application), and through to 2026.
2.36 Policy CS2 also sets out that the City Centre Action Plan will provide more detailed
guidance on the phasing, layout and extent of the expansion. However the need for
retail expansion of the primary shopping area in the major development quarter is unlikely
to occur before 2016.
2.37 The network of town and district centres within the authority area are outlined in Policy
CS3. Southampton city centre is identified at the top of the hierarchy of centres. Shirley
town centre is identified below the city centre, but above the four district centres of
Portswood, Bitterne, Woolston and Lordshill. The town and district centres meet the week
to week needs for their areas of the city. There is also a network of local centres which
cater for day to day needs.
2.38 At the centres of Shirley, Portswood and Bitterne the aim over the LDF period is to maintain
the health of these centres, improve the street scene and successfully integrate local
facilities. At Lordshill there will be a comprehensive redevelopment to improve its design
and expand the range of services to serve the north west of the city and the neighbouring
areas. The priority for Woolston is to ensure that the adjacent Centenary Quay
redevelopment complements and enhances the centre and to make improvements to
the street scene.
Southampton City Council and Eastleigh Borough Council Retail Study
July 2011 I gva.co.uk 12
2.39 Policy CS3 continues to outline further retail policy for the centres, to ensure that non-
residential development serving a city wide or sub regional catchment will be focused on
the hierarchy of centres with the sequential approach. In line with national planning
policy, the Council have set a threshold for edge-of-centre and out-of-centre
developments (including retail, warehouse clubs, leisure or hotel uses) over 750 sqm gross
will be subject to the sequential approach.
2.40 In terms of retail capacity figures, the Council anticipate that 130,000 sqm gross
comparison floorspace will be developed in the city centre between 2006 and 2026. It is
estimated that 55,000 sqm gross is likely to be delivered by 2016 and that 75,000 sqm gross
will be delivered between 2016 and 2026.
City Centre Action Plan (draft 2007)
2.41 The Southampton City Centre Action Plan (CCAP) is currently being developed by the
Council. Once complete, the document will form part of the Local Development
Framework and will have Development Plan Document status. In April 2007, the Council
published the first draft of the CCAP Issues and Options Paper. It is anticipated that the
CCAP Preferred Approach will be available for public consultation in the summer of 2011.
2.42 The Issues and Options Paper outlined options for the key development sites in
Southampton city centre. The main development sites that were considered in the
document include the retail core (Bargate, Debenhams, Marlands Shopping Centre and
Above Bar Street), the Major Development Quarter (including West Quay Retail Park),
Central Station, Old Town, Waterfront, Fruit and Vegetable Market and Brunswick Square,
Cultural Quarter and Royal Pier.
Southampton and Eastleigh, Convenience Retailing: Joint Capacity
Assessment (June 2006)
2.43 The Convenience Retailing: Joint Capacity Report assessed capacity for future
convenience retail provision. In Southampton the Study identified potential for up to an
additional 2,200-8,300 sqm net convenience floorspace between 2006 and 2026. This was
based on existing market shares, with no claw back from out-of-centre locations in
Eastleigh Borough. A greater level of capacity was identified for Eastleigh, in the region of
6,100-18,600 sqm net arising between 2006 and 2026. The report does not identify
potential locations for convenience developments, but recommends that new floorspace
Southampton City Council and Eastleigh Borough Council Retail Study
July 2011 I gva.co.uk 13
should be directed to town centre locations in the first instance, in line with national
planning policy.
Southampton City Centre Health Check (2008/2009)
2.44 The latest City Centre Health Check provides a detailed analysis of the vitality and viability
of Southampton City Centre. Key findings from the report include the diversity of uses in
the city were comparison retail (64%), leisure uses (9.4%), financial services (4%). The report
also found a high proportion of vacant units (11%). In terms of retail ranking (Experian 2008
Retail Ranking) indicates that Southampton had slipped from 7th between 2001/02 and
2003/04 to 15th in 2008/09. Continued investment in Southampton including the
development of Ikea on West Quay Road and the potential development at Watermark
West Quay (outline permission has since been granted in February 2010) indicates that
Southampton will continue to maintain its regional position.
Eastleigh
Eastleigh Borough Local Plan Review 2001-2011
2.45 Eastleigh Borough Council adopted the Local Plan Review in May 2006. The document
sets out planning policy for the area. Only policies saved under the Secretary of State’s
Direction in May 2009 (which include the majority of planning policies) now remain in force
until they are replaced by the Council’s approved Local Development Framework (LDF)
Policies. The Local Plan sets out its retail policy in Section 8, ‘Town and Local Centres’. We
highlight the key saved policies below.
2.46 The main objectives of the Plan are to sustain and enhance the vitality and viability of its
town, district and local centres, reduce the need to travel by car and to maintain an
efficient, competitive and innovative retail sector, by focussing new development firstly in
town and local centres. The hierarchy of centres in the Borough include the town centre
of Eastleigh, district centres of Hedge End and Fryern, Chandlers Ford and eight village
and local centres and twelve neighbourhood parades. Hedge End also provides a
concentration out-of-centre retail provision within the Borough.
2.47 Policies 125.TC and 126.TC set general development principles for retail development in
Eastleigh town centre. An overall framework for development in the Eastleigh shopping
area (as defined on the Proposals Map) is outlined in policy 127.TC.
Southampton City Council and Eastleigh Borough Council Retail Study
July 2011 I gva.co.uk 14
2.48 In order to promote development, specific proposals for development are supported by
individual planning policies. The first of these proposal sites is the Core Retail Area at the
surface level car park adjacent to Tesco on Southampton Road. Policy 128.TC states that
there is an extant permission for the development of a multiplex cinema on the upper
floors of the car park but that the ground floor is currently under utilised. The policy
supports the extension of the Swan Centre to the east to provide, amongst other criteria,
retail or leisure use that will attract a high number of customers. This policy has been
fulfilled with the development of Swan Centre leisure scheme which opened in 2010.
2.49 The second specific proposal policy is for the block to the north of Wells Place. Policy
129.TC supports the redevelopment of the site to provide retail, or if not commercially
viable, leisure uses on the site. At Leigh Road (Policy 130.TC) development of leisure and
cultural uses will be supported (restaurants, cafes and galleries). At Romsey Road (Policy
131.TC) leisure and cultural uses are not considered suitable, but change of use to
accommodate office, residential or hotel uses will be considered acceptable. At East of
Upper Market Street/Bus Station, Policy 132.TC promotes the comprehensive
redevelopment of the site.
2.50 Within the district centres, local centres and neighbourhood parades, development of
retail and town centre uses or community uses will be permitted (Policy 133.TC). In edge-
of-centre or out-of-centre locations, applications for over 500 sqm retail floorspace will be
required to consider a sequential approach to site selection. For proposals over 2,500 sqm
an impact assessment will be required. Policy to restrict out-of-centre development is
outlined in Policy 134.TC.
2.51 The Plan sets out policies to restrict the change of use within town and district centres.
Policy 136.TC states that within the core shopping zone in Eastleigh, no change of use that
would result in the loss of A1 floorspace will be permitted. Within the primary zone of town
and district centres the aim is to maintain a mixture of national multiple and independent
retailers (Policy 137.TC). Within secondary areas of town and district centres, change of
use to A2, A3, A4, A5 or leisure or cultural uses will be permitted.
Eastleigh Core Strategy (draft)
2.52 Eastleigh Borough Council is currently preparing its Core Strategy. An Issues consultation
paper was published in September 2008. No specific retail or town centre policies were
considered at this early stage of the production of the Core Strategy. We understand that
Southampton City Council and Eastleigh Borough Council Retail Study
July 2011 I gva.co.uk 15
Eastleigh Borough Council will publish the Issues, Options and Preferred Approach stage of
the Core Strategy at the end of 2011. The Examination in Public is scheduled for February
2013 and it is anticipated that the Core Strategy will be adopted in September 2013.
Eastleigh Town Centre Retail Study Update (2008)
2.53 In 2008, DTZ published a Town Centre Retail Study Update for Eastleigh, as an update to
the 2006 Southampton and Eastleigh Joint Convenience Capacity Study. In addition to in
updating the capacity forecasts for convenience goods, DTZ were asked to examine the
need for comparison goods floorspace in Eastleigh town centre, which had not been
examined as part of the 2006 Study.
2.54 The Study examines whether there are any sites in or on the edge of the town centre
which could accommodate the forecast need for additional convenience and
comparison goods floorspace. The Study concludes that the only opportunities for new
retail development within the town centre itself are existing vacant space; or
redevelopment of existing retail uses with higher density retailing. In the case of edge-of-
centre and close out-of-centre sites, the study identified two sites: i) the Recreation
Ground and ii) Barton Park. The Recreation Ground is dismissed on this basis that it is very
unlikely to be made available for new retail development, and should not therefore be
considered a practical possibility for accommodating the forecast need. The potential for
Barton Park is examined in more detail.
2.55 The report considers two development scenarios. Scenario One is a baseline scenario
which assumes that there will be no change in the corrected market shares of available
expenditure attracted from the catchment area to 2021. Scenario Two considers the
impact of the development of a new food/non-food superstore (9,800 sqm gross / 6,860
sqm net), and new town centre format shops and stores (7,120 sqm gross / 5,340 sqm net)
in or on the edge of Eastleigh town centre at 2016, which would attract market shares of
convenience and comparison goods expenditure.
2.56 In Eastleigh town centre, convenience retailing under Scenario One indicates potential for
a small increase in convenience floorspace. Scenario Two assesses the impact of a new
food/non foodstore and new town centre format shops in or on the edge of Eastleigh. This
scenario would result in some reduction in the market shares of existing shops in Eastleigh
and also reduced market shares of convenience goods expenditure attracted to main
food stores in Chandlers Ford. As a result there would be modest over supply of
Southampton City Council and Eastleigh Borough Council Retail Study
July 2011 I gva.co.uk 16
convenience goods floorspace in Eastleigh by 2016 and 2021 which would result in a
significant adverse impact on Eastleigh town centre.
2.57 With regard to convenience retailing under Scenario One, the study identified capacity to
support 400 sqm net additional convenience goods floorspace in Chandlers Ford by 2021.
Under Scenario 2, on the basis that significant market shares would be redirected from
Chandlers Ford to a new superstore in Eastleigh, the Study indicates that there will be an
over-supply of convenience goods floorspace in the region of 900 sqm net at 2016, falling
to 500 sqm net at 2021.
2.58 The Study concludes that overall capacity for new convenience goods floorspace in
Eastleigh is limited, and a large superstore could only be developed if one of the existing
food retailers in Eastleigh town centre was to relocate out of the centre.
2.59 In respect of comparison goods, the capacity figures for Eastleigh under Scenario One
indicate capacity of up to 6,300 sqm net additional comparison goods floorspace by
2021. These figures are less than the amount of vacant retail units in the town centre
which would absorb some of the forecast growth in capacity.
2.60 Under Scenario Two, there should be sufficient expenditure by 2016 to support the re-use
of the existing Tesco or Sainsbury’s stores for comparison goods retailing, if either of these
retailers was to occupy the potential new superstore. By 2021, this capacity increases
further. There would also be capacity for up to 8,450 sqm net new comparison goods
floorspace in or on the edge of the town centre by 2016, rising to 10,000 sqm net by 2021,
if forecast trends occur. However, some of this would come at the expense of the
reduced capacity in Eastleigh town centre as existing.
2.61 The comparison capacity forecasts indicate that there is insufficient expenditure to
support both the substantial redevelopment of the existing town centre and large scale
new comparison goods retail floorspace at the Barton Park site in the period to 2016. The
Study advises that only if the redevelopment of the town centre is demonstrated not to be
financially viable, or not practicable for other reasons, should new comparison goods
retail development be pursued at Barton Park.
Southampton City Council and Eastleigh Borough Council Retail Study
July 2011 I gva.co.uk 17
3. National Trends
3.1 To put our assessment of the quality of existing provision and the need for additional
floorspace in Southampton and Eastleigh into context, it is relevant to consider the wider
economic and social trends likely to influence retailing in the study area. This section
therefore examines key trends and drivers for change in the retail industry and outlines
those of particular relevance to Southampton and Eastleigh drawing from a range of
published data sources, including research by Verdict Analysis, Mintel, Experian and the
New Economics Foundation.
Demographics
3.2 Over the last 15 years the UK population has increased by 3.9 million to 61.8 million (2009
mid-year estimate); a rate of approximately 0.44% per annum amounting to a total
increase of 6.7% over 15 years. The number of households has also increased over the
same period but at a greater rate (11.5% over 15 years). The average household size has
however decreased from 2.46 people per household in 1994 to 2.36 people per household
in 2009, as decreasing family sizes and instances of divorce are becoming more
common1.
3.3 The population is forecast to continue growing. The total fertility rate (TFR) in the UK has
risen each year since 2001 until recently. It was last recorded in 2009 at 1.94 children per
woman, which represents a small decrease from 1.96 in 2008 which was the highest level
recorded since 1973. Although the current TFR rate has not reached the natural
population replacement level of 2.1 children per woman, other factors such as increased
life expectancy and immigration combine to boost projected population numbers2.
These trends are forecast to continue and will affect spending habits, how much we
spend, on what and where.
1 Office of National Statistics, 2009. Figures have been interpolated between 1991 and 2001 to account for 2001 Census
data 2 Office of National Statistics, 2010.
Southampton City Council and Eastleigh Borough Council Retail Study
July 2011 I gva.co.uk 18
3.4 Over the next 20 years (2010-2030) the 65 and over age group is expected to grow by
42.8% and the under 65s age group by only 6%2. Older shoppers have a younger mindset
than in the past, they are more fashion aware and, in recent years, more affluent as a
result of general house price growth as well as income growth (but post retirement income
from pensions could become a concern if they do not achieve anticipated values). They
will have more time to shop, will spend more on DIY and gardening and will expect good
customer service. Clearly, the economic slowdown will impact upon disposable income
and pension pots with more cautious spending patterns in the immediate future.
3.5 Younger shoppers will have higher education fees to pay, will experience higher housing
costs, they will be more computer literate and spend more on-line, and will spend more on
entertainment/leisure so they may have less to spend in the retail sector.
Income and Expenditure
3.6 Incomes and expenditure grew strongly during the last 20 years, with retail expenditure
growing faster than incomes supporting strong growth and development in the retail
sector. Overall, retail expenditure increased by about 3.29% pa in real terms between
1990 and 2008, with most of this growth on comparison goods where an annual growth
rate of 5.67% had been in effect between 1990 and 2008. Convenience goods spend had
been growing at a much lower rate with a steady increase of under 0.86% per annum3.
3.7 Recent economic circumstances have however, reversed this pattern of growth and the
pace of economic recovery is expected to affect expenditure growth until at least 2012
when it is anticipated that growth levels will begin to approach more normal levels. The
rapid deterioration in the economy’s performance during the final months of 2008 had far-
reaching implications for available income and, consequently, expenditure. The outputs
from this study take into account these events and the effects of the recession. Experian
report as follows:
“The UK economy is recovering from the severe recession of 2008/09, but growth is
patchy and risks of relapse persist. Domestic demand is restrained by high
3 ONS, Consumer Trends June 2009

Southampton City Council and Eastleigh Borough Council Retail Study
July 2011 I gva.co.uk 19
unemployment and rising under-employment, a lacklustre outlook for investment,
pressure on public finances and the weight of household debt’4
3.8 Verdict reported that economic deterioration was rapid with the fourth quarter of 2008
seeing a year-on-year decline of 1.5% - one of the sharpest contractions in economic
growth since the early 1980s. 2009 brought a sharp contraction in activity and more
recent reports suggest that ‘growth will be lacklustre. However, as GDP growth improves
through 2012 onwards, retail expenditure should also benefit’5.
3.9 Growth projections used in retail studies and supporting retail statements for planning
applications should therefore respond to the most up to date advice in respect of
economic expectations. There are two main accepted approaches for forecasting per
capita expenditure growth. The first is based on an extrapolation of trends and the
second is based on forecasts using an econometric model of past trends and other
economic variables. Due to the retail expenditure boom in the latter half of the 1990s and
the first half of the 2000s and the major economic recession which followed, there are
significant differences between these two approaches.
3.10 Trend growth rates have, until recently, been influenced by the spending boom of recent
years (until 2007). Trend line forecasting, based on these historic trends, incorporate
booms and busts since the 1960s and therefore provide a flat rate average over long and
ultra long-time periods. These are no longer appropriate for short-term retail projections
given the current slow-down in the economy. The period up to 2016 will be affected
noticeably by the severe recession and the weak upturn that is likely to follow due to the
severe spending cuts and taxation increases planned.
3.11 The growth projections used within this report have therefore responded to advice in
respect of the use of forecast growth rates based on consumer expectations. The use of
such rates is supported by the latest Experian’s Retail Planner Briefing Note 8.1 (August
2010) which sets out that:
4 Experian Retail Planner 8.1 (August 2010) 5 Verdict Datamonitor, July 2010, UK Retail Futures 2014: Retail and the Economy

Southampton City Council and Eastleigh Borough Council Retail Study
July 2011 I gva.co.uk 20
‘We believe that because of the significant constraints on economic activity over the
next few years….and the slower growth forecast for consumer spending in the longer
term, it is appropriate to use the forecast growth rates…rather than either the long-
term, medium term or ultra long-term trends’.
3.12 On this basis we are advised to use the economic forecasts prepared by Pitney Bowes
and Experian Business Strategies which take into consideration current and future
economic instability. Where there are differences between Experian and Pitney Bowes,
an average of their forecasts is adopted. Evidently, these forecasts affect the growth
rates used for our retail capacity forecasting and have subsequent implications on the
levels of floorspace town centres can sustain in the short-to-medium term, i.e. up to 2016.
It should also be acknowledged that, over the short to medium term at least, the growth
rates adopted by this study are lower and more conservative than those adopted by
previous assessments.
3.13 Non-store retail sales (e.g. mail order, vending machines, markets, road-side stalls),
excluding e-tailing, are expected to decline over the next ten years, but this will be more
than offset by the growth of e-tailing, resulting in overall growth in non-store sales in
absolute and percentage terms. E-tailing is increasing strongly by both bricks and mortar
retailers and non-store virtual retailers, but the rate of growth now seems to be slowing.
3.14 Experian published a note on ‘non-store retailing’ in March 2010 setting out revised
estimations of Internet retail sales which are much higher than previously expected. These
estimations are based on revised ONS data which adopts an improved methodology of
all sales made over the Internet covering 95% of the retail sector in terms of turnover. The
ONS series previously suggested in mid-2009 that Internet sales were 3.5% of total retailing
sales, but the revisions now suggest the figure is nearly double this. In their note, Experian
provide forecasts to 2026 which take into account the impact of broadband technology,
speed of access to the Internet, problems of delivery and receipt of goods when away
from home at work etc.
3.15 The impact of growth in e-retailing on future demands for retail floorspace is an important
consideration and has been factored into the forecasts set out later in this report. Factors
such as the processing of online grocery orders by retailers such as Tesco in local stores,
and the potential use of shops as showrooms and/or collection points may mean that the
growth in Internet sales will not necessarily lead to an equivalent reduction in floorspace
Southampton City Council and Eastleigh Borough Council Retail Study
July 2011 I gva.co.uk 21
requirements. See the subsection on Internet shopping and e-tailing below for more
information.
3.16 According to Verdict, customers are becoming more selective in their purchasing habits
as they become more concerned about the economic outlook. With rising living costs,
disposable incomes are being squeezed, and as a result customers are shopping around
more to find the best possible value. Increasingly retailers are finding it harder to please
customers and across all sectors, retailers are converting fewer customers into main users
and shoppers are less loyal to their main stores. Such circumstances will have implications
on retail capacity forecasting, particularly over the short-term.
3.17 Consumer spending is likely to remain weak over the coming months. Taxes are rising to
pay off substantial government debt, wage growth is slowing and unemployment is rising;
consumers are prioritising debt reduction; these factors are expected to combine to offset
any advantages from falling inflation and ensure that spending will remain low. However
there will be pockets of growth as the weak pound encourages increased tourism
activity.6
3.18 On the basis of uncertainty over current forecast levels of growth in expenditure we
strongly recommend that the capacity forecasts set out in Section 7 are updated at
appropriate intervals to reflect updates to expenditure and population projections, and to
build in the impact of new development and commitments over time.
Sales Efficiency
3.19 In undertaking retail capacity and impact assessments it is generally accepted that an
allowance should be made for growth in the turnover ‘efficiency’ (or ‘productivity’) of
existing retail floorspace to reflect retailers’ ability to improve their productivity. This
increased efficiency helps maintain the vitality and viability of town centre businesses.
3.20 An efficiency growth rate represents the ability of retailers to increase their productivity
and absorb higher than inflation increases in their costs (such as rents, rates and service
charges) by increasing their average sales densities. The application of a turnover
6Verdict Research: ‘UK Sectors Summary Q4, 2009’
Southampton City Council and Eastleigh Borough Council Retail Study
July 2011 I gva.co.uk 22
‘efficiency’ growth rate is a standard approach used in retail planning studies and PPS4
also advocates the use of “a realistic assessment of…forecast improvements in
productivity in the use of floorspace”7.
3.21 Although hard quantitative evidence is limited, comparison businesses in particular have,
over time, increased sales densities by achieving improvements in productivity in the use
of floorspace. PPS4 (EC1.4.c.iii) requires that quantitative need assessments have regard
to a realistic assessment of such improvement. Analysis of past data is difficult as sales
densities increases have been affected by changes in the use of retail floorspace over the
last 20 years, with higher value space-efficient electrical goods replacing lower value
space intensive goods, the growth in out-of-centre retailing, a number of one-off events
like Sunday-trading and longer opening hours and the very strong growth of retail
expenditure relative to the growth in floorspace.
3.22 Evidently, in the current economic climate many retailers have struggled to increase or
even maintain sales density levels and, together with other financial problems, have led
retailers into closure, such as Woolworths and Adams. With the expectation of weaker
expenditure growth in the future, sales density growth is also expected to decrease. For
comparison goods, we are now incorporating an efficiency growth rate of 1.2% per
annum in the period 2011 to 2016 and 2.0% per annum post-2016. For convenience goods
we have incorporated an efficiency growth rate of 0.2% per annum between 2011 and
2016, and 0.3% per annum post 2016.
Employment
3.23 Between 1998 and 2007 retail expenditure has increased by approximately 5.5% per
annum, but retail employment has increased much more slowly. Over the same period
total employees in retail employment in Great Britain have increased from 2.63 million to
2.76 million, an increase of 0.5% per annum. However, this growth has been made up
mostly part time employment. Full time equivalent (FTE) employment has increased very
little8.
7PPS4, Paragraph EC1.5.c.iii 8 Annual Business Enquiry, 2009

Southampton City Council and Eastleigh Borough Council Retail Study
July 2011 I gva.co.uk 23
3.24 Over the next 15 years Experian Business Strategies expect a 13% increase in FTE
employment in the retail sector with a slightly higher increase in part time employment.
Evidently, this needs to be monitored in the forthcoming years based on the slow down in
the economy and corresponding growing levels of unemployment with significant
consequences for available retail expenditure and retail sector employment positions9.
Size of Units
3.25 The growth of multiple traders and increased competition between companies has meant
that the retail structure is increasingly dominated by large companies requiring larger shop
units. Shopping centres and out-of-centre development that has been able to
accommodate this demand for larger sized units (typically 500-2,000 sqm or larger) have
grown in importance, reinforcing the trend of higher order centres and out-of-centre
retailing growing in relative importance (i.e. polarisation in the retail hierarchy).
3.26 The growth in the size of stores has caused a contraction in the number of shop units and
consumer choice. This is particularly evident in the food sector, with a marked decline in
the number of smaller and more specialist food retailers (greengrocers, butchers,
fishmongers, bakers etc), and a large increase of superstores. This is indicated by Verdict
Research which shows a 5.5% reduction in the total number of convenience stores
between 1998 and 2008, as space is concentrated into a smaller number of larger stores.
3.27 Over the same time period the number of superstores (>2,323 sqm net) has increased by
39%; food specialists and off licences/tobacconists have also declined - by 32.9% and
56.6% respectively. These trends may well weaken in the future due to possible market
saturation of large foodstores and concerns over lack of competition due to the market
dominance of a few key multiples10.
3.28 Out-of-town store sizes have also increase in size between 1998 and 2008, over the period
average out-of-town store sizes have increased from 1,939 sqm by 5% to 2,037 sqm11.
9 Experian, FTE Employment Levels, Retailing (SIC 2003 code 25) 10 Verdict Research, Datamonitor: “UK Food and Groceries Retailers 2009” 11 Verdict, Datamonitor: “UK Out-of-Town Retailing 2009”
Southampton City Council and Eastleigh Borough Council Retail Study
July 2011 I gva.co.uk 24
Average town centre retail store sizes increased slightly between 1998 and 2008, rising
from 183 sqm to 193 sqm, an increase of 5.5%12.
Foodstores
3.29 Due to the restrictions on developing large new foodstores, there has been growth in the
number of applications for the extension of existing foodstores and an adjustment in the
composition of floorspace within existing stores over the last ten years. There has been an
increased emphasis on the sale of comparison goods at the expense of convenience
goods, as expenditure growth rates for comparison goods are much higher than for
convenience goods and profit margins are greater, although sales densities are often
lower.
3.30 This trend poses an increasing threat to smaller centres, as larger foodstores will
increasingly sell a wider product range of day-to-day convenience and comparison
goods and services. According to Verdict, comparison goods floorspace in the larger
format stores of the top four grocers now accounts for averages of between 18%
(Morrisons) and 40% (Asda) of net retail floorspace13.
Internet Shopping / e-Tailing
3.31 Internet sales have grown rapidly and affect how and where we shop, although the rate
of growth slowed markedly in 2008. In the early days of Internet retailing, back in the late
1990s, growth was due to the emergence of virtual retailers. Things have moved on in
recent years and recent research indicates that much of the growth in Internet sales has
been from sites of established retailers (e.g. Tesco, Argos, John Lewis etc.), who are
creating “virtual outlets” to expand their market shares of retail spend.
3.32 In 2008 there was an increase of 1% in the number of Internet users to 35.4 million people,
and an 18.1% increase in online shoppers to 26.7 million shoppers. In addition to this
increase the amount of money the average Internet shopper is spending online is also
12Verdict Research, Datamonitor: “UK Town Centre Retailing 2009” 13Verdict Research: ”Grocery Sales Analysis Sheet”, 2008
Southampton City Council and Eastleigh Borough Council Retail Study
July 2011 I gva.co.uk 25
increasing, average online spend per person rose by 5.8% between 2007 and 200814. As
technology continues to improve, it will fuel further growth in the market. Overall the
value of e-Retail is estimated to be £26,361 million in 2011, with an annual growth rate of
14%15.
3.33 High street retailers have particularly benefited from the growth of Internet shopping as
their brand are widely recognised and trusted by consumers. They also benefit from
greater buying power, which means they are often able to offer discounts. Price-
comparison sites have also increased the trend towards price cutting on the Internet,
particularly in relation to small electrical products, CDs and software.
3.34 Despite this growth, e-tailing still only accounts for a fraction of total sales for mainstream
retailers in the UK. Furthermore, sales on the Internet have to some extent been a switch
from mail order and for some retailers (e.g. Tesco) involve sales from retail rather than
warehouse floorspace. Even where sales are from warehouses, retail floorspace may still
be required to fulfil a showroom function. In addition there are a growing number of signs
that the Internet is beginning to mature and enter a new, more subdued phase of growth.
3.35 Consistent with wider retail trends, growth in e-Retail declined in 2009 as a result of the
recession reducing consumer demand. Austerity cuts on the spending ability of the most
prolific online shoppers (35-44 year olds) also had an impact on reduced demand during
this period. New arrivals to the on-line market, such as Gap, H&M and Zara which all
launched online sales in 2010, are expected to encourage more spend online. However,
whilst boosting growth, the arrival of these retailers will mainly act as an intensifier of
competition. Overall, growth in online shopping is set to slow down significantly as the
channel matures and competition increases16.
3.36 Whilst overall growth is expected to slow down significantly compared to the acceleration
of previous years, Verdict predicts that in 2011 shoppers will still increasingly turn to the
internet to save time and money and for convenience. Savvier shoppers will use voucher
codes and cash back sites which will further boost online sales in 2011. A further driver of
14Verdict Research, “e-Retail Storms Ahead Through the Recession”, June 2009 15Verdict Research, “Retail Futures H1 2011 - e-Retail”, March 2011 16Verdict Research, “Retail Futures H1 2011 - e-Retail”, March 2011
Southampton City Council and Eastleigh Borough Council Retail Study
July 2011 I gva.co.uk 26
growth in e-Retail will be improving the functionality of websites to enhance the shopping
experience, including new ways to pay such as one-click payments, which will encourage
shoppers to spend more online.
3.37 Social shopping and networking through the capabilities of Facebook and other social
media sites will maximise customer recommendations, increase customer loyalty, drive
traffic and increase spend online. Improved delivery and returns procedures, in terms of
greater flexibility, adaptability and accuracy will encourage e-Retailing through features
such as ‘click & collect’. Online sales in 2011 are also likely to be boosted through an
increased role in M-commerce (mobile commerce). Smartphones, IPad and Tablet
devices will see shopping applications improved and mobile optimised websites
becoming the norm.
3.38 Despite more modest levels of growth in online shopping, there will continue to remain
reasonable pressure on the traditional brick and mortar retailers in the UK’s town centres.
Shoppers are able to select their own retail mix online and shopping centres will need to
compete with this choice, which is not only driven by price and range, but also service
and expertise. Online shopping has driven expectations of convenience and service
upwards and customers are expecting more from in-store ambience to tempt them to
make a purchase17. Town centres will increasingly have to provide a shopping
‘experience’ that the Internet is unable to match. In accordance with PPS4, the emphasis
should be on the overall town centre experience, the mix of uses, and not just the retail
offer.
Shopping and Leisure
3.39 Due to increased affluence and mobility, and the rise of the Internet, shoppers no longer
merely shop to satisfy ‘needs’, they increasingly shop to satisfy ‘wants’ as well. Retailing in
the higher order centres and the more attractive smaller centres is changing and
arguably becoming more of a quasi leisure experience. Leisure spending growth is
continuing to outstrip that of retail, and despite the economic slowdown, at the moment
consumers seem to be willing to continue spending on leisure.
17Verdict Research, “How Britain Shops: Overall 2011”, March 2011
Southampton City Council and Eastleigh Borough Council Retail Study
July 2011 I gva.co.uk 27
3.40 Quality restaurants, coffee shops, cafes and bars, as well as health and fitness centres and
multiplexes in larger centres, are therefore important to attract shoppers and encourage
longer stays and higher spending. Better integration of retail and leisure facilities mutually
benefits both sectors. Pedestrianised streets and covered retail areas are also important in
attracting shoppers, as is the overall attractiveness of the town centre, along with good
accessibility and car parking.
3.41 A number of factors have helped drive the growth of leisure provision in town centres.
Planning policy is important as is the fact that urban living is fashionable. Town centres
can offer consumers a much more vibrant atmosphere in which to eat and drink and they
also offer a much wider choice of leisure venues, allowing more spontaneous decisions.
For bars, restaurants and health and fitness clubs, the attraction of the town centre is
‘daytime trade’ and the ability to capitalise on proximity to businesses and shoppers.
3.42 The leisure industry has enjoyed buoyant market conditions over the last decade as a
result of growing levels of disposable incomes and low unemployment. Much of the
growth has been fuelled by an increase in the number of ‘cash-rich, time-poor’ consumers
who have been prepared to pay a premium price for convenient services in order to save
time. Leisure time has become a precious commodity to consumers and in order to
maximise free time, consumers have often combined leisure activities as part of an overall
going out experience. The range of leisure choices has also grown considerably leading
to an increase in competition in the industry.
3.43 The recession has brought many challenges for the leisure industry. On one hand, the
industry is considered to be particularly exposed to the economic downturn due to the
discretionary nature of leisure expenditure, but contrary to this leisure activities remain an
important lifestyle choice for many consumers and who will prioritise leisure over other
areas of spending.
Out-of-Centre Retailing
3.44 Retailers are increasingly expanding out-of-town as it offers lower rents, better space and
in most cases, free parking. According to Verdict, out-of-town is the only channel which
has seen store numbers increase consistently since 2000. Indeed, out-of-town store
Southampton City Council and Eastleigh Borough Council Retail Study
July 2011 I gva.co.uk 28
numbers have increased year-on-year over this period with the exception of 2009 when it
was hit by the collapse of MFI and Land of Leather as the start of the downturn impacted
on the housing market18.
3.45 Retailers are increasingly seeking an out-of-town presence for its advantages over town
centres. For example, in 2010 John Lewis opened its first ‘at home’ store in an out-of-
centre retail park in Poole. Since then, the retailer has opened three other ‘at home’
stores and plans several others during 2011. Other retailers including H&M and Primark are
also reported to be seeking to expand their portfolio in out-of-centre locations.
3.46 However, simultaneously the increase in vacancies in town centre locations as a
consequence of the recession has also had the effect of re-directing the attention of
other retailers such as New look away from out-of-centre locations highlighting a
preference for town centre locations where suitable accommodation is available to meet
retailer needs.
Summary
• Incomes and expenditure have shown strong growth over the last 20 years, with retail
expenditure growing faster than incomes. This has seen corresponding increases in
sales densities within existing retail floorspace, which has also been driven by factors
such as high value space efficiency and longer opening hours. Crucially, the
economic crisis has had an impact on the retail sector, and growth forecasts will need
to reflect recent publications from Experian Business Strategies.
• The composition of town centres has changed through new development, with a
growing number of companies requiring larger shop units to meet their shop format
ratios. This has again favoured the larger centres which generally have the space to
meet such retailer requirements. This is particularly noticeable in the convenience
sector, which has begun to offer an increasing supply of comparison goods in the
larger foodstores, in addition to the traditional product offer; such stores therefore
require more retail floorspace. The dominance of such foodstores has led to current
concerns about market dominance and the lack of competition.
18 Verdict Research, ‘UK Town Centres 2011’

Southampton City Council and Eastleigh Borough Council Retail Study
July 2011 I gva.co.uk 29
• As competition from the Internet increases, town centres need to offer a quality
destination where people want to spend time and gain access to facilities not
available on the web. There has been a continued polarisation towards larger
centres and the provision of larger stores in these centres. Where smaller centres have
been unable to diversify their offer or create niche markets and a mix of retail, leisure
and service facilities they have suffered.
• Leisure spending growth is continuing to outstrip that of retail, and despite the
economic slowdown, at the moment consumers seem to be willing to continue
spending on leisure. The mix of uses in a town centre is vital to offer choice to
shoppers, and quality restaurants, coffee shops, cafes, bars and other leisure facilities
are all important to encourage frequency of visit and longer stay times.
• Town centres are continuing to face competition from out-of-centre retail locations as
retailers seek to take advantage of lower rents, better space and in most cases, free
parking. Whilst several retailers have recently expanded their out-of-centre portfolio,
there are others who have re-directed their attention away from out-of-centre
locations and taking advantage of arising vacancies town centre locations.
• Whilst the recession has now ended, the economic growth outlook remains weak and
fragile in the UK. Beyond 2011 however gradual improvements are expected.

Southampton City Council and Eastleigh Borough Council Retail Study
July 2011 I gva.co.uk 30
4. Sub-Regional Context
4.1 This section examines the retail performance of Southampton and Eastleigh in the context
of the retail network across the wider sub-region and identifies key changes since previous
studies. Our analysis draws on the results of the recent household survey and the latest
information from a variety of other data sources (including PROMIS, Javelin Retail
Rankings, the Focus Property Intelligence database, the Valuation Office Authority and
EGi) to identify the main retail offer and floorspace provision in each competing centre,
and the extent to which this is likely to change and influence shopping patterns in the
region in the future.
4.2 Results from the household telephone survey show the main competing centres which
have an influence over shopping patterns within the survey area include Portsmouth
(including Gunwharf Quays), Fareham, Newport, Winchester, Gosport, Salisbury, Romsey,
Bournemouth, Waterlooville, Whiteley and Chichester. The out-of-centre retail provision,
particularly within Eastleigh Borough (e.g. at Hedge End), is also a significant competitor.
4.3 Summary tables showing the performance indicators for each centre are included in
Appendix 1a. The rank of each centre has been derived from Javelin (Venuescore 2009).
Javelin Group’s Venuescore provides an up-to-date ranking of UK shopping venues across
a number of key indicators – scale, market positioning, fashionability and age positioning
of the retail offer. The score attached to each operator is weighted to reflect their overall
impact on shopping patterns. For example, anchor stores such as John Lewis, Marks and
Spencer and Debenhams receive a higher score than unit store retailers to reflect their
major influence on shopping patterns. The aggregate score for each venue is called its
Venuescore.
4.4 Shopping patterns derived from the telephone survey allow us to calculate the amount of
comparison goods expenditure that each centre draws from within the study area. This
indicator considers the strength of the retail offer as well as the centres’ accessibility and
distance from Southampton and Eastleigh. The total expenditure leaking to these centres
is set out in Table 4.1 below, and illustrated on Plan 3.
Southampton City Council and Eastleigh Borough Council Retail Study
July 2011 I gva.co.uk 31
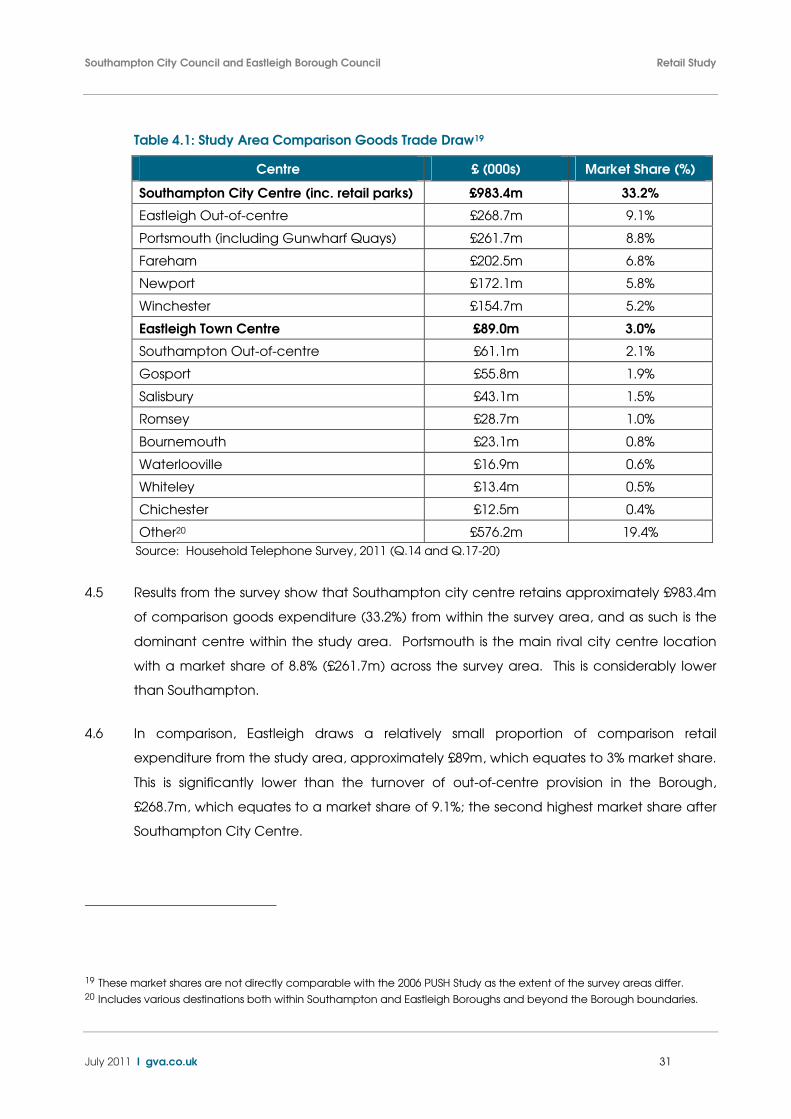
Table 4.1: Study Area Comparison Goods Trade Draw19
Centre £ (000s) Market Share (%)
Southampton City Centre (inc. retail parks) £983.4m 33.2%
Eastleigh Out-of-centre £268.7m 9.1%
Portsmouth (including Gunwharf Quays) £261.7m 8.8%
Fareham £202.5m 6.8%
Newport £172.1m 5.8%
Winchester £154.7m 5.2%
Eastleigh Town Centre £89.0m 3.0%
Southampton Out-of-centre £61.1m 2.1%
Gosport £55.8m 1.9%
Salisbury £43.1m 1.5%
Romsey £28.7m 1.0%
Bournemouth £23.1m 0.8%
Waterlooville £16.9m 0.6%
Whiteley £13.4m 0.5%
Chichester £12.5m 0.4%
Other20 £576.2m 19.4%
Source: Household Telephone Survey, 2011 (Q.14 and Q.17-20)
4.5 Results from the survey show that Southampton city centre retains approximately £983.4m
of comparison goods expenditure (33.2%) from within the survey area, and as such is the
dominant centre within the study area. Portsmouth is the main rival city centre location
with a market share of 8.8% (£261.7m) across the survey area. This is considerably lower
than Southampton.
4.6 In comparison, Eastleigh draws a relatively small proportion of comparison retail
expenditure from the study area, approximately £89m, which equates to 3% market share.
This is significantly lower than the turnover of out-of-centre provision in the Borough,
£268.7m, which equates to a market share of 9.1%; the second highest market share after
Southampton City Centre.
19 These market shares are not directly comparable with the 2006 PUSH Study as the extent of the survey areas differ. 20 Includes various destinations both within Southampton and Eastleigh Boroughs and beyond the Borough boundaries.
Southampton City Council and Eastleigh Borough Council Retail Study
July 2011 I gva.co.uk 32
4.7 Eastleigh town centre’s market share is also lower than the market shares achieved by
Portsmouth, Fareham and Winchester and highlights the competition Eastleigh faces, not
only by Southampton, but also by other higher order centres located beyond the survey
area.
Profile of Key Competing Centres
4.8 We now consider the profile of the six main competing centres which achieve over 1%
market share in the survey area.
Portsmouth
4.9 Portsmouth is located approximately 29km south east of Southampton city centre and
31km south east of Eastleigh town centre. Retail floorspace in Portsmouth city centre is
predominantly concentrated around the pedestrianised section of Commercial Road,
Cascades Shopping Centre and Arundel Street. The trade draw of Portsmouth outlined in
Table 4.1 includes Gunwharf Quays as part of Portsmouth’s retail offer. Gunwharf Quays is
an outlet shopping centre located at Portsmouth Harbour located approximately 1.5km
south west of Portsmouth city centre. The city centre has a total retail floorspace of
approximately 94,238 sqm and Gunwharf Keys comprises c. 52,070 sqm.
4.10 The most recent Experian Goad reports (January and February 2010) show that
Portsmouth city centre (including Gunwharf Quays) has a below average vacant retail
floorspace. According to Focus there were 15 retailer requirements for Portsmouth in
March 2011, which is lower than the 29 identified for Southampton, but higher than the 3
identified for Eastleigh. Portsmouth city centre also ranks below Southampton in the
Venuescore / Javelin rankings (rank 98 compared to 14 for Southampton), but ranks
higher than Eastleigh which is ranked 243rd. Portsmouth has historically had lower prime
zone ‘A’ rents and also slightly higher yields than Southampton, whilst Portsmouth has had
higher prime zone ‘A’ rents (£1,722 per sqm) and lower yields (at 5.5%) than Eastleigh.
4.11 Portsmouth is the main rival shopping destination for Southampton and Eastleigh,
however, overall the city does not attract a higher market share than Southampton.
Portsmouth does however, attract a greater market share than Eastleigh (8.8% compared
to Eastleigh’s 3%), which is to be expected considering the relative scale of the two
centres. Portsmouth has the dominant market share in Zone 24, the east of the study area.
Southampton City Council and Eastleigh Borough Council Retail Study
July 2011 I gva.co.uk 33
The centre is less influential outside of this catchment area, but still has a small share in
Zones 19 and 21, east of Hedge End.
4.12 The current pipeline development scheme in Portsmouth is the redevelopment of the
Northern Quarter, the former Tricorn Centre which was demolished in 2004. The site has full
planning consent for approximately 92,900 sqm gross of retail and leisure floorspace. The
scheme was intended to be completed in 2010, however due to the recession the
scheme has been delayed, and the Council and developer have extended the
development agreement to 2015. We understand that revised plans for the scheme are
likely to be submitted. We anticipate that Portsmouth will continue to pose the strongest
competition and if the Northern Quarter development does go ahead, this could result in
Portsmouth strengthening its market share, particularly in the eastern part of the study
area.
Fareham
4.13 Fareham town centre is located between Southampton and Portsmouth, approximately
22km south east from Southampton city centre and 24km south east from Eastleigh centre.
The centre comprises approximately 72,285 sqm retail floorspace, this is larger than
Eastleigh town centre, but smaller in scale compared to Southampton. The main retail
areas of the town centre are located along West Street. There are two managed
shopping centres situated on the pedestrianised section of West Street; Fareham
Shopping Centre and Market Quay. Fareham Shopping Centre first opened in 1976 and
was refurbished and extended in 2009. Market Quay is a somewhat smaller shopping
centre and opened in 2004. Key retailers in the town include Marks and Spencers,
Wilkinson and Bhs.
4.14 The most recent Goad Category Report for the town in February 2010 found that Fareham
has a slightly above average level of vacant floorspace. Fareham has a Venuescore /
Javelin ranking of 214, which is slightly higher than Eastleigh. In terms of prime zone ‘A’
retail rents (£1,346 per sqm) and prime retail yields (at 6.5%) Fareham is performing more
strongly than Eastleigh, although not as strongly as Southampton. Fareham has a
reasonable influence over shopping patterns in the east of the survey area, in particular it
draws significant proportion trade from Zones 24 and 19, as well as a degree of trade from
Zones 18, 20 and 21.
Southampton City Council and Eastleigh Borough Council Retail Study
July 2011 I gva.co.uk 34
4.15 The main pipeline town centre scheme is the erection of a Tesco supermarket on Quay
Street. Planning consent has been granted for the store and we understand that the
supermarket is currently being constructed. The supermarket has permission for a gross
external floor area of 6,215 sqm (net sales floorspace approximately 3,900 sqm), of which,
no more than 30% of the net retail floor area is permitted for the sale of comparison
goods.
Newport
4.16 Newport is located on the Isle of Wight, approximately 30km by land and sea from
Southampton and 41km from Eastleigh. Newport is one of the largest centres in the Isle of
Wight. Key shopping areas in the town include High Street, St James Street and Holyrood
Street. The main retailers in the town centre include Bhs, Robert Dyas and Somerfield.
Newport town centre has a total retail floorspace of approximately 86,090 sqm. In terms
of vacant units, the centre is performing strongly, well below the national average of
vacant floorspace.
4.17 Newport has a Venuescore / Javelin ranking of 256th, which is lower than the ranking of
Southampton and Eastleigh. Newport outperforms Eastleigh in relation to prime zone ‘A’
rents (£646 per sqm) and prime retail yields (at 6%), although Southampton performs more
strongly than both centres in terms of rents and yields. Our survey area extended into the
Isle of Wight, and it is Zone 28 where the centre of Newport is the dominant centre,
drawing 86.2% of trade from this Zone. Unsurprisingly the centre has no trade draw from
any of the other Zones which are all located on the mainland. Despite the location of
Newport, the centre still manages to achieve a total trade draw of 6% from the survey
area. We are not aware of any major retail commitments in Newport town centre.
Winchester
4.18 Winchester is located approximately 10km north of Eastleigh and 20km north of
Southampton. Key shopping areas in the town include The Brooks Shopping Centre and
pedestrianised High Street. The main anchors include Marks and Spencer, Debenhams
and Sainsbury’s. Winchester currently combines a total floorspace of approximately
67,733 sqm. The centre has a below average amount of vacant floorspace and is ranked
141st by Venuescore/Javelin.
4.19 Winchester has higher prime zone ‘A’ retail rents (£1,615 per sqm), lower retail yields (at
5%) and 21 retailer requirements. Winchester attains a good trade draw from the north of
Southampton City Council and Eastleigh Borough Council Retail Study
July 2011 I gva.co.uk 35
the survey area, particularly in Zone 25, where it draws 48.1% of all trade in this zone. The
centre also performs strongly in Zones 13 and 23 in the north of Eastleigh, and performs
relatively well in Zones 9, 11, 12 and 14.
4.20 Pipeline developments in Winchester include Silver Hill, which is the area adjacent to the
bus station. The site currently has planning permission for a mixed use development
comprising retail, offices and residential. Work on the site has currently stalled, with the
original developers going into administration. The Council anticipates that work is
scheduled to start on the site in 2013, following compulsory purchase order of the land
required. The scheme has permission for a total retail floorspace of 10,168 sqm (gross
external area). Once implemented this scheme could potentially enlarge Winchester’s
trade draw, especially from the zones surrounding and including Eastleigh (Zones 13 and
23).
Gosport
4.21 Gosport is a small centre situated on the western side of Portsmouth Harbour, located
approximately 29km south east from Southampton and 36km from Eastleigh. Main
shopping areas in the centre include the pedestrianised High Street and Stoke Road. Key
retailers in the town include Morrisons and Waitrose. The town centre has a total of retail
floorspace of approximately 31,600 sqm which is smaller in size than Eastleigh. Vacant
retail floorspace in Gosport is above the national average.
4.22 Due to the size of the centre there is limited other data available on its current
performance. Gosport draws a total of 1.9% trade from the survey area. Trade draw is
strongest in Zone 24 (5.4%) but the centre also draws some trade from Zones 15 and 16.
Salisbury
4.23 Salisbury is a medieval city located approximately 37km to the north-west of Eastleigh and
Southampton. The city centre features distinctive historic buildings including Salisbury
Cathedral and is a popular destination for tourists. Three managed shopping centres
within the city centre (Old George Mall, The Maltings and Cross Keys Mall) contribute to
the good mix of comparison, convenience and service units.
4.24 Salisbury city centre has a Venuescore / Javelin ranking of 59th, which is lower than
Southampton but higher than Eastleigh. Prime zone ‘A’ rents are relatively strong (£1,292
per sqm), performing more strongly than Eastleigh, but at a lower level than Southampton.
Southampton City Council and Eastleigh Borough Council Retail Study
July 2011 I gva.co.uk 36
Yields in Salisbury are at 6%, once again falling between the two centres. There appears
to be less demand in Salisbury city centre than Southampton with 14 retailer requirements
registered for Salisbury in March 2011.
4.25 The survey results indicate that Salisbury is the dominant centre in Zone 26, drawing 45.9%
of trade from the eastern survey zone. Salisbury also draws a smaller proportion of trade
from Zones 3, 5-6, 12, 16, 22-23, 25 and 27.
4.26 We are aware that full planning consent has been granted for the redevelopment of the
Sainsbury’s store in the Maltings shopping centre. In addition, the Maltings / Central Car
Park site is likely to be identified as a strategic allocation in the emerging Wiltshire Core
Strategy. In addition to the redeveloped Sainsbury’s, the site is considered appropriate for
a department store and other comparison shopping units with the potential for a total of
40,000 sq m of retail floorspace (gross). This has potential to enhance Salisbury’s current
performance and competitiveness in the wider sub-region which could increase its
influence over Eastleigh and Southampton’s catchments.
Summary
• In terms of the sub-regional context, the household survey has identified Portsmouth,
Fareham, Newport, Winchester, Gosport and Salisbury as the main competing centres
to Eastleigh, and to a lesser degree Southampton.
• It is evident that Southampton is the dominant centre and is performing well in terms
of the scale and quality of its retail offer, rents and rank position, drawing a third of
comparison trade draw within the survey area. Southampton’s strongest competitor is
Portsmouth, as the survey results indicate that it captures the next highest expenditure
from the study area, although with a significantly smaller market share of 9%.
Portsmouth may increase its competitiveness over the LDF period if the Northern
Quarter development goes ahead.
• As a smaller centre Eastleigh faces strong competition from higher-order centres and
there is a risk that if the centre does not enhance its own retail offer that the town’s
catchment and market share will be further eroded.
• We consider that it is appropriate for Southampton to strengthen its leading role in the
sub-region. We also consider it necessary for Eastleigh to continue to promote new
retail investment and development in town centre to ensure it remains competitive in
Southampton City Council and Eastleigh Borough Council Retail Study
July 2011 I gva.co.uk 37
response to the strengthening of Southampton as well as other centres in the wider
sub-region.
Southampton City Council and Eastleigh Borough Council Retail Study
July 2011 I gva.co.uk 38
5. Southampton City Centre Health Check
5.1 In this section we present up-to-date qualitative health check analysis for Southampton
city centre. Our health check assessment has been carried out in line with the Town
Centre Health Check Indicators set out in PPS4 which measure the vitality and viability of
the centre. Our findings are set out below.
Diversity of Uses
5.2 The Experian Goad survey of Southampton city centre (Central) (February 2010) identifies
a total of 245,350 sqm of ground floorspace for retail trade and services, across 589 units.
This information is drawn from the most recent ‘category report’ produced by Experian
Goad which provides a detailed breakdown of uses within the following categories:
convenience, comparison, service (including retail services, leisure services and financial
and business services) and vacant.
5.3 The Goad survey covers an extensive area including the core retail provision at West Quay
Shopping Centre in the centre; the traditional retail offer of Above Bar Street and the
Marlands Shopping Centre in the north; the retail warehouse provision at West Quay Retail
Park and Mountbatten Retail Park to the west; and the more secondary retail areas
including Bargate Shopping Centre, East Street and the High Street to the south and east
of the city. Throughout this section these areas are collectively referred to as
Southampton city centre, although later in this report we consider these distinct retail
areas in more detail.
5.4 Table 5.1 below highlights the composition of Southampton city centre’s retail and service
offer by the number of units, compared to the average of all UK centres. It is evident that
whilst the centre has an above average representation of comparison retailers, the
proportion of convenience and service units in the city is below the national average.
Comparison retailing is clearly dominant over other uses in the city, comprising
approximately 42% of all units. There are four managed shopping centres in the city
centre, and the proportion of total managed retail floorspace is high. We look at each
retail category in further detail below.
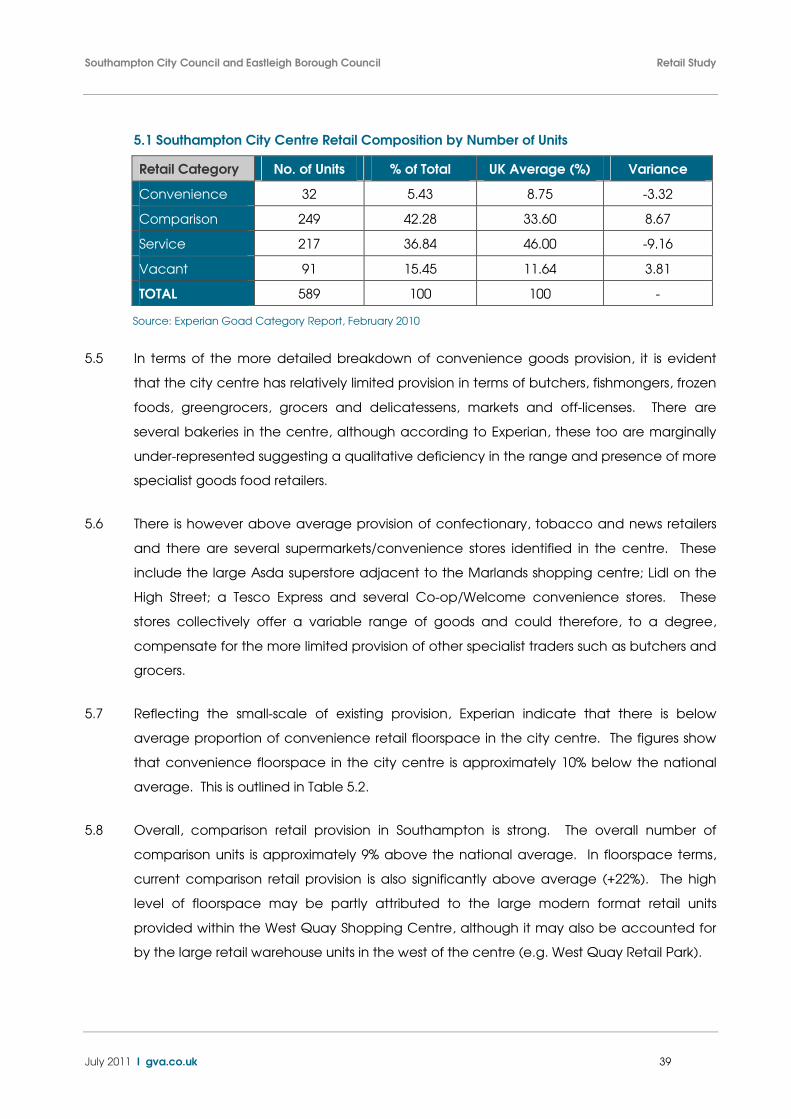
Southampton City Council and Eastleigh Borough Council Retail Study
July 2011 I gva.co.uk 39
5.1 Southampton City Centre Retail Composition by Number of Units
Retail Category No. of Units % of Total UK Average (%) Variance
Convenience 32 5.43 8.75 -3.32
Comparison 249 42.28 33.60 8.67
Service 217 36.84 46.00 -9.16
Vacant 91 15.45 11.64 3.81
TOTAL 589 100 100 -
Source: Experian Goad Category Report, February 2010
5.5 In terms of the more detailed breakdown of convenience goods provision, it is evident
that the city centre has relatively limited provision in terms of butchers, fishmongers, frozen
foods, greengrocers, grocers and delicatessens, markets and off-licenses. There are
several bakeries in the centre, although according to Experian, these too are marginally
under-represented suggesting a qualitative deficiency in the range and presence of more
specialist goods food retailers.
5.6 There is however above average provision of confectionary, tobacco and news retailers
and there are several supermarkets/convenience stores identified in the centre. These
include the large Asda superstore adjacent to the Marlands shopping centre; Lidl on the
High Street; a Tesco Express and several Co-op/Welcome convenience stores. These
stores collectively offer a variable range of goods and could therefore, to a degree,
compensate for the more limited provision of other specialist traders such as butchers and
grocers.
5.7 Reflecting the small-scale of existing provision, Experian indicate that there is below
average proportion of convenience retail floorspace in the city centre. The figures show
that convenience floorspace in the city centre is approximately 10% below the national
average. This is outlined in Table 5.2.
5.8 Overall, comparison retail provision in Southampton is strong. The overall number of
comparison units is approximately 9% above the national average. In floorspace terms,
current comparison retail provision is also significantly above average (+22%). The high
level of floorspace may be partly attributed to the large modern format retail units
provided within the West Quay Shopping Centre, although it may also be accounted for
by the large retail warehouse units in the west of the centre (e.g. West Quay Retail Park).

Southampton City Council and Eastleigh Borough Council Retail Study
July 2011 I gva.co.uk 40
5.2 Southampton City Centre Retail Composition by Floorspace (sqm gross)
Retail Category Floorspace
(sqm)
% of Total UK Average (%) Variance
Convenience 11,418 4.49 14.50 -10.01
Comparison 151,469 59.55 37.15 22.40
Service 66,491 26.14 38.55 -12.41
Vacant 24,972 9.82 9.80 0.01
TOTAL 254,350 100 100 -
Source: Experian Goad Category Report, February 2010
5.9 Closer analysis indicates that clothing retailers are represented exceptionally well, with
provision of men's, women's, children's and general clothing categories all above
average. Other categories which are also well represented include jewellery, footwear,
telephones, toiletries and toy shops. Those sectors which not as well represented include
chemists, florists and hardware.
5.10 Service uses in Southampton account for approximately 37% of all units, which is 9.16%
below the national average. Service uses also accommodate a much lower than
average proportion of the total floorspace, although this is not necessarily a negative
indicator. Closer analysis indicates that below average representation of retail banks,
legal and financial services, health and beauty salons, opticians and dry cleaners. This
reinforces the centre’s role as a comparison shopping destination as apposed to a service
centre.
5.11 Leisure services in Southampton are generally consistent with the national average, with a
strong representation of restaurants, cafes, bars and nightclubs, hotels and sports and
leisure facilities. Fast food takeaways are currently under represented, although this is not
a negative indicator as such uses in town centres are often considered to be less
desirable.
5.12 The main focus of leisure provision in the city is located in an edge-of-centre location to
the west of West Quay Shopping Centre. Within Leisure World are a number of main
leisure attractions such as a 13 screen Odeon cinema, Grosvenor Casino, nightclubs
(including Jumpin Jaks and Oceana) as well as restaurants including ASK and Frankie and
Benny’s.
Southampton City Council and Eastleigh Borough Council Retail Study
July 2011 I gva.co.uk 41
Retailer Representation
5.13 The presence of multiple retailers in a centre can enhance the appeal of that centre
although a strong independent sector is also important to add to the overall diversity of
the retail offer. In February 2010, Experian identified 317 multiple retailers in Southampton
city centre. This is a high proportion, equating to over half of all retail and service units
(54%). Experian also identified 181 independent retailers in the city, which is less than a
third of all units (31%). The remaining 15% of all units were identified as vacant.
5.14 Closer analysis reveals that the number of multiple retailers within the convenience sector
is below average. Multiple comparison retailers account for the highest proportion of
multiple retailers dominating the city, with 73% of all comparison units occupied by
multiple retailers. This leaves few units available for independent retailers, the presence of
which would help create a more distinctive offer.
5.15 There is a wide provision of multiple clothing retailers such as H&M, Next, Karen Millen, New
Look, Zara, Gap, Matalan, TK Maxx, Peacocks, Burton and Topshop. Other key multiples
include Ikea, Boots, Argos, Waterstones, Currys Digital, Toys R Us and HMV. Department
store offer in Southampton is particularly strong, and includes John Lewis (key anchor of
the West Quay Shopping Centre), Marks and Spencer, Debenhams and BHS.
5.16 In terms of major foodstore retailers in the city centre, the largest supermarket in the centre
is the Asda at Marlands Shopping Centre. There is also a Lidl on the High Street, and
several other operators, including Tesco and Co-op which operate small-scale
convenience stores.
City Centre Composition
5.17 The city centre can be broadly divided into four distinctive areas: Central (West Quay
Shopping Centre); Northern (Above Bar Street, The Marlands Shopping Centre and Asda);
Western (West Quay Retail Park and Mountbatten Retail Park); and South/East (the
Bargate Shopping Centre, East Street, East Street Shopping Centre and the High Street).
Central Area
5.18 The whole of the West Quay Shopping Centre is designated as primary retail frontage in
the adopted Proposals Map. West Quay is a modern shopping centre which opened in
2000. Comprising a total retail floorspace of c.74,320 sqm gross, the shopping centre has
Southampton City Council and Eastleigh Borough Council Retail Study
July 2011 I gva.co.uk 42
dramatically increased the supply and quality of retail floorspace in the city centre. West
Quay is split over three floors, with a food terrace on the top floor.
5.19 A multi-storey car park with a capacity of approximately 1,000 spaces is connected to the
west of West Quay, accessible by a pedestrianised footbridge across Harbour Parade.
There is also multi-storey car parking beneath the shopping centre, also accessible on the
western side of the centre. The topography of the site and the design of the shopping
centre mean that on the west side the multi-storey car park is at ground level with
shopping levels above, and on the eastern side of the shopping centre, the middle
shopping level leads directly on to street level at Above Bar Street.
5.20 At the time of our site visit, we found the shopping centre to be busy, with a notably high
footfall around midday. We also found that the vacancy level in West Quay is very low,
we only identified one vacant unit during our site visit, the former Monserrat clothing store.
Low vacancy rates would suggest that the shopping centre is meeting the needs of
modern retailers.
5.21 West Quay benefits from a very high quality shopping environment. The shopping centre
has been designed and built to a high specification and is clearly well maintained. West
Quay benefits from a range of different shop unit sizes, allowing retailers to trade from
large modern format shops, as well as smaller retail units. The centre offers a pleasant
environment in which to shop and provides the highest quality retail offer in the city.
5.22 The centre is predominantly comparison retail dominated. Many of the retailers are mid-
high end retailers such as All Saints, John Lewis, Gap, Apple, Hollister, Karen Millen, French
Connection, Swarovski and Coast. Restaurants and cafes are also high street chains
including Nandos, Pizza Hut, McDonalds and Café Giardino.
5.23 West Quay shopping centre is largely dominated by multiple retailers. There are over 90
retail units in the shopping centre, and only a small number of these retailers are
independents. Whilst the dominance of multiples in West Quay does provide a strong high
street retail offer, the centre lacks the complementary offer that distinctive independent
retailers can provide. The high proportion of multiples does mean that the centre lacks a
truly distinctive character and as a result is very similar to other large shopping centres
across the country.

Southampton City Council and Eastleigh Borough Council Retail Study
July 2011 I gva.co.uk 43
Northern Area
5.24 Above Bar Street runs north to south, between West Quay Shopping Centre and the
Marlands Shopping Centre. At the southern end the West Quay Shopping Centre opens
on to a pedestrianised section of Above Bar Street. The street has the character of a
traditional high street, with retail units extending on each side of the road. The
pedestrianised section extends the offer of high street comparison retailers found in West
Quay, although retailers are generally mid-low range. Retailers include Bhs, TK Maxx,
Peacocks, Primark, Boots and JD Sports. The quality of the environment is reasonably
good and benefits from the wide pedestrianised area containing good provision of
seating and trees. The street is also the location of the German Christmas Market. Retail
units are well maintained and have a consistent appearance, with the majority of shop
fascias and signage at the same level.
5.25 The northern section of Above Bar Street offers a wider variety of retail and service
operators, including some independent retailers. Shops and services in this location
include banks, opticians, travel agents, opticians and hair and beauty salons. Unit types
vary more in style and lack the consistency found in the pedestrianised section. Although
traffic has access to this street, this does not appear to restrict pedestrian movement.
Cycle parking and bus stops are prevalent along the length of the street. However, the
quality of the buildings and the shopping environment generally deteriorates at the
northern end of Above Bar Street.
5.26 The Marlands Shopping Centre, also referred to as The Mall, is the second largest shopping
centre in Southampton. Situated at the northern end of Above Bar Street, the shopping
centre opened in 1991. Anchored by Matalan, there are c.60 retail units in the centre,
including The Disney Store, Krisp, Shoe Zone, Poundland, West One and Hawkins Bazaar
and service retailers including Starbucks and Costa Coffee. The Marlands has a different
offer to the central area, with a higher number of lower end/discount operators and
several independent retailers, offering goods such as jewellery, books, gifts, clothing and
computer games which complement provision elsewhere in the city. There are several
vacant units within the centre, the majority of which are located on the first floor which
appears to experience lower levels of footfall. Overall however the Marlands provides a
good shopping environment and is generally well maintained.
5.27 An Asda supermarket is located to the west of The Marlands Shopping Centre, across
Portland Terrace. The supermarket opened in 1989 and has a net sales area of 3,630 sqm.

Southampton City Council and Eastleigh Borough Council Retail Study
July 2011 I gva.co.uk 44
There are six small retail units by the check out area, including a phone shop, sewing shop,
Fuji Film Express, a tanning shop, a barbers an a Chinese medicine shop. In store, there is
an extensive range of non-food goods on offer, including the clothing range George,
which contributes to approximately 20% of the total floorspace. Other in store services
include a pharmacy, cafe and bakery. There are 25 checkouts, of which 8 are self
service. The 1980s building appears dated, especially internally, and the format of the
store does require modernisation.
Western Area
5.28 There are two main retail parks in the western area, Mountbatten Retail Park and West
Quay Retail Park, as well as stand-alone stores.
5.29 Mountbatten Retail Park is situated in the north west of the city centre (outside the primary
shopping area), close to Southampton Central railway station. The retail park opened in
1995 and has a total floorspace of approximately 4,540 sqm gross and around 200 pay
and display parking spaces. There are six retail units which are currently occupied by
Allied Carpets, Carpetright, Dreams, PC World, Majestic Wine and Home Living. To the
west of Mountbatten Retail Park are several hotels (Novotel, Ibis and Etap), and
restaurants (McDonalds and TGI Fridays). Directly to the east of Mountbatten Retail Park is
a large Toys ‘R Us and Babies ‘R Us store, with a floorspace of approximately 3,940 sqm
gross and car park of 300 spaces. The store is also close to the train station, and a direct
route from the station to the city centre, cuts along the side of the retail unit.
5.30 West Quay Retail Park is situated to the south of Mountbatten Retail Park and opened a
year later, in 1996. The retail park, which is situated within the primary shopping area,
forms a V shape and currently has 13 units, which include a mix of retailers. Retailers
include Staples, Halfords, Boots, Brantano, Tesco Homeplus, Mothercare World/Early
Learning Centre/Clarks Shoes, Furniture Village, JD Sports, First Choice, Next Home, Argos,
ScS and JJB Sports. The Retail Park comprises a total floorspace of 17,016 sqm gross and is
served by 700 pay and display car parking spaces. West Quay Retail Park faces the West
Quay Shopping Centre, which is accessible along Harbour Parade via lifts operating from
multi-storey car parks. An Ikea store opened in February 2009 to the rear of the West Quay
Retail Park. The store has an approximate floorspace of 31,300 sqm gross and is also
served by a multi-storey car park with 900 parking spaces.
Southampton City Council and Eastleigh Borough Council Retail Study
July 2011 I gva.co.uk 45
South/East Area
5.31 The southern area provides more secondary areas of retail. The High Street is separated
from Above Bar Street by the historic Bargate, the remains of the main entry into the Old
Town. Multiple retailers include Superdrug, Tesco, Argos, Natwest and Lidl. The remaining
units on the High Street are mainly comprised of independent retailers, cafes, restaurants,
pubs and offices. There are a high number of vacancies dispersed along the High Street.
Improvements to the streetscape, including new paving and seating enhance the overall
appearance of the street, however, the high level of vacancies and low footfall in this
part of the city detracts from this.
5.32 Bargate Shopping Centre evidently has problems with vacancies. Situated just off
Bargate, the shopping centre is split across two levels. Our site visit identified that only a
few units in the centre appeared to be occupied and trading. One being the Sega Park
amusement arcade as well as a few independent clothing stores on the lower ground
floor. The shopping centre is somewhat dated, and the lack of investment and trading
units in the centre results in an unappealing shopping environment.
5.33 Along East Street are a number of smaller retail units which provide a good range of
multiple retailers (Game, Subway, Co-op, Holland and Barrett, Sony, Millets and
Specsavers) as well as independent retailers (opticians, beauty salons, cafes, jewellery
shops, takeaways and household furnishings). Shops on East Street appeared to be
trading well at the time of the site visit, with reasonable levels of footfall. The street has
narrow pavements in comparison to the rest of the city centre and the street has parking
on both sides of the road, restricting movement between different sides of the street.
5.34 Debenhams department store is located at the eastern end of East Street in Queens
Buildings. Although of dated appearance and a reasonable distance from the main
shopping areas of West Quay and Above Bar Street, the Debenhams store does provide
the usual concessions and appeared to be trading well. East Street Shopping Centre is
located adjacent to the Debenhams building and contains small retail units, almost all of
which are vacant. East Street Shopping Centre has a poor quality environment and does
not currently contribute to the retail offer of the city.
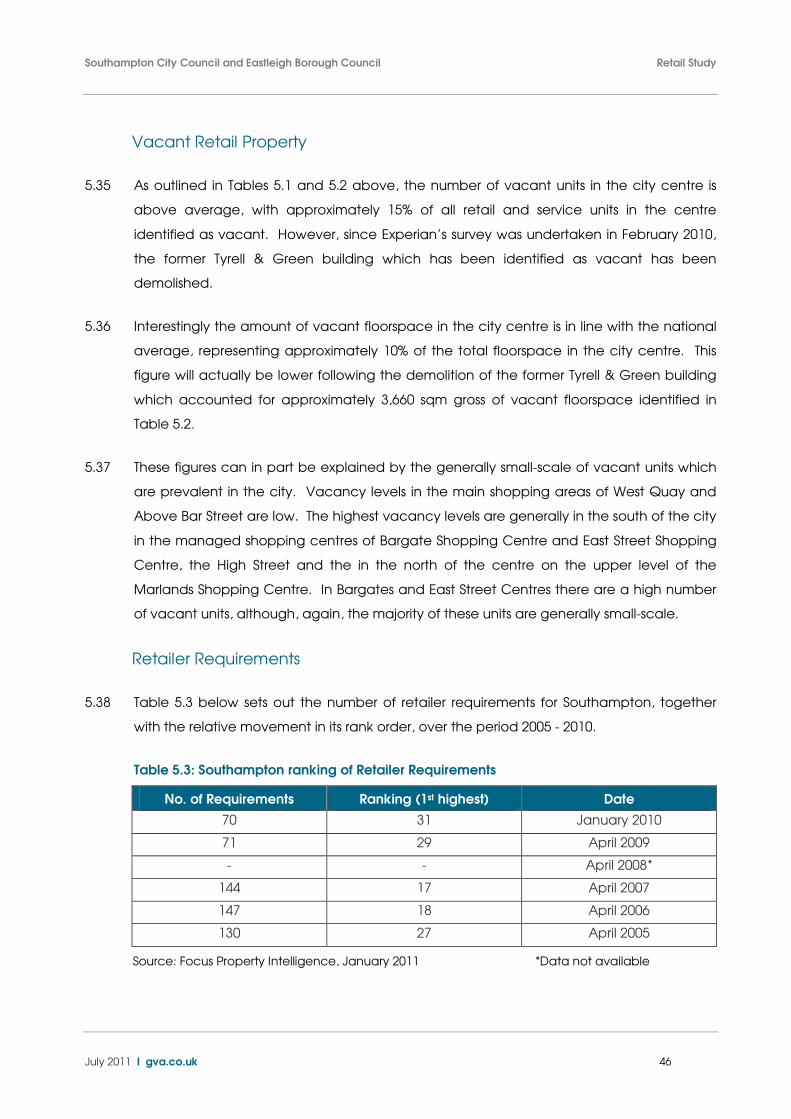
Southampton City Council and Eastleigh Borough Council Retail Study
July 2011 I gva.co.uk 46
Vacant Retail Property
5.35 As outlined in Tables 5.1 and 5.2 above, the number of vacant units in the city centre is
above average, with approximately 15% of all retail and service units in the centre
identified as vacant. However, since Experian’s survey was undertaken in February 2010,
the former Tyrell & Green building which has been identified as vacant has been
demolished.
5.36 Interestingly the amount of vacant floorspace in the city centre is in line with the national
average, representing approximately 10% of the total floorspace in the city centre. This
figure will actually be lower following the demolition of the former Tyrell & Green building
which accounted for approximately 3,660 sqm gross of vacant floorspace identified in
Table 5.2.
5.37 These figures can in part be explained by the generally small-scale of vacant units which
are prevalent in the city. Vacancy levels in the main shopping areas of West Quay and
Above Bar Street are low. The highest vacancy levels are generally in the south of the city
in the managed shopping centres of Bargate Shopping Centre and East Street Shopping
Centre, the High Street and the in the north of the centre on the upper level of the
Marlands Shopping Centre. In Bargates and East Street Centres there are a high number
of vacant units, although, again, the majority of these units are generally small-scale.
Retailer Requirements
5.38 Table 5.3 below sets out the number of retailer requirements for Southampton, together
with the relative movement in its rank order, over the period 2005 - 2010.
Table 5.3: Southampton ranking of Retailer Requirements
No. of Requirements Ranking (1st highest) Date
70 31 January 2010
71 29 April 2009
- - April 2008*
144 17 April 2007
147 18 April 2006
130 27 April 2005
Source: Focus Property Intelligence, January 2011 *Data not available
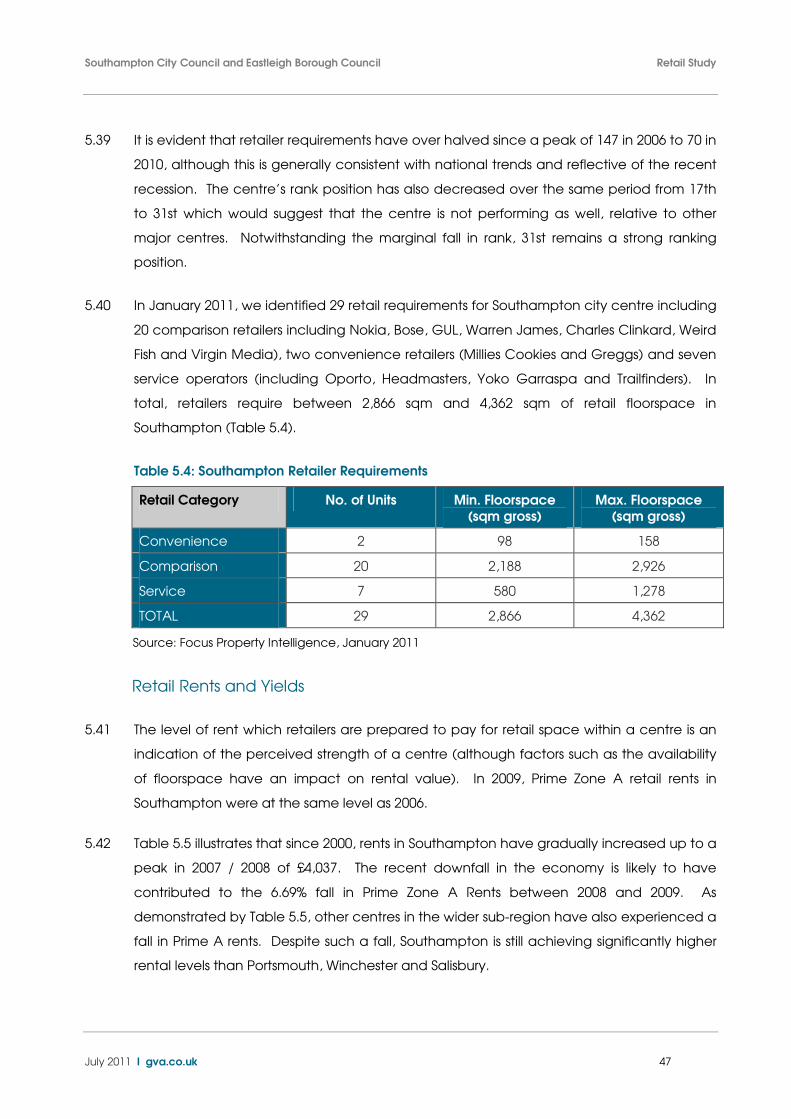
Southampton City Council and Eastleigh Borough Council Retail Study
July 2011 I gva.co.uk 47
5.39 It is evident that retailer requirements have over halved since a peak of 147 in 2006 to 70 in
2010, although this is generally consistent with national trends and reflective of the recent
recession. The centre’s rank position has also decreased over the same period from 17th
to 31st which would suggest that the centre is not performing as well, relative to other
major centres. Notwithstanding the marginal fall in rank, 31st remains a strong ranking
position.
5.40 In January 2011, we identified 29 retail requirements for Southampton city centre including
20 comparison retailers including Nokia, Bose, GUL, Warren James, Charles Clinkard, Weird
Fish and Virgin Media), two convenience retailers (Millies Cookies and Greggs) and seven
service operators (including Oporto, Headmasters, Yoko Garraspa and Trailfinders). In
total, retailers require between 2,866 sqm and 4,362 sqm of retail floorspace in
Southampton (Table 5.4).
Table 5.4: Southampton Retailer Requirements
Retail Category No. of Units Min. Floorspace
(sqm gross)
Max. Floorspace
(sqm gross)
Convenience 2 98 158
Comparison 20 2,188 2,926
Service 7 580 1,278
TOTAL 29 2,866 4,362
Source: Focus Property Intelligence, January 2011
Retail Rents and Yields
5.41 The level of rent which retailers are prepared to pay for retail space within a centre is an
indication of the perceived strength of a centre (although factors such as the availability
of floorspace have an impact on rental value). In 2009, Prime Zone A retail rents in
Southampton were at the same level as 2006.
5.42 Table 5.5 illustrates that since 2000, rents in Southampton have gradually increased up to a
peak in 2007 / 2008 of £4,037. The recent downfall in the economy is likely to have
contributed to the 6.69% fall in Prime Zone A Rents between 2008 and 2009. As
demonstrated by Table 5.5, other centres in the wider sub-region have also experienced a
fall in Prime A rents. Despite such a fall, Southampton is still achieving significantly higher
rental levels than Portsmouth, Winchester and Salisbury.
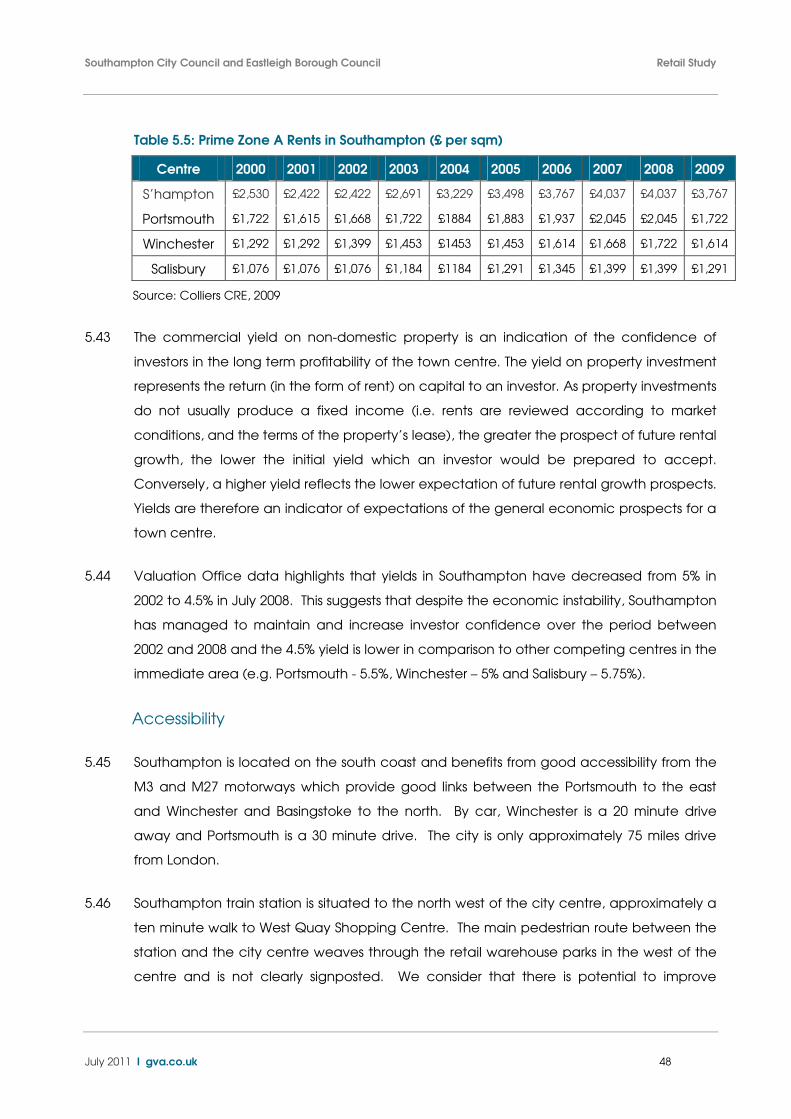
Southampton City Council and Eastleigh Borough Council Retail Study
July 2011 I gva.co.uk 48
Table 5.5: Prime Zone A Rents in Southampton (£ per sqm)
Centre 2000 2001 2002 2003 2004 2005 2006 2007 2008 2009
S’hampton £2,530 £2,422 £2,422 £2,691 £3,229 £3,498 £3,767 £4,037 £4,037 £3,767
Portsmouth £1,722 £1,615 £1,668 £1,722 £1884 £1,883 £1,937 £2,045 £2,045 £1,722
Winchester £1,292 £1,292 £1,399 £1,453 £1453 £1,453 £1,614 £1,668 £1,722 £1,614
Salisbury £1,076 £1,076 £1,076 £1,184 £1184 £1,291 £1,345 £1,399 £1,399 £1,291
Source: Colliers CRE, 2009
5.43 The commercial yield on non-domestic property is an indication of the confidence of
investors in the long term profitability of the town centre. The yield on property investment
represents the return (in the form of rent) on capital to an investor. As property investments
do not usually produce a fixed income (i.e. rents are reviewed according to market
conditions, and the terms of the property’s lease), the greater the prospect of future rental
growth, the lower the initial yield which an investor would be prepared to accept.
Conversely, a higher yield reflects the lower expectation of future rental growth prospects.
Yields are therefore an indicator of expectations of the general economic prospects for a
town centre.
5.44 Valuation Office data highlights that yields in Southampton have decreased from 5% in
2002 to 4.5% in July 2008. This suggests that despite the economic instability, Southampton
has managed to maintain and increase investor confidence over the period between
2002 and 2008 and the 4.5% yield is lower in comparison to other competing centres in the
immediate area (e.g. Portsmouth - 5.5%, Winchester – 5% and Salisbury – 5.75%).
Accessibility
5.45 Southampton is located on the south coast and benefits from good accessibility from the
M3 and M27 motorways which provide good links between the Portsmouth to the east
and Winchester and Basingstoke to the north. By car, Winchester is a 20 minute drive
away and Portsmouth is a 30 minute drive. The city is only approximately 75 miles drive
from London.
5.46 Southampton train station is situated to the north west of the city centre, approximately a
ten minute walk to West Quay Shopping Centre. The main pedestrian route between the
station and the city centre weaves through the retail warehouse parks in the west of the
centre and is not clearly signposted. We consider that there is potential to improve
Southampton City Council and Eastleigh Borough Council Retail Study
July 2011 I gva.co.uk 49
signage to and from the train station. From Southampton Central train station there are
regular trains to Portsmouth, London (Waterloo and Victoria), Cardiff, Manchester,
Weymouth and Poole.
5.47 Bus services connect the city centre to other centres in Southampton including Shirley,
Portswood, Woolston and Bitterne. Nightbus Services operate between the city centre
and the district and local centres including Chandlers Ford, Eastleigh, Botley, Hedge End,
Totton, Bitterne and Lord’s Hill.
5.48 Southampton International Airport is located in the north of the city and is easily
accessible by train, with its own station at Southampton Parkway. Flights are available
from the airport to UK and European destinations.
Environmental Quality
5.49 As outlined above the quality of environment varies across the city centre. West Quay
Shopping Centre provides a very high quality, modern shopping environment which is
attractive and well maintained. Remains of historic city walls are scattered throughout the
centre and add character to the overall environment. The traditional shopping streets of
Above Bar Street and High Street provides more traditional style buildings, which generally
sit well together.
5.50 The retail warehouse units in the west of the centre are modern and well maintained. In
the peripheral areas of the centre (north Above Bar Street, south High Street and East
Street) there is considerable scope to improve the quality of shop fronts. Bargate and East
Street shopping centres are two areas of obvious concern. Both centres have high
vacancy rates and are poorly maintained and neglected.
5.51 There is evidence of investment in the streetscape, particularly along the pedestrianised
parts of Above Bar Street and High Street. These improvements are part of a major
Council investment in the city centre public realm know as the ‘QE2 mile’. Pavements are
wide and generally well-maintained throughout, although there are areas where
improvements could be made (for example East Street). The city centre does not seem to
have any particular problem in terms of litter of graffiti.
Southampton City Council and Eastleigh Borough Council Retail Study
July 2011 I gva.co.uk 50
Customer Views and Behaviour
5.52 The household telephone survey undertaken in January 2011 provides an in-sight into
customer views of the city centre. The key findings of the surveys are outlined below:
• 24% of telephone survey respondents most often visit Southampton city centre for day
out shopping, compared to 14% that most often visit Portsmouth. The centre’s
attraction as a ‘day out’ destination is also reinforced by the frequency in which they
decide to visit. The survey indicates that just 2% respondents visit everyday, whilst 10%
visit once a fortnight; 19% once a month and 19% once every 3 months.
• Telephone survey respondents gave positive feedback in relation to the city centre’s
good range of chain stores and independent stores, the compact layout and the
indoor shopping malls.
• The telephone survey identifies key dislikes of Southampton relate to difficulties parking
and traffic congestion, poor lighting, the centre being too busy, a lack of character
and the quality of the city centre environment.
• Respondents to the telephone survey suggested they would be more likely to shop or
visit Southampton more often if there was cheaper or easier parking, improved layout
of the centre and making it easier to get around on foot and more independent
shops.
Development Opportunities and Commitments
5.53 The Southampton City Centre Action Plan Issues and Options draft (2007) outlines a
number of potential development opportunity sites in the city centre. Key sites which offer
the potential for the development of main town centre uses (retail, cultural and leisure)
include existing retail areas and a significant expansion area to the west of the city centre,
the Major Development Quarter.
5.54 Development sites 1 and 2 relate to the Bargate, Debenhams and East Street Shopping
Area. The options for the redevelopment of the site include the redevelopment of the
Bargate shopping centre to restore the historic city walls and create a niche upper market
retail offer. There are redevelopment opportunities to accommodate an anchor store
and links to St Mary’s which is currently blocked by the East Street Shopping Centre. As
the retail focus of the city centre shifts westwards, there is the opportunity for the East
Street shopping centre to be redeveloped for mixed use, possibly including a foodstore.
Southampton City Council and Eastleigh Borough Council Retail Study
July 2011 I gva.co.uk 51
5.55 In the north of the city centre, development sites 3, 4 and 5 are located at the Marlands
and Above Bar Street. The CCAP issues and options, also identifies opportunities to link to
the Major Development Quarter and create a key entrance point to the north of the
Marlands shopping centre. High rise development may be suited to this location.
5.56 The Major Development Quarter extends from Southampton Central rail station in the
north to Southern Road and Solent Road in the west and Herbert Walker Avenue in the
south. The main vision for the quarter is to redevelop the currently low density buildings
and promote more intensive, higher quality, buildings, streets and spaces. If needed
further retail space should be located close to the existing primary shopping area, subject
to the sequential approach in accordance with PPS4. Leisure and offices uses will be
located further outwards, with the potential to include some residential development. The
quarter will be developed in phases, with consideration for the overall area.
5.57 More specifically, sites 6-11 are designated as West Quay 3 or Watermark West Quay. The
sites are allocated in the Local Plan Review for a mix of uses including retail, food and
drink, offices, residential and leisure (including a multi-purpose sports / leisure facility, ice
rink and potentially a casino). Several sites within this area are at an advanced stage of
planning (see paragraph 5.60 below). Links to Bargate can be improved between this
new mixed use area through the redevelopment of blocks 10 and 11.
5.58 At West Quay Retail Park and surrounding sites, 12, 13, 15 and 16 could also form part of
an extension to the primary shopping area. This includes the potential redevelopment of
the Asda site. The Ikea also discussed in the CCAP issues and options, has already been
developed and opened in 2009.
5.59 Site 17 is located to the west of West Quay Road and is currently occupied by the City
Industrial Park and Leisure World complex. The options document identifies the site as
potential for the development of an office quarter.
5.60 Existing development commitments in Southampton city centre are outlined below:
• At Northern Above Bar there is an application pending for the redevelopment of the
Former Tyrell and Green Building for the development of a Cultural Quarter with new
arts facilities alongside residential units.
• At Watermark West Quay, outline planning permission was obtained in February 2010
for the mixed use development of the site between Harbour Parade and Portland
Southampton City Council and Eastleigh Borough Council Retail Study
July 2011 I gva.co.uk 52
Terrace, to the south of West Quay Shopping Centre. This application has also been
known as West Quay 3. The redevelopment site is 3.94 hectares and includes
extensions to the West Quay Shopping Centre of a maximum of 34,700 sqm (Classes
A1, A2 and A3), hotel, residential and cinema. The site has been divided into six
development zones, each with distinct uses. These include the cinema; the residential
tower; the retail block; the retail extension; the Plaza and; the Park. We understand
that construction has started on an adjacent hotel development, but work has yet to
commence on Watermark West Quay.
Summary
• Our analysis of Southampton indicates that, at present, the centre is performing well in
relation to a number of the PPS4 town centre health check indicators although there is
clearly scope for the centre to further enhance overall provision and to maintain its
competitiveness in the sub-region.
• Southampton city centre is dominated by multiple retailers and could enhance its
current offer by attracting high quality independent retailers. The centre has a very
strong comparison retail offer, but the convenience and service offer could be
enhanced to complement this.
• Southampton also has a reasonably high level of vacant units, although those are
generally small in scale and constrained and tend to be clustered in problem areas
such as Bargates and East Street shopping centres. These areas are however,
recognised for their development potential by the CCAP Issues and Options paper
(2007).
• Despite the recent economic difficulties, prime rents and yields in Southampton have
remained strong. Retail requirements in the centre have decreased, although this
may be partly attributed to the effects of the recession which has affected retailing in
centres across the country and is therefore not solely an issue isolated to
Southampton.
• Over the LDF period Southampton has significant opportunity to further enhance and
broaden its retail offer, particularly with opportunities to expand the primary shopping
area into the Major Development Quarter. This will have to be carefully managed to
ensure that existing problems areas, e.g. Bargates and East Street shopping centres
are also carefully managed in response to any shift in activity.
Southampton City Council and Eastleigh Borough Council Retail Study
July 2011 I gva.co.uk 53
6. Eastleigh Town Centre Health Check
6.1 In this section we present up-to-date qualitative health check analysis of Eastleigh town
centre. As with Southampton, our health check assessment has been carried out in line
with the Town Centre Health Check Indicators set out in PPS4 which measure the vitality
and viability of the centre. Our findings are set out below.
Diversity of Uses
6.2 Eastleigh town centre is relatively compact with the main retail provision located on
Market Street, Leigh Road, High Street and the Swan Centre, a managed shopping centre
to the south of the town.
6.3 The Experian Goad survey of Eastleigh town centre (March 2010) identifies a total of 55,742
sqm of ground floorspace for retail trade and services, across 220 units. This information is
drawn from the most recent ‘category report’ produced by Experian Goad which
provides a detailed breakdown of uses within the following categories: convenience,
comparison, service (including retail services, leisure services and financial and business
services) and vacant.
6.4 Table 6.1 below highlights the composition of Eastleigh town centre’s retail and service
offer by the number of units, compared to the average of all UK centres.
6.1 Eastleigh Town Centre Retail Composition by Number of Units
Retail Category No. of Units % of Total UK Average (%) Variance
Convenience 15 6.82 8.75 -1.93
Comparison 80 36.36 33.60 2.76
Service 96 43.64 46.00 -2.37
Vacant 29 13.18 11.64 1.54
TOTAL 220 100 100 -
Source: Experian Goad Category Report, March 2010
6.5 It is apparent that Eastleigh has a reasonably good mix of retail uses which, in unit terms,
are more or less in line with the national average. The overall number of convenience
retail units is marginally below average, however this masks the fact that two of these units
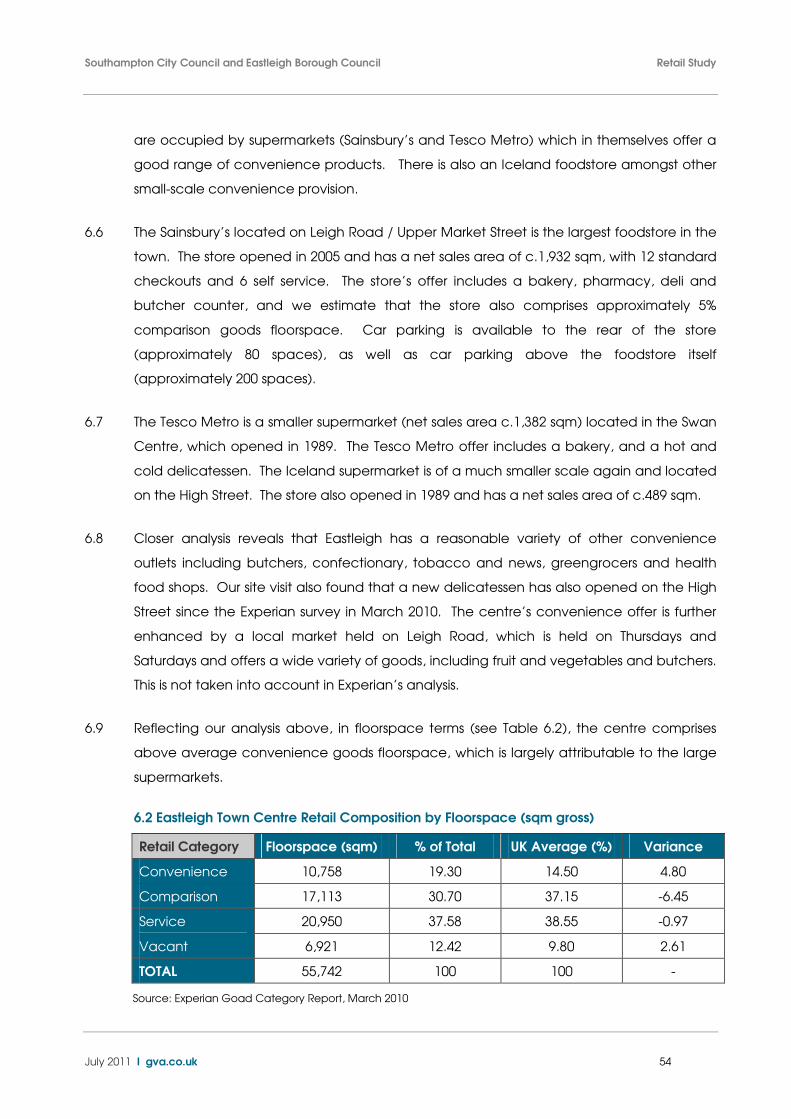
Southampton City Council and Eastleigh Borough Council Retail Study
July 2011 I gva.co.uk 54
are occupied by supermarkets (Sainsbury’s and Tesco Metro) which in themselves offer a
good range of convenience products. There is also an Iceland foodstore amongst other
small-scale convenience provision.
6.6 The Sainsbury’s located on Leigh Road / Upper Market Street is the largest foodstore in the
town. The store opened in 2005 and has a net sales area of c.1,932 sqm, with 12 standard
checkouts and 6 self service. The store’s offer includes a bakery, pharmacy, deli and
butcher counter, and we estimate that the store also comprises approximately 5%
comparison goods floorspace. Car parking is available to the rear of the store
(approximately 80 spaces), as well as car parking above the foodstore itself
(approximately 200 spaces).
6.7 The Tesco Metro is a smaller supermarket (net sales area c.1,382 sqm) located in the Swan
Centre, which opened in 1989. The Tesco Metro offer includes a bakery, and a hot and
cold delicatessen. The Iceland supermarket is of a much smaller scale again and located
on the High Street. The store also opened in 1989 and has a net sales area of c.489 sqm.
6.8 Closer analysis reveals that Eastleigh has a reasonable variety of other convenience
outlets including butchers, confectionary, tobacco and news, greengrocers and health
food shops. Our site visit also found that a new delicatessen has also opened on the High
Street since the Experian survey in March 2010. The centre’s convenience offer is further
enhanced by a local market held on Leigh Road, which is held on Thursdays and
Saturdays and offers a wide variety of goods, including fruit and vegetables and butchers.
This is not taken into account in Experian’s analysis.
6.9 Reflecting our analysis above, in floorspace terms (see Table 6.2), the centre comprises
above average convenience goods floorspace, which is largely attributable to the large
supermarkets.
6.2 Eastleigh Town Centre Retail Composition by Floorspace (sqm gross)
Retail Category Floorspace (sqm) % of Total UK Average (%) Variance
Convenience 10,758 19.30 14.50 4.80
Comparison 17,113 30.70 37.15 -6.45
Service 20,950 37.58 38.55 -0.97
Vacant 6,921 12.42 9.80 2.61
TOTAL 55,742 100 100 -
Source: Experian Goad Category Report, March 2010
Southampton City Council and Eastleigh Borough Council Retail Study
July 2011 I gva.co.uk 55
6.10 Overall in terms of unit count, comparison retail provision in Eastleigh is above average
(+2.76%), however in terms of floorspace the level of comparison retail provision is below
average (-6.45%) reflecting the predominantly small scale of individual units. Areas within
Eastleigh with a strong comparison goods offer are the Swan Centre and Market Street.
6.11 The centre has a reasonable variety of comparison retailers on offer. There is particularly
good representation from retailers selling electrical goods, hardware and household
goods, stationers and telephones and accessories. There is a noticeable concentration of
charity shops in the town, the majority of which are located in the High Street.
6.12 There are several women’s clothing retailers, however the number of men’s clothing
retailers is below average. There is no representation from comparison retailers
specialising in the sale of antiques, music, DIY, cycles and accessories, carpets and
vehicle sales, although this is generally consistent with the current scale and function of
the centre.
6.13 Service uses in Eastleigh represent the majority of retail and service units (96 units),
although this is still below average (-2.37%). The majority of service units are located on
the High Street which offers a number of restaurants, takeaways and hairdressers.
Financial and business services have a good representation in Eastleigh, with above
average representation of financial services, property services (estate agents) and retail
banks. There is good provision of retail services such as travel agents and opticians but
limited provision of health and beauty salons and dry cleaners.
6.14 In terms of leisure services, Eastleigh benefits from a new leisure development on the east
of the Swan Centre. The development opened in 2009, and offers a wide range of leisure
facilities including a 20 lane AMF Bowling Alley and a nine screen Vue Cinema, alongside
a variety of restaurants. There are several multiple restaurant operators trading from the
leisure development including Nandos, Frankie and Bennys, Prezzo and Coffee Republic.
The quality of the leisure development is high and is likely to serve as a key attractor to the
town centre, providing a pleasant environment during the day and evening.
6.15 Overall, Eastleigh offers reasonable provision of leisure facilities, including The Point
theatre/arts centre, particularly for a town of its size. There is below average
representation of fast food takeaways, although this is considered a positive indicator as a
high presence of such uses can be detrimental to a centre’s vitality. Overall retail
Southampton City Council and Eastleigh Borough Council Retail Study
July 2011 I gva.co.uk 56
provision could be better enhanced and there is potential for additional restaurant and
café facilities to occupy the remaining vacant units in the new leisure development.
Retailer Representation
6.16 The presence of multiple retailers in a centre can enhance the appeal of that centre
although a strong independent sector is also important to add to the overall diversity of
the retail offer. In March 2010, Experian identified 125 multiple retailers and 66
independent retailers in Eastleigh town centre. Multiple retailers represent 57% of all units
whilst independents represent 30% of all units; and the remaining 13% are vacant.
6.17 Multiple comparison retailers account for the highest proportion of multiple retailers in the
town centre with 70% of all comparison units occupied by multiple retailers. Key multiple
retailers in the town include TK Maxx, Peacocks, Savers, Argos, Burton, QS, Poundland,
Superdrug, New Look, Dorothy Perkins and Robert Dyas. The main convenience provision
is through chain supermarkets, Sainsbury’s, Tesco and Iceland. Independent retailers have
the strongest representation in service units (39% of total units). In particular there are a
high number of independent restaurants and hairdressers.
Vacant Retail Property
6.18 As outlined in tables 5.6 and 5.7 above, the number of vacant units in Eastleigh is 1.54%
above the national average, with approximately 13% of all retail and service units in the
centre vacant. The amount of vacant floorspace in the centre is also above average,
representing approximately 12% of total floorspace in the town.
6.19 There appears to be no obvious clusters of vacant units or problem areas in the town
although there are slightly more vacant units distributed along High Street (six units in total)
than in any part of the centre. Our site visit found that three units in the new leisure
development identified as vacant by Goad in March 2010 are now occupied by new
operators including Prezzo, Coffee Republic and the Loft bar. This suggests that the new,
modern accommodation in Eastleigh has been successful in attracting some new
operators to the centre. There are however still some vacant units in the complex which
are yet to be taken up.
6.20 Closer analysis of the existing stock of vacant units indicates that the majority (50%) are
relatively small in scale (<100 sqm gross). Approximately 30% of vacant units range
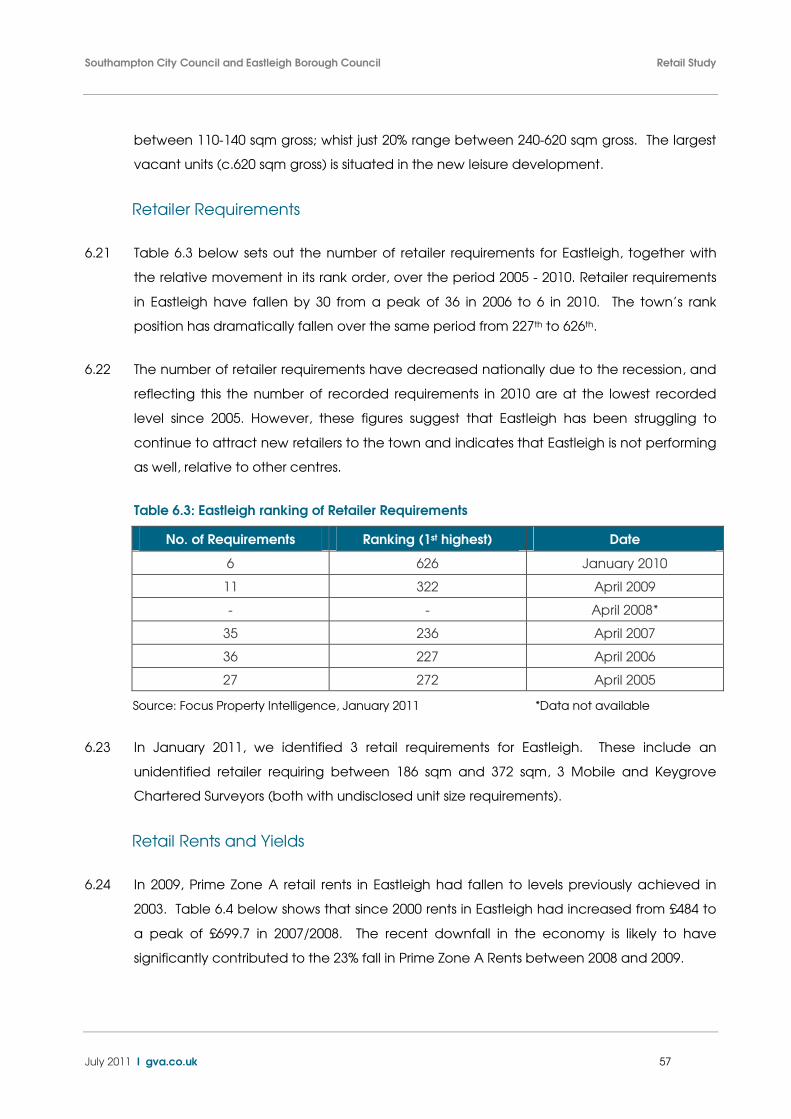
Southampton City Council and Eastleigh Borough Council Retail Study
July 2011 I gva.co.uk 57
between 110-140 sqm gross; whist just 20% range between 240-620 sqm gross. The largest
vacant units (c.620 sqm gross) is situated in the new leisure development.
Retailer Requirements
6.21 Table 6.3 below sets out the number of retailer requirements for Eastleigh, together with
the relative movement in its rank order, over the period 2005 - 2010. Retailer requirements
in Eastleigh have fallen by 30 from a peak of 36 in 2006 to 6 in 2010. The town’s rank
position has dramatically fallen over the same period from 227th to 626th.
6.22 The number of retailer requirements have decreased nationally due to the recession, and
reflecting this the number of recorded requirements in 2010 are at the lowest recorded
level since 2005. However, these figures suggest that Eastleigh has been struggling to
continue to attract new retailers to the town and indicates that Eastleigh is not performing
as well, relative to other centres.
Table 6.3: Eastleigh ranking of Retailer Requirements
No. of Requirements Ranking (1st highest) Date
6 626 January 2010
11 322 April 2009
- - April 2008*
35 236 April 2007
36 227 April 2006
27 272 April 2005
Source: Focus Property Intelligence, January 2011 *Data not available
6.23 In January 2011, we identified 3 retail requirements for Eastleigh. These include an
unidentified retailer requiring between 186 sqm and 372 sqm, 3 Mobile and Keygrove
Chartered Surveyors (both with undisclosed unit size requirements).
Retail Rents and Yields
6.24 In 2009, Prime Zone A retail rents in Eastleigh had fallen to levels previously achieved in
2003. Table 6.4 below shows that since 2000 rents in Eastleigh had increased from £484 to
a peak of £699.7 in 2007/2008. The recent downfall in the economy is likely to have
significantly contributed to the 23% fall in Prime Zone A Rents between 2008 and 2009.
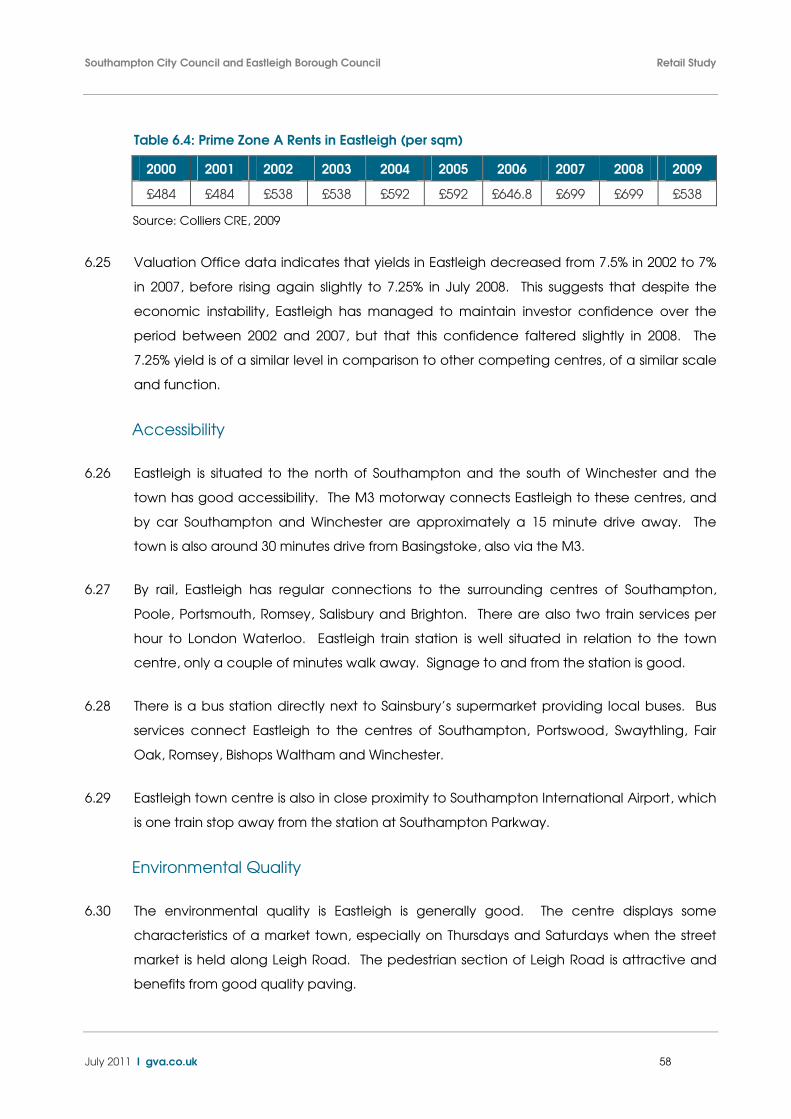
Southampton City Council and Eastleigh Borough Council Retail Study
July 2011 I gva.co.uk 58
Table 6.4: Prime Zone A Rents in Eastleigh (per sqm)
2000 2001 2002 2003 2004 2005 2006 2007 2008 2009
£484 £484 £538 £538 £592 £592 £646.8 £699 £699 £538
Source: Colliers CRE, 2009
6.25 Valuation Office data indicates that yields in Eastleigh decreased from 7.5% in 2002 to 7%
in 2007, before rising again slightly to 7.25% in July 2008. This suggests that despite the
economic instability, Eastleigh has managed to maintain investor confidence over the
period between 2002 and 2007, but that this confidence faltered slightly in 2008. The
7.25% yield is of a similar level in comparison to other competing centres, of a similar scale
and function.
Accessibility
6.26 Eastleigh is situated to the north of Southampton and the south of Winchester and the
town has good accessibility. The M3 motorway connects Eastleigh to these centres, and
by car Southampton and Winchester are approximately a 15 minute drive away. The
town is also around 30 minutes drive from Basingstoke, also via the M3.
6.27 By rail, Eastleigh has regular connections to the surrounding centres of Southampton,
Poole, Portsmouth, Romsey, Salisbury and Brighton. There are also two train services per
hour to London Waterloo. Eastleigh train station is well situated in relation to the town
centre, only a couple of minutes walk away. Signage to and from the station is good.
6.28 There is a bus station directly next to Sainsbury’s supermarket providing local buses. Bus
services connect Eastleigh to the centres of Southampton, Portswood, Swaythling, Fair
Oak, Romsey, Bishops Waltham and Winchester.
6.29 Eastleigh town centre is also in close proximity to Southampton International Airport, which
is one train stop away from the station at Southampton Parkway.
Environmental Quality
6.30 The environmental quality is Eastleigh is generally good. The centre displays some
characteristics of a market town, especially on Thursdays and Saturdays when the street
market is held along Leigh Road. The pedestrian section of Leigh Road is attractive and
benefits from good quality paving.
Southampton City Council and Eastleigh Borough Council Retail Study
July 2011 I gva.co.uk 59
6.31 The traditional shopping streets of Market Street and High Street are generally well
maintained and the wide pavements create a pleasant shopping environment. Glass
roof shelters extend from some buildings to cover sections of the pavement and provide
cover from inclement weather. Shopfronts on these streets are of varying quality.
6.32 The Swan Centre offers the highest quality shopping environment in the town which is
clearly well maintained. The more recent leisure development in the east of the Swan
Centre further enhances the quality of the street scene here, with a distinctive external
curving staircase providing access to the restaurants, bowling alley and cinema. There do
not appear to be any obvious problems with litter or graffiti in any part of the centre.
Customer Views and Behaviour
6.33 The household telephone surveys undertaken in January 2011 provide an in-sight into
customer views of the town centre. The key findings of the surveys are outlined below:
• Telephone survey respondents gave positive feedback in relation to the town
centre’s good range of chain and independent stores, the compact layout,
good/free parking, the indoor shopping malls, attractive shopping environment, the
leisure facilities and the markets.
• The telephone survey identifies key dislikes of Eastleigh relate to the length and
inconvenience of the journey to the town centre, the lack of non-food stores,
difficulties parking, lack of independent shops and the poor quality of the
environment.
• Respondents to the telephone survey suggested they would be more likely to shop or
visit Eastleigh more often if there were more non-food stores and more department
stores, cheaper and easier parking, more independent and unusual shops and more
higher end stores.
Development Opportunities and Commitments
6.34 We are not aware of any major retail development commitments in Eastleigh which have
planning permission. However, there is an identified potential opportunity site for
additional retail provision on the Barton Park site, previously highlighted in Section 2.
6.35 Barton Park is a large industrial estate to the east of the train station and is divided into two
parts (east and west) by a Public Safety Zone for Southampton Airport, in which no new
Southampton City Council and Eastleigh Borough Council Retail Study
July 2011 I gva.co.uk 60
buildings are likely to be permitted. The western side of the site is primarily edge-of-centre
and this area has been previously identified in the Retail Study Update (2008) as the
closest site to the town centre capable of accommodating additional retail development
(subject to the development of a high quality pedestrian link across the railway).
6.36 The potential for retail uses at the site has been previously assessed in the Eastleigh Retail
Study Update (2008). The Study considered the implications for Eastleigh town centre, of a
food/non-food superstore development alongside town centre format comparison shops
on the site. As highlighted in section 2, the findings indicate that there would only be
sufficient convenience goods expenditure to support a new foodstore if one of the
existing main food stores (Sainsbury’s or Tesco) were to relocate out of the town centre to
operate the new store. In terms of comparison retail, the 2008 study identified insufficient
capacity to support substantial town centre redevelopment (in place of the re-located
foodstore) and new comparison goods retail floorspace at Barton Park in the period up to
2016.
Summary
• Our analysis of Eastleigh indicates that, at present, the centre is performing reasonably
well in relation to a number of the PPS4 town centre health check indicators.
• Eastleigh has a reasonably good mix of convenience, comparison and services units
which is considered consistent for a centre of Eastleigh’s scale and function. There is
also a good mix of multiple and independent retailers which adds to overall diversity
of the town centre’s shopping offer.
• The centre has a particularly strong convenience shopping offer with two supermarket
anchors located either end of the main shopping streets. Other small-scale provision
and the twice-weekly local market complement the centre’s main foodstore offer.
• The centre’s overall vacancy rate is marginally above the national average, although
there are no obvious concentrations of vacant units which could pose a
development opportunity. Our analysis indicates that the majority of available units
are generally small in scale are unlikely to be suitable to accommodate modern
comparison retailer requirements. There are also some vacant units in the new leisure
development, which offer larger more modern accommodation. The fact that these
have yet to be occupied, would suggest that market demand for floorspace in
Southampton City Council and Eastleigh Borough Council Retail Study
July 2011 I gva.co.uk 61
Eastleigh is currently low. This is consistent with the few retailer requirements identified
for the centre.
• It is also apparent that Eastleigh has struggled to remain competitive during the
recession, and as a result the number of retailer requirements and level of prime rents
have decreased and yields have increased.
• There are aspirations to further enhance retail provision in the town centre and the
potential opportunity for retail development to the east of the town centre on the
Barton Park site has been previously explored. We consider the potential opportunities
for the town centre, taking into account our latest capacity forecasts, in more detail
later.
Southampton City Council and Eastleigh Borough Council Retail Study
July 2011 I gva.co.uk 62
7. Other Shopping Provision
7.1 As part of our assessment we have also broadly reviewed other shopping provision in both
Southampton and Eastleigh, specifically in relation to convenience goods. In terms of
comparison goods, we have also reviewed out-of-centre retail warehouse provision in the
Boroughs.
7.2 As highlighted in Section 2, and illustrated on Plan 2, there is a network of town and district
centres beneath Southampton city centre and Eastleigh town centre. In Southampton,
Shirley town centre is identified below the city centre, but above the four district centres of
Portswood, Bitterne, Woolston and Lordshill. In Eastleigh, there are two district centres: the
Fryern Centre, Chandler’s Ford and Hedge End.
7.3 These centres vary in terms of their size and range of retail offer, however they all benefit
from at least one foodstore which contributes towards serving the convenience shopping
needs of their respective catchment areas. It is not within the scope of this study to assess
the overall health of these centres or to assess comparison shopping provision within these
centres. Instead, we focus on the current convenience goods provision within these
centres which is summarised below and illustrated on Plan 4.
• Shirley Town Centre – anchored by a c.3,685 sqm net Sainsbury’s on Redcar Street.
Other convenience goods provision includes a Co-op, Tesco Express, Iceland and Lidl.
• Portswood District Centre – anchored by a c.1,633 sqm net Waitrose store. Other
provision includes a Co-op amongst other local, independent stores. There are also
proposals for a new Sainsbury’s to be developed as part of a retail-led mixed use
scheme on the bus depot site immediately to the north of the centre.
• Bitterne District Centre – located towards the south-east of Southampton, Bitterne is
anchored by Sainsbury’s although the retailer currently operates out of two large units
in the centre. The c.1,994 sqm net store on Bitterne Road, is predominantly dedicated
to the sale of convenience goods, whilst the store on West End Road sells
predominantly comparison goods.
• Woolston District Centre – Woolston is the smallest district centres in Southampton and
is currently served by two Co-op stores. The larger of the two Co-op stores is located
on the corner of Obelisk Road and comprises c.1,144 sqm net. The centre will soon
Southampton City Council and Eastleigh Borough Council Retail Study
July 2011 I gva.co.uk 63
benefit from a further new foodstore (c. 2,574 sqm net) being delivered as part of the
residential led mixed use development of the former Vosper site at the edge of the
centre, known as Centenary Quay.
• Lordshill District Centre – located towards the north of Southampton, Lordshill is
anchored by a large Sainsbury’s foodstore comprising c.4,187 sqm net. Aside from a
newsagent, there is no other convenience goods (and little other retail) provision in
the centre. Sainsbury’s have recently extended and refurbished their store. However
the wider environment of the centre is characterised by a ‘1970s style’ design
dominated by car parking / access roads, with poor pedestrian public realm, and
poor integration with surrounding communities. The Council have appointed David
Lock Associates to produce a master plan. They are currently investigating options,
with Sainsbury’s, to improve the centre. This will include options to expand the scale of
retailing in the centre as well as re-providing the community uses to support the District
Centre.
• Fryern Centre, Chandler’s Ford District Centre – Chandler’s Ford is anchored by a
c.2,135 sqm net Waitrose on Oakmount Road. There is also a c.769 sqm net Co-op
foodstore in the Fryern Centre precinct.
• Hedge End District Centre – the centre is anchored by a small Co-op foodstore
comprising c.641 sqm net and a Budgens store comprising c.718 sqm net.
Out-of-centre Foodstores
7.4 In addition to the above we have also identified five out-of-centre foodstores which are
also performing a key function in serving the convenience shopping needs of those living
within the survey area. These are as follows:
• Tesco, Tebourba Way (Southampton)
• Sainsbury’s, Toll Bar Way, Hedge End (Eastleigh)
• M&S Foodhall, Toll Bar Way, Hedge End (Eastleigh)
• Tesco Extra, Bursledon (Eastleigh)
• Asda, Bournemouth Road (Eastleigh)
7.5 The location of these stores is also illustrated on Plan 4.
Southampton City Council and Eastleigh Borough Council Retail Study
July 2011 I gva.co.uk 64
Retail Warehouse Provision
7.6 Retail warehouse provision is broadly distributed across Southampton and Eastleigh with
noticeable concentrations in Southampton City Centre and at Hedge End in Eastleigh, as
illustrated on Plan 5.
7.7 In Southampton City Centre, there are two retail parks: West Quay and Mountbatten, a
standalone Toys R US and Ikea, as discussed in section 5. Outside the City Centre there
are two concentrations of retail warehousing:
• Millbrook Road is located next to the Millbrook flyover, at the junction between the
A3024 and the A35 Tebourba Way. There are two retail warehouse units occupied by
Homebase and Comet.
• Other retail warehouse provision is located on Winchester Road, to the north east of
Shirley. There are five retail warehouse units here, occupied by Halfords, Currys, Pets
at Home, The Range and Wickes.
7.8 Retail warehouse provision in Eastleigh is predominantly located around Hedge End and
Junction 7 of the M27, where there are approximately 18 retail warehouse units which
include retailers such as B&Q, M&S, Wickes, Currys, Homebase and PC World amongst
others. A full list of retailers is provided in Table 21, Appendix 6.
7.9 In addition to Hedge End, there are two other retail parks in Eastleigh:
• Channon Retail Park is located off Woodside Avenue to the west of Eastleigh town
centre. The Retail Park comprises four units occupied by Halfords, Comet, Pets at
Home, Matalan. There is also a B&Q on the opposite side of Woodside Avenue.
• Chestnut Avenue Retail Park is located to the south of Chandler’s Ford district centre,
in close proximity to the Asda on Bournemouth Road. The retail park comprises three
units occupied by Homebase, Dreams and Nevada Bob.
7.10 There is also a standalone retail warehouse unit located on School Lane, again close to
Chandler’s Ford District Centre, which is occupied by Peter Green.
7.11 Plans 8 and 9 illustrate the influence of retail warehouse provision across the survey area.
It is evident that retail parks in Eastleigh draw from a wide catchment and benefit from a
particularly strong market share in Zones 14, 16-18 and 20-22. Retail Warehouse provision
Southampton City Council and Eastleigh Borough Council Retail Study
July 2011 I gva.co.uk 65
in Southampton appears less influential however this does not take into account the draw
from the City Centre retail parks as these have been combined with the City Centre’s
overall trade draw, as discussed in more detail in the following section.
Summary
• There are several smaller centres in Southampton and Eastleigh which are serving the
more local, day to day needs of local residents in their catchments areas. The
majority of these centres are anchored by large local stores, e.g. Sainsbury’s and
Waitrose. Although others offer smaller scale provision, e.g. Co-op in Hedge End and
Woolston.
• There are two key new foodstore developments coming forward in Woolston and
Portswood, alongside large scale residential development, which will further
contribute towards meeting local needs in these areas.
• There is considered to be reasonable provision of retail warehousing across both
Boroughs. In Southampton, provision is predominantly focused within the city centre.
In Eastleigh, there is a notable concentration at Hedge End which has a relatively
strong influence over shopping patterns across the Borough and the wider area.
Southampton City Council and Eastleigh Borough Council Retail Study
July 2011 I gva.co.uk 66
8. Quantitative Methodology & Data Inputs
8.1 We have used a conventional and widely accepted step by step methodology,
consistent with best practice, which draws upon the results of the household telephone
survey of existing shopping patterns to model the existing flow of available expenditure to
Southampton and Eastleigh’s key centres and identified out-of-centre retail provision. In
order to develop the baseline position, we have:
• Calculated the total amount of convenience and comparison goods expenditure
which is available within the postcode areas comprising the Southampton and
Eastleigh survey area;
• Allocated the available expenditure to the convenience and comparison goods
shopping destinations, based on the household telephone survey of shopping
patterns, so as to provide estimates of current sales and forecasts of future sales;
• Compared the total expenditure attracted to each shopping destination with current
retail floorspace to assess sales densities in each shopping destination.
8.2 Building on the baseline position, we have explored the capacity for further convenience
and comparison goods retail floorspace within Southampton and Eastleigh. In addition to
the baseline projections, we have also tested two scenarios based on alternative
population projections over the plan period. This is discussed in more detail below.
Data Inputs
Survey Area and Household Survey
8.3 In order to provide detailed factual information on shopping patterns in Southampton and
Eastleigh, we commissioned a new household telephone survey covering 2,600
households. GVA designed the survey questionnaire in consultation with the Councils and
NEMS Market Research Company – who undertook interviewing and data processing in
January 2011. The survey area, shown on Plan 1, is broken down into 28 zones. Whilst
there is some degree of overlap between zone boundaries and the local authority
boundaries, Zones 1-5, 8 and 15-17 broadly relate to Southampton and Zones 13-14 and
18-23 broadly relate to Eastleigh.
Southampton City Council and Eastleigh Borough Council Retail Study
July 2011 I gva.co.uk 67
8.4 The survey results identify shopping habits of households for both convenience and
comparison goods. Where necessary, the survey results have been re-based to remove
certain responses, such as “internet”, to ensure consistency with categories excluded in
the expenditure projections. For convenience goods, the household telephone survey
included questions on main food and top up food shopping. The results of the two types
of food expenditure were then merged through the application of a weight, which
reflects the estimated proportion of expenditure accounted for by each type.
8.5 For food we used a 75%/25% food/top-up food weighting. This forms a composite pattern
of convenience spending, expressed as a market share for each destination centre or
foodstore for each survey Zone. The survey also includes five questions on specific
comparison goods types, which coincides with Experian Business Strategies definitions of
comparison goods expenditure. The retail modelling exercise uses the weighted averages
of the household survey responses for each goods type based on the proportion of per
capita spend on that goods type. This process establishes pattern of residents spending
for each Zone in terms of the following types of goods:
• clothing and footwear;
• furniture, floor coverings and household textiles;
• DIY and decorating supplies;
• domestic and small electrical appliances (tv, hi-fi, radio, etc);
• personal goods (jewellery, glassware, books, stationary, gardening, pet related
products, recreational and sporting goods).
Estimates of Population
8.6 The baseline population estimates and forecasts were drawn from the Experian e-
marketer in-house system. This provides estimates of population based on trendline
projections and the 2001 census for small, localised areas. A further adjustment has been
made to Eastleigh’s baseline projections to better reflect variations in anticipated growth
across the Borough.
8.7 Overall, the baseline population of the survey area within Zones 1-28 is currently 1,106,352.
This is forecast to increase to 1,151,725 by 2016, to 1,203,340 by 2021 and 1,256,000 by
2026. This equates to an overall growth of 13.5% across the whole survey area.
Southampton City Council and Eastleigh Borough Council Retail Study
July 2011 I gva.co.uk 68
Population Scenarios
8.8 In addition to the baseline, we have tested alternative population scenarios which take
into account lower levels of anticipated growth in Southampton and variations in planned
housing development in Eastleigh.
8.9 For Southampton, Experian’s population projections are higher than those used in the
previous 2005/6 Study. Arup have looked in more detail at Southampton’s population
figures as part of their work on the Council’s infrastructure study and whilst slightly lower,
Arup’s forecasts broadly support Experian’s figures rather than DTZs. We have therefore
applied Arup’s marginally lower forecasts as a sensitivity test.
8.10 The scenarios are as follows:
• Scenario 1 – Baseline figures for Southampton (Zones 1-5, 8 and 15-17) reduced by
0.1% at 2011; 1.5% at 2016; 3.5% at 2021 and 5.3% at 2026 to reflect growth forecasts
prepared by Arup. Baseline figures for Eastleigh (Zones 13-14 and 18-23) with
development focussed on the Hedge End area (Zone 21)
• Scenario 2 – Baseline figures for Southampton (Zones 1-5, 8 and 15-17) reduced by
0.1% at 2011; 1.5% at 2016; 3.5% at 2021 and 5.3% at 2026 to reflect growth forecasts
prepared by Arup (no change from Scenario 1). Baseline figures for Eastleigh (Zones
13-14 and 18-23) with development focussed on the Eastleigh area (Zone 23).
8.11 The detailed breakdown of population by zone under each scenario is provided in Table
1, Appendices 4, 5, 7 and 8.
Available Expenditure in the Survey Area
8.12 The Experian e-marketer system provides estimates of the per capita expenditure for
convenience and comparison goods in 2009 prices. We have made deductions for
special forms of trading (SFT) which represent expenditure not available to spend in the
shops, i.e. internet and catalogue shopping based on the most up to date information
provided by Experian. The respective deductions assumed for convenience and
comparison goods are set out in Table 2 in Appendices 3-8. We have applied individual
per capita expenditure figures across each survey Zone to provide a more detailed
understanding of available expenditure in different parts of the catchment area.
Southampton City Council and Eastleigh Borough Council Retail Study
July 2011 I gva.co.uk 69
8.13 As explained in Section 3, we have applied growth rates for comparison goods of 0.4% for
the period 2009 to 2010; 1.2% for the period 2010 to 2011; 2.9% pa from 2011 to 2016; and
3.7% pa from 2016 onwards. For convenience goods we use growth rates of 0.3%
between 2009 and 2010; 0% between 2010 and 2011; 0.6% pa from 2011 to 2016; and 0.7%
pa from 2016 onwards. These growth rates are based on the latest economic forecasts
published by Pitney Bowes (Retail Expenditure Guide 2010/11) and Experian Business
Strategies (Retail Planner 8.1). Where there are difference between Experian and Pitney
Bowes, an average of their forecasts has been adopted.
8.14 We expect more growth will take place on comparison goods as opposed to
convenience goods as the scope to purchase more food is more limited than the scope
to purchase non-food goods. These assumptions take into account current economic
circumstances and the recession and demonstrate the levels of growth expected as a
consequence over the period to 2026.
8.15 Taking these considerations into account, we have generated expenditure by Zone to
highlight variations across the survey area and grown them accordingly to 2016, 2021, and
2026; 5 year forecasting periods as required by PPS4. Table 3, Appendix 3, applies per
capita expenditure within each Zone to baseline population forecasts, which indicates
that total available convenience goods expenditure within the survey area is currently
£1,994m. This is forecast to growth to £2,116m by 2016; to £2,284m by 2021; and to 2,460m
by 2026. This equates to an overall growth of £465m (23%) between 2011 and 2026 (Table
3, Appendix 3)
8.16 Table 3, Appendix 6, sets out the total available comparison goods expenditure within the
survey area by again applying per capita expenditure within each Zone to the baseline
population forecasts. This indicates that total available expenditure within the survey area
is currently £2,963m. This is forecast to grow to £3,487m by 2016; to £4,368m by 2021; and
to £5,465m by 2026. This equates to an overall growth of £2,502m (84%) between 2011
and 2026.
Floorspace Data
8.17 The comparison and convenience floorspace data used in our modelling has been drawn
from a range of data sources including the Institute of Grocery Distribution (IGD),
Southampton City Council, Eastleigh Borough Council, the Trevor Woods retail warehouse
database and Experian Goad town centre category reports. Our floorspace assumptions
Southampton City Council and Eastleigh Borough Council Retail Study
July 2011 I gva.co.uk 70
for the foodstores include, where appropriate, an adjustment to identify the proportion of
purely convenience goods floorspace. Most superstores include a proportion of non-food
floorspace; we have adjusted the net floorspace to identify the proportion of sales space
allocated for convenience goods. These accords with the expenditure data and the
expenditure assumptions used.

Southampton City Council and Eastleigh Borough Council Retail Study
July 2011 I gva.co.uk 71
9. Convenience Goods Capacity Forecasts
9.1 In this section we estimate the current performance of convenience retail provision in
Southampton and Eastleigh as the basis for forecasting the need for additional
convenience goods floorspace to the period 2026, incorporating the interim years of 2016
and 2021. The capacity tables accompanying this assessment are attached in
Appendices 3-5.
Convenience Goods Shopping Patterns
9.2 Addressing the city, town and district centres and out-of-centre provision across
Southampton and Eastleigh in turn, we have reviewed shopping patterns and the
performance of existing convenience goods floorspace. Using the composite market
shares derived from the household telephone survey and baseline expenditure estimates,
we have calculated the convenience goods turnover of the main convenience provision
in the two Boroughs.
9.3 The analysis reviews the performance of the main foodstores identified by the household
telephone survey, by comparing each with sales based upon estimates of company
average. The survey can underestimate the turnover of single stores on the basis that they
may not be the regular destination for main food shopping but instead receive a large
number of shoppers who visit infrequently for which would not be identified by the survey.
For example, M&S and Waitrose in particular, tend to be understated. In these
circumstances individual forecasts should be treated with caution, and wherever possible
should be corroborated by other sources.
9.4 Overall the combined turnover of identified convenience goods provision21 across
Southampton and Eastleigh is approximately £609.6m which equates to 31% of turnover
generated within the whole survey area. Within their respective administrative
boundaries, Southampton retains c.56% of expenditure generated within Zones 1-5, 8 and
15-17; whilst Eastleigh retains c.76% of convenience goods expenditure generated within
Southampton City Council and Eastleigh Borough Council Retail Study
July 2011 I gva.co.uk 72
the Borough (Zones 13-14 and 18-23). Taking into account cross-border flows i.e.
expenditure generated within Southampton’s zones which is spent in stores in Eastleigh
Borough and visa versa, we estimate that existing stores within the Boroughs achieve a
combined retention of 75% across Zones 1-5, 8 and 13-23. This is a very strong level of
retention.
9.5 A more detailed discussion of individual centres/convenience stores is set out below. The
individual trade draw patterns for each centre is provided in Appendix 3 (Tables 4-15 and
18-23).
Southampton City Centre
9.6 In total we estimate that the convenience stores in Southampton City Centre have a
current turnover in the region of £37.4m which is significantly below our estimate based on
company average (c.£68.9m). Our analysis indicates that the Asda adjacent to the
Marlands Centre is not performing particularly well. We estimate that the store has a
turnover in the region of £20.7m which is less than half our estimate based on company
average (£44.2m).
9.7 Based on our observations, the store is relatively dated by modern standards and does not
benefit from very good visibility from the road network or particularly good integration with
the town centre. However, the store was busy at the time of our site visit and is well-
placed to serve the top-up shopping needs of students and office workers in the
surrounding area. In view of this, we believe that the store’s top-up/basket shopping role
has not been fully captured by the household survey and therefore the survey-derived
turnover is likely to be understated.
9.8 Other convenience stores in the City Centre are generally smaller in scale and include the
M&S foodhall in West Quay, the Tesco Express and Lidl on High Street and several Co-op
convenience stores located across the centre. We estimate that these stores have a
combined turnover in the region of £16.7m which, again, is below our estimate based on
company average (£19m). However, again, it is likely that the household survey has
21 Listed in Tables 32 and 33, Appendix 3. There will be additional spend going to local stores in the area which has not
been factored into our assessment.
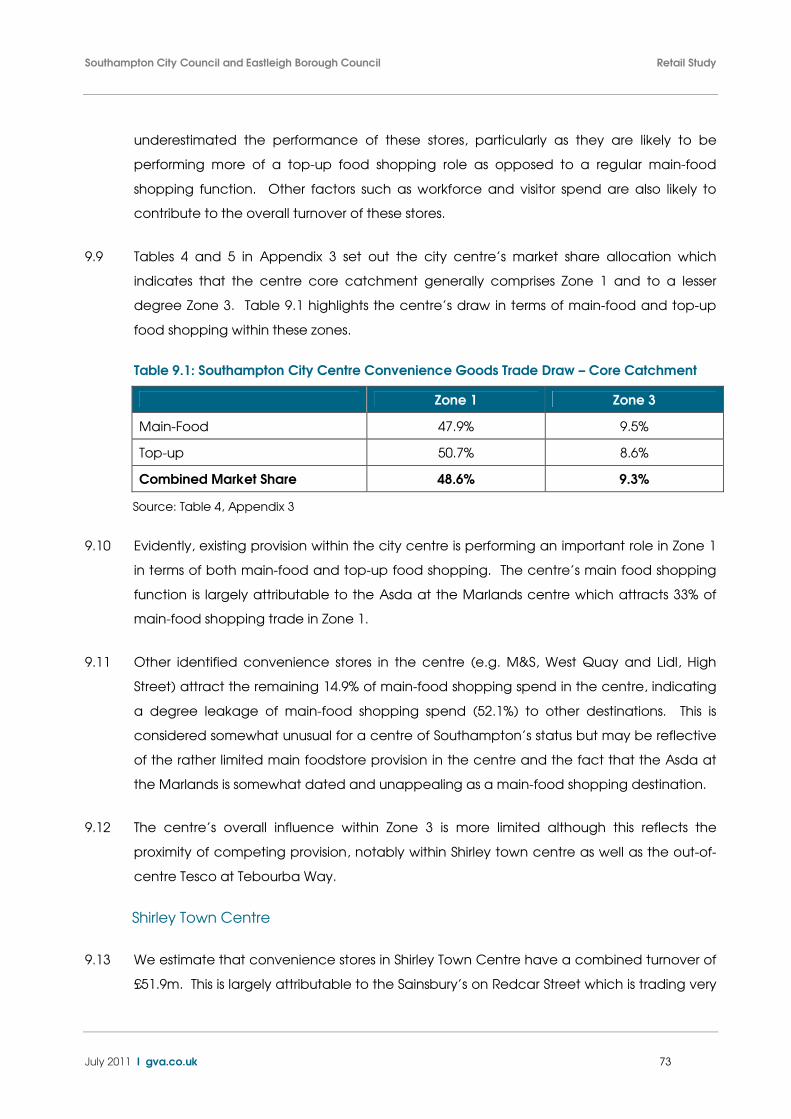
Southampton City Council and Eastleigh Borough Council Retail Study
July 2011 I gva.co.uk 73
underestimated the performance of these stores, particularly as they are likely to be
performing more of a top-up food shopping role as opposed to a regular main-food
shopping function. Other factors such as workforce and visitor spend are also likely to
contribute to the overall turnover of these stores.
9.9 Tables 4 and 5 in Appendix 3 set out the city centre’s market share allocation which
indicates that the centre core catchment generally comprises Zone 1 and to a lesser
degree Zone 3. Table 9.1 highlights the centre’s draw in terms of main-food and top-up
food shopping within these zones.
Table 9.1: Southampton City Centre Convenience Goods Trade Draw – Core Catchment
Zone 1 Zone 3
Main-Food 47.9% 9.5%
Top-up 50.7% 8.6%
Combined Market Share 48.6% 9.3%
Source: Table 4, Appendix 3
9.10 Evidently, existing provision within the city centre is performing an important role in Zone 1
in terms of both main-food and top-up food shopping. The centre’s main food shopping
function is largely attributable to the Asda at the Marlands centre which attracts 33% of
main-food shopping trade in Zone 1.
9.11 Other identified convenience stores in the centre (e.g. M&S, West Quay and Lidl, High
Street) attract the remaining 14.9% of main-food shopping spend in the centre, indicating
a degree leakage of main-food shopping spend (52.1%) to other destinations. This is
considered somewhat unusual for a centre of Southampton’s status but may be reflective
of the rather limited main foodstore provision in the centre and the fact that the Asda at
the Marlands is somewhat dated and unappealing as a main-food shopping destination.
9.12 The centre’s overall influence within Zone 3 is more limited although this reflects the
proximity of competing provision, notably within Shirley town centre as well as the out-of-
centre Tesco at Tebourba Way.
Shirley Town Centre
9.13 We estimate that convenience stores in Shirley Town Centre have a combined turnover of
£51.9m. This is largely attributable to the Sainsbury’s on Redcar Street which is trading very
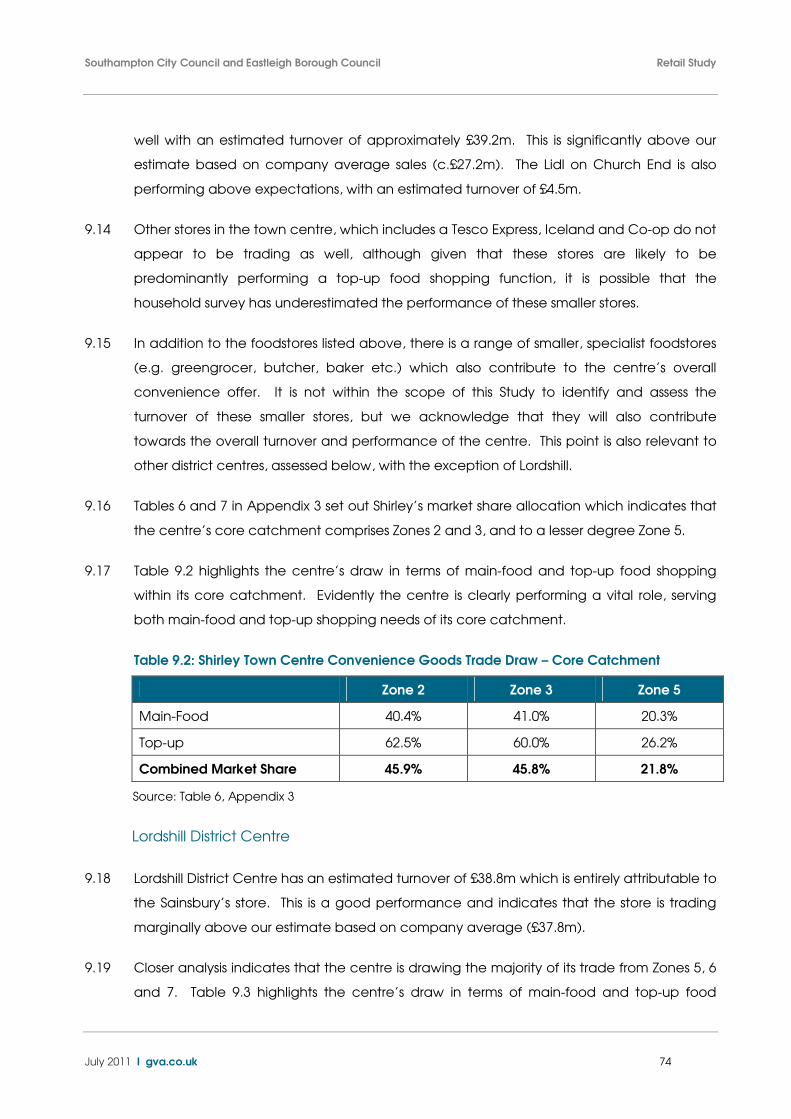
Southampton City Council and Eastleigh Borough Council Retail Study
July 2011 I gva.co.uk 74
well with an estimated turnover of approximately £39.2m. This is significantly above our
estimate based on company average sales (c.£27.2m). The Lidl on Church End is also
performing above expectations, with an estimated turnover of £4.5m.
9.14 Other stores in the town centre, which includes a Tesco Express, Iceland and Co-op do not
appear to be trading as well, although given that these stores are likely to be
predominantly performing a top-up food shopping function, it is possible that the
household survey has underestimated the performance of these smaller stores.
9.15 In addition to the foodstores listed above, there is a range of smaller, specialist foodstores
(e.g. greengrocer, butcher, baker etc.) which also contribute to the centre’s overall
convenience offer. It is not within the scope of this Study to identify and assess the
turnover of these smaller stores, but we acknowledge that they will also contribute
towards the overall turnover and performance of the centre. This point is also relevant to
other district centres, assessed below, with the exception of Lordshill.
9.16 Tables 6 and 7 in Appendix 3 set out Shirley’s market share allocation which indicates that
the centre’s core catchment comprises Zones 2 and 3, and to a lesser degree Zone 5.
9.17 Table 9.2 highlights the centre’s draw in terms of main-food and top-up food shopping
within its core catchment. Evidently the centre is clearly performing a vital role, serving
both main-food and top-up shopping needs of its core catchment.
Table 9.2: Shirley Town Centre Convenience Goods Trade Draw – Core Catchment
Zone 2 Zone 3 Zone 5
Main-Food 40.4% 41.0% 20.3%
Top-up 62.5% 60.0% 26.2%
Combined Market Share 45.9% 45.8% 21.8%
Source: Table 6, Appendix 3
Lordshill District Centre
9.18 Lordshill District Centre has an estimated turnover of £38.8m which is entirely attributable to
the Sainsbury’s store. This is a good performance and indicates that the store is trading
marginally above our estimate based on company average (£37.8m).
9.19 Closer analysis indicates that the centre is drawing the majority of its trade from Zones 5, 6
and 7. Table 9.3 highlights the centre’s draw in terms of main-food and top-up food
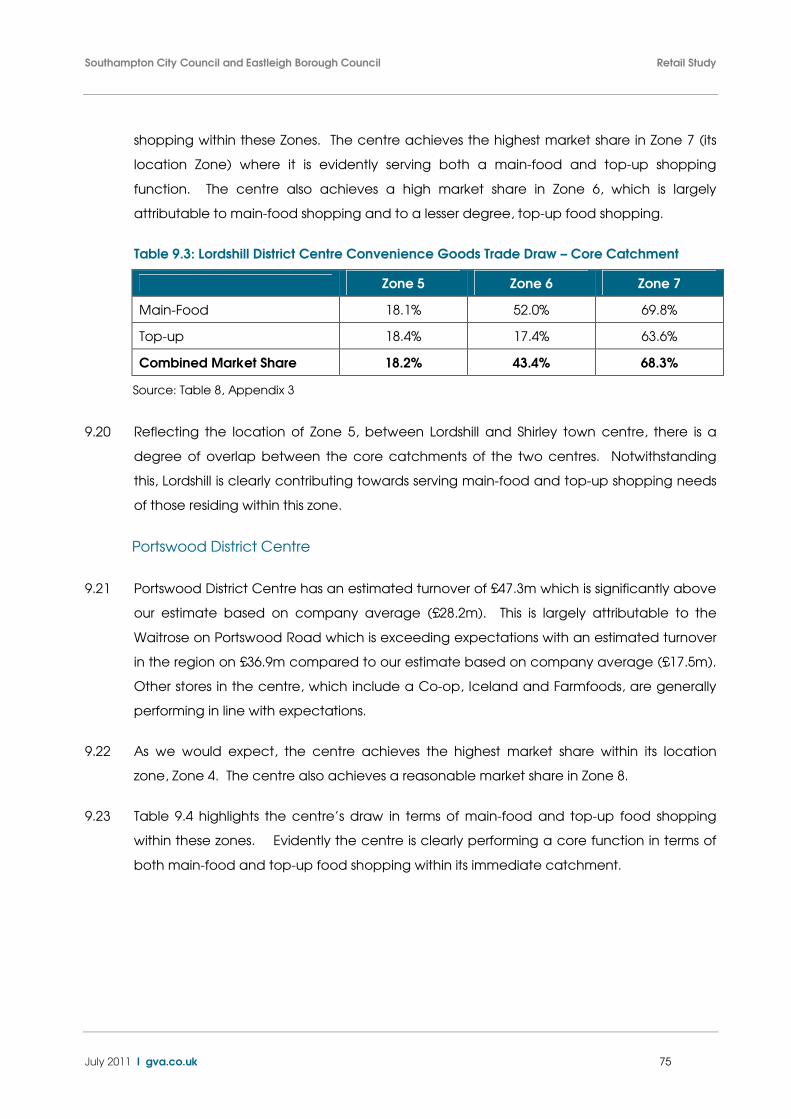
Southampton City Council and Eastleigh Borough Council Retail Study
July 2011 I gva.co.uk 75
shopping within these Zones. The centre achieves the highest market share in Zone 7 (its
location Zone) where it is evidently serving both a main-food and top-up shopping
function. The centre also achieves a high market share in Zone 6, which is largely
attributable to main-food shopping and to a lesser degree, top-up food shopping.
Table 9.3: Lordshill District Centre Convenience Goods Trade Draw – Core Catchment
Zone 5 Zone 6 Zone 7
Main-Food 18.1% 52.0% 69.8%
Top-up 18.4% 17.4% 63.6%
Combined Market Share 18.2% 43.4% 68.3%
Source: Table 8, Appendix 3
9.20 Reflecting the location of Zone 5, between Lordshill and Shirley town centre, there is a
degree of overlap between the core catchments of the two centres. Notwithstanding
this, Lordshill is clearly contributing towards serving main-food and top-up shopping needs
of those residing within this zone.
Portswood District Centre
9.21 Portswood District Centre has an estimated turnover of £47.3m which is significantly above
our estimate based on company average (£28.2m). This is largely attributable to the
Waitrose on Portswood Road which is exceeding expectations with an estimated turnover
in the region on £36.9m compared to our estimate based on company average (£17.5m).
Other stores in the centre, which include a Co-op, Iceland and Farmfoods, are generally
performing in line with expectations.
9.22 As we would expect, the centre achieves the highest market share within its location
zone, Zone 4. The centre also achieves a reasonable market share in Zone 8.
9.23 Table 9.4 highlights the centre’s draw in terms of main-food and top-up food shopping
within these zones. Evidently the centre is clearly performing a core function in terms of
both main-food and top-up food shopping within its immediate catchment.

Southampton City Council and Eastleigh Borough Council Retail Study
July 2011 I gva.co.uk 76
Table 9.4: Portswood District Centre Convenience Goods Trade Draw – Core Catchment
Zone 4 Zone 8
Main-Food 49.5% 12.5%
Top-up 55.6% 26.6%
Combined Market Share 51.0% 16.0%
Source: Table 10, Appendix 3
Bitterne District Centre
9.24 Bitterne District Centre has an estimated turnover of £39.4m which again exceeds
expectations compared to our estimated based on company average turnover - £28.1m.
Again, this is predominantly attributed to the Sainsbury’s on Bitterne Road which has an
estimated turnover of £34.8m – a strong performance. The household survey indicates
that the store is drawing the majority of its turnover from Zones 15 (20%), 16 (26%) and 17
(10%) although its influence across other zones is generally more limited.
9.25 Table 9.5 highlights the combined trade draw of convenience goods provision within the
district centre and its role in terms of both main-food and top-up food shopping within its
core catchment.
Table 9.5: Bitterne District Centre Convenience Goods Trade Draw – Core Catchment
Zone 15 Zone 16 Zone 17
Main-Food 25.8% 26.1% 14.4%
Top-up 18.8% 32.5% 1.6%
Combined Market Share 24.1% 27.7% 11.2%
Source: Table 12, Appendix 3
9.26 Evidently the centre is performing a key role in respect of both main-food and top-up food
shopping within Zones 15 and 16. The centre also draws a proportion of trade from Zone
17, although this is largely for main-food shopping. This could suggest there is currently a
lack of suitable main-food shopping provision in Zone 17.
Woolston District Centre
9.27 Woolston District Centre has an estimated turnover of £11.1m which is almost entirely
attributed to the Co-op on Obelisk Road. Based on the company average we estimate
that the Co-op should have a turnover in the region of £11m so in this respect the store is
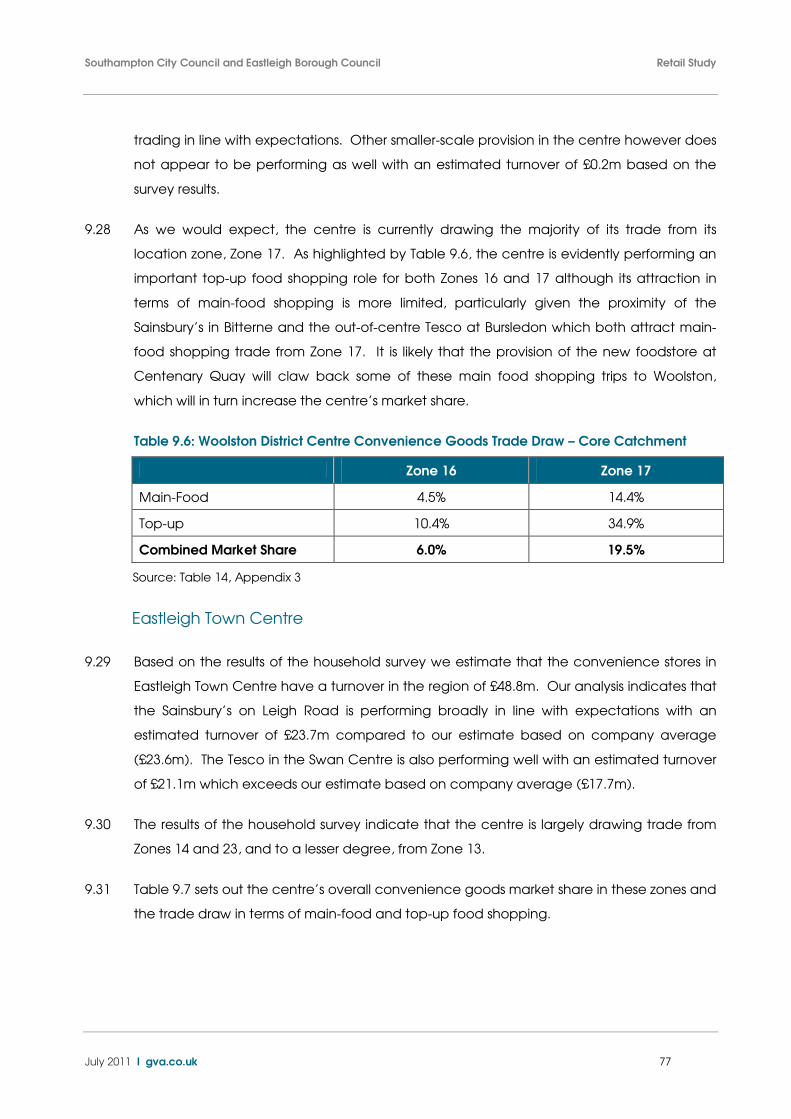
Southampton City Council and Eastleigh Borough Council Retail Study
July 2011 I gva.co.uk 77
trading in line with expectations. Other smaller-scale provision in the centre however does
not appear to be performing as well with an estimated turnover of £0.2m based on the
survey results.
9.28 As we would expect, the centre is currently drawing the majority of its trade from its
location zone, Zone 17. As highlighted by Table 9.6, the centre is evidently performing an
important top-up food shopping role for both Zones 16 and 17 although its attraction in
terms of main-food shopping is more limited, particularly given the proximity of the
Sainsbury’s in Bitterne and the out-of-centre Tesco at Bursledon which both attract main-
food shopping trade from Zone 17. It is likely that the provision of the new foodstore at
Centenary Quay will claw back some of these main food shopping trips to Woolston,
which will in turn increase the centre’s market share.
Table 9.6: Woolston District Centre Convenience Goods Trade Draw – Core Catchment
Zone 16 Zone 17
Main-Food 4.5% 14.4%
Top-up 10.4% 34.9%
Combined Market Share 6.0% 19.5%
Source: Table 14, Appendix 3
Eastleigh Town Centre
9.29 Based on the results of the household survey we estimate that the convenience stores in
Eastleigh Town Centre have a turnover in the region of £48.8m. Our analysis indicates that
the Sainsbury’s on Leigh Road is performing broadly in line with expectations with an
estimated turnover of £23.7m compared to our estimate based on company average
(£23.6m). The Tesco in the Swan Centre is also performing well with an estimated turnover
of £21.1m which exceeds our estimate based on company average (£17.7m).
9.30 The results of the household survey indicate that the centre is largely drawing trade from
Zones 14 and 23, and to a lesser degree, from Zone 13.
9.31 Table 9.7 sets out the centre’s overall convenience goods market share in these zones and
the trade draw in terms of main-food and top-up food shopping.
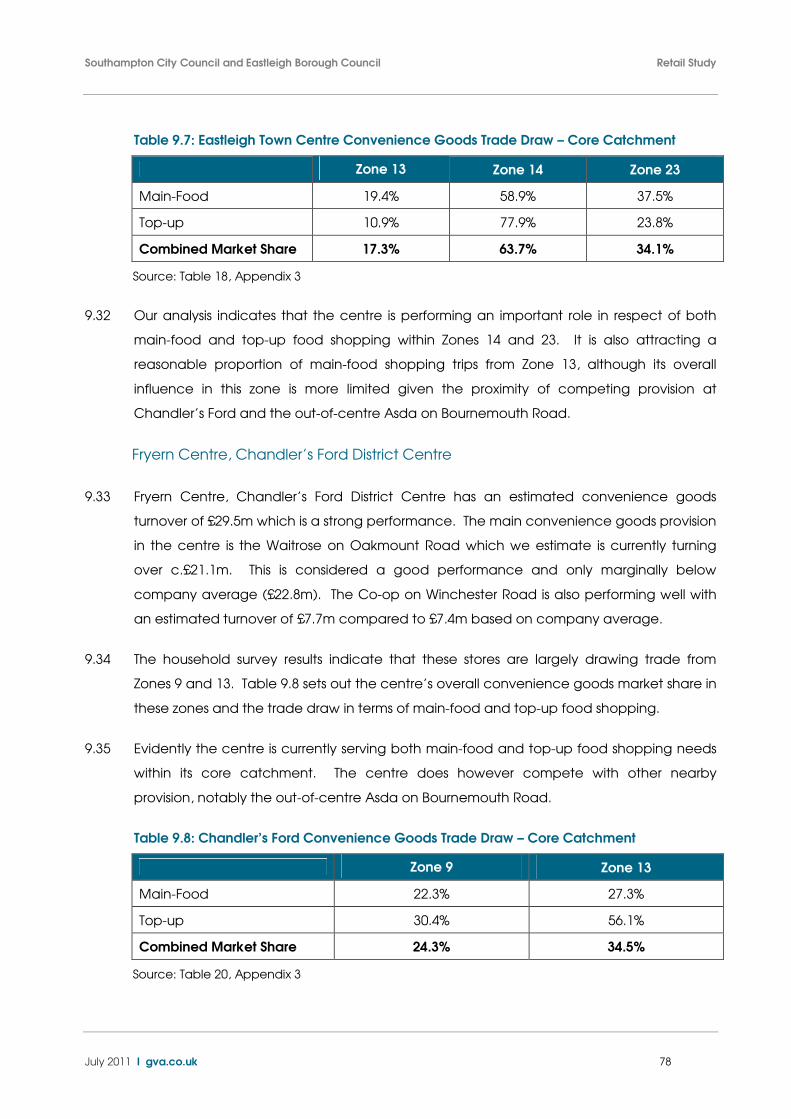
Southampton City Council and Eastleigh Borough Council Retail Study
July 2011 I gva.co.uk 78
Table 9.7: Eastleigh Town Centre Convenience Goods Trade Draw – Core Catchment
Zone 13 Zone 14 Zone 23
Main-Food 19.4% 58.9% 37.5%
Top-up 10.9% 77.9% 23.8%
Combined Market Share 17.3% 63.7% 34.1%
Source: Table 18, Appendix 3
9.32 Our analysis indicates that the centre is performing an important role in respect of both
main-food and top-up food shopping within Zones 14 and 23. It is also attracting a
reasonable proportion of main-food shopping trips from Zone 13, although its overall
influence in this zone is more limited given the proximity of competing provision at
Chandler’s Ford and the out-of-centre Asda on Bournemouth Road.
Fryern Centre, Chandler’s Ford District Centre
9.33 Fryern Centre, Chandler’s Ford District Centre has an estimated convenience goods
turnover of £29.5m which is a strong performance. The main convenience goods provision
in the centre is the Waitrose on Oakmount Road which we estimate is currently turning
over c.£21.1m. This is considered a good performance and only marginally below
company average (£22.8m). The Co-op on Winchester Road is also performing well with
an estimated turnover of £7.7m compared to £7.4m based on company average.
9.34 The household survey results indicate that these stores are largely drawing trade from
Zones 9 and 13. Table 9.8 sets out the centre’s overall convenience goods market share in
these zones and the trade draw in terms of main-food and top-up food shopping.
9.35 Evidently the centre is currently serving both main-food and top-up food shopping needs
within its core catchment. The centre does however compete with other nearby
provision, notably the out-of-centre Asda on Bournemouth Road.
Table 9.8: Chandler’s Ford Convenience Goods Trade Draw – Core Catchment
Zone 9 Zone 13
Main-Food 22.3% 27.3%
Top-up 30.4% 56.1%
Combined Market Share 24.3% 34.5%
Source: Table 20, Appendix 3
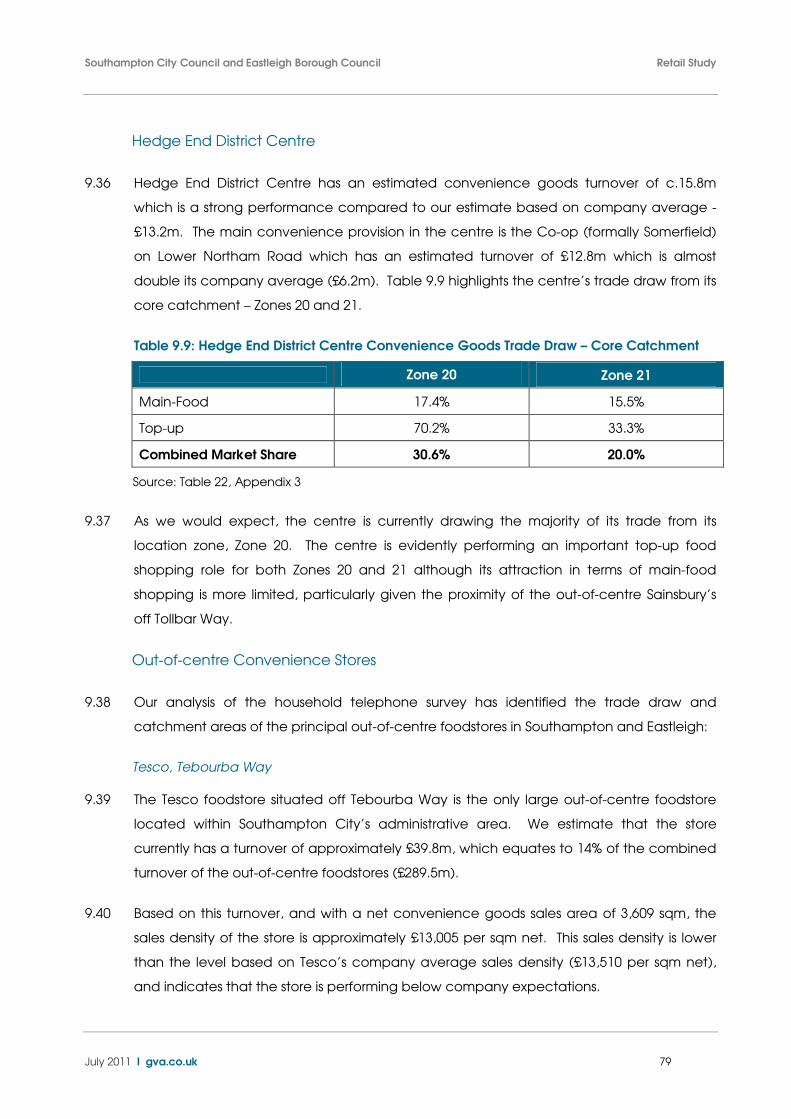
Southampton City Council and Eastleigh Borough Council Retail Study
July 2011 I gva.co.uk 79
Hedge End District Centre
9.36 Hedge End District Centre has an estimated convenience goods turnover of c.15.8m
which is a strong performance compared to our estimate based on company average -
£13.2m. The main convenience provision in the centre is the Co-op (formally Somerfield)
on Lower Northam Road which has an estimated turnover of £12.8m which is almost
double its company average (£6.2m). Table 9.9 highlights the centre’s trade draw from its
core catchment – Zones 20 and 21.
Table 9.9: Hedge End District Centre Convenience Goods Trade Draw – Core Catchment
Zone 20 Zone 21
Main-Food 17.4% 15.5%
Top-up 70.2% 33.3%
Combined Market Share 30.6% 20.0%
Source: Table 22, Appendix 3
9.37 As we would expect, the centre is currently drawing the majority of its trade from its
location zone, Zone 20. The centre is evidently performing an important top-up food
shopping role for both Zones 20 and 21 although its attraction in terms of main-food
shopping is more limited, particularly given the proximity of the out-of-centre Sainsbury’s
off Tollbar Way.
Out-of-centre Convenience Stores
9.38 Our analysis of the household telephone survey has identified the trade draw and
catchment areas of the principal out-of-centre foodstores in Southampton and Eastleigh:
Tesco, Tebourba Way
9.39 The Tesco foodstore situated off Tebourba Way is the only large out-of-centre foodstore
located within Southampton City’s administrative area. We estimate that the store
currently has a turnover of approximately £39.8m, which equates to 14% of the combined
turnover of the out-of-centre foodstores (£289.5m).
9.40 Based on this turnover, and with a net convenience goods sales area of 3,609 sqm, the
sales density of the store is approximately £13,005 per sqm net. This sales density is lower
than the level based on Tesco’s company average sales density (£13,510 per sqm net),
and indicates that the store is performing below company expectations.
Southampton City Council and Eastleigh Borough Council Retail Study
July 2011 I gva.co.uk 80
9.41 However we understand that there is a Certificate of Lawfulness (ref: 07/00220/LDCE/1552)
which allows the installation of a 1,957 sqm gross mezzanine floor in the existing store.
Based on our understanding of how Tesco utilise mezzanine floorspace we would
anticipate that the additional floorspace would, in the most part, be used for the sale of
non-food items and complementary uses such as a café.
9.42 This has therefore not been factored in as a commitment as part of our convenience
capacity forecast. Clearly, however the installation of the mezzanine floorspace is likely to
increase the store’s overall attraction and could therefore increase its market share.
Sainsbury’s & M&S, Tollbar Way
9.43 The Sainsbury’s and M&S stores are situated in Hedge End Park which is adjacent to
Junction 7 of the M27 and within the administrative boundary of Eastleigh Borough
Council. Hedge End Park is a relatively modern retail complex with a vast area of free car
parking. Within the immediate surroundings there are several retail parks which
complement the foodstore offer.
9.44 The Sainsbury’s store comprises c.4,763 sqm net convenience retail floorspace and an
estimated convenience goods turnover of approximately £81.1m which equates to 28% of
the combined turnover of the out-of-centre foodstores (£289.5m). This suggests a very
strong performance in comparison with the estimated company average (£61.5m). The
household survey indicates that the store’s core catchment comprises Zones 20-23, from
which it draws c.52% of its turnover. However, its overall influence extends well beyond this
as demonstrated by Table 24, Appendix 3.
9.45 The M&S Foodhall situated within the M&S store adjacent to the Sainsbury’s it less
influential and according to the household survey is not performing to expectation with a
more modest turnover of approximately £2.6m. However, for reasons stated previously, it is
possible that the survey has under-stated the overall performance of this store as it
appeared to be busy and performing well at the time of our site visit.
Tesco, Bursledon
9.46 The Tesco Extra in Bursledon is the largest out-of-centre store in Eastleigh. Situated off
Hamble Lane in the south of the Borough the store is in close proximity to Junction 8 of the
M27. The store is also situated very close to the border between Southampton and
Eastleigh.

Southampton City Council and Eastleigh Borough Council Retail Study
July 2011 I gva.co.uk 81
9.47 Based on the results of the household survey, we estimate that the store has a current
turnover of £84.7m, which equates to 29% of the combined turnover of the out-of-centre
foodstores (£289.5m).
9.48 Based on this turnover, and with a net convenience goods sales area of 4,948 sqm, the
sales density of the store is approximately £17,109 per sqm net. This sales density is much
higher than our estimate based on Tesco’s company average sales density (£13,510 per
sqm net), and indicates that the store is performing significantly better than company
expectations. Closer analysis indicates that this store has a strong core catchment
comprising Zones 15-18 and 24 from which is draws 89% of its trade.
Asda, Bournemouth Road
9.49 The Asda store off Bournemouth Road is situated towards the northern parts of Eastleigh
Borough, within relatively close proximity to Chandler’s Ford district centre. The store
comprises c.4,841 which is similar in scale to the Tesco Extra at Bursledon.
9.50 We estimate that the Asda has a current turnover of approximately £81.2m, which
equates to 28% of the combined turnover of the out-of-centre foodstores in Southampton
and Eastleigh. This is a strong performance compared to our estimate based on company
average, £72.3m. Closer analysis indicates that the store has a relatively extensive
influence and draws trade from across most of the survey area (with the only exception of
Zones 19 and 28). As we would expect, the store has a noticeably stronger influence over
its immediate catchment with a market share of 48% in Zone 9 (its location Zone).
Baseline Convenience Goods Capacity Forecasts
9.51 We have examined the capacity for further convenience goods floorspace for
Southampton and Eastleigh up to 2026, incorporating the interim years of 2016 and 2021.
It is important to note that capacity forecasts become increasingly open to margins of
error over time and should be updated over the LDF period – ideally every 5 years.
9.52 In accordance with the Councils’ brief, we have assessed capacity for additional
convenience goods provision within the following areas:
• Southampton City Centre;
• Eastleigh Town Centre;
• Southampton West (comprising the district centres of Lordshill, Shirley and Portswood);
Southampton City Council and Eastleigh Borough Council Retail Study
July 2011 I gva.co.uk 82
• Southampton East (comprising the district centres of Bitterne and Woolston);
• Eastleigh North (comprising Fryern Centre, Chandler’s Ford district centre); and
• Eastleigh South (comprising Hedge End district centre).
9.53 In order to ensure our capacity forecasts are as up to date and robust as possible we
have taken into account any new convenience goods developments already coming
forward in the identified sub-areas as a result of existing planning permissions. In terms of
the convenience commitments we have considered, they include the following schemes
provided by the Councils:
• New retail floorspace at 165 St Mary Street, Southampton City Centre (186 sqm net);
• New foodstore and unit shops at the former Vosper site, Woolston (Southampton East)
(2,574 sqm net); and
• Redevelopment of Portswood Road bus depot for a new Sainsbury’s foodstore
(Southampton West) (3,539 sqm net).
9.54 These convenience retail commitments have a combined convenience goods floorspace
of 6,299 sqm net. We have estimated the turnover of each commitment which is then
removed from the residual expenditure identified in the capacity modelling for the
relevant sub-area.
9.55 In order to translate residual convenience good expenditure into floorspace we have
assumed that mainstream foodstore operators would aim to achieve an average sales
density of approximately £10,000 per sqm net. As is our normal practice, we have not
prepared low and high sales density capacity forecasts; rather we have focussed on the
capacity available to support main foodstores. If smaller operators and discounters came
forward the amount of capacity would be greater as they achieve a lower sales density.
For example, Lidl currently have a sales density of £2,987 per sqm.
9.56 Table 9.10 illustrates the convenience goods capacity identified in each sub-area based
on constant market shares and taking into account the commitments identified above.
We have also identified ‘Other’ capacity arising within Southampton and Eastleigh based
on the performance of the out-of-centre stores, many of which are currently overtrading.
This is a residual capacity figure and where possible, should be redirected towards existing
centres in the first instance.
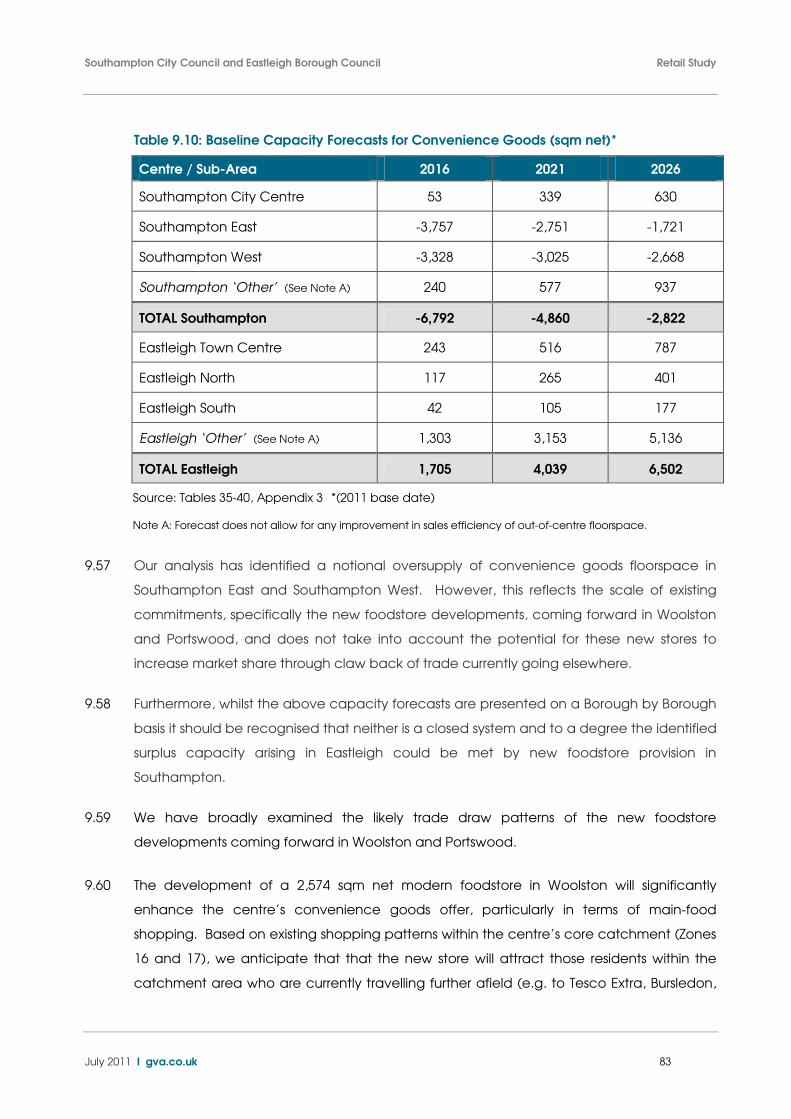
Southampton City Council and Eastleigh Borough Council Retail Study
July 2011 I gva.co.uk 83
Table 9.10: Baseline Capacity Forecasts for Convenience Goods (sqm net)*
Centre / Sub-Area 2016 2021 2026
Southampton City Centre 53 339 630
Southampton East -3,757 -2,751 -1,721
Southampton West -3,328 -3,025 -2,668
Southampton ‘Other’ (See Note A) 240 577 937
TOTAL Southampton -6,792 -4,860 -2,822
Eastleigh Town Centre 243 516 787
Eastleigh North 117 265 401
Eastleigh South 42 105 177
Eastleigh ‘Other’ (See Note A) 1,303 3,153 5,136
TOTAL Eastleigh 1,705 4,039 6,502
Source: Tables 35-40, Appendix 3 *(2011 base date)
Note A: Forecast does not allow for any improvement in sales efficiency of out-of-centre floorspace.
9.57 Our analysis has identified a notional oversupply of convenience goods floorspace in
Southampton East and Southampton West. However, this reflects the scale of existing
commitments, specifically the new foodstore developments, coming forward in Woolston
and Portswood, and does not take into account the potential for these new stores to
increase market share through claw back of trade currently going elsewhere.
9.58 Furthermore, whilst the above capacity forecasts are presented on a Borough by Borough
basis it should be recognised that neither is a closed system and to a degree the identified
surplus capacity arising in Eastleigh could be met by new foodstore provision in
Southampton.
9.59 We have broadly examined the likely trade draw patterns of the new foodstore
developments coming forward in Woolston and Portswood.
9.60 The development of a 2,574 sqm net modern foodstore in Woolston will significantly
enhance the centre’s convenience goods offer, particularly in terms of main-food
shopping. Based on existing shopping patterns within the centre’s core catchment (Zones
16 and 17), we anticipate that that the new store will attract those residents within the
catchment area who are currently travelling further afield (e.g. to Tesco Extra, Bursledon,
Southampton City Council and Eastleigh Borough Council Retail Study
July 2011 I gva.co.uk 84
Sainsbury’s, Tollbar Way and Sainsbury’s Bitterne) to satisfy their main food shopping
needs.
9.61 Based on our analysis we believe there is potential for the new store to increase the
centre’s overall market share in Zone 16 from 6% to 26%; and in Zone 17 from 19.5% to 66%.
By way of claw back, we would expect the new store to divert significant proportion of
trade currently drawn to the out-of-centre Tesco Extra, Bursledon and, to a lesser degree,
the Sainsbury’s Tollbar Way. We would also anticipate a degree of claw back from
existing stores in Bitterne, Portswood and Shirley, although not sufficient to adversely
impact on these centres.
9.62 In Portswood, the development of a 3,539 sqm net Sainsbury’s store will add to the
centre’s current convenience shopping offer which includes a Waitrose. Based on our
analysis of existing shopping patterns we would anticipate that the new store would help
capture those residents within the centre’s core catchment (Zones 4 and 8) who are
currently choosing travel to other foodstores situated further afield (e.g. Asda,
Bournemouth Road and Tesco, Tebourba Way).
9.63 Based on our analysis we believe that the new store will increase trade retention in the
area and reinforce its market share in the centre’s core catchment area, particularly in
Zone 4. We estimate that, by way of claw back, the new store could potentially increase
Portswood’s market share in Zone 4 from 51% to 76%; and in Zone 8 from 16% to 45%.
9.64 We estimate that majority of trade to support the new store will be diverted from existing
out-of centre stores (e.g. Asda, Bournemouth Road; Tesco, Tebourba Way; Sainsbury’s
Tollbar Way; and Tesco, Bursledon). We would also anticipate a degree of claw back
from existing stores in Shirley, Bitterne, Chandler’s Ford and also existing store’s within
Portswood, although not sufficient to result in a adverse impact on the vitality and viability
of these centres.
9.65 The anticipated effects of the new stores in Woolston and Portswood on existing shopping
patterns and current market shares will affect the distribution of capacity arising over the
plan period. Table 9.11 below provides a revised set of capacity figures based on
notional changes in market share as a result of the new foodstore developments in
Woolston and Portswood.
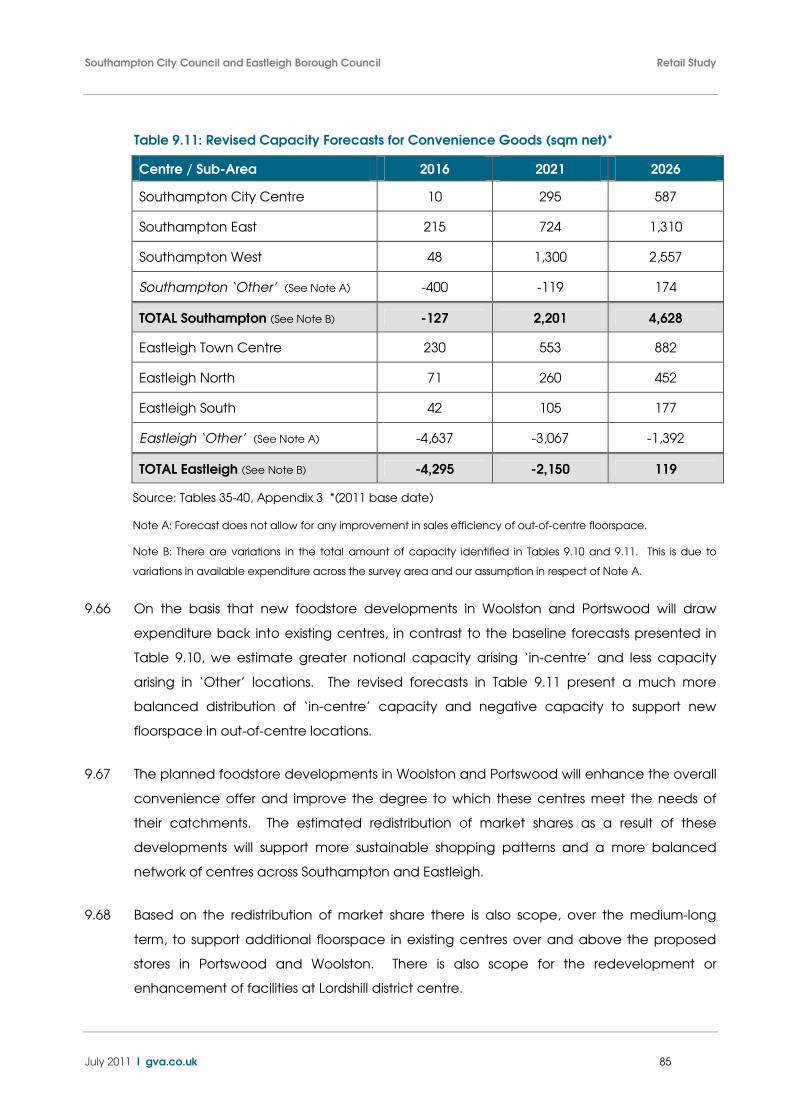
Southampton City Council and Eastleigh Borough Council Retail Study
July 2011 I gva.co.uk 85
Table 9.11: Revised Capacity Forecasts for Convenience Goods (sqm net)*
Centre / Sub-Area 2016 2021 2026
Southampton City Centre 10 295 587
Southampton East 215 724 1,310
Southampton West 48 1,300 2,557
Southampton ‘Other’ (See Note A) -400 -119 174
TOTAL Southampton (See Note B) -127 2,201 4,628
Eastleigh Town Centre 230 553 882
Eastleigh North 71 260 452
Eastleigh South 42 105 177
Eastleigh ‘Other’ (See Note A) -4,637 -3,067 -1,392
TOTAL Eastleigh (See Note B) -4,295 -2,150 119
Source: Tables 35-40, Appendix 3 *(2011 base date)
Note A: Forecast does not allow for any improvement in sales efficiency of out-of-centre floorspace.
Note B: There are variations in the total amount of capacity identified in Tables 9.10 and 9.11. This is due to
variations in available expenditure across the survey area and our assumption in respect of Note A.
9.66 On the basis that new foodstore developments in Woolston and Portswood will draw
expenditure back into existing centres, in contrast to the baseline forecasts presented in
Table 9.10, we estimate greater notional capacity arising ‘in-centre’ and less capacity
arising in ‘Other’ locations. The revised forecasts in Table 9.11 present a much more
balanced distribution of ‘in-centre’ capacity and negative capacity to support new
floorspace in out-of-centre locations.
9.67 The planned foodstore developments in Woolston and Portswood will enhance the overall
convenience offer and improve the degree to which these centres meet the needs of
their catchments. The estimated redistribution of market shares as a result of these
developments will support more sustainable shopping patterns and a more balanced
network of centres across Southampton and Eastleigh.
9.68 Based on the redistribution of market share there is also scope, over the medium-long
term, to support additional floorspace in existing centres over and above the proposed
stores in Portswood and Woolston. There is also scope for the redevelopment or
enhancement of facilities at Lordshill district centre.
Southampton City Council and Eastleigh Borough Council Retail Study
July 2011 I gva.co.uk 86
9.69 Whilst there is less notional capacity arising in Southampton city centre, this reflects the
survey-derived performance of existing stores. As previously highlighted, it is likely that the
household survey has underestimated the performance of existing stores in the city centre
and therefore the capacity arising in the centre is also likely to be understated.
9.70 There is global capacity in Southampton to support new foodstore provision over the
medium to long term and there is certainly scope for the city centre to increase its market
share, particularly in Zone 1, by way of clawing back trade currently drawn to other
centres/stores beyond its catchment. This would, in turn, increase notional capacity to
support new convenience floorspace in the centre.
9.71 We understand from the Council that there is interest from a number of supermarkets who
are keen to secure representation in the city centre. Morrisons has been named as the
preferred occupier for a new purpose-built supermarket as part of proposals for the
redevelopment of East Street shopping centre – a site identified in our health check as
being in need of improvement and a development opportunity. Other medium scale
supermarket proposals could also emerge on other development sites in the city centre,
e.g. Bargates.
9.72 For development control purposes these sites are located within the Primary Shopping
Area (PSA) as defined on the proposals map and, in PPS4 terms, are therefore an
appropriate location for retail development. In addition to regenerating the sites, such
development would enhance the city centre’s main foodstore provision.
9.73 Existing main foodstore provision in the city is currently limited to the Asda at the Marlands
Centre which, as previously highlighted, is somewhat dated and likely to be performing
more of a top-up food shopping function. The introduction of new foodstore provision in
the city centre could have the effect of stimulating investment in the Asda store as the
retailer responds to growing competition.
9.74 Alternatively new foodstore provision could precipitate Asda’s closure if the store does not
improve its attraction. In any event, additional foodstore provision can only be beneficial
to the city centre in terms of enhancing the choice and quality of the foodstore offer,
reducing the need to travel to other stores situated further afield as well as helping to
bring forward sites within the PSA which are in much need of regeneration.
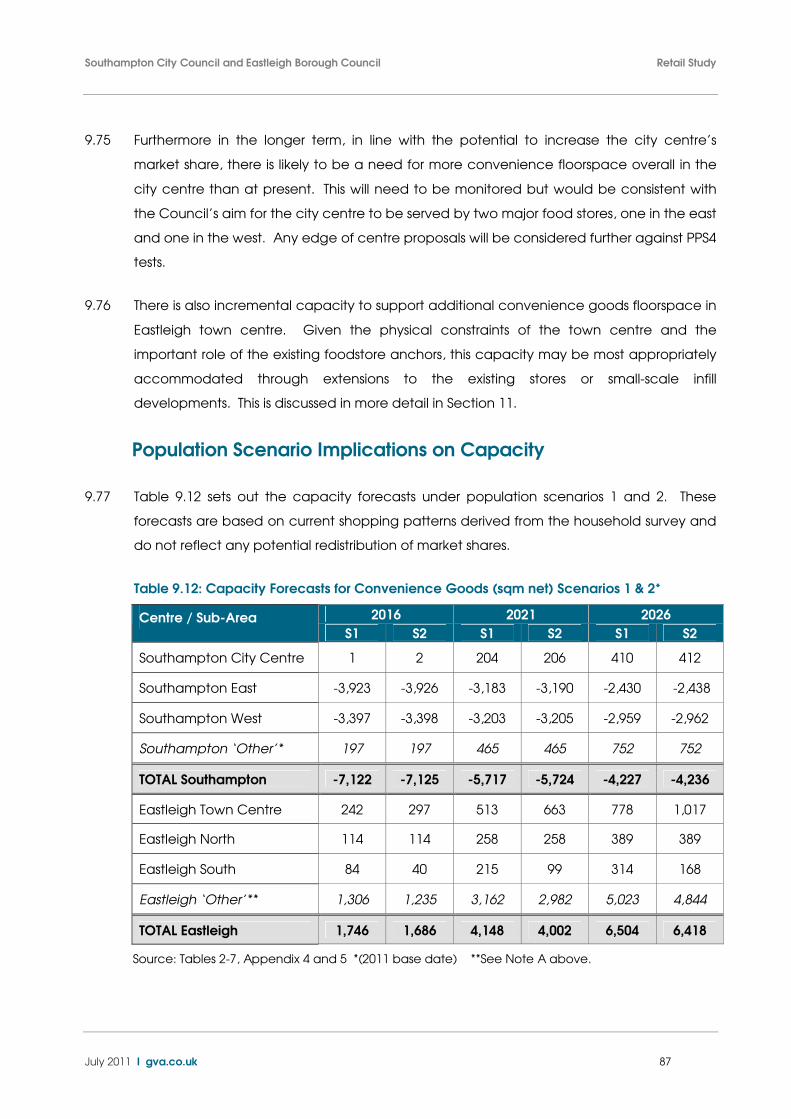
Southampton City Council and Eastleigh Borough Council Retail Study
July 2011 I gva.co.uk 87
9.75 Furthermore in the longer term, in line with the potential to increase the city centre’s
market share, there is likely to be a need for more convenience floorspace overall in the
city centre than at present. This will need to be monitored but would be consistent with
the Council’s aim for the city centre to be served by two major food stores, one in the east
and one in the west. Any edge of centre proposals will be considered further against PPS4
tests.
9.76 There is also incremental capacity to support additional convenience goods floorspace in
Eastleigh town centre. Given the physical constraints of the town centre and the
important role of the existing foodstore anchors, this capacity may be most appropriately
accommodated through extensions to the existing stores or small-scale infill
developments. This is discussed in more detail in Section 11.
Population Scenario Implications on Capacity
9.77 Table 9.12 sets out the capacity forecasts under population scenarios 1 and 2. These
forecasts are based on current shopping patterns derived from the household survey and
do not reflect any potential redistribution of market shares.
Table 9.12: Capacity Forecasts for Convenience Goods (sqm net) Scenarios 1 & 2*
2016 2021 2026 Centre / Sub-Area S1 S2 S1 S2 S1 S2
Southampton City Centre 1 2 204 206 410 412
Southampton East -3,923 -3,926 -3,183 -3,190 -2,430 -2,438
Southampton West -3,397 -3,398 -3,203 -3,205 -2,959 -2,962
Southampton ‘Other’* 197 197 465 465 752 752
TOTAL Southampton -7,122 -7,125 -5,717 -5,724 -4,227 -4,236
Eastleigh Town Centre 242 297 513 663 778 1,017
Eastleigh North 114 114 258 258 389 389
Eastleigh South 84 40 215 99 314 168
Eastleigh ‘Other’** 1,306 1,235 3,162 2,982 5,023 4,844
TOTAL Eastleigh 1,746 1,686 4,148 4,002 6,504 6,418
Source: Tables 2-7, Appendix 4 and 5 *(2011 base date) **See Note A above.
Southampton City Council and Eastleigh Borough Council Retail Study
July 2011 I gva.co.uk 88
9.78 Evidently, the lower population growth rates applied to Southampton’s zones under both
scenarios further reduces available spend with the effect of increasing the notional
oversupply of floorspace.
9.79 Marginal variations in the level capacity identified within Southampton under Scenarios 1
and 2 also arise as a result of sensitivities relating to population growth within Eastleigh i.e.
where existing convenience goods provision in Southampton is currently drawing an
element of trade from either Zones 21 or 23 in Eastleigh Borough.
9.80 As highlighted previously, the population scenarios tested in Eastleigh’s zones (specifically
Zones 21 and 23) are geographical as opposed to numerical in the sense of overall
population growth. For example, over the period between 2011 and 2026, the overall
uplift in population growth from the baseline scenario is identical under both scenarios
(c.3,800) however the Zones affected by growth and the periods at which they are
affected differ between the two scenarios resulting in marginal variations in identified
capacity in the different sub-areas as well as on a global basis.
9.81 Under Scenario 1 there is marginally greater capacity arising in Eastleigh South reflecting
the focus of ‘greenfield’ housing growth on Hedge End & Botley (Zone 21). Whereas,
under Scenario 2 there is marginally greater capacity generated by Eastleigh town centre
and Eastleigh’s ‘other’ provision reflecting the focus of ‘greenfield’ housing growth on Fair
Oak, Bishopstoke & Horton Heath (Zone 23). The Council should take into account the
sensitivity of growth on overall capacity and ensure that future convenience goods needs
are adequately met in areas of significant housing growth.
Summary
• Our analysis of current convenience shopping patterns indicates that the majority of
centres are performing a key role in terms of both main-food and top-up food
shopping. Reflecting Southampton city centre’s higher order comparison function, its
convenience role is more limited and existing main food provision is not performing as
well as expected. In contrast Eastleigh town centre is performing very strongly as are
the majority of other district centres.
• There is a degree of overlapping catchments between centres although the greatest
competition faced is by the out-of-centre foodstores. Particularly those in Eastleigh.
Southampton City Council and Eastleigh Borough Council Retail Study
July 2011 I gva.co.uk 89
• Notwithstanding this, there are new developments coming forward on the edge of
Woolston and Portswood which will help re-direct trade currently drawn to out-of-
centre locations, back into the centres and help support a more balanced network of
centres across both Boroughs.
• Based on current market shares and taking account of existing commitments we have
identified a notional oversupply of floorspace in Southampton under the baseline
scenario. However, reflecting scope for claw back through the re-diversion of trade
back into Woolston and Portswood and the subsequent redistribution of market
shares, we anticipate a more balanced distribution of ‘in-centre’ capacity and
negative capacity to support new floorspace in out-of-centre locations.
• We have not identified quantitative capacity for significant additional convenience
goods floorspace in Southampton city centre, although there is scope for the city
centre to increase its market share, and hence notional capacity for additional
floorspace. There is also a qualitative argument to support new, modern foodstore
provision on the basis that existing main foodstore provision (i.e. Asda, Marlands
Centre) is somewhat dated and is not fully meeting the main-food shopping needs of
its catchment resulting in a reasonable level of leakage to other stores located further
afield. There is currently retailer interest in the city centre and opportunities to deliver
new, modern foodstore facilities which would increase competition, enhance
consumer choice, and support more sustainable shopping patterns.
• There is also scope for some additional convenience goods floorspace in Eastleigh
town centre. However, given the physical constraints of the centre and the important
role of the existing foodstore anchors, this may be most appropriately
accommodated through extensions to existing stores or small-scale infill
developments.
• Our population scenario testing indicates that, subject to population growth and the
focus for new housing, the overall level of capacity forecast could be marginally less
than that identified by the baseline analysis. This should be acknowledged in
planning for any additional provision, particularly in Eastleigh.
Southampton City Council and Eastleigh Borough Council Retail Study
July 2011 I gva.co.uk 90
10. Comparison Goods Capacity Forecasts
10.1 In this section we estimate the current performance of comparison retail provision in
Southampton and Eastleigh as the basis for forecasting the need for additional
comparison goods floorspace to the period 2026, incorporating the interim years of 2016
and 2021. The capacity tables accompanying this assessment are attached in
Appendices 6-8.
Comparison Goods Shopping Patterns
10.2 We have assessed the main comparison goods shopping destinations within the Boroughs,
notably Southampton city centre, Eastleigh town centre and the out-of-centre retail
provision, by reviewing shopping patterns and the performance of existing comparison
goods floorspace. Using the market shares derived from the household survey and the
baseline expenditure estimates, we have calculated the comparison goods turnover of
Southampton city centre, Eastleigh town centre and the out-of-centre comparison retail
floorspace. It is not within the scope of this study to identify or assess the comparison retail
performance of the district centres.
10.3 The individual centres and key out-of-centre retail destinations are discussed in more
detail below. The individual trade draw patterns for each centre / retail destination is
provided in Appendix 6 (Tables 4-19).
Southampton City Centre
10.4 We have used the results of household telephone survey to estimate the current market
share of Southampton city centre (Table 4, Appendix 6). It is evident that the city centre
draws from an extensive catchment which covers all zones across the survey area. The
city centre’s core catchment broadly covers those zones which comprise the City’s
administrative area, including Zones 1-8, 15 and 17. Within these zones Southampton city
centre attracts 42-51% market shares22.
22 Does not include the retail parks or Ikea.
Southampton City Council and Eastleigh Borough Council Retail Study
July 2011 I gva.co.uk 91
10.5 In its secondary catchment (excluding the outer Zones 24-28), the centre has a market
share of between 14%-35%. In the outer zones the centre achieves market shares
between 3% (Zone 28 - the Isle of Wight) and 27% (Zone 27).
10.6 We have also analysed the trade draw of the West Quay Retail Park and Ikea which,
given their proximity to the West Quay Shopping Centre, form a further component of the
city centre’s overall shopping offer. As demonstrated in Table 6, Appendix 4, the city
centre’s retail warehouse provision also has an extensive catchment, drawing from all
zones across the survey area.
10.7 Overall we estimate that the city centre has a comparison goods turnover from the survey
area of £605.5m whilst the West Quay Retail Park and Ikea have a combined turnover
from the survey area of £377.9m. In total therefore we estimate that, based on the trade
draw from the survey area, the city centre has a comparison goods turnover of £983.4
equating to an overall market share of 33.2% across the entire survey area.
10.8 Reflecting the city centre’s attraction as a regional shopping destination, it is also
necessary to factor in a degree of inflow from beyond the survey area. Consistent with
the South Hampshire Town Centres: Sub Regional Study (March 2006), we have estimated
an inflow of 15% from beyond the survey area. This equates to a total estimated
comparison goods turnover of £1,131m.
10.9 We estimate that the existing comparison good floorspace in Southampton city centre
(including West Quay and Ikea) is currently 114,459 sqm net and based upon the level of
turnover identified (including inflow), it therefore has a sales density of £9,880 per sqm.
There is no definitive benchmark to indicate whether this may signify that the city centre is
over or under trading. However, in our experience the city’s estimated sales density is
certainly at the upper end of the range we would expect to see for a centre of
Southampton’s status. This could indicate demand or latent capacity over and above our
forecasts (presented below) and scope for new growth to dilute sales without significantly
impacting on existing floorspace.
10.10 The baseline turnover of Southampton city centre is forecast to increase over the period to
2026 as a result of growth in population and expenditure. Based on a constant market
share, we estimated that the turnover of Southampton will increase to £1,331m by 2016; to
£1,667m by 2021; and £2,086m by 2026.
Southampton City Council and Eastleigh Borough Council Retail Study
July 2011 I gva.co.uk 92
Eastleigh Town Centre
10.11 We have identified that the main market share attracted to Eastleigh town centre is
derived from the town centre’s location zone, Zone 14 (41%) and its adjacent zone, Zone
23 (28%). Eastleigh town centre’s secondary catchment includes Zones 9 (13%) and 13
(18%) and to a lesser extent Zones 10 (7%), 20 (7%) and 22 (8%). The centre is generally less
influential over other zones across the survey area where is attracts market shares of
between 0% - 4%.
10.12 Based on the identified pattern of trade draw from the survey area, we estimate that
Eastleigh town centre currently has a turnover of £89m. This baseline turnover is forecast to
increase to increase to £104.2m by 2016; to £129.3m by 2021; and to £160.2m by 2026.
10.13 We estimate that Eastleigh has a total comparison goods floorspace of 13,001 sqm net.
Based upon a turnover of £89m this equates to a sales density of £6,849 sqm net which is
considered a good performance for a centre of Eastleigh’s scale and retail offer.
Out-of-Centre Retail Provision
10.14 We have identified the market share drawn to the main retail warehouse destinations and
stand alone units in Southampton City and Eastleigh Borough identified in Section 7 and
illustrated on Plan 5.
10.15 Based on the survey results the out-of-centre retail warehousing in Southampton
(concentrated on Millbrook Road and Winchester Road), has a combined turnover of
£61.1m which equates to a market share of 2.1% across the whole survey area. The
turnover of these stores generally exceeds expectations based on company averages,
which suggests stores are currently trading well.
10.16 In Eastleigh, there is particular concentration of retail warehousing at Hedge End in
addition to two other retail parks (Channon Retail Park and Chestnut Avenue Retail Park)
and a Peter Green furniture store located in the north of the Borough. Based on the
survey results, we estimate that out-of-centre retail floorspace in Eastleigh achieves a
combined turnover of £271.5m. However, the majority (87%) of this turnover is attributed
to the retail warehousing at Hedge End which we estimate has a turnover in the region of
£235m. This is very high and clearly exceeds the turnover generated by Eastleigh town
centre.
Southampton City Council and Eastleigh Borough Council Retail Study
July 2011 I gva.co.uk 93
Baseline Comparison Goods Capacity Forecasts
10.17 In assessing capacity for future comparison goods floorspace, we have assumed that the
efficiency with which existing town centre floorspace is being used will increase over time.
Drawing on the latest advice published by Experian and Pitney Bowes, we have assumed
an annual growth in existing sales per sqm net of 1.2% between 2011 and 2016; increasing
to 2% pa beyond 2016. On the basis that there is no policy protection for out-of-centre
floorspace, we have not allowed for any increase in sales efficiency for existing out-of-
centre provision within Southampton and Eastleigh. However, that is not to say that out-
of-centre provision could not increase its turnover per sqm.
10.18 We have also factored in a number of commitments for additional comparison floorspace
in Southampton city centre and Eastleigh town centre and at the out-of-centre retail parks
which are likely to be delivered over the period to 2026. These commitments include:
• Watermark West Quay, Southampton City Centre (c.18,340 sqm net);
• New auction building at 20-34 Northam Road, Southampton City Centre (c.786 sqm);
• Land at 26 Southampton Road, Eastleigh Town Centre (c.111 sqm net); and
• Installation of a mezzanine floor within the Pets at Home unit, Winchester Road (OOC)
10.19 The combined floorspace of commitments in Southampton city centre is 19,126 per sqm.
As set out in Table 22, Appendix 6, we estimate that these in-centre commitments could
potentially generate a turnover in the region of £118.9m by 2016. There is also a
commitment for a mezzanine floorspace in the existing Pets at Home unit on Winchester
Road which we estimate could turnover in the region of £0.7m by 2016.
10.20 In Eastleigh we estimate that the single commitment identified on Southampton Road
could generate a potential turnover in the region of £0.6m by 2016.
10.21 Table 10.1 below illustrates the baseline comparison goods capacity for Southampton and
Eastleigh. These figures are based on constant market share and take account of the
above commitments but do not take into account the utilisation of existing vacant
floorspace.
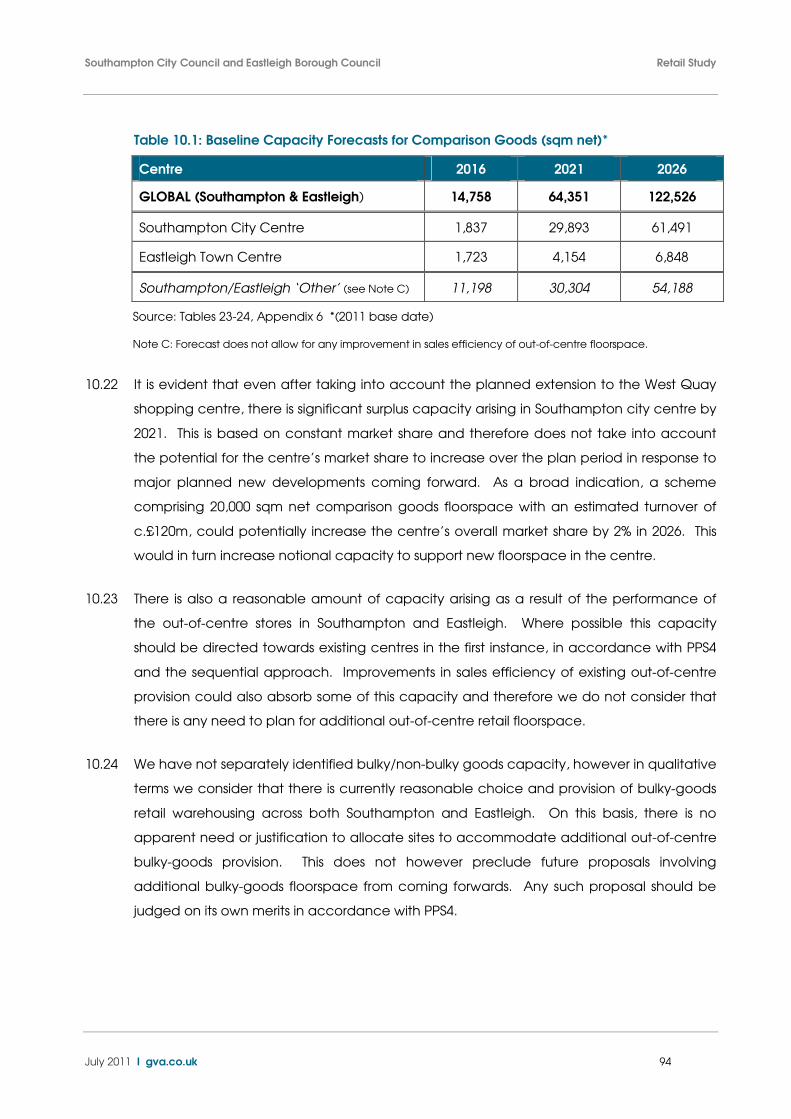
Southampton City Council and Eastleigh Borough Council Retail Study
July 2011 I gva.co.uk 94
Table 10.1: Baseline Capacity Forecasts for Comparison Goods (sqm net)*
Centre 2016 2021 2026
GLOBAL (Southampton & Eastleigh) 14,758 64,351 122,526
Southampton City Centre 1,837 29,893 61,491
Eastleigh Town Centre 1,723 4,154 6,848
Southampton/Eastleigh ‘Other’ (see Note C) 11,198 30,304 54,188
Source: Tables 23-24, Appendix 6 *(2011 base date)
Note C: Forecast does not allow for any improvement in sales efficiency of out-of-centre floorspace.
10.22 It is evident that even after taking into account the planned extension to the West Quay
shopping centre, there is significant surplus capacity arising in Southampton city centre by
2021. This is based on constant market share and therefore does not take into account
the potential for the centre’s market share to increase over the plan period in response to
major planned new developments coming forward. As a broad indication, a scheme
comprising 20,000 sqm net comparison goods floorspace with an estimated turnover of
c.£120m, could potentially increase the centre’s overall market share by 2% in 2026. This
would in turn increase notional capacity to support new floorspace in the centre.
10.23 There is also a reasonable amount of capacity arising as a result of the performance of
the out-of-centre stores in Southampton and Eastleigh. Where possible this capacity
should be directed towards existing centres in the first instance, in accordance with PPS4
and the sequential approach. Improvements in sales efficiency of existing out-of-centre
provision could also absorb some of this capacity and therefore we do not consider that
there is any need to plan for additional out-of-centre retail floorspace.
10.24 We have not separately identified bulky/non-bulky goods capacity, however in qualitative
terms we consider that there is currently reasonable choice and provision of bulky-goods
retail warehousing across both Southampton and Eastleigh. On this basis, there is no
apparent need or justification to allocate sites to accommodate additional out-of-centre
bulky-goods provision. This does not however preclude future proposals involving
additional bulky-goods floorspace from coming forwards. Any such proposal should be
judged on its own merits in accordance with PPS4.
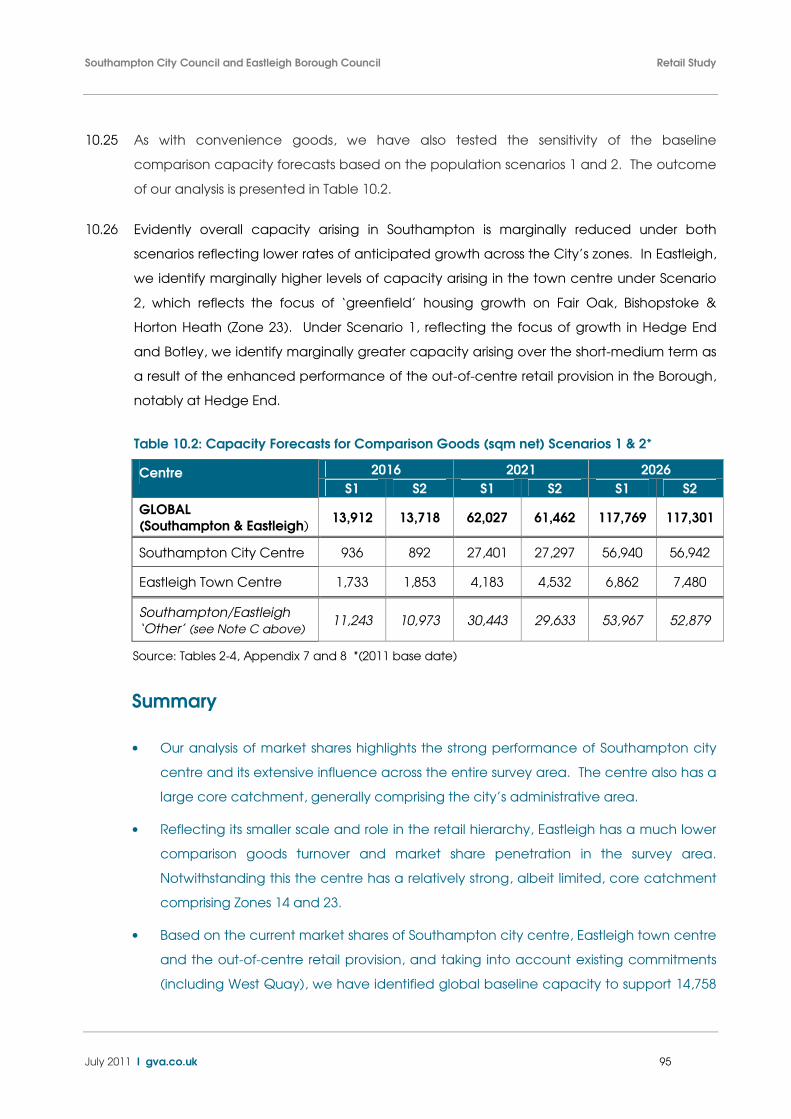
Southampton City Council and Eastleigh Borough Council Retail Study
July 2011 I gva.co.uk 95
10.25 As with convenience goods, we have also tested the sensitivity of the baseline
comparison capacity forecasts based on the population scenarios 1 and 2. The outcome
of our analysis is presented in Table 10.2.
10.26 Evidently overall capacity arising in Southampton is marginally reduced under both
scenarios reflecting lower rates of anticipated growth across the City’s zones. In Eastleigh,
we identify marginally higher levels of capacity arising in the town centre under Scenario
2, which reflects the focus of ‘greenfield’ housing growth on Fair Oak, Bishopstoke &
Horton Heath (Zone 23). Under Scenario 1, reflecting the focus of growth in Hedge End
and Botley, we identify marginally greater capacity arising over the short-medium term as
a result of the enhanced performance of the out-of-centre retail provision in the Borough,
notably at Hedge End.
Table 10.2: Capacity Forecasts for Comparison Goods (sqm net) Scenarios 1 & 2*
2016 2021 2026 Centre S1 S2 S1 S2 S1 S2
GLOBAL
(Southampton & Eastleigh) 13,912 13,718 62,027 61,462 117,769 117,301
Southampton City Centre 936 892 27,401 27,297 56,940 56,942
Eastleigh Town Centre 1,733 1,853 4,183 4,532 6,862 7,480
Southampton/Eastleigh
‘Other’ (see Note C above) 11,243 10,973 30,443 29,633 53,967 52,879
Source: Tables 2-4, Appendix 7 and 8 *(2011 base date)
Summary
• Our analysis of market shares highlights the strong performance of Southampton city
centre and its extensive influence across the entire survey area. The centre also has a
large core catchment, generally comprising the city’s administrative area.
• Reflecting its smaller scale and role in the retail hierarchy, Eastleigh has a much lower
comparison goods turnover and market share penetration in the survey area.
Notwithstanding this the centre has a relatively strong, albeit limited, core catchment
comprising Zones 14 and 23.
• Based on the current market shares of Southampton city centre, Eastleigh town centre
and the out-of-centre retail provision, and taking into account existing commitments
(including West Quay), we have identified global baseline capacity to support 14,758
Southampton City Council and Eastleigh Borough Council Retail Study
July 2011 I gva.co.uk 96
sqm net additional comparison floorspace by 2016. We project this will increase to
approximately 122,526 sqm net by 2026 which is a significant level of capacity.
• Overall capacity in Southampton is reduced under population Scenarios 1 and 2
reflecting the lower population growth rates applied. However, for Eastleigh town
centre there is greater capacity arising under Scenario 2, reflecting the focus of
population growth in Zone 23. Conversely, under Scenario 1, the consequence of
population growth around Hedge End and Botley has the effect of strengthening the
performance of out-of-centre retail provision, notably at Hedge End.
Southampton City Council and Eastleigh Borough Council Retail Study
July 2011 I gva.co.uk 97
11. Conclusions & Recommendations
11.1 The main objective of this Study is to provide up-to-date evidence that will support and
underpin the Councils’ Local Development Framework to the standard required by
National Policy. The information contained within this report will also be at the Councils’
disposal to assist in the future determination of relevant planning applications. This section
brings together the analysis of previous sections and sets out our conclusions and key
recommendations.
Policy Context
11.2 The Government’s key objectives, published in PPS4, require LPAs to set out a strategy for
the management and growth of centres over the plan period. Drawing on a sound
evidence base, LPAs should identify the need for new floorspace and, where necessary,
identify sites to accommodate identified need focussing on existing centres and areas of
deprivation. Effective centre strategies should be prepared to bring forward new
investment whilst maintaining and enhancing the vitality and viability of the existing
network of centres. Any planned extensions to centres should be carefully integrated with
the existing centre in terms of design.
11.3 At the local level, Southampton’s adopted Core Strategy supports the growth of
Southampton city centre to create ‘a vibrant, high quality regional city centre that is the
focus for major retail; tourism; leisure; cultural and office investment’. The Council’s
strategy therefore seeks to focus major development within the defined city centre and
indicates that development within this area will be informed by a City Centre Action Plan
(CCAP). The need for new retail floorspace, based on previous retail studies, is set out in
Policy CS1 as a broad guideline to indicate the quantum and phasing of new
development to be planned for through the CCAP. This Study provides an updated
position on need and capacity for additional retail provision in the city centre.
11.4 Outside the city centre, the strategy seeks to maintain the health of the network of town
and district centres with specific priorities to improve the range of facilities at Lordshill and
to ensure that the Centenary Quay redevelopment complements and enhances
Woolston. The strategy seeks to protect existing centres by controlling retail development
on the edge of centres and in out-of-centre locations.
Southampton City Council and Eastleigh Borough Council Retail Study
July 2011 I gva.co.uk 98
11.5 The adopted Eastleigh Local Plan Review defines the policy objectives for shopping and
the defined network of centres across Eastleigh. The policies in this Plan are increasingly
out-of-date and certain development priorities have now been fulfilled. The Council’s LDF
will replace the Local Plan review as the relevant policy framework to effectively manage
anticipated growth and change over the plan period. The purpose of this Study is to
provide the Council with the evidence base to inform appropriate policy
recommendations for Eastleigh to take forward through their LDF in order to meet the
policy requirements of PPS4.
Southampton City Centre
i) Sub-regional positioning
11.6 Southampton is clearly the most dominant centre in the survey area, with a current market
share of 33%. Relative to other competing centres in the wider sub-region Southampton
performs very well in terms of the scale and quality of its retail offer, rents and rank position.
Southampton’s closest competitor is Portsmouth, although the centre only captures a
relatively modest market share of 9% from the survey area.
ii) Current performance
11.7 Southampton is currently performing very well in relation to a number of the PPS4 town
centre health check indicators although there is still considered scope for the centre to
further improve its overall offer to ensure it maintains and enhances its city regional status.
11.8 The city centre has already benefitted significantly from the development of the West
Quay shopping centre which opened in 2000. The shopping centre provides high quality
retail and leisure units and is almost entirely let. Anchored by John Lewis, the shopping
centre currently accommodates a number of high-mid range comparison retailers. The
comparison-dominated retail offer is complemented by several restaurants and cafes in a
dedicated leisure quarter on the 3rd floor. West Quay offers good linkages with the retail
parks and Ikea located to the west of the centre and is well-integrated with Above Bar
Street which accommodates a broader range of retail and service provision.
11.9 In contrast to its comparison shopping function, the centre has a more limited
convenience shopping function. There is currently one main foodstore: the Asda at the
Marlands Shopping Centre, which is relatively dated and poorly configured by modern
Southampton City Council and Eastleigh Borough Council Retail Study
July 2011 I gva.co.uk 99
standards. Other provision in the centre is generally small-scale and orientated towards
serving local top-up food shopping needs.
11.10 Outside of West Quay, Southampton has a relatively high number of vacant units, notably
clustered in problem areas such as Bargates and East Street shopping centres. These
areas are recognised in the CCAP Issues and Options Paper (2007) as potential
development opportunity sites which could facilitate enhance and enlarged retail
provision or, in the case of East Street shopping centre, give way to a mix of
complementary retail, hotel, office and residential uses.
11.11 Despite the recent economic difficulties, prime rents and yields in Southampton city
centre have remained strong. The number of registered retail requirements in the centre
has fallen, although this may be partly attributed to the effects of the recession which has
affected demand across the UK and is not an issue solely isolated to Southampton.
11.12 Over the LDF period Southampton has a significant opportunity to enhance and broaden
its overall shopping offer. The adopted Core Strategy and CCAP Issues and Option Paper
identify scope to expand the existing primary shopping area into the Major Development
Quarter (MDQ) to the south and west of the current shopping area. This will have to be
carefully managed to ensure that current problems areas at Bargate and East Street
shopping centres are carefully planned for and managed to respond to the shift in focus
further west.
iii) Quantitative Capacity Forecasts
11.13 Based on the performance of existing and committed retail floorspace in the city centre
and taking into account projected baseline population and expenditure growth, we have
identified limited capacity to support 53 sqm net additional convenience goods
floorspace by 2016; increasing to 339 sqm net by 2021; and 630 sqm net by 2026.
11.14 This is, to a degree, reflective of a qualitative deficiency in existing main foodstore
provision in the city centre which is limited the Asda at the Marlands Shopping Centre. As
previously highlighted the store is somewhat dated by modern standards and is not fully
meeting the main-food shopping needs of its catchment. Furthermore, our analysis
indicates that the Asda and other smaller stores in the centre are not performing well,
although we acknowledge that the household survey is likely to have underestimated the
overall performance of these stores in terms of basket/top-up food shopping. Other
Southampton City Council and Eastleigh Borough Council Retail Study
July 2011 I gva.co.uk 100
factors such as workforce and visitor spend are also likely to contribute to the overall
turnover of these stores, which will not have been picked up by the household survey.
11.15 Given identified deficiencies in provision, we consider there is a qualitative argument to
improve the city centre’s foodstore offer and increase its overall convenience goods
market share. This would, in turn, increase notional capacity to support new convenience
floorspace in the centre. We have not undertaken a detail assessment of trade-draw and
impact. However, our broad analysis indicates that there is scope, over and above new
foodstores in Portswood and Woolston, for the redistribution of market shares to support
new foodstore provision in the city centre without undermining the performance of
convenience stores in the wider network of centres.
11.16 There are opportunities for new foodstores to come forward on sites within the defined PSA
which would be appropriate for retail development. The introduction of new foodstore
provision would improve choice and competition in the city centre to the benefit of the
centre’s resident catchment. We cannot rule out the future prospect of the existing Asda
store being adversely affected by increased competition. However, competition is not in
itself a planning issue and any impact on Asda would most likely be offset by the positive
benefits of such development within the PSA. In the long term, given the potential for the
city centre to increase its market share, there is likely to be a need for more foodstore
provision overall in the city centre than at present.
11.17 In the case of comparison goods, we project baseline capacity to support 1,837 sqm net
additional floorspace by 2016; increasing to 29,893 sqm net by 2021; and 61,491 sqm net
(81,988 sqm gross) by 2026. This is a significant level of capacity over the longer-term and
reflects the strong performance of existing provision in the city centre.
11.18 There is evident capacity in quantitative terms to support additional retail floorspace in the
city centre in line with the objectives of the Core Strategy. Our forecasts take into
account the planned extension to the West Quay shopping centre, and the capacity
identified above is therefore over and above this development. Our forecasts do not
however take into account any uplift in market share which may occur as a result of such
a major scheme coming to fruition, which could, in turn, further increase capacity.
11.19 Our forecasts for the overall plan period (to 2026) fall short of the comparison retail
floorspace planned for in the Core Strategy (130,000 sqm gross). However, on a like for like
basis the difference is significantly smaller (taking account of Ikea and Watermark West

Southampton City Council and Eastleigh Borough Council Retail Study
July 2011 I gva.co.uk 101
Quay). The remaining differences are due to the more conservative expenditure growth
rates applied and other factors (e.g. internet, population etc).
11.20 Overall, our findings support and reaffirm the Council’s strategy to plan for major new
retail development in the city centre over the plan period. In accordance with PPS4, the
Council should identify an appropriate range of sites to accommodate the identified
need.
iv) Development Strategy
11.21 The Council has already begun to explore the potential of sites located in the defined city
centre to accommodate additional retail floorspace. The adopted Core Strategy sets out
broad guidelines as to how much additional comparison retail floorspace can be
accommodated within the existing PSA (c.36,292 sqm gross) and, based on previous
capacity forecasts, the quantum of comparison floorspace which will be provided outside
the PSA.
11.22 Based on our baseline forecasts and, assuming that it remains a viable possibility to deliver
c.36,292 sqm gross (including the extension to West Quay) within the existing PSA, we
identify a surplus need of c.70,586 sqm gross floorspace which, subject to new sites
coming forward in the PSA, may need to be delivered outside the PSA23. The Council will
need to keep this under review. However, given the extent of this surplus requirement, it is
considered a justified approach to plan for an appropriate expansion to the existing PSA
to accommodate identified need.
11.23 The current strategy identifies the Major Development Quarter (MDQ) located to the south
and east of the existing West Quay shopping centre as an opportunity for city centre
expansion. The Council recognises that the first priority for this area should be to provide
the retail space which cannot be delivered within the existing PSA. Sites allocated for
additional retail floorspace in this area should be located close to the existing PSA to
ensure integration with the existing centre.
23 To avoid double counting the extension to West Quay is not taken into account as a commitment.
Southampton City Council and Eastleigh Borough Council Retail Study
July 2011 I gva.co.uk 102
11.24 The Council should also give consideration to the phasing of new development and
where necessary, justify the need for any additional retail floorspace to be delivered in the
MDQ, in advance of allocated sites located within the PSA. Where for example, sites
located within the PSA are constrained and unlikely to come forward in the short-term.
11.25 In our view, it is likely that the new modern retail development in the MDQ will result in a
displacement of activity further west. This will have a degree of impact on the existing
shopping area, particularly those areas which are already experiencing problems e.g.
Bargate and East Street shopping centres. It may be appropriate, subject to viability, to
strengthen these areas in advance of major expansion into the MDQ which would help to
offset overall impact.
Southampton West (Lordshill, Shirley & Portswood)
11.26 The Southampton West sub-area comprises Shirley town centre (Zone 3) and the district
centres of Lordshill (Zone 7) and Portswood (Zone 4). These centres each benefit from a
large foodstore anchor, (Sainsbury’s in Lordshill and Shirley; and Waitrose in Portswood)
amongst other smaller-scale provision. Sainsbury’s also have a proposal for a new store in
Portswood which has been taken into account as a commitment in our capacity
forecasts.
11.27 These centres are currently performing particularly well in terms of their convenience
goods trade draw from across the western part of Southampton and parts of lower Test
Valley (Zones 1-8). There is some overlap between catchments, notably between Shirley
and Lordshill, which both serve the convenience shopping needs of those living within
Zone 5.
11.28 Based on current trade draw patterns, these centres generate a combine turnover of
£138.1m, which equates to 7% market share across the survey area. Taking into account
the performance of existing floorspace and the proposed new superstore on the edge or
Portswood, as well as projected growth in population and expenditure, we have not
identified any quantitative capacity for additional convenience retail floorspace in these
centres over the plan period in our baseline scenario. This is not to say that there may not
be potential for the redevelopment of existing stores e.g. Sainsbury’s, Lordshill.
11.29 Whilst we have identified a notional oversupply of floorspace for the remainder of the plan
period to 2026, this does not take into account any potential for Portswood to increase its
Southampton City Council and Eastleigh Borough Council Retail Study
July 2011 I gva.co.uk 103
market share through claw back following the development of the new Sainsbury’s
foodstore on the former bus depot towards the north of the centre.
11.30 In reality, there is likely to be a degree of trade diversion from existing convenience goods
provision in Portswood (e.g. Waitrose) which we have found to be significantly
overtrading. This in itself would tend to suggest that there is a qualitative need for
additional foodstore provision in the area. There is also reasonable scope for the new
store to claw back of trade currently drawn to out-of-centre stores, (notably Asda,
Bournemouth Road; Tesco Tebourba Way; and Tesco Bursledon) which is consistent with
the core objectives of PPS4.
11.31 Given the need for redistribution of capacity from out-of-centre stores to existing centres,
we would advise the Councils to continue to resist where possible, the development of
further out-of-centre convenience retail floorspace.
11.32 Whilst it is not within the scope of this study to assess specific proposals, we understand
that there is a Certificate of Lawfulness which allows the installation of a 1,957 sqm gross
mezzanine floor in the Tesco at Tebourba Way and it is possible that Tesco may seek to
exchange this for an extension to the store. In our view it is likely that any additional
floorspace will be used predominantly for the sale of non-food goods. However, if Tesco
do wish to extend the store it will be necessary for the applicant to satisfy the relevant tests
in PPS4 and demonstrate that it will not lead to any significant adverse impacts on existing
centres or recent permissions (e.g. Sainsbury’s, Portswood).
Southampton East (Bitterne & Woolston)
11.33 The Southampton East sub-area comprises the district centres of Bitterne (Zone 15) and
Woolston (Zone 7).
11.34 Bitterne is the larger centre of the two and benefits from a Sainsbury’s anchor foodstore
alongside other smaller scale convenience goods provision such as Iceland. Woolston is
the smallest distinct centre in Southampton and its convenience retail offer currently
comprises two Co-op convenience stores. The centre is however; set to benefit from the
residential-led mixed use development of Centenary Quay, which includes a new 2,574
sqm net foodstore. This has been taken into account as a commitment in our capacity
forecasts for the sub-area.
Southampton City Council and Eastleigh Borough Council Retail Study
July 2011 I gva.co.uk 104
11.35 Based on current trade draw patterns, these centres generate a combine turnover of
£50.6m, which equates to 2% market share across the survey area. Taking into account
the performance of existing floorspace and the proposed new superstore on the edge or
Woolston, as well as projected growth in population and expenditure, we have not
identified any quantitative capacity for additional convenience retail floorspace in these
centres over the plan period in our baseline scenario.
11.36 Whilst we have identified a notional oversupply of floorspace for the remainder of the plan
period to 2026, this does not take into account any potential for Woolston to increase its
market share through claw back following the development of the new foodstore on the
former Vosper site towards the edge of the centre. As with Portswood, whilst there is likely
to be a degree of trade diversion from existing convenience goods provision in centre
(e.g. Co-op) there is also reasonable scope for the new store to claw back trade currently
drawn to out-of-centre stores, notably the Tesco Bursledon and Sainsbury’s, Tollbar Way.
11.37 Given the need for redistribution of capacity from out-of-centre stores to existing centres,
we would advice the Councils to continue to resist where possible, the development of
further out-of-centre convenience retail floorspace.
Eastleigh Town Centre
i) Sub-regional positioning
11.38 We estimate the Eastleigh currently achieves a market share of 3% from the survey area.
As we would expect this is significantly lower than Southampton which achieves a market
share of 33%, reflecting its higher-order shopping function and sub-regional city centre
status.
11.39 As well as Southampton, Eastleigh is also affected by the proximity of other higher-order
competing centres such as Winchester. As both Southampton and Winchester expand
their retail offer and strengthen their role, Eastleigh will face increased competition. It will
therefore be important for Eastleigh to seek to enhance its own retail offer in order to at
least maintain current market share. In a ‘do-nothing’ scenario, there is a risk that the
town’s catchment and market share will be further eroded by growing competition.
Southampton City Council and Eastleigh Borough Council Retail Study
July 2011 I gva.co.uk 105
ii) Current performance
11.40 Our analysis of Eastleigh indicates that, at present, Eastleigh town centre is currently
performing reasonably well in relation to a number of the PPS4 health check indicators.
The centre offers a relatively good mix of retail and services uses which is considered
consistent with a town of its scale and function. There is also a good mix of multiple and
independent retailers which adds to the overall diversity of the centre’s offer.
11.41 The centre has a good convenience shopping offer largely attributed to the Sainsbury’s
on Leigh Road and the Tesco Metro in the Swan Shopping Centre. Both stores are
currently trading well and are considered key attractors to the town centre. The
positioning of the stores, either end of the main shopping streets, also supports the
propensity for linked trips.
11.42 Whilst the centre’s overall vacancy rate is marginally above the national average, there
are no obvious concentrations of vacant units which detract form the centre or pose a
potential development opportunity. Our analysis indicates that the majority of available
units are generally small in scale are unlikely to be suitable to accommodate modern
comparison retailer requirements.
11.43 There are also some vacant units in the new leisure development, which offer larger more
modern accommodation. The fact that these units have yet to be occupied, would
suggest that market demand for floorspace in Eastleigh is currently low. This is consistent
with the few retailer requirements identified for the centre.
11.44 There are aspirations to further enhance retail provision in the town centre and the
potential opportunity for retail development to the east of the town centre on the Barton
Park site has previously been explored. Based on the strength of competing centres in the
wider sub-region and from out-of-centre provision, it will be important for the Council to be
proactive in strengthening Eastleigh’s role in order to at least maintain current market
share, if not enhance it. How this may best be achieved is discussed in more detail below.
iii) Quantitative Capacity Forecasts
11.45 Based on the performance of existing and committed retail floorspace in the town centre
and taking into account projected baseline population and expenditure growth, we have
identified capacity to support 243 sqm net additional convenience goods floorspace by
2016; increasing to 516 sqm net by 2021; and 787 sqm net by 2026. This is a relatively
Southampton City Council and Eastleigh Borough Council Retail Study
July 2011 I gva.co.uk 106
modest level of capacity which does not suggest any need for further substantial
convenience goods provision in the town centre over the plan period. Instead this need is
likely to be met through small-scale provision in the centre or extensions to existing stores.
11.46 In the case of comparison goods, we project baseline capacity to support 1,723 sqm net
additional floorspace by 2016; increasing to 4,154 sqm net by 2021; and 6,848 sqm net by
2026. This is a reasonable level of capacity arising over the plan period and the Council
should be proactive in planning for and identifying sites to meet this need in accordance
with PPS4
iv) Development Strategy
11.47 Eastleigh town centre is relatively constrained in terms of expansion and existing vacant
units are not considered sufficient in terms of scale or quality to accommodate the level of
identified need. Opportunities for the redevelopment of existing units along Market Street
and High Street are likely to be constrained by the complexities of multiple-ownership
which will inhibit land assembly. PPS4 encourages local authorities to make full use of
planning tools to facilitate development, including CPO. However, in order to achieve
this, the Council would need to demonstrate that a scheme is viable and deliverable,
particularly in the case of attracting and securing new comparison retailers to the town
centre.
11.48 In reality, we consider there is likely to be limited scope for significant comparison retail
development within the town centre. However, there may be an opportunity for further
comparison floorspace to be provided as part of an extension to or redevelopment of
existing foodstores in the centre.
11.49 We understand from the Council that Tesco has previously turned down an opportunity to
extend its store in the Swan Centre. On this basis, it cannot be relied upon for such an
extension to be planned for over the plan period. However, there may be an opportunity
to extend or redevelop the Sainsbury’s store to accommodate some of the identified
capacity for both convenience and comparison goods floorspace. Such development
would help strengthen the store’s attraction as a key anchor and could potentially claw
back trade currently leaking to out-of-centre stores in the area e.g. Asda, Bournemouth
Road. Such claw back could, through increased propensity for linked trips, also deliver
additional benefits to the rest of the town centre.
Southampton City Council and Eastleigh Borough Council Retail Study
July 2011 I gva.co.uk 107
11.50 As highlighted above, the Council have previously examined the implications of new retail
development to the east of the town centre on the Barton Park site. In proximity terms,
part of the site could be defined as being ‘edge-of-centre’. However, the site lacks
integration with the town centre, being physically separated by the railway line, and
would require a new, convenient pedestrian route across the railway line to be able to
support any propensity for linked trips. In this respect it is a lower priority than
redevelopment of the existing town centre foodstores.
11.51 Consistent with the findings of the Eastleigh Retail Study Update (2008) we would strongly
caution against the development of purely comparison retail floorspace on the Barton
Park site as this has potential to displace the current focus of activity and could result in a
significant impact on the existing shopping area in the town centre. An alternative option,
which was also assessed by the 2008 Study, is for the re-location of either one of the
existing foodstores to a new store on the Barton Park site. This would, in turn, release
floorspace in the town centre that could be used to accommodate the identified need
for additional comparison retail floorspace. However, it would also weaken the town
centre by displacing an important anchor to a less central location.
11.52 In accordance with PPS4, the Council should be pro-active in their approach to
accommodate new retail floorspace within the town centre before less central sites are
considered. As highlighted above, there are realistic opportunities to accommodate new
retail development within the town centre which should be thoroughly examined in the
first instance, before less central sites e.g. Barton Park are considered. Only if town centre
redevelopment is demonstrated not to be financially viable, or not practicable for other
reasons, should new retail development be pursued at Barton Park.
11.53 Given the existing vulnerabilities of the town centre and competition faced by competing
centres and out-of-centre provision the Council should consider carefully proposals for
additional out-of-centre retail provision which could potentially undermine the vitality and
viability of the town centre. In terms of bulky-goods, we have not identified any apparent
need for additional bulky-goods provision. However this does not preclude future
proposals involving additional bulky-goods floorspace from coming forwards. Any such
proposal should be judged on its own merits in accordance with PPS4.
Southampton City Council and Eastleigh Borough Council Retail Study
July 2011 I gva.co.uk 108
Eastleigh North (Fryern Centre, Chandler’s Ford)
11.54 The Eastleigh North sub-area comprises the Fryern Centre, Chandler’s Ford district centre.
11.55 The Fryern Centre is a small shopping precinct situated on Bournemouth Road and
includes a Co-op convenience store. Opposite the precinct, a short walk down
Oakmount Road there is also a Waitrose supermarket which anchors the centre and
reinforces its overall convenience goods provision.
11.56 Based on current trade draw patterns, the centre’s convenience stores generate a
combined turnover of £29.56m, which equates to 1% market share across the survey area.
Taking into account the performance of existing floorspace and projected growth in
population and expenditure, we have identified notional capacity to support 117 sqm net
additional convenience goods floorspace by 2016; increasing to 265 sqm net by 2021;
and to 401 sqm net by 2026.
11.57 This is a relatively modest level of surplus capacity which may largely be attributed to the
strong performance of the Co-op store and to a lesser extent to the Waitrose which is
marginally under trading relative to its company average. Based on current trade-draw
patterns and potential for enhanced convenience foodstore provision, this capacity
could be redirected towards Eastleigh town centre through claw back of trade from
Eastleigh’s core catchment (Zone 14).
Eastleigh South (Hedge End)
11.58 The Eastleigh North sub-area comprises Hedge End district centre which is situated
towards the south of the Borough on the junction between Northam Road and St John’s
Road. The centre is anchored by a Co-op convenience store alongside other small-scale
convenience goods provision. Based on our analysis of the survey results the centre is
predominantly performing a local, top-up food shopping function.
11.59 Based on current trade draw patterns, the centre’s convenience stores generate a
combined turnover of £15.8m, which equates to 1% market share across the survey area.
Taking into account the performance of existing floorspace and projected growth in
population and expenditure, we have identified notional capacity to support 42 sqm net
additional convenience goods floorspace by 2016; increasing to 105 sqm net by 2021;
and to 117 sqm net by 2026.
Southampton City Council and Eastleigh Borough Council Retail Study
July 2011 I gva.co.uk 109
11.60 Again, this is a relatively modest level of surplus capacity which may largely be attributed
to the strong performance of the Co-op store which is performing well above
expectations. We would expect this capacity to be met by small-scale extensions to
existing provision or changes of use within the existing centre as opposed to the Council
planning for any new, purpose-built development.