Embed Size (px)
Citation preview
South Australian Electricity Report
November 2019
South Australian Advisory Functions

Important notice
PURPOSE
The purpose of this publication is to provide information to the South Australian Minister for Energy and
Mining about South Australia’s electricity supply and demand. While some historical price information is
provided for completeness, this publication does not present any views on the effectiveness of price signals in
the National Electricity Market.
AEMO publishes this South Australian Electricity Report in accordance with its additional advisory functions
under section 50B of the National Electricity Law. This publication is based on information available to AEMO
as at 14 November 2019, although AEMO has endeavoured to incorporate more recent information where
practical.
DISCLAIMER
AEMO has made every effort to ensure the quality of the information in this publication but cannot guarantee
that information, forecasts and assumptions are accurate, complete or appropriate for individual
circumstances. This publication does not include all the information that an investor, participant or potential
participant in the National Electricity Market might require and does not amount to a recommendation of any
investment.
Anyone proposing to use the information in this publication (including information and reports provided by
third parties) should independently verify and check its accuracy, completeness and suitability for that
purpose, and obtain independent and specific advice from appropriate experts.
Accordingly, to the maximum extent permitted by law, AEMO and its officers, employees and consultants
involved in the preparation of this document:
• make no representation or warranty, express or implied, as to the currency, accuracy, reliability or
completeness of the information in this document; and
• are not liable (whether by reason of negligence or otherwise) for any statements or representations in this
document, or any omissions from it, or for any use or reliance on the information in it.
© 2019 Australian Energy Market Operator Limited. The material in this publication may be used in
accordance with the copyright permissions on AEMO’s website.

© AEMO 2019 | South Australian Electricity Report 3
Executive summary
The changing energy landscape is continuing to have a profound impact in South Australia, with several
records broken in the last 18 months, and grid demand becoming increasingly variable:
• Distributed energy resources (DER), predominantly rooftop photovoltaics (PV), now represent over
10% of total South Australian electricity generation. Approximately 34% of South Australian dwellings
now have rooftop PV systems installed, which is the equal highest level of penetration in Australia
(shared with Queensland).
• With the growth in rooftop PV, minimum operational demand (from the grid) is now occurring on
sunny, low demand days (typically weekends). In 2018-19, a record low minimum operational demand
(sent-out1) for South Australia of 583 megawatts (MW) was observed on 21 October 2018. (This record
has since been broken several times during 2019-20, most recently on Sunday 10 November 2019,
when a new record low minimum operational demand of 446 MW sent-out was set.)
• On 24 January 2019, a number of temperature records were set across South Australia and operational
demand soared to 3,140 megawatts (MW) sent-out, a level not seen since 2011.
• Record high winter operational demand of 2,489 MW sent-out was experienced on 24 June 2019,
following three days of cold weather.
• The time-weighted average price for the financial year reached $109.80/megawatt hour (MWh) in
South Australia, the highest on record, with Victorian pricing dynamics strongly influencing South
Australia’s outcomes.
• The Virtual Power Plant (VPP) Demonstrations were successfully launched in July 2019, with South
Australia VPP (SA VPP), controlled by Energy Locals and Tesla, being the first participant. These VPP
Demonstrations will provide AEMO with data showing how household batteries can successfully be
used, in aggregate, to support system security through frequency control ancillary services (FCAS). The
SA VPP is targeting 50,000 installations to establish itself as the largest VPP in the world, and the
South Australian Government is also supporting the installation of 40,000 residential batteries through
a Home Battery Scheme.
• The first three large-scale solar plants in South Australia commenced operation, with total combined
installed capacity of 378 MW.
• Barker Inlet, the first natural gas reciprocating engine power station in South Australia, commenced
operation in November 2019. Using modern technology, this power station can provide rapid
response to changes in demand or supply.
As highlighted in AEMO’s Renewable Integration Study phase 1 report2, South Australia has experienced
some of the highest instantaneous penetrations of wind and solar generation in the world, second only to
Denmark. South Australia operates under more challenging conditions than Denmark given its
substantially lower level of interconnection, and the state experiences the lowest proportional minimum
demand of the power systems worldwide that were assessed in the study.
These records and extremes reflect the increasing supply and demand variability that is being actively
managed by AEMO operationally and studied for planning purposes to maintain a reliable and secure
power system now and in the future.
1 Estimated value, based on actual operational demand as-generated, less estimated auxiliary loads.
2 AEMO, Renewable Integration Study, July 2019, at https://www.aemo.com.au/Electricity/National-Electricity-Market-NEM/Security-and-reliability/Future-
Energy-Systems/Renewable-Integration-Study.

© AEMO 2019 | South Australian Electricity Report 4
The impact of active consumers and growing DER
• Consumers continue to increase their adoption of behind-the-meter rooftop PV and storage, with
151 MW of rooftop PV installed in 2018-19. By July 2019, rooftop PV capacity was 1,078 MW (16.3 %
increase on the previous year) and battery systems reached 34 MW (126 % increase). Rooftop PV
contributed 1,374 gigawatt hours (GWh) in 2018-19.
• These consumer choices, combined with energy efficiency savings, kept annual operational
consumption in South Australia flat at 12,147 GWh in 2018-19, despite underlying population growth. It is
expected to stay at a similar level for the next 10 years.
• Rooftop PV contributed 50 MW more at the underlying peak3 in 2018-19 than had been forecast the
previous year, delivering 433 MW at the time of peak (5:00 pm Adelaide time) and keeping the time of
peak grid demand to 7:30 pm Adelaide time. Now that maximum grid demand has moved into the
evening, after the sun has set, future rooftop PV installations are unlikely to further reduce the operational
peak grid demand unless combined with energy storage.
• High and growing rooftop PV penetration is reducing minimum operational demand4, with forecast
minimum demand approaching zero by 2024-25 in some scenarios5. Minimum demand continues to
occur in the middle of the day, typically at the weekend or on public holidays. A record low operational
minimum demand (sent-out) of 446 MW was recorded on Sunday 10 November 2019 at 2:00 pm
Adelaide time.
• Initiatives to further build and integrate DER into the system and market in South Australia include:
– South Australian Government policy supporting the installation of 40,000 residential batteries (through
a Home Battery Scheme) which will be capable of enrolling in VPP aggregations.
– The SA VPP6, in which Energy Locals and Tesla (with support from the South Australian Government)
seek to establish the world’s largest VPP across 50,000 homes.
– The VPP Demonstrations, allowing VPPs to test a new specification to deliver FCAS, and progressing
regulatory changes to facilitate VPP integration into the National Electricity Market (NEM) at scale.
– Australian Renewable Energy Agency (ARENA)/AEMO trial to explore a strategic reserve model
(referencing international market designs) for reliability or emergency demand response7.
Supply changes and impacts on exports, emissions, and prices
• Generation8 in South Australia increased 2.9% in 2018-19 to 14,503 GWh, with almost half supplied from
gas-powered generation (GPG). South Australia increased its role as a net exporter of energy in
2018-19. Compared to 2017-18, total exports remained relatively steady, but 24% less generation was
imported from Victoria.
• Generation capacity in South Australia increased 12.2% in 2018-19 (by 770 MW) to 7,066 MW (including
1,078 MW of rooftop PV capacity).
• Expected closure years of Torrens Island Power Station A (TIPS A) (480 MW, closing between 2020 and
2021) and Osborne Power Station (172 MW, closing in 2023-24)9 have been reported to AEMO as part of
the new three-year notice of closure rule change.
3 Total demand from consumers, whether met from the grid or from their own generation or storage behind the meter.
4 Operational demand is electricity supplied to consumers via the grid, by local scheduled generation, semi-scheduled generation, and non-scheduled
wind/solar generation of at least 30 MW aggregate capacity, and by imports, excluding the demand of local scheduled loads.
5 AEMO’s forecasts in this year’s publications are based on a range of plausible scenarios and sensitivities, explained in the body of this report.
6 The SA VPP has recently reached a milestone of 1,100 homes. See https://virtualpowerplant.sa.gov.au/.
7 See https://www.aemo.com.au/Electricity/National-Electricity-Market-NEM/DER-program/Pilots-and-Trials.
8 From registered generators, plus small non-scheduled generation and rooftop PV installed estimates.
9 Information provided by the operator, current at August 2019, is in the 8 August 2019 update at https://aemo.com.au/Electricity/National-Electricity-
Market-NEM/Planning-and-forecasting/Generation-information.

© AEMO 2019 | South Australian Electricity Report 5
• By the end of October 2019, announced energy generation developments in South Australia totalled
10,773 MW across 65 projects. AEMO classifies about 107 MW of this as committed for development10.
Wind, solar, and battery/VPP projects comprise the majority of new investment interest.
• Given the penetration of renewable generation, there will be increasing need for technologies that can
complement the generation’s natural variability by providing rapid start capabilities and a high level of
operational flexibility. Barker Inlet Power Station is an example of this capability, with maximum
operation achievable within five minutes at a higher level of efficiency than the pre-existing GPG fleet. This
unit commenced operation in November 2019 and will replace the ageing TIPS A.
• Decreased GPG operation meant emissions were lower in 2018-19 than the year before. The growth in
wind generation led to lower overall average emissions intensity11.
• Interconnection developments include the proposed EnergyConnect interconnector to New South Wales
(now being considered by the Australian Energy Regulator (AER), with a decision expected by end 2019)12.
• Highest prices on record in 2018-19, with time-weighted average prices 12% higher than in 2017-18 due
to high gas prices and higher coal-fired generator offers in other regions. FCAS prices were lower, with
suppliers like the Hornsdale Power Reserve (HPR) battery system in the market, and increased FCAS
provision from TIPS A.
Actions to maintain reliability and security
• AEMO forecasts tightly balanced supply and demand in the next five years across South Australia and
Victoria.
– AEMO identified additional reserves which could be made available through the Reliability and
Emergency Reserve Trader (RERT) function to ensure that reliability of supply meets the reliability
standard in Victoria this summer. The operation of all TIPS A this summer will further reduce the risk of
unserved energy (USE)13 identified in the 2019 Electricity Statement of Opportunities (ESOO) 14.
– Beyond this summer, only slight improvements in reliability are forecast for peak summer periods until
new transmission and dispatchable supply and demand resources become available. Over the next four
years, forecast USE for South Australia is within the reliability standard15. The announced staggered
closure of TIPS A from 2020 will reduce available capacity in South Australia, causing a slow increase in
expected USE to 0.0004% by 2021-22.
– EnergyConnect would reduce this risk of USE by improving the sharing of resources across the NEM.
• As well as energy resources to meet demand, the power system also needs services to maintain system
strength16 and keep frequency and voltage within required limits. These system security services are
mainly supplied by synchronous generators, but when this generation is not online – such as at times of
low operational demand – alternative options are needed.
– AEMO can direct synchronous generators to stay online to maintain the system in a secure operating
state. Security directions increased substantially in the last year, with 153 issued (lasting 3,214 hours)
in South Australia during 2018-19 compared to 99 issued (lasting 1,912 hours) in 2017-18.
10 Commitment criteria (relating to site, components, planning, finance, and date) are outlined under the Background Information tab on AEMO’s Generation
Information Page, at http://www.aemo.com.au/Electricity/National-Electricity-Market-NEM/Planning-and-forecasting/Generation-information.
11 Emissions intensity refers to the average emissions associated with each unit of energy produced. An increase in total emissions can coincide with a larger
increase in total regional energy produced, resulting in a lower regional emissions intensity.
12 For more, see http://www.projectenergyconnect.com.au/ and https://www.electranet.com.au/projects/south-australian-energy-transformation/.
13 USE is energy that cannot be supplied to consumers, as a result of insufficient levels of generation capacity, demand response, or network capability, to
meet demand.
14 See http://www.aemo.com.au/Electricity/National-Electricity-Market-NEM/Planning-and-forecasting/NEM-Electricity-Statement-of-Opportunities.
15 USE is energy that cannot be supplied to consumers, as a result of insufficient levels of generation capacity, demand response, or network capability, to
meet demand. The reliability standard specifies that expected USE should not exceed 0.002% of total energy consumption in any NEM region in any
financial year.

© AEMO 2019 | South Australian Electricity Report 6
– During 2018-19, approximately 3.3% of South Australian wind output was curtailed due to system limits
being reached. This was an increase from the 2.4% of wind generation curtailed in 2017-18.
– Synchronous condensers, improved interconnection, and contingency frequency reserves from
renewable generation and large-scale battery storage, as well as fast-start and rapid-response
technologies, are all being progressed as more sustainable long-term options. For example, ElectraNet,
with support from AEMO, the AER, and the South Australian Government, has progressed a project for
four synchronous condensers to be installed to supply both system strength and inertia to the South
Australian region. The first two synchronous condensers will be installed at the Davenport substation in
mid-2020, and the second two will be installed at the Robertstown substation by the end of 2020. They
will be commissioned by early 202117.
• AEMO has commenced the Renewable Integration Study (RIS) to explore opportunities and risks for
maintaining the physical requirements of the power system while integrating variable inverter-based
renewable resources at increasing levels of penetration. This in-depth review will inform future ISPs as well
as providing foundational engineering advice to government and administrative policy-makers to support
their consideration of future changes needed in electricity regulations and market designs. AEMO’s first
publication reviewed how Australia compares with other leading international power systems18.
• Regulatory changes have recently been made or are under consideration to support system security
in South Australia and the wider NEM, including:
– Declaration of a new “protected event” by the Reliability Panel in June 2019, providing for management
of the risks associated with widespread generator failures during destructive wind conditions in South
Australia, to reduce the potential for cascading failures including islanding of South Australia and black
system events.
– Establishment of a register of DER by December 2019 to give AEMO visibility of DER and information
including its locations and trip settings.
– Amendments to Australian Standards to update technical performance standards and compliance
measures for DER devices19.
– AEMO’s rule change proposals to the Australian Energy Market Commission (AEMC) to mandate
primary frequency response from all capable scheduled and semi-scheduled generating units once
frequency moves outside a defined frequency deadband, as well as encouraging generators to provide
primary frequency response by removing a number of disincentives20.
– The AEMC’s review on mechanisms to enhance resilience in the power system, which is considering
new approaches to power system security contingency risk management, as well as expanding the
Power System Frequency Risk Review to risks broader than just frequency-related events.
– AEMO’s rule change proposal to improve the system restart framework to incentivise the provision of
both system restart and restoration support capabilities from a range of different technologies and to
facilitate more extensive testing to verify the viability of system restart paths.
– AEMO’s rule change proposal to more efficiently accommodate the participation of bi-directional
resources including storage facilities in the National Electricity Rules, which would support
improvements to central dispatch, reliability forecasting, technical requirements and performance
standards.
17 See https://www.electranet.com.au/what-we-do/projects/power-system-strength/.
18 See https://www.aemo.com.au/Electricity/National-Electricity-Market-NEM/Security-and-reliability/Future-Energy-Systems/Renewable-Integration-Study.
19 See https://www.aemo.com.au/Electricity/National-Electricity-Market-NEM/DER-program/Standards-and-Protocol.
20 Further information available on the AEMC website, at https://www.aemc.gov.au/rule-changes/primary-frequency-response-requirement.

© AEMO 2019 | South Australian Electricity Report 7
Contents Executive summary 3
1. Introduction 11
1.1 Purpose and scope 11
1.2 Information sources 11
1.3 Scenarios 12
2. Consumer behaviour – behind the meter 14
2.1 Rooftop photovoltaics (PV) 14
2.2 PV non-scheduled generation (PVNSG) 16
2.3 Battery storage 18
2.4 Electric vehicles 18
3. Operational consumption and demand 20
3.1 Historical and forecast consumption and demand 20
3.2 Daily demand profiles 28
4. Existing and committed supply 30
4.1 Historical capacity and generation 30
4.2 Historical generation 31
4.3 Historical typical day dispatch 34
4.4 Proposed changes to supply 35
4.5 Emissions intensity 36
5. Transmission interconnectors 38
5.1 Historical imports and exports 38
5.2 Progress of transmission upgrade projects 40
6. Electricity spot price 41
6.1 Historical wholesale electricity prices 41
6.2 Price volatility 42
6.3 Price setting outcomes 45
6.4 Impact of changes in generation mix 45
6.5 Frequency control ancillary services (FCAS) market price 47
7. Reliability and security of supply 50
7.1 Reliability and security with a changing generation mix 50
7.2 Managing reliability and security to date 52
7.3 Renewable Integration Study 58
7.4 Forecast power system reliability 62
7.5 Regulatory changes to improve reliability and security 64

© AEMO 2019 | South Australian Electricity Report 8
8. Future developments 67
8.1 Relating the Integrated System Plan to South Australia 67
8.2 Integration of Distributed Energy Resources (DER) 70
8.3 Additional supply developments 71
9. Gas supply for GPG 73
9.1 South Australian gas consumption forecasts 73
9.2 Natural gas reserves and resources, and infrastructure 74
A1. Data sources and reporting methodology 78
A1.1 Introduction 78
A1.2 Times and dates 78
A1.3 Prices 78
A1.5 Generation capacity 79
A1.6 Data sources for generation and supply 79
A1.7 Consumption and demand definitions 80
A1.8 Generator fuel grouping 80
A1.9 Solar PV estimates 81
A1.10 Interconnector flows 81
A2. Data spreadsheet index 82
A2.1 Tables 82
A2.2 Figures 83
Glossary, measures, and abbreviations 84
Tables Table 1 Information and data sources 11
Table 2 Rooftop PV contribution to underlying and operational maximum demand in South
Australia 22
Table 3 Estimated DSP by wholesale price levels and reliability response* for South
Australia 25
Table 4 South Australian registered capacity and local generation by energy source in
2018-19 30
Table 5 South Australian electricity supply by fuel type (GWh), comparing 2017-18 to 2018-
19 33
Table 6 Total South Australian wind generation and capacity 33
Table 7 Capacity of existing or withdrawn generation, and committed or proposed projects
(MW) at 14 November 2019 35

© AEMO 2019 | South Australian Electricity Report 9
Table 8 Scheduled, semi-scheduled, and significant non-scheduled generation available
capacity 36
Table 9 2018-19 time-weighted average prices for the NEM 41
Table 10 Thursday 24 January 2019, South Australia and Victoria RERT volume activated 52
Table 11 Costs associated with NEM wide RERT 2018-19 ($ million) 53
Table 12 AEMO/ARENA demand response trial product specifications 54
Table 13 Total number of directed hours from AEMO directions across the NEM 57
Table 14 Additional reserves required to reduce risk of major load shedding to a one-in-10
year event 63
Table 15 South Australian prospective generation projects by energy source, as at 14
November 2019 71
Table 16 Major gas pipelines relating to South Australia 76
Figures Figure 1 South Australian rooftop PV installed capacity forecasts to 2028-29 15
Figure 2 South Australian rooftop PV generation forecasts to 2028-29 16
Figure 3 South Australian PVNSG installed capacity forecasts 17
Figure 4 South Australian PVNSG generation forecasts 17
Figure 5 Annual operational consumption (sent-out) actual and forecast for South Australia 21
Figure 6 Forecast annual operational consumption (sent-out) with components (Central
scenario) 21
Figure 7 Summer operational maximum demand (sent-out) actual and forecast for South
Australia, 2010-11 to 2028-29 (Central scenario) 23
Figure 8 Winter operational maximum demand (sent-out) actual and forecast for South
Australia, 2011 to 2029 (Central scenario) 24
Figure 9 Profile of record minimum operational (as-generated) demand day (10 November
2019) 26
Figure 10 Shoulder operational minimum demand (sent-out) actual and forecasts for
South Australia (Central and High DER scenarios) 27
Figure 11 South Australian historical annual range of operational (sent-out) demand 27
Figure 12 Summer workday average demand profiles 28
Figure 13 Winter workday average demand profiles 29
Figure 14 Location and capacity of South Australian generators 31
Figure 15 South Australian energy generation by fuel type 32
Figure 16 Daily supply profile for South Australia averaged for the 2018-19 financial year 34
Figure 17 South Australian annual emissions and emissions intensity 37
Figure 18 Combined interconnector total imports and exports, and net flows 39
Figure 19 Combined interconnector daily 5-minute average flow 39

© AEMO 2019 | South Australian Electricity Report 10
Figure 20 Ratio of VWAP by fuel to total TWAP (based on real June 2019 $/MWh) 42
Figure 21 Frequency of occurrence of spot prices for South Australia 43
Figure 22 Count of negative price trading intervals per year 44
Figure 23 South Australian price setting by fuel type 45
Figure 24 South Australian electricity prices relative to gas prices 46
Figure 25 South Australian 30-minute spot prices and average wind generation for 2018-19 47
Figure 26 Quarterly average South Australian FCAS prices by service 48
Figure 27 Generation/demand mix in South Australia for Saturday 8 September 2018 51
Figure 28 HPR response during 25 August 2018 event 55
Figure 29 VPP FCAS Response to Contingency Event on 09 Oct 2019 56
Figure 30 Total number of directions issued by AEMO for the NEM on a per-unit basis 57
Figure 31 Estimated curtailment of South Australian wind generation for system limit reasons 58
Figure 32 Large international power systems operating with high instantaneous penetrations
of wind and solar generation, and Australian comparisons 60
Figure 33 Installed components of large international power systems relative peak demand 61
Figure 34 Forecast USE outcomes for South Australia – existing and committed projects only 62
Figure 35 South Australian Renewable Energy Zone candidates 68
Figure 36 Proposed synchronous condenser solution in South Australia 69
Figure 37 Interconnector options and variants assessed by ElectraNet in the SAET RIT-T 70
Figure 38 Location and capacity of South Australian generation projects 72
Figure 39 South Australian gas consumption – historical and forecast (Neutral scenario), 2014
to 2038 73
Figure 40 Gas producing basins and infrastructure supplying eastern and south-eastern
Australia 75
Figure 41 South Australian daily gas usage and pipelines capacities (October 2014 to October
2019) 77
Figure 42 South Australian gas generation demand (October 2014 to October 2019) 77

© AEMO 2019 | South Australian Electricity Report 11
1. Introduction
The South Australian Electricity Report (SAER) provides a high-level summary of key
insights into electricity supply and demand, as well as the latest developments in energy, in
South Australia. The report compiles information and insights from a number of AEMO
studies and publications, including reporting on historical information and forecasts.
1.1 Purpose and scope
Every year since 2012, AEMO has prepared a collection of independent reports for the South Australian
jurisdiction under Section 50B of the National Electricity Law as the South Australian Advisory Functions
(SAAF). In 2018, AEMO condensed several legacy SAAF reports into a single report, and this reporting model
continues with the 2019 SAER.
This 2019 SAER is supplemented by several Excel files with comprehensive data and figures summarising
historical information and forecasts. These data files contain many more metrics than are presented in this
report. Refer to Appendix A2 for a list of equivalent data file tables and figures to those shown in this report.
AEMO continues to publish an annual comparison of ElectraNet's Transmission Annual Planning Report
(TAPR) projects and their revenue proposal, separately from this report21.
1.2 Information sources
Appendix A1 contains important clarifying information regarding data sources and reporting methodology
used throughout the SAER and its data files.
AEMO has sourced information in this report from other AEMO publications and used information from data
provided by market participants and potential investors as at 14 November 2019, unless otherwise specified.
Table 1 provides links to additional information referred to above or provided either as part of the
accompanying information suite for this report, or related AEMO planning information.
Table 1 Information and data sources
Information source Website address
2019 Electricity Statement of Opportunities
(ESOO) – demand forecast http://www.aemo.com.au/Electricity/National-Electricity-Market-NEM/Planning-
and-forecasting/NEM-Electricity-Statement-of-Opportunities
2018 Integrated System Plan (ISP) https://www.aemo.com.au/Electricity/National-Electricity-Market-NEM/Planning-
and-forecasting/Integrated-System-Plan
2019 AEMO Electricity Demand Forecasting
Methodology Information Paper http://www.aemo.com.au/Electricity/National-Electricity-Market-NEM/Planning-
and-forecasting/NEM-Electricity-Statement-of-Opportunities
2019 Demand side participation forecast and
methodology http://www.aemo.com.au/Electricity/National-Electricity-Market-NEM/Planning-
and-forecasting/NEM-Electricity-Statement-of-Opportunities
2019 ESOO – ESOO Methodology Document http://www.aemo.com.au/Electricity/National-Electricity-Market-NEM/Planning-
and-forecasting/NEM-Electricity-Statement-of-Opportunities
2019 Gas Statement of Opportunities (GSOO)
for eastern and south-eastern Australia http://aemo.com.au/Gas/National-planning-and-forecasting/Gas-Statement-of-
Opportunities
21 SAAF reports are at http://www.aemo.com.au/Electricity/National-Electricity-Market-NEM/Planning-and-forecasting/South-Australian-Advisory-Functions.

© AEMO 2019 | South Australian Electricity Report 12
Information source Website address
2019 SAER Data File – tables and figures in this
report, as well as many additional metrics http://www.aemo.com.au/Electricity/National-Electricity-Market-NEM/Planning-
and-forecasting/South-Australian-Advisory-Functions
AEMO: Specification for Distributed Energy
Resources to provide Contingency FCAS http://www.aemo.com.au/Electricity/National-Electricity-Market-NEM/Security-and-
reliability/Ancillary-services/Market-ancillary-services-specifications-and-FCAS-
verification
AEMO: Wind farms and solar farms testing
requirements for Contingency FCAS
registration
http://www.aemo.com.au/Electricity/National-Electricity-Market-NEM/Security-and-
reliability/Ancillary-services/Market-ancillary-services-specifications-and-FCAS-
verification
AEMO’s 2018-19 Summer Readiness Plan https://www.aemo.com.au/Electricity/National-Electricity-Market-NEM/Security-
and-reliability/Summer-operations-report
AEMO’s Future Power System Security
program https://www.aemo.com.au/Electricity/National-Electricity-Market-NEM/Security-
and-reliability/FPSSP-Reports-and-Analysish
AEMO’s Guide to Ancillary Services in the
NEM http://www.aemo.com.au/Electricity/National-Electricity-Market-NEM/Security-and-
reliability/Ancillary-services
Carbon Dioxide Equivalent Intensity Index http://www.aemo.com.au/Electricity/National-Electricity-Market-NEM/Settlements-
and-payments/Settlements/Carbon-Dioxide-Equivalent-Intensity-Index
Fact sheets – frequency control, system
strength, visibility of the power system http://www.aemo.com.au/Electricity/National-Electricity-Market-NEM/Security-and-
reliability/FPSSP-Reports-and-Analysis
Generation Information page http://www.aemo.com.au/Electricity/National-Electricity-Market-NEM/Planning-
and-forecasting/Generation-information
Hornsdale Wind Farm 2 FCAS Trial http://www.aemo.com.au/Electricity/National-Electricity-Market-NEM/Strategic-
partnerships
Initial operation of the Hornsdale Power
Reserve Battery Energy Storage System http://www.aemo.com.au/Media-Centre/AEMO-Hornsdale-report
Interconnector capabilities report http://www.aemo.com.au/Electricity/National-Electricity-Market-NEM/Security-and-
reliability/Congestion-information/Network-status-and-capability
Maps and network diagrams http://www.aemo.com.au/aemo/apps/nem_map/index.php
Projections of uptake of small-scale systems http://www.aemo.com.au/Electricity/National-Electricity-Market-NEM/Planning-
and-forecasting/National-Electricity-Forecasting-Report
Quarterly Energy Dynamics – Q3 2019 https://aemo.com.au/-/media/Files/Media_Centre/2019/QED-Q3-2019.pdf
South Australian Planning Requirements for
New Electricity Generation http://www.aemo.com.au/Electricity/National-Electricity-Market-NEM/Planning-
and-forecasting/South-Australian-Advisory-Functions
AEMO, Renewable Integration Study, July
2019 https://www.aemo.com.au/Electricity/National-Electricity-Market-NEM/Security-
and-reliability/Future-Energy-Systems/Renewable-Integration-Study
1.3 Scenarios
Some tables and figures in this report are based on three scenarios for pace of change in the energy industry
– Central, Slow Change, and Step Change – in line with core scenarios from the 2019 Electricity Statement of
Opportunities (ESOO) for the National Electricity Market (NEM) published August 2019. In some cases, this
report also includes the High Distributed Energy Resources (DER) scenario from the 2019-20 Integrated
System Plan (ISP) for the NEM (now in development). More detail about the scenarios is provided in AEMO’s
2019 forecasting and planning scenarios, inputs and assumptions report (see Table 1 for references).

© AEMO 2019 | South Australian Electricity Report 13
In summary:
• The Central scenario reflects the current transition of the energy industry under current policy settings
and technology trajectories, where the transition from fossil fuels to renewable generation is generally led
by market forces and supported by current Commonwealth and South Australian Government policies.
This scenario assumes a range of best estimate projections of economic growth, population growth, and
electric vehicle (EV) uptake. Existing market settings, tariffs, policies (including the South Australian Retailer
Energy Efficiency Scheme) drive energy efficiency activities and DER uptake. Existing trials lead moderate
growth in aggregated virtual power plants (VPPs) to offset the need for additional supply, while household
batteries operate to maximise the individual household’s benefit.
• The Slow Change scenario reflects a general slow-down of the energy transition. It is driven by slower
advancements in technology and reductions in technology costs, low population growth, and low political,
commercial and consumer motivation to make the upfront investments required for significant emissions
reduction. The slower population growth outlook lowers broader economic growth and limits household
disposable income growth. Weak economic conditions lead to higher risk of industrial demand closures,
while business and residential loads seek to lower consumption to manage bill exposure. With less
disposable income and fewer policy settings to support DER, investment in rooftop PV, batteries, and EVs
is reduced relative to the Central scenario. Australia does not actively promote local EV deployment.
• The Step Change scenario reflects strong action on climate change that leads to a step change reduction
of greenhouse gas emissions. In this scenario, aggressive global decarbonisation leads to faster
technological improvements, accelerated exit of existing generators, greater electrification of the transport
sector with increased infrastructure developments, energy digitalisation, and consumer-led innovation.
Higher economic and population growth and greater innovation in digital trends leads to stronger
investment in energy efficiency, DER, and EVs. Existing VPP trials demonstrate a strong role for VPPs,
reducing the need for large-scale supply, while tariff reform enables greater adoption of smarter charging
behaviours by customers with batteries and EVs to offset household demand.
• The High DER scenario reflects a more rapid consumer-led transformation of the energy sector, relative to
the Central scenario. It represents a highly digital world where technology companies increase the pace of
innovation in easy-to-use, highly interactive, engaging technologies. This scenario includes reduced costs
and increased adoption of DER, with automation becoming commonplace, enabling consumers to actively
control and manage their energy costs while existing generators experience an accelerated exit. It is also
characterised by widespread electrification of the transport sector.
These scenarios will be referenced in the sections of this report covering forecast demand, consumption, and
supply.

© AEMO 2019 | South Australian Electricity Report 14
2. Consumer behaviour – behind the meter
South Australian consumers are expected to continue to adopt technologies which may
reduce their energy consumption from the grid. These DER affect consumers’ overall
energy consumption levels and potentially shift energy consumption patterns. Consumer
behaviour, particularly the usage of battery storage and EV charging patterns, will affect
consumption patterns across the day.
This section covers forecast uptake of these technologies and outlines the forecast role of DER for the 2019
NEM ESOO22. The impact on timing and magnitude of maximum operational demand is covered in Section 3.
2.1 Rooftop photovoltaics (PV)
Rooftop PV systems (up to 100 kilowatts [kW]) installed on South Australian residential and commercial
premises have a measurable impact on the region’s operational electricity demand, by reducing residential
and commercial grid consumption during daylight hours, when consumer demand can be met by rooftop PV.
From 2012-13, rooftop PV production has shifted minimum demand from overnight to occur in the middle of
the day, and the time of maximum operational demand further into the evening. In South Australia, maximum
demand now typically occurs late in the day (between 6:30 pm and 8.00 pm Adelaide time in summer
2018-19), when solar irradiance is low.
2.1.1 Rooftop PV forecast methodology
Forecast methodology
AEMO’s Electricity Demand Forecasting Methodology Information Paper23 provides a description of both
rooftop PV capacity and generation forecasts – as used in the 2019 NEM ESOO – in its Appendix A3. A short
summary of capacity and generation estimation is provided below.
Capacity estimation
Historical installed capacity for rooftop PV was extracted from a data set provided by the Clean Energy
Regulator (CER).
Generation estimation
The energy generated by a rooftop PV system was estimated using a dataset primarily procured from Solcast
(2009-19), supplemented from data developed by the University of Melbourne24 with AEMO, covering the
period 2000-08.
For each half-hour, the generation model considers solar radiation and cloud coverage. It models
inefficiencies related to shading effects and considers the geographic distribution of the rooftop PV
installations at that time. An example of the effect of including assumptions around inefficiencies is that the
22 At https://www.aemo.com.au/Electricity/National-Electricity-Market-NEM/Planning-and-forecasting/NEM-Electricity-Statement-of-Opportunities.
23 At https://www.aemo.com.au/-/media/Files/Electricity/NEM/Planning_and_Forecasting/NEM_ESOO/2019/Electricity-Demand-Forecasting-Methodology-
Information-Paper.pdf.
24 V.D. Ruelle, M. Jeppesen and M. Brear, Rooftop PV Model Technical Report, July 2016, at http://aemo.com.au/Electricity/National-Electricity-Market-
NEM/Planning-and-forecasting/-/media/CEDBBF70073149ABAD19F3021A17E733.ashx.

© AEMO 2019 | South Australian Electricity Report 15
total rooftop PV generation estimate for South Australia in January 2016 is reduced by 1% once ageing of
panels is considered25.
The historical values of rooftop PV generation were obtained by multiplying the existing capacity (calculated
from CER data) by the modelled generation of a 1 kW rooftop PV installation.
Rooftop PV capacity
Since 2009, South Australian total installed rooftop PV26 capacity has grown strongly. The proportion of South
Australian dwellings that now have rooftop PV systems installed is around 34%, which is the equal highest
level of penetration in Australia (shared with Queensland)27.
Rooftop PV systems continue to be installed at a very high rate. An additional 151 MW was estimated to have
been installed in 2018-19 across the business and residential sectors, bringing the total estimated combined
residential and business PV capacity in South Australia to 1,078 MW. Of the two sectors, the business sector
saw stronger relative growth than residential by a considerable margin in 2018-19.
Growth has been primarily due to reduced payback periods making rooftop PV generation an attractive
investment. This is a result of a combination of government incentives in the form of rebates and feed-in
tariffs, falling system costs, reductions in interest rates on mortgages, and high retail prices.
Figure 1 shows the estimated actual and forecast installed rooftop PV capacity (residential and business
sectors) for South Australia from 2014-15 to 2028-29. In the Central scenario, rooftop PV installed capacity is
forecast to grow steadily over the next few years before plateauing and reaching 1,386 MW in 2028-29.
Figure 1 South Australian rooftop PV installed capacity forecasts to 2028-29
Recent AEMO internal analysis suggests that more rooftop PV (approximately 40 MW) has been estimated to
be installed by October 2019 compared with AEMO’s forecast for the Central scenario, indicating that the
current DER installation rate sits between the Central and the High DER scenario forecasts.
25 This corresponds to an assumed average panel age across the region of 2.5 years.
26 Rooftop PV comprises both business and residential installations.
27 Australian PV Institute (APVI) Solar Map, funded by the Australian Renewable Energy Agency, accessed from pv-map.apvi.org.au on 21 October 2019.

© AEMO 2019 | South Australian Electricity Report 16
2.1.2 Rooftop PV generation
Over the next 10 years, South Australia is projected to have the highest ratio of rooftop PV generation to
operational consumption of all NEM regions. This is attributed to the region's high penetration of rooftop PV
installations, good solar resources, and the second-lowest operational consumption of all regions in the NEM.
More broadly across Australia, the Wholesale Electricity Market of Western Australia and Northern Territory
power systems are expected to have even greater penetration of PV over time.
Figure 2 shows the estimated actuals and forecasts of annual rooftop PV generation for South Australia from
2010-11 to 2028-29. In 2018-19, annual rooftop PV generation was estimated at 1,374 gigawatt hours (GWh). In
the Central scenario, it is forecast to increase to 1,917 GWh by 2028-29, which would represent approximately
13% of annual underlying consumption at that time.
Figure 2 South Australian rooftop PV generation forecasts to 2028-29
2.2 PV non-scheduled generation (PVNSG)
PVNSG capacity is between 100 KW and 30 MW and is typically business rooftop PV and small solar farms
below AEMO’s registration threshold of 30 MW.
South Australia has experienced rapid growth in PVNSG over the last four years, with capacity more than
tripling on average each year since 2014-15 (although from a relatively low base). This is driven by commercial
decisions in the small to medium commercial sector (100 kW to 30 MW) to avoid energy costs, as well as
incentives driven by large-scale renewable electricity generation certificates (LGCs).
Figure 3 shows the estimated amount of PVNSG installed capacity as at 30 June 2019 was 72 MW. However,
there is a delay between a PVNSG connection and its registration with the CER for the LGC. SA Power
Networks (SAPN) estimates PVNSG capacity to be at approximately 125 MW as at 1 October 2019.
AEMO’s Central scenario forecast, provided by the CSIRO, projects no additional PVNSG capacity, due to
assumed tapering off of LGC incentives, and in fact forecasts capacity declining, due to panel derating.
Actuals have already exceeded the Central scenario by approximately 65 MW.
In the 2019 ESOO, the Step Change scenario has the highest PVNSG forecast, due to including better
incentives for business to install PVNSG. PVNSG capacity is currently tracking to meet or exceed the Step

© AEMO 2019 | South Australian Electricity Report 17
Change scenario forecast, in which capacity is forecast to increase to 129 MW in 2024-25 and 205 MW in
2028-29.
Figure 3 South Australian PVNSG installed capacity forecasts
Figure 4 shows the estimated PVNSG annual generation for the capacity forecasts shown in Figure 3.
Figure 4 South Australian PVNSG generation forecasts

© AEMO 2019 | South Australian Electricity Report 18
2.3 Battery storage
South Australia currently (at June 2019) has an estimated 34 MW (or 8,000 units) of embedded battery
systems28. Compared to other NEM regions, South Australia has a higher battery installation forecast over the
next five years, as recent State Government policy is supporting the installation of 40,000 residential batteries
through a Home Battery Scheme29.
Other VPP trials are also underway by retailers and technology providers, including:
• South Australia VPP (SA VPP) operated by Energy Locals and Tesla with support from the South Australian
Government30.
• AGL VPP, with support from the Australian Renewable Energy Agency (ARENA)31.
• Simply Energy VPPs, with support from ARENA32.
• SA Power Networks Advanced VPP Grid Integration, with support from ARENA33.
• AEMO’s VPP Demonstrations, with support from ARENA.
AEMO’s VPP Demonstrations program is establishing a framework to allow VPPs to demonstrate their
capability to deliver services in contingency frequency control ancillary services (FCAS)34 and energy markets.
In July 2019, AEMO opened registrations for participation in this program and SA VPP was first to sign up. The
VPP Demonstrations allow participating VPPs to trial a new specification to deliver Contingency FCAS, and
AEMO will observe how VPPs respond to energy market price signals as non-scheduled resources. By trialling
VPP operations while their aggregated fleets remain small scale, the VPP Demonstrations aim to inform the
effective integration of VPPs into the NEM before they reach large scale. Information about the design of the
VPP Demonstrations and how to enrol is on AEMO’s website35.
By 2028-29, uptake of business and residential behind-the-meter battery systems is forecast to reach 150 MW
(in the Central scenario) and 2.5 gigawatts (GW) (in the High DER scenario). Battery uptake is forecast to be
slower than previous projections, due to revisions to payback periods, technology costs, and linkages to PV
uptake rates. Current modelling assumed most battery systems would be installed as part of integrated solar
and battery systems.
Dependent on pricing incentives, battery storage systems may have differing impact on the demand profile,
enabling households to store and use surplus solar production (if part of an integrated battery and solar
system) and shift this energy for use to meet evening peak demands. As outlined in Section 3, increased
benefits are expected if this battery fleet is orchestrated to provide a more certain peak support role.
2.4 Electric vehicles
In 2018-19, there were an estimated 300 residential EVs in South Australia including plug-in hybrid electric
vehicles (PHEVs), although confidence in the actual number of EVs at this stage is relatively low36.
28 For more information, see https://www.aemo.com.au/-/media/Files/Electricity/NEM/Planning_and_Forecasting/Inputs-Assumptions-Methodologies/2019/
2019-Projections-for-Small-Scale-Embedded-Technologies-Report-by-CSIRO.pdf.
29 For more information, see http://www.renewablessa.sa.gov.au/home-battery-scheme.
30 At https://virtualpowerplant.sa.gov.au/.
31 At https://arena.gov.au/projects/agl-virtual-power-plant/.
32 At https://www.simplyenergy.com.au/energy-solutions/battery-storage/south-australian-virtual-power-plant-vpp.
33 At https://arena.gov.au/projects/advanced-vpp-grid-integration/.
34 FCAS are services that help AEMO balance supply and demand to maintain system frequency. Contingency FCAS is called on when frequency is disturbed
by a contingency event, such as the sudden failure and disconnection of a generator or load.
35 At https://www.aemo.com.au/Electricity/National-Electricity-Market-NEM/DER-program/Virtual-Power-Plant-Demonstrations.
36 CSIRO, 2019 Projections for small-scale embedded technologies report, at https://www.aemo.com.au/Electricity/National-Electricity-MarketNEM/Planning-
and-forecasting/Inputs-Assumptions-and-Methodologies.

© AEMO 2019 | South Australian Electricity Report 19
By 2028-29, in the Central scenario, yearly sales of residential EVs in the state are forecast to be over 8,000
vehicles, and sales of light commercial vehicles above 1,500, taking South Australia’s total EV fleet to over
34,000 vehicles.
Annual electricity consumption from EV charging is forecast to be approximately 119 GWh in 2028-29 in
South Australia (under the Central scenario). The impact of EVs on the daily load profile and maximum
demand depends on how and when they are charged. Charging is likely to be influenced by the availability of
public infrastructure, tariff structures, any energy management systems, and drivers’ routines.
For the 2019 ESOO, AEMO assumed a weighting of four charging profiles: convenience, fast charging, smart
day, and overnight. These profiles reflected different incentives to charge during off-peak or overnight
periods, relative to convenience-based behaviours which may impact more significantly on peak loads.
Implicitly, there is an assumption that some consumers will be incentivised to charge their EVs outside the
peak demand period.
The EV consumption forecasts used state-based vehicle activity assumptions, which influence how many
vehicles are required in each region to meet travel demand. The kilometres travelled per vehicle by region
changes over time (due to adoption of car/ride sharing). The charging profiles per vehicle were also adjusted
for weekday/weekend differences and monthly differences based on traffic data. The battery efficiency at the
start of the forecast is approximately 0.2 kilowatt hours (kWh) per kilometre for cars, and up to 1.1 kWh/km for
trucks and buses, with these efficiencies expected to improve through the forecast period. EVs could
potentially have some impact on the peak demand experienced for distribution feeders, depending on
uptake and whether changing tariffs incentivise charging outside local peak demand.

© AEMO 2019 | South Australian Electricity Report 20
3. Operational consumption and demand
The historical decline in operational consumption is forecast to moderate, as continued
uptake of rooftop PV along with energy efficiency measures is projected to be balanced by
demand growth from increased economic activity, including forecast expansion in mining,
and projected uptake of EVs.
South Australian demand peaks late in the day, due to historically high uptake of rooftop
PV. At this time of day, continued growth in rooftop PV will have little or no impact on
moderating maximum demand from the grid.
The high penetration of rooftop PV in South Australia has caused minimum demand to
occur in the middle of the day since 2012-13. The forecast growth for rooftop PV
installations means 90% probability of exceedance (POE) minimum operational demand is
forecast to continue to decline over the next few years37.
3.1 Historical and forecast consumption and demand
3.1.1 Operational consumption (sent-out)
This section presents recent historical observations and long-term forecasts of annual operational
consumption in South Australia38.
In 2018-19, operational consumption (sent-out) was 12,147 GWh. This was 0.7% (91 GWh) lower than the
2017-18 consumption of 12,238 GWh.
Operational consumption is forecast to increase slightly under the 2019 NEM ESOO Central scenario, from
12,276 GWh in 2019-20 to 12,526 GWh in 2028-29 (0.2% average annual growth rate).
Figure 5 shows the historical trend of operational consumption in South Australia from 2009-10 as well as the
10-year forecast. It shows a noticeable decline from 2011-12 onwards, which has been driven by:
• A fall in residential, commercial, and industrial consumption as consumers have become more actively
engaged in their energy use, with uptake of rooftop PV and incorporating more energy efficiency savings.
• Declines in energy-intensive industrial industries such as car manufacturing.
Over the next 10 years, the decline is forecast to level out in aggregate, although there are varying trends
projected for individual customer segments.
37 Probability of exceedance (POE) means the probability, as a percentage, that a maximum or minimum demand forecast will be met or exceeded (for
example, due to weather conditions). A 10% POE maximum demand forecast, or a 90% POE minimum demand forecast, is expected to be met or
exceeded, on average, only one year in 10.
38 Forecasts are presented on a sent-out basis, meaning the forecasts exclude generator auxiliary loads. See https://www.aemo.com.au/-
/media/Files/Electricity/NEM/Planning_and_Forecasting/EFI/2018/Operational-Consumption-definition---2018-update.pdf for more on definitions.

© AEMO 2019 | South Australian Electricity Report 21
Figure 5 Annual operational consumption (sent-out) actual and forecast for South Australia
As Figure 6 below shows, residential consumption is forecast to continue its decline, driven by only minor
growth in population, combined with continued high growth in rooftop PV installations. This is reinforced by
ongoing improvements in energy efficiency through new schemes and appliances, including air-conditioning,
and better insulation of houses.
Figure 6 Forecast annual operational consumption (sent-out) with components (Central scenario)
Business consumption is forecast to remain relatively flat (0.4% year on year average growth), as growth in
the state economy is forecast to offset the decline coming from commercial rooftop PV installations and
business sector energy efficiency programs.

© AEMO 2019 | South Australian Electricity Report 22
EV consumption (forecast to reach 119 GWh by 2028-29 in the Central scenario) is projected to mostly offset
the drop in residential consumption, keeping total forecast operational consumption across South Australia
flat overall.
3.1.2 Operational maximum demand (sent-out)
South Australian operational maximum demand (sent-out) has historically occurred during periods of hot
weather over summer, largely attributed to air-conditioner load.
On 24 January 2019, South Australia experienced one of the hottest days on record (in many locations the
hottest). Operational demand sent-out reached 3,140 MW both at 7:30 pm and 8.00 pm (Adelaide time).
Demand would have been higher, but was restricted due to load reductions through Reliability and
Emergency Reserve Trader (RERT) (6 MW), non-scheduled generation directed on (19 MW), and voluntary
demand side participation (DSP) (30 MW). There were also up to 20,000 customers without power due to
blown fuses in the distribution network. The extent of the outages in the distribution network was highest at
8.00 pm, and AEMO estimates the actual peak would have occurred that half-hour, had it not been for these
load restrictions. After also accounting for the effect of the state-wide media call for users to conserve
electricity use where possible, AEMO estimates the unrestricted demand for 8.00 pm would have been
approximately 3,277 MW39.
Rooftop PV generation reduces maximum demand from the grid (operational demand). The large levels of
installed rooftop PV capacity in South Australia to date have resulted in maximum operational demand
shifting from the middle of the day to early evening, when rooftop PV is not generating. Table 2 shows that
since 2015-16, the time of maximum operational demand has occurred late in the day.
Because the peak now occurs when rooftop PV is not contributing, the 2019 ESOO forecast that further
increases in rooftop capacity will likely not have any additional impact on maximum operational demand.
Impact of rooftop PV on underlying maximum demand
Table 2 shows estimated rooftop PV generation at time of underlying maximum demand for the last five
years, illustrating that the contribution of rooftop PV has grown year on year since 2015-16.
Table 2 Rooftop PV contribution to underlying and operational maximum demand in South Australia
Year Rooftop PV contribution to
underlying maximum
demand (MW)
Time of underlying
maximum demand
(Adelaide time)
Rooftop PV generation at the
time of operational maximum
demand (MW)
Time of
operational
maximum
demand
(Adelaide
time)
2014-15 327 1:30 PM 142 4:00 PM
2015-16 230 5:30 PM 88 7:00 PM
2016-17 334 5:00 PM 178 6:30 PM
2017-18 383 5:00 PM 80 7:30 PM
2018-19 433 5:00 PM 84 7:30 PM
Forecast operational maximum demand
Maximum operational demand is forecast to continue to be experienced in summer and is expected to
increase, due to growth drivers for business load (first year increase in particular driven by growth in large
39 For more information please see AEMO, Summer 2019 Forecast Accuracy Update, 2019, at https://www.aemo.com.au/-/media/Files/Electricity/NEM/
Planning_and_Forecasting/Accuracy-Report/2019-Summer-Forecast-Accuracy-update.pdf.

© AEMO 2019 | South Australian Electricity Report 23
industrial loads), as well as the expectation that operational demand is likely to peak too late in the day for
additional rooftop PV to have a substantial impact offsetting growth in grid demand.
Figure 7 shows historical summer maximum demand actuals since 2010-11, and 10%, 50%, and 90% POE
forecasts from the 2019 and 2018 NEM ESOOs (Central/Neutral scenario). Over the next 10 years, maximum
operational demand (50% POE, Central scenario) is expected to remain relatively flat (0.2% average annual
growth). This is mainly due to projected energy efficiency gains reducing total business load, offset by
forecast growth in residential loads.
Forecast maximum demand represents the likely distribution of annual maximum demand outcomes if
unrestricted (that is in the absence of load shedding and DSP of any sort). Therefore, for comparison with the
forecasts, the adjusted (unrestricted) demand of 3,277 MW that could have been reached on 24 January 2019
is most relevant. As Figure 7 shows, the estimated demand that would have been reached that day exceeded
the 10% POE line.
Figure 7 Summer operational maximum demand (sent-out) actual and forecast for South Australia,
2010-11 to 2028-29 (Central scenario)
* Adjusted Actual value for 2018-19 is AEMO’s estimate of what would have been reached without load shedding or DSP of any sort.
Figure 8 shows the same period for South Australia’s operational maximum demand in winter. It shows an
initial increase in the first year driven by growth in large industrial loads, then remaining relatively constant for
the remainder of the time horizon. For winter, a new record high demand of 2,489 MW was set on 24 June
2019, following three very cold days, and exceeding the previous record set back in July 2008.
Insights into AEMO’s forecasting performance are reported annually in its Forecast Accuracy Report40.
40 At https://www.aemo.com.au/Electricity/National-Electricity-Market-NEM/Planning-and-forecasting/Forecasting-Accuracy-Reporting.

© AEMO 2019 | South Australian Electricity Report 24
Figure 8 Winter operational maximum demand (sent-out) actual and forecast for South Australia,
2011 to 2029 (Central scenario)
Demand side participation (DSP)
An alternative to adding grid generation to help meet maximum operational demand is to seek resources on
the demand side.
DSP reflects the capability of demand side resources (customer load reductions or generation from
customers’ embedded generators) to reduce operational demand at times of high wholesale prices or
emerging reliability issues. DSP captures direct response by industrial users and consumer response through
programs run by retailers, DSP aggregators, or network service providers.
Consumption may be reduced voluntarily by customers exposed directly to the wholesale price, in cases
where prices are high at times of maximum demand. More commonly, the reduction is automatically
controlled by retailers or DSP aggregators which have signed up loads to reduce at different price levels to
provide price hedging in the market.
The estimated level of DSP available in South Australia for summer 2019-20 and winter 2020 is shown in Table
3. It reflects AEMO’s expected (median) DSP resource response to different wholesale price levels. Reliability
response DSP estimates are also included, referring to situations where additional DSP is observed in
response to a Lack of Reserve (LOR) notice (LOR 2 or LOR 3) being issued41.
The DSP forecast and methodology is documented in a 2019 AEMO report42, which includes a summary of
the groups that are included in AEMO’s DSP values, the groups excluded and the reasons why. Notably:
• The typical response at the time of maximum demand by embedded generators is captured as part of
AEMO’s forecast for other non-scheduled generation and is excluded from the DSP estimates below to
avoid double-counting.
• Responses triggered by the RERT process, as discussed in Section 7.2, are excluded.
41 LOR conditions indicate times the system may not have enough reserves to meet demand if there is a large, unexpected event. See National Electricity
Rules, rule 4.8.4 for definitions, at https://www.aemc.gov.au/regulation/energy-rules/national-electricity-rules/current.
42 AEMO, Demand Side Participation Forecast and Methodology, 2019, at https://www.aemo.com.au/-/media/Files/Electricity/NEM/Planning_and_Forecasting/
NEM_ESOO/2019/Demand-Side-Participation-Forecast-Methodology-2019.pdf.

© AEMO 2019 | South Australian Electricity Report 25
• Time of use tariff impacts and controlled-load arrangements are captured in the demand forecast, and are
therefore not included in the DSP forecast to avoid double-counting of these effects.
Table 3 shows the estimated cumulative price response is 11 MW for South Australia when prices exceed
$500/MWh, and 27 MW when prices exceed $5,000/MWh. However, if LOR 2 or LOR 3 conditions are
declared, the total DSP response is estimated to be 33 MW in South Australia. On 24 January 2019, AEMO
estimated that there was 30 MW of DSP during the South Australian maximum demand event.
Table 3 Estimated DSP by wholesale price levels and reliability response* for South Australia
Trigger Summer 2019-20 (MW) Winter 2020 (MW)
>$300 / MWh 4 4
>$500 / MWh 11 11
>$5,000 / MWh 27 27
>$7,500 / MWh or in response to LOR notices 33 33
* Reliability response refers to situations where a Lack of Reserve notice (LOR 2 or LOR 3) is issued.
The current expected level of DSP from larger customers is small relative to total demand of these customers.
AEMO notes that there are times where responses can be significant.
3.1.3 Operational minimum demand
Operational minimum demand generally occurs during weekends or public holidays. As installed rooftop PV
capacity increases, minimum demand has been declining. South Australia has experienced minimum demand
in the middle of the day since 2012-13, due to rooftop PV, and this is forecast to continue to be the case.
In 2018-19, a new record low minimum operational demand (sent-out) of 583 MW was set on 21 October
2018 at 1:30 pm. This record has since been broken several times during October and November 2019.
The most recent record, as seen in Figure 9, occurred on Sunday 10 November 2019 at 2:00 pm (Adelaide
time). At this time, demand from the grid dipped to 458 MW (446 MW sent-out), South Australia was a net
exporter, and the peak rooftop PV generation was 832 MW, or around 64% of the underlying operational
demand. This day was a clear day, with high solar irradiance for the time of the year and daytime
temperatures in low to mid 20s, but, being a weekend, a day with low commercial and industrial loads.

© AEMO 2019 | South Australian Electricity Report 26
Figure 9 Profile of record minimum operational (as-generated) demand day (10 November 2019)
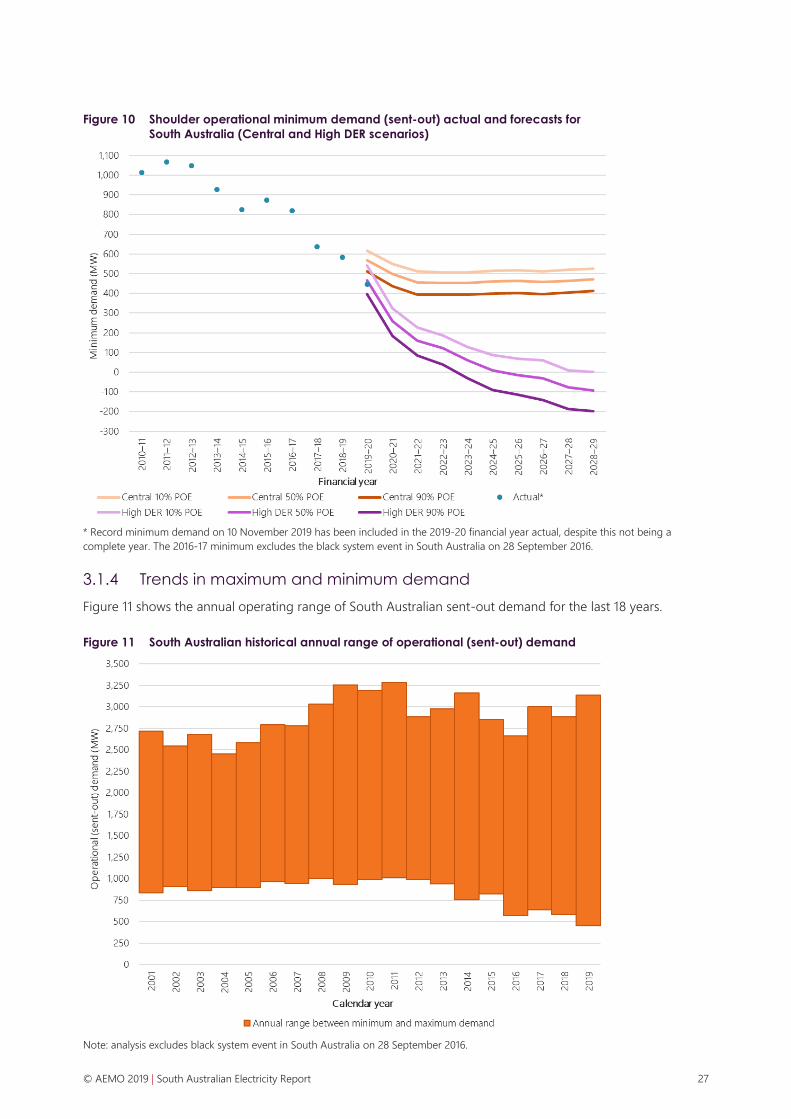
Figure 10 shows that forecast shoulder minimum demand declines over the first three years of the forecast to
2024-25, then remains relatively flat for the central scenario. The High DER scenario has a steep decline the
first three years, then a more gradual decline in the following years as PV saturation is reached in some
locations.
Under the High DER scenario, minimum demand (90% POE) is forecast to reach zero in South Australia in
2024-25. The minimum demand observed in November 2019 is more consistent with the High DER scenario
than the Central scenario, primarily due to more PV installations in the year to date than was forecast under
the Central scenario.
© AEMO 2019 | South Australian Electricity Report 27
Figure 10 Shoulder operational minimum demand (sent-out) actual and forecasts for
South Australia (Central and High DER scenarios)
* Record minimum demand on 10 November 2019 has been included in the 2019-20 financial year actual, despite this not being a
complete year. The 2016-17 minimum excludes the black system event in South Australia on 28 September 2016.
3.1.4 Trends in maximum and minimum demand
Figure 11 shows the annual operating range of South Australian sent-out demand for the last 18 years.
Figure 11 South Australian historical annual range of operational (sent-out) demand
Note: analysis excludes black system event in South Australia on 28 September 2016.

© AEMO 2019 | South Australian Electricity Report 28
Between 2001 and 2010, demand for energy rose, with higher increases in summer maxima. Since 2012,
annual maxima have remained at a similar level.
In December 2012, annual minima switched from overnight to daytime. Since then, minima have continued to
occur during the day, further reducing in line with rooftop PV installations.
As a result, the difference between maxima and minima has grown from approximately 1,800 MW to
approximately 2,600 MW.
3.2 Daily demand profiles
The average daily demand profiles represent the operational (as-generated) demand, in megawatts, for each
5-minute dispatch interval of a day, averaged over the relevant days of the selected period. Changes to the
average daily demand profile over time can provide insights into the impact of increasing small-scale
renewable generation and demand side management. Only South Australian workdays are included in the
analysis. Weekends and gazetted public holidays are excluded.
Summer
Figure 12 shows the South Australian average workday demand profile for summer from 2014-15 to
2018-19. Average summer demand year on year has been generally declining in daylight hours, due to
increasing rooftop PV generation following a continual growth in installations, along with overall energy
efficiency gains.
Figure 12 Summer workday average demand profiles
Seasonal hot weather still plays a large role in shaping overall demand. For example, in 2015-16, Adelaide
experienced heatwaves and record-breaking daytime temperatures which led to a much higher average
demand over the summer period than in the adjacent years.
Another noticeable feature in the demand profile is the sharp uptick from 11:30 pm, due to the controlled
switching of electric hot water storage systems. SAPN has been moving some of the hot water systems away
from the night-time timer setting to turn on during mid-day instead. Additional residential customer hot

© AEMO 2019 | South Australian Electricity Report 29
water loads may have been moved by retailers as smart meters are being installed. This has lowered the
observed night time peak and reduced the drop in mid-day demand.
Winter
Figure 13 shows the South Australian average winter workday demand profile for winter 2015 to 2019. A
noticeable morning peak is followed by an evening peak in winter, reflecting a combination of demand
increases as the workday commences/ends. Reduced grid demand is observed in the daylight hours, due to
the increased output of rooftop PV. Evening peaks can be attributed to continual demand from the grid,
mainly for domestic heating.
Figure 13 Winter workday average demand profiles

© AEMO 2019 | South Australian Electricity Report 30
4. Existing and committed supply
The generation capacity mix in South Australia has continued to evolve, with an overall
increase of 12.2% of total installed capacity43 to 7,066 MW in 2018-19 compared with the
previous year, mainly due to an increase in wind, rooftop PV, and large-scale solar
generation. Approximately 107 MW of new generation and storage capacity was committed
in South Australia at 14 November 2019, comprising wind and battery storage/VPP projects.
Generation slightly increased by 2.9% to 14,503 GWh, with South Australia continuing to be
a net exporter of electricity in 2018-19. The proportion of contribution from wind remained
similar to the previous year, while gas decreased slightly to 47.4%, and large-scale solar
and rooftop PV increased to 11.6%.
4.1 Historical capacity and generation
4.1.1 Historical capacity
The supply capacity mix in South Australia has continued to evolve. Table 4 shows the capacity mix at the end
of 2018-19.
Table 4 South Australian registered capacity and local generation by energy source in 2018-19
Energy source
Registered capacity Electricity generated
MW % of total GWh % of total
Gas 2,673 37.8% 6,877 47.4%
Wind 2,142 30.3% 5,725 39.5%
Diesel + small non-scheduled
generation (SNSG) 665 9.4% 184 1.3%
Rooftop PV 1,078 15.3% 1,374 9.5%
Solar 378 5.3% 303 2.1%
Storage – Battery 130 1.8% 41 0.3%
Total 7,066 100% 14,503 100%
Compared to the end of 2017-1844, the biggest increases were in wind, rooftop PV, and large-scale solar
capacity. New semi-scheduled generators that were registered in 2018-19 are:
43 Includes AEMO registered capacity, as well as estimated rooftop PV capacity and estimated SNSG capacity.
44 Refer to 2019 SAER data file, Table 4.24.

© AEMO 2019 | South Australian Electricity Report 31
• Lincoln Gap Wind Farm45 (212.4 MW).
• Willogoleche Wind Farm (119.36 MW).
• Tailem Bend Solar Project 1 (108 MW).
• Bungala Two Solar Farm (135 MW).
4.2 Historical generation
Figure 14 shows the location, nameplate capacity, and energy source of registered operational generators in
South Australia (all scheduled, semi-scheduled, and significant non-scheduled generators used in operational
reporting). More details of existing generators can be found in the supporting data pack.
Figure 14 Location and capacity of South Australian generators
45 Lincoln Gap Wind Farm (registered capacity 212.4 MW) currently has nameplate capacity of 126 MW, with an additional 86.4 MW to be completed by
August 2020, as reported in the 14 November 2019 update at https://www.aemo.com.au/Electricity/National-Electricity-Market-NEM/Planning-and-
forecasting/Generation-information.

© AEMO 2019 | South Australian Electricity Report 32
Composition of generation
Figure 15 shows the mix of energy generated in South Australia by fuel type from 2014-15 to 2018-19, from:
• All scheduled generators.
• All semi-scheduled and market non-scheduled wind farms.
• All semi-scheduled solar farms.
• Temporary generation north and south (now registered as non-scheduled).
• Selected smaller market and non-market non-scheduled generators (SNSG).
• Estimated rooftop PV.
The figure reflects local generation market share. No adjustments are considered for imports or exports
across the interconnectors with Victoria.
Figure 15 South Australian energy generation by fuel type
Table 5 expands on the data in Figure 15, focusing on the differences between 2017-18 and 2018-19, and
including interconnector flow metrics. Section 5 provides further insights on interconnector changes.
Between 2017-18 and 2018-19, generation increased by 2.9% for wind, decreased by 5.4% for gas, and
large-scale solar had its first full year of operation. Almost 50% of South Australian generation continues to
be coming from gas-powered generation (GPG), with system security requirements continuing to affect gas’
market share. Also, GPG, as well as interconnector imports, are required to meet South Australian demand in
periods when the sun is not shining, and there is little or no wind.

© AEMO 2019 | South Australian Electricity Report 33
Table 5 South Australian electricity supply by fuel type (GWh), comparing 2017-18 to 2018-19
Supply source 2017-18
(GWh)
2018-19
(GWh)
Change
(GWh)
Percentage
change (%)
2017-18
Percentage
share (%)
2018-19
Percentage
share (%)
Gas 7,273 6,877 -396 -5.4% 51.6% 47.4%
Wind 5,563 5,725 162 2.9% 39.5% 39.5%
Diesel + SNSG 117 184 67 57.3% 0.8% 1.3%
Rooftop PV 1,114 1,374 259 23.3% 7.9% 9.5%
Solar 4 303 299 7,768% 0.03% 2.1%
Storage – Battery 22 41 19 87.4% 0.2% 0.3%
Total 14,093 14,503 411 2.9% 100% 100%
Interconnector net
imports -292 -468 -176 60.3%
Interconnector total
imports 1,039 791 -248 -23.9%
Interconnector total
exports 1,331 1259 -72 -5.4%
Wind generation summary
South Australia has the second highest registered wind capacity by region in the NEM and Western
Australia’s Wholesale Electricity Market (WEM). Table 6 shows the total capacity for all South Australian
semi-scheduled and non-scheduled wind farms registered with AEMO, with the maximum 5-minute
generation output, from 2014-15 to 2018-19, and information on registered wind capacity and maximum
5-minute generation.
Table 6 Total South Australian wind generation and capacity
Financi
al year
Annual
wind
generation
(GWh)
Annual change
in wind
generation (%)
Annual
average
capacity
factor* (%)
Registered
capacity
(MW)**
Reason for increase in
capacity
Maximum
5-minute
generation
(MW) **
2014-15 4,223 - 32.0% 1,473 NA 1,365
2015-16 4,322 2.3% 32.4% 1,576 Hornsdale Stage 1 (102.4 MW) 1,384
2016-17 4,343 0.5% 29.5% 1,698 Hornsdale Stage 2 (102.4 MW),
Waterloo expansion (19.8 MW)
1,546
2017-18 5,563 28.0% 34.7% 1,810 Hornsdale Stage 3 (112 MW) 1,618
2018-19 5,725 2.9% 34.7% 2,142 Lincoln Gap*** (212.4 MW),
Willogoleche (119.36 MW)
1,712
* Based on the average capacity factor across all wind farms. Periods before a wind farm first reached 90% of registered capacity are
excluded, or where this period was for too short a length of time in the financial year.
** Data is captured from when each wind farm was entered into AEMO systems and includes the commissioning period.
*** Lincoln Gap Wind Farm (registered capacity 212.4 MW) currently has nameplate capacity of 126 MW, with an additional 86.4 MW to
be completed by August 2020, as reported on AEMO's Generation Information page (14 November 2019).

© AEMO 2019 | South Australian Electricity Report 34
Table 6 shows that:
• Lincoln Gap Wind Farm46 (212.4 MW) and Willogoleche Wind Farm (119.4 MW) were registered in 2018-19.
• Registered capacity increased from 2017-18 to 2018-19 by 18%, while generation only increased by 3%,
reflecting that the two new wind farms were not operating at close to registered capacity for some or all
of the 2018-19 financial year.
4.3 Historical typical day dispatch
The average daily supply profile for South Australia, seen in Figure 16, represents the supply (in MW) and spot
price (in $/MWh) for each 30-minute trading interval of a day, averaged over the 2018-19 financial year.
Figure 16 shows the average mix of generation dispatched on an average day, split between wind, solar,
thermal (gas and diesel), and combined interconnector flows. Rooftop PV is displayed above the demand
curve and shows the underlying energy that is consumed at the household level. Figure 16 shows that:
• Average wind output is slightly higher during the evening and early morning periods, complementing
average rooftop PV generation, which produces most of its output between 8.00 am and 6.00 pm.
• Scheduled generation contributed the most to the daily profile, providing the requisite energy when
necessitated by higher demand or when other generation sources were low.
• The average price correlates closely with average demand, particularly in the early morning hours. Price
peaks in the evening are in line with increases in demand from residential loads occurring at the same
time as solar generation is declining.
• Interconnector imports mainly occurred in the off-peak periods when solar was not operational.
Figure 16 Daily supply profile for South Australia averaged for the 2018-19 financial year
46 Lincoln Gap Wind Farm (Registered Capacity 212.4 MW) currently has Nameplate Capacity of 126 MW, with an additional 86.4 MW to be completed by
August 2020, as reported on AEMO's Generation Information page, 14 November 2019.
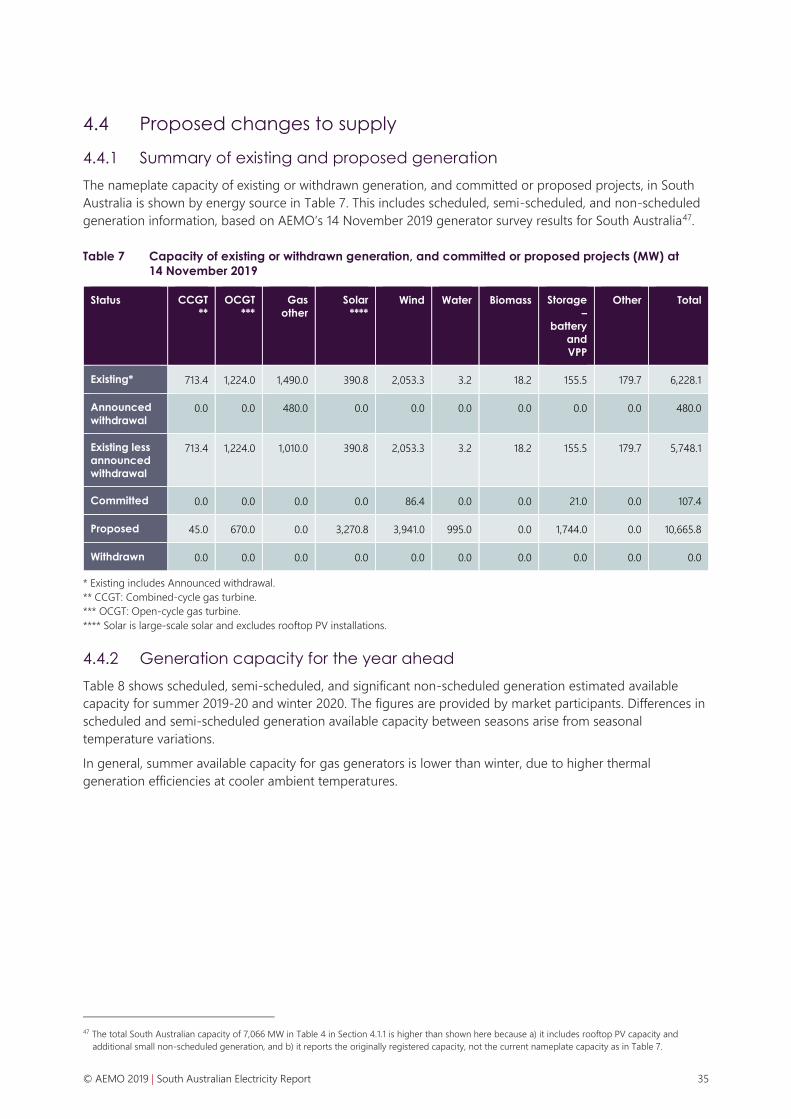
© AEMO 2019 | South Australian Electricity Report 35
4.4 Proposed changes to supply
4.4.1 Summary of existing and proposed generation
The nameplate capacity of existing or withdrawn generation, and committed or proposed projects, in South
Australia is shown by energy source in Table 7. This includes scheduled, semi-scheduled, and non-scheduled
generation information, based on AEMO’s 14 November 2019 generator survey results for South Australia47.
Table 7 Capacity of existing or withdrawn generation, and committed or proposed projects (MW) at
14 November 2019
Status CCGT
**
OCGT
***
Gas
other
Solar
****
Wind Water Biomass Storage
–
battery
and
VPP
Other Total
Existing* 713.4 1,224.0 1,490.0 390.8 2,053.3 3.2 18.2 155.5 179.7 6,228.1
Announced
withdrawal 0.0 0.0 480.0 0.0 0.0 0.0 0.0 0.0 0.0 480.0
Existing less
announced
withdrawal
713.4 1,224.0 1,010.0 390.8 2,053.3 3.2 18.2 155.5 179.7 5,748.1
Committed 0.0 0.0 0.0 0.0 86.4 0.0 0.0 21.0 0.0 107.4
Proposed 45.0 670.0 0.0 3,270.8 3,941.0 995.0 0.0 1,744.0 0.0 10,665.8
Withdrawn 0.0 0.0 0.0 0.0 0.0 0.0 0.0 0.0 0.0 0.0
* Existing includes Announced withdrawal.
** CCGT: Combined-cycle gas turbine.
*** OCGT: Open-cycle gas turbine.
**** Solar is large-scale solar and excludes rooftop PV installations.
4.4.2 Generation capacity for the year ahead
Table 8 shows scheduled, semi-scheduled, and significant non-scheduled generation estimated available
capacity for summer 2019-20 and winter 2020. The figures are provided by market participants. Differences in
scheduled and semi-scheduled generation available capacity between seasons arise from seasonal
temperature variations.
In general, summer available capacity for gas generators is lower than winter, due to higher thermal
generation efficiencies at cooler ambient temperatures.
47 The total South Australian capacity of 7,066 MW in Table 4 in Section 4.1.1 is higher than shown here because a) it includes rooftop PV capacity and
additional small non-scheduled generation, and b) it reports the originally registered capacity, not the current nameplate capacity as in Table 7.

© AEMO 2019 | South Australian Electricity Report 36
Table 8 Scheduled, semi-scheduled, and significant non-scheduled generation available capacity
Energy source Summer 2019-20 available
capacity* (MW)
Winter 2020 available
capacity* (MW)
Diesel (scheduled)** 236 263
Gas (scheduled) 2,757 2,724
Wind (semi-scheduled) 1,660 1,660
Wind (significant non-scheduled)*** 386 386
Solar (semi-scheduled) 315 315
Storage – Battery (scheduled) 165 165
Total 5,519 5,513
* AEMO Generation Information for South Australia, published 14 November 2019, at https://www.aemo.com.au/Electricity/National-
Electricity-Market-NEM/Planning-and-forecasting/Generation-information.
** Excludes the SA Temporary Generation North and South diesel generators. Refer to Section 7.4.1 for details of their status in reliability
forecasts.
*** Available capacity for wind farms classed as significant non-scheduled is based on nameplate rating, since 10-year availability
forecasts are not provided to AEMO for these units.
4.4.3 Committed supply developments
As of 14 November 201948, 21 MW of battery storage/VPP projects and approximately 86 MW of new wind
generation projects are committed in South Australia:
• SA Government VPP – Stage 2 (5 MW).
• Simply Energy VPP (6 MW/16 MWh).
• Lincoln Gap Wind Farm – Battery Energy Storage System (BESS) (10 MW).
• Lincoln Gap Wind Farm Stage 249 (86.4 MW), due to be operational by August 2020.
Commentary on Publically announced and other future generation is presented in Section 8.3.
4.5 Emissions intensity
Annual NEM emissions intensity for the 2018-19 financial year was the lowest on record50.
In South Australia, as Figure 17 shows, emissions from generation in 2018-19 decreased by 9.2% compared to
2017-18, while the emissions intensity of the grid reduced by 10%51. Lower emissions were a function of
decreased local GPG, and the continued decline in emissions intensity reflects increased wind and solar
penetration in the region.
48 Date based on latest (14 November 2019) AEMO Generation Information Page at time of writing. More recent information may be available by time of
publication, at https://www.aemo.com.au/Electricity/National-Electricity-Market-NEM/Planning-and-forecasting/Generation-information.
49 Lincoln Gap Wind Farm (registered capacity 212.4 MW) currently has nameplate capacity of 126 MW, with an additional 86.4 MW to be completed by
August 2020, as reported on AEMO's Generation Information Page, 14 November 2019.
50 See http://www.aemo.com.au/Electricity/National-Electricity-Market-NEM/Settlements-and-payments/Settlements/Carbon-Dioxide-Equivalent-Intensity-
Index.
51 Ibid.

© AEMO 2019 | South Australian Electricity Report 37
Figure 17 South Australian annual emissions and emissions intensity

© AEMO 2019 | South Australian Electricity Report 38
5. Transmission interconnectors
South Australia is connected to the rest of the NEM via two interconnectors, Heywood and
Murraylink. While imports to South Australia had been growing until the closure of
Hazelwood Power Station in 2017, the trend has since reversed, with South Australia being
now a net exporter.
5.1 Historical imports and exports
South Australia currently imports and exports power to the rest of the NEM through two interconnectors –
Heywood and Murraylink:
• The Heywood interconnector represents the 275 kilovolt (kV) lines between Heywood substation in
Victoria and South East substation in South Australia. This interconnector was originally commissioned in
1989. and was upgraded in 2015-16 to a nominal design limit of up to 650 MW in either direction of flow.
However, due to stability issues, Heywood’s nominal capacity has been 600 MW from Victoria to South
Australia since August 2016, and 500 MW from South Australia to Victoria since December 2015.
• Murraylink is the direct current (DC) cable between Red Cliffs in Victoria and Monash in South Australia. It
is a 220 MW DC cable that was commissioned in 2002.
Figure 18 shows the total actual interconnector imports and exports for South Australia from 2009-10 to
2018-19.
Results for 2018-19 were similar to 2017-18, with South Australia again being a net exporter into Victoria. This
change has been driven by the continued increase in wind and solar generation in South Australia and the
decrease of coal-fired generation in Victoria following Hazelwood Power Station’s closure at the end of
March 2017 and outages of the some of the remaining brown coal-fired generators over 2018-19. Pelican
Point Power Station in South Australia also returned to full capacity in July 2017.
In Figure 18:
• The orange column bars above the 0 GWh line (x-axis) shows the annual energy imported into South
Australia from Victoria. From 2009-10 to 2016-17, there was a steady increase in annual imports from
Victoria to South Australia. In 2017-18 and 2018-19, the average annual import decreased to almost
one-third of the annual imports in 2016-17.
• The yellow bars below the line show the energy exported from South Australia to Victoria. Over the past
10 years, the highest annual export occurred in 2017-18, with 2018-19 also recording comparatively high
exports.
• The red diamond points show net flows for the financial years, with positive values showing net importing
and negative values indicating net exporting.

© AEMO 2019 | South Australian Electricity Report 39
Figure 18 Combined interconnector total imports and exports, and net flows
Figure 19 shows the annual flow patterns for combined interconnector imports (from Victoria to South
Australia), averaged by the time of day (with times expressed in NEM time).
Figure 19 Combined interconnector daily 5-minute average flow
Figure 19 shows that, on average, in 2018-19, combined interconnector flow tended to export electricity,
except during early off-peak hours (around midnight to 3.00 am), where they tended to import. On average,
the highest exports were between approximately 10.00 am and 5.00 pm – coinciding with increased output
from grid-scale and rooftop PV. As with previous years, the sudden dip and subsequent spike in imports
occurring around 11.30 pm to midnight is caused by automated “off-peak” electric hot water systems in South
Australia.

© AEMO 2019 | South Australian Electricity Report 40
5.2 Progress of transmission upgrade projects
To facilitate better sharing of reserves at times of low renewable generation and better export opportunities
at times of high renewable generation, South Australia will benefit from stronger interconnection to
neighbouring regions.
The status of a series of upgrades and new projects are as follows:
• Heywood:
– The increase in the transfer limit in the direction from Victoria to South Australia (from 600 MW to 650
MW) is currently under review.
– An over-frequency generator shedding scheme has recently been commissioned by ElectraNet which,
when tested, is expected to lift the transfer limit in the direction from South Australia to Victoria from
500 MW to 550 MW.
• Murraylink:
– The New South Wales Murraylink Runback scheme (not yet in service), will reduce the risk of voltage
collapse and network issues in southern New South Wales – normally associated with high demand
conditions – so a stability constraint does not limit transfer of power from Victoria to South Australia.
This will improve the ability to access the full capacity of the Murraylink interconnector.
• Project EnergyConnect:
– The 2016 National Transmission Network Development Plan (NTNDP)52 recommended that a new
interconnector be established between New South Wales and South Australia. This outcome was
confirmed in the inaugural ISP in July 2018.
– In February 2019, ElectraNet completed the final stage in the South Australia Energy Transformation
Regulatory Investment Test for Transmission (RIT-T), which demonstrated that a new South Australia to
New South Wales interconnector would deliver economic benefits and reduce residential electricity
bills. The next stage of this project, now called EnergyConnect, is awaiting AER advice, expected by the
end of 201953. If approved, the interconnector has an estimated delivery time of 2022 to 2024,
depending on the time taken to gain environmental and other necessary approvals.
52 AEMO. 2016 NTNDP, at https://www.aemo.com.au/-/media/Files/Electricity/NEM/Planning_and_Forecasting/NTNDP/2016/Report/2016-NATIONAL-
TRANSMISSION-NETWORK-DEVELOPMENT-PLAN.pdf.
53 For more, see http://www.projectenergyconnect.com.au/ and https://www.electranet.com.au/projects/south-australian-energy-transformation/.

© AEMO 2019 | South Australian Electricity Report 41
6. Electricity spot price
With tight supply conditions in the southern regions and high gas prices, time-weighted
average wholesale prices in South Australia increased to record levels, including a high
level of price volatility.
FCAS prices continued the downward trend which has occurred since 2016-17, primarily
due to reduced prices in the Regulation FCAS markets.
6.1 Historical wholesale electricity prices
Table 9 shows that in 2018-19, the time-weighted average price (TWAP) was $109.80/MWh, the highest on
record and a 12% increase from the previous financial year average. Compared to other regions, South
Australia remained the equal highest-priced region in the NEM (equal with Victoria).
During the year, South Australia and Victoria shared a common marginal price-setting unit for 90% of
dispatch intervals (with this common unit varying across different dispatch intervals). This resulted in Victorian
pricing dynamics strongly influencing South Australia’s outcomes. Key contributors to the price increase in
South Australia and Victoria included:
• Increased price volatility – see Section 6.2 for more detail.
• High gas prices – wholesale gas prices in South Australia in 2018-19 reached record high levels, which were
reflected in higher-priced GPG offers. Compared to 2017-18, the average availability of GPG priced below
$100/MWh reduced by approximately 120 MW (14%).
• Higher-priced offers from black coal-fired generators – since 2015-16, black coal-fired generators in New
South Wales and Queensland have increased the price of their offers. This contributed to black coal-fired
generation setting South Australia’s price at an average of $90/MWh in 2018-19, compared to $62/MWh in
2015-16.
• Tight energy after the Hazelwood closure – since the closure of Hazelwood Power Station in March 2017,
output from new renewable energy projects (as at the end of 2018-19) is yet to fully replace the lost output
from Hazelwood Power Station, resulting in tight supply conditions.
• Brown coal-fired generator outages – average brown coal-fired generation in Victoria reduced by 173 MW
compared to 2017-18 due to a higher number of planned and unplanned outages, further tightening
supply conditions. This includes the outage of Loy Yang A Unit 2 since 18 May 2019, damaged following an
electricity short internal to the generator.
Table 9 2018-19 time-weighted average prices for the NEM
Queensland New South Wales Victoria South Australia Tasmania
Time-weighted
average ($/MWh) 80.29 88.56 109.81 109.80 90.01
The volume-weighted average price (VWAP) by fuel type represents the average price received by each fuel
technology. Higher output during high-priced periods will result in a higher VWAP. As a relative percentage
to the TWAP, shown in Figure 20, the following occurred over 2018-19:

© AEMO 2019 | South Australian Electricity Report 42
• Gas VWAP remained above the TWAP, reflecting the tendency for gas generators to operate at elevated
levels during high priced events and operate less (or cycle offline) during low prices. The VWAP for gas
increased compared to 2017-18 due to an increase in high-priced periods.
• Wind VWAP remained below the TWAP, as high wind generation, typically bid at low or negative prices,
tends to result in lower spot prices. Also, average wind generation tends to be higher during overnight
periods, which is also when demand, and prices, are typically low.
• Solar VWAP increased from approximately 94% to approximately 115% of TWAP. This increase was driven
by high daytime prices over Q1 2019. South Australian solar VWAP over this period was $207/MWh
(grid-scale solar was not in the South Australian market in the summer of 2017-18).
• The ratio between TWAP and VWAP for wind and gas have moved further apart than in 2017-18,
indicating an increase in price volatility.
Figure 20 Ratio of VWAP by fuel to total TWAP (based on real June 2019 $/MWh)
6.2 Price volatility
In 2018-19, there were more occurrences of both negative prices and prices above $300/MWh than in
2017-18.
6.2.1 High prices
Prices exceeded $300/MWh 0.78% of the time in 2018-19, a small increase from 2017-18 (where prices
exceeded $300/MWh 0.66% of the time). This included an almost doubling of extremely high-priced trading
intervals (>$5,000)/MWh), which contributed to annual cap returns54 increasing to $14.52/MWh (from
$8.34/MWh).
This price volatility largely occurred on two days, due to a confluence of events in Victoria and South
Australia. Victoria and South Australia’s daily average prices of $3,378/MWh and $3,360/MWh on 24 January
2019 were their highest since NEM start. The continuation of price volatility into 25 January resulted in the
54 A measure of volatility in electricity prices is the presence of high price events (prices above $300/MWh), calculated as the sum of the NEM half-hourly
price minus the $300 cap price for every half-hour in the financial year where the pool price exceeds $300/MWh, divided by the number of half-hours in
the year.

© AEMO 2019 | South Australian Electricity Report 43
Cumulative Price Threshold (CPT)55 being triggered, limiting the maximum price to $300/MWh once it came
into effect.
Contributors to these pricing outcomes included:
• Simultaneous high temperatures in South Australia and Victoria resulted in high electricity demand across
both regions, with coincident maximum operational demand of 12,463 MW on 24 January 2019 (the
highest coincident peak since Q1 2014). On this day, temperatures in South Australia broke new records,
while parts of country Victoria experienced extreme heat (close to record levels).
• A series of brown coal-fired generator outages on these days reduced thermal capacity in Victoria by up
to 1,600 MW.
• Wind capacity factors were comparatively low during the high-priced periods (average of 15% during the
high prices, compared to average capacity factors of 30% during high demand periods in Victoria).
Extreme conditions on these days also led to AEMO activating RERT contracts and (as a last resort) AEMO
instructing load shedding on both 24 and 25 January to balance demand with available supply. AEMO’s
report Load Shedding in Victoria on 24 and 25 January 201956 provides more details on these events.
6.2.2 Negative prices
As Figure 21 highlights, negative prices occurred 1.6% of the time, up from 0.8% in 2017-18. Negative prices
typically occurred during periods of high wind output, low demand, restricted interconnector transfers, and
when thermal plants typically bid below operating costs to maintain generation volumes at or above
minimum stable levels.
Figure 21 Frequency of occurrence of spot prices for South Australia
In the NEM, electricity is bought and sold either through the spot market, or wholesale contract market. Spot
prices are an important part of the process that drives daily unit commitment signals, new investment and exit
decisions. Many retailers and generators prefer to enter wholesale hedging contracts to reduce their exposure
55 The cumulative price threshold imposes a limit on sustained high prices in the wholesale market. For further details on the CPT, see Reliability Panel 2018,
Reliability standard and setting review 2018, at www.aemc.gov.au/sites/default/files/2018-04/Reliability%20Panel%20Final%20Report.pdf.
56 At www.aemo.com.au/-/media/Files/Electricity/NEM/Market_Notices_and_Events/Power_System_Incident_Reports/2019/Load-Shedding-in-VIC-on-24-
and-25-January-2019.pdf.

© AEMO 2019 | South Australian Electricity Report 44
to the spot market. Wholesale hedging contracts allow retailers to manage financial risk associated with
volatile spot prices, and provide generators a more certain revenue stream.
While negative spot prices lower the average spot electricity price, they do not necessarily lead to lower
prices for end consumers. This is because the wholesale component of a consumer’s bill reflects the hedging
cost incurred by retailers rather than spot price outcomes (which typically take some time to flow into the
contract market).
Figure 22 shows the count of negative South Australian market prices from 2009-10 to 2018-19. In 2018-19,
there were 275 negative priced 30-minute trading intervals, much higher than in 2017-18, but similar to the
preceding two years.
Key points relating to the increase in negative price periods in 2018-19 include:
• Increased periods of high variable renewable energy57 (VRE) output – in 2018-19, there was a 70% increase
in periods of high VRE output (>1,200 MW) compared to 2017-18. This was due to revised operating
guidance with respect to system strength in South Australia at the end of 201858.
• Timing of interconnector restrictions – in 2018-19, flows from South Australia to Victoria on the Heywood
interconnector were coincidentally more than three times more likely to be restricted (from 500 MW to
below 350 MW) during a period of high VRE and/or low demand.
• Shifting generator commitment decisions – in 2018-19, South Australian GPG units were more likely to
remain committed in the market during conditions that could lead to negative or low prices (such as
coincident high wind output and low demand). This reduced the amount of time on direction and had the
practical effect of keeping their supply in the market when the clearing price is determined59, increasing
the likelihood of negative prices.
Figure 22 Count of negative price trading intervals per year
57 Variable renewable energy (VRE) is a renewable energy source that is non-dispatchable due to its fluctuating nature, like wind power and solar power, as
opposed to a controllable renewable energy source such as dammed hydroelectricity, or biomass, or a relatively constant source such as geothermal
power. 58 Previous AEMO guidance set a single fixed limit on non-synchronous generation of 1,295 MW given minimum synchronous unit combinations. The revised
procedure introduced different levels of non-synchronous generation allowed (ranging from 1,000 MW to 1,460 MW) based on the synchronous unit
combinations available.
59 Under current intervention pricing arrangements, supply from a directed unit is not included in the supply stack for pricing purposes.

© AEMO 2019 | South Australian Electricity Report 45
Wind and solar response to negative prices
VRE generators have traditionally been bid to maximise output regardless of price. However, during recent
negative price events in South Australia, some VRE generators have chosen to turn off rather than incur these
negative prices.
As an example, on 30 April 2019, low demand, high VRE output, and network constraints drove negative
prices for more than five hours. On this day, more than half of South Australia’s VRE generators reduced their
output due to the negative prices. Semi-scheduled VRE achieved the reduction in output by re-bidding
output to higher prices and subsequently not being dispatched by AEMO, while some non-scheduled VRE
opted to self-curtail output.
This change in behaviour from VRE generators is likely to be influenced, at least in part, by the terms of new
power purchase agreements (PPAs). Anecdotal evidence provided to AEMO suggests that new PPAs tend to
be firm only to $0/MWh or the negative of the LGC price, whereas historically they were firm to the market
floor price. This means some VRE generators have greater exposure to the risks of negative prices than
previously observed.
6.3 Price setting outcomes
Figure 23 shows South Australia’s quarterly price setting outcomes by fuel type for 2017-18 and 2018-19.
In 2018-19, price setting results were similar to 2017-18, with black coal-fired generators (in Queensland and
New South Wales) setting South Australia’s prices approximately 40% of the time, and GPG and hydro
generation setting the price almost 30% of the time. The most common price setting power stations were
Torrens Island Power Station (which set the price around 15% of the time) and Murray Power Station in
Victoria (which set the price around 10% of the time).
Figure 23 South Australian price setting by fuel type
6.4 Impact of changes in generation mix
6.4.1 South Australian energy and price trends
Historical average electricity and gas price trends are shown in Figure 24. Both electricity and gas prices have
fluctuated each year, following a similar trend to each other. This demonstrates the inter-relationship between
the two, given the relatively large role of GPG in the South Australian energy mix.

© AEMO 2019 | South Australian Electricity Report 46
Between 2017-18 and 2018-19, South Australia’s average electricity TWAP increased by 12% and gas prices in
Adelaide’s Short-Term Trading Market increased by 25%.
Figure 24 South Australian electricity prices relative to gas prices
6.4.2 Gas spot price impact on electricity spot prices
In all NEM regions, GPG set the electricity spot price more frequently in 2018-19 than in 2017-18. In South
Australia, GPG set the price 32% of the time, up from 30% of the time in 2017-18 due to reduced South
Australian price-setting by coal-fired units in other regions60.
Overall, GPG gas consumption in 2018-19 was approximately 17% lower than in 2017-18, and was particularly
low in the first half of 2018-19. Drivers of low GPG over this period included:
• Increased penetration of VRE.
• High domestic and international gas prices in the second half of 2018.
• Comparatively high hydro generation output in 2018.
However, in the second half of 2018-19, high NEM spot prices and reduced hydro generation due to dry
conditions contributed to increased GPG demand.
Gas prices were higher across all wholesale gas markets for 2018-19 than in 2017-18. This coincided with
reduced Longford output since 1 January 2018 and increased gas demand for liquefied natural gas (LNG)
export from Curtis Island.
6.4.3 Spot prices and wind generation
Market prices are not typically set by wind generators, except during periods of high wind and low demand.
However, the volume of wind generation online does reduce the need for conventional thermal generation,
influencing spot prices even if not setting them by being the marginal generator.
Figure 25 shows spot prices for the South Australian region and the corresponding average wind generation
levels for each 30-minute dispatch interval for 2018-19. Key points include:
• 92% of prices above $1,000/MWh occurred when wind generation was lower than 400 MW.
• 87% of the negative prices occurred when wind generation was greater than 1,000 MW.
60 Due to the interconnected nature of the NEM, South Australia’s price can be set by units in other NEM regions.

© AEMO 2019 | South Australian Electricity Report 47
Figure 25 South Australian 30-minute spot prices and average wind generation for 2018-19
6.5 Frequency control ancillary services (FCAS) market price
In the NEM, generation and demand are balanced through the central dispatch process for both energy and
FCAS. FCAS is a market mechanism that uses generation or load to correct the imbalances between supply
and demand in real time61.
During 2018-19, South Australian FCAS prices continued the downward trend which has occurred since
2016-17 (shown in Figure 26), primarily due to reduced prices in the Regulation FCAS markets.
61 Regulation FCAS is enabled to continually correct the generation/demand balance in response to minor deviations in load or generation. Contingency
FCAS is enabled to correct the generation/demand balance following a major contingency event, such as the loss of a generating unit or major industrial
load, or a large transmission element. Contingency services are enabled in all periods to cover contingency events, but are only occasionally used (if the
contingency event actually occurs). There are eight types of FCAS: six types of Contingency FCAS, and two types of Regulation FCAS, to raise or lower
frequency at different speeds. For more details see AEMO, Guide to ancillary services in the National Electricity Market, at www.aemo.com.au/-/media/Files/
PDF/Guide-to-Ancillary-Services-in-the-National-Electricity-Market.ashx.
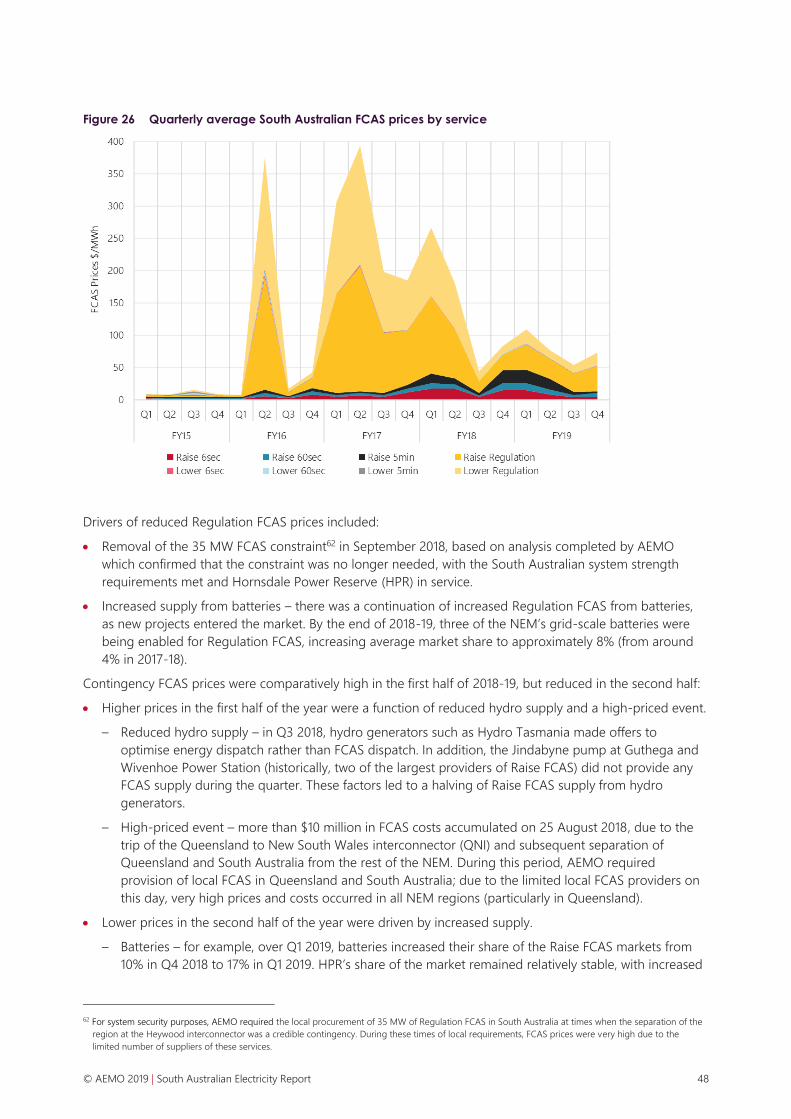
© AEMO 2019 | South Australian Electricity Report 48
Figure 26 Quarterly average South Australian FCAS prices by service
Drivers of reduced Regulation FCAS prices included:
• Removal of the 35 MW FCAS constraint62 in September 2018, based on analysis completed by AEMO
which confirmed that the constraint was no longer needed, with the South Australian system strength
requirements met and Hornsdale Power Reserve (HPR) in service.
• Increased supply from batteries – there was a continuation of increased Regulation FCAS from batteries,
as new projects entered the market. By the end of 2018-19, three of the NEM’s grid-scale batteries were
being enabled for Regulation FCAS, increasing average market share to approximately 8% (from around
4% in 2017-18).
Contingency FCAS prices were comparatively high in the first half of 2018-19, but reduced in the second half:
• Higher prices in the first half of the year were a function of reduced hydro supply and a high-priced event.
– Reduced hydro supply – in Q3 2018, hydro generators such as Hydro Tasmania made offers to
optimise energy dispatch rather than FCAS dispatch. In addition, the Jindabyne pump at Guthega and
Wivenhoe Power Station (historically, two of the largest providers of Raise FCAS) did not provide any
FCAS supply during the quarter. These factors led to a halving of Raise FCAS supply from hydro
generators.
– High-priced event – more than $10 million in FCAS costs accumulated on 25 August 2018, due to the
trip of the Queensland to New South Wales interconnector (QNI) and subsequent separation of
Queensland and South Australia from the rest of the NEM. During this period, AEMO required
provision of local FCAS in Queensland and South Australia; due to the limited local FCAS providers on
this day, very high prices and costs occurred in all NEM regions (particularly in Queensland).
• Lower prices in the second half of the year were driven by increased supply.
– Batteries – for example, over Q1 2019, batteries increased their share of the Raise FCAS markets from
10% in Q4 2018 to 17% in Q1 2019. HPR’s share of the market remained relatively stable, with increased
62 For system security purposes, AEMO required the local procurement of 35 MW of Regulation FCAS in South Australia at times when the separation of the
region at the Heywood interconnector was a credible contingency. During these times of local requirements, FCAS prices were very high due to the
limited number of suppliers of these services.

© AEMO 2019 | South Australian Electricity Report 49
FCAS provision coming from Dalrymple North BESS (5% of Raise FCAS) and Ballarat BESS (3% of Raise
FCAS). This additional supply displaced higher-priced supply from other technologies, largely coal.
– Hydro – in addition to new supply from the two batteries, there was also a reduction in the price of
offers (or return to the market) from some existing hydro providers, resulting in increased dispatch. For
example, in Q1 2019 Wivenhoe Power Station returned to the Raise 5 Minute FCAS market, offering
approximately 150 MW more at prices below $10/MWh than in Q4 2018.

© AEMO 2019 | South Australian Electricity Report 50
7. Reliability and security of supply
This section discusses managing reliability and security today in light of the changing
generation mix and forecast reliability over the next 10 years. The key points are:
• AEMO is working closely with the South Australian Government, ElectraNet, and industry
parties during this energy transition to enable a secure and reliable power system.
• The power system is adapting to decommissioning of thermal generation in South
Australia and Victoria and increasing levels of renewable generation. New flexible
generation and storage units are being built, and FCAS services are being provided from
storage and a wind farm.
• South Australia is forecast to meet the reliability standard over the next five years, but
there remains risk of supply interruptions, both as a result of potential shortfalls in South
Australia, and potentially due to shortfalls in Victoria, which could impact South Australia
due to the equitable load shedding principle in place in the NEM.
7.1 Reliability and security with a changing generation mix
Operating a power system requires resources that can be dispatched to ensure supply at any point in time
matches demand.
Other system services are needed to maintain system frequency and voltage around the network within the
defined operating limits under normal operation and to return the system to within these limits after any
credible contingency.
As the generation mix changes, the way these system services are obtained will also have to change63.
7.1.1 Maintaining frequency and voltage
Traditionally, system services to maintain the technical operating envelope were generally provided by large
synchronous generators. With the growth in renewable generation, fewer of these are operating, and during
periods of lower demand and very high wind and solar generation, synchronous plants may not be required
to provide energy at all.
However, AEMO may issue directions to keep synchronous plant operating, primarily to maintain the power
system in a secure operating state. This may increase costs due to the impacts of intervention pricing. Further
discussion on directions is presented in Section 7.2.3.
For South Australia, due to the high volume of system security directions made by AEMO, options to reduce
intervention are being reviewed or implemented. This includes improving interconnection to neighbouring
regions and commissioning synchronous condensers to help maintain voltage across the South Australia
region.
63 AEMO, Power System Requirements, March 2018, at https://www.aemo.com.au/-/media/Files/Electricity/NEM/Security_and_Reliability/Power-system-
requirements.pdf.

© AEMO 2019 | South Australian Electricity Report 51
7.1.2 Dealing with variability of generation
Growth in solar and wind generating capacity results in increased variability of the generation output, which
needs to be managed. For example, as illustrated in Figure 27 below, near sunset, when PV generation
declines and demand is rising towards its evening peak, there can be an increased need for ramping up
supply from other sources.
Figure 27 Generation/demand mix in South Australia for Saturday 8 September 2018
To deal with large ramping events, flexible technologies (or headroom on interconnectors) are needed to
continuously match supply and demand. Suitable technologies include fast-start gas engines, storage
(pumped hydro or battery), and DSP.
AEMO is undertaking detailed analysis as part of the Renewable Integration Study (see Section 7.3) to
understand how ramping challenges are likely to emerge in the NEM with increasing levels of variable wind
and solar generation. Of particular focus will be quantifying how system variability changes as more VRE is
installed, and the level of inherent uncertainty in forecasting the output of variable generators on any day.

© AEMO 2019 | South Australian Electricity Report 52
7.2 Managing reliability and security to date
RERT for summer 2018-19
In 2018, AEMO’s ESOO modelling identified a particular risk of supply interruptions in Victoria exceeding the
reliability standard for unserved energy (USE)64 in 2018-19. This risk was observed to arise from reductions in
supply from thermal generation as a result of coincident unplanned outages at times of expected low VRE
and high demand.
Based on these forecasts, AEMO established a pool of RERT providers under the National Electricity Rules
(NER) that could offer reserves on various notice periods. In consultation with the Victorian and South
Australian Governments, AEMO secured all resources offered in Victoria and South Australia that met the
required NER, cost, technical, and verification criteria.
For 2018-19, RERT resources were secured on a usage only basis. In 2017-18, some RERT contracts had both
availability and usage cost components. As a result, the RERT costs over summer 2018-19 were significantly
lower, at around 66% of the 2017-18 costs.
Costs of RERT
RERT was used on 24 and 25 January 2019 to minimise load shedding during periods of high demand65, as
summarised in Table 10.
Table 10 Thursday 24 January 2019, South Australia and Victoria RERT volume activated
Trading Interval ending RERT activated (MW) SA RERT activated (MW) VIC RERT activated – cumulative
total (MW)
24/01/2019 16:30 0 20 20
24/01/2019 17:00 6 105 111
24/01/2019 17:30 216 176 392
24/01/2019 18:00 216 176 392
24/01/2019 18:30 216 180 396
24/01/2019 19:00 216 180 396
24/01/2019 19:30 216 180 396
24/01/2019 20:00 216 124 340
24/01/2019 20:30 216 120 336
24/01/2019 21:00 216 120 336
24/01/2019 21:30 6 60 66
24/01/2019 22:00 0 40 40
24/01/2019 22:30 0 20 20
Total megawatt hour (MWh) 1,621
64 USE is energy that cannot be supplied to consumers, as a result of insufficient levels of generation capacity, demand response, or network capability, to
meet demand.
65 For more information, see https://www.aemo.com.au/-/media/Files/Electricity/NEM/Market_Notices_and_Events/Power_System_Incident_Reports/
2019/Load-Shedding-in-VIC-on-24-and-25-January-2019.pdf.
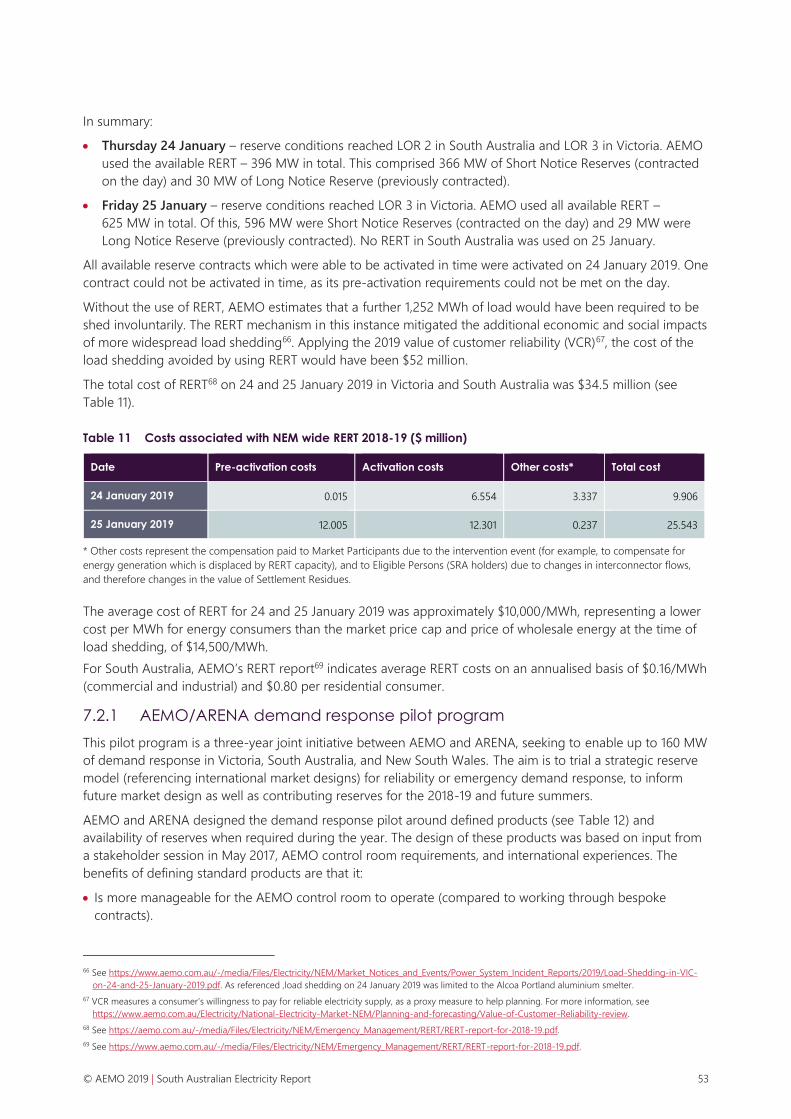
© AEMO 2019 | South Australian Electricity Report 53
In summary:
• Thursday 24 January – reserve conditions reached LOR 2 in South Australia and LOR 3 in Victoria. AEMO
used the available RERT – 396 MW in total. This comprised 366 MW of Short Notice Reserves (contracted
on the day) and 30 MW of Long Notice Reserve (previously contracted).
• Friday 25 January – reserve conditions reached LOR 3 in Victoria. AEMO used all available RERT –
625 MW in total. Of this, 596 MW were Short Notice Reserves (contracted on the day) and 29 MW were
Long Notice Reserve (previously contracted). No RERT in South Australia was used on 25 January.
All available reserve contracts which were able to be activated in time were activated on 24 January 2019. One
contract could not be activated in time, as its pre-activation requirements could not be met on the day.
Without the use of RERT, AEMO estimates that a further 1,252 MWh of load would have been required to be
shed involuntarily. The RERT mechanism in this instance mitigated the additional economic and social impacts
of more widespread load shedding66. Applying the 2019 value of customer reliability (VCR)67, the cost of the
load shedding avoided by using RERT would have been $52 million.
The total cost of RERT68 on 24 and 25 January 2019 in Victoria and South Australia was $34.5 million (see
Table 11).
Table 11 Costs associated with NEM wide RERT 2018-19 ($ million)
Date Pre-activation costs Activation costs Other costs* Total cost
24 January 2019 0.015 6.554 3.337 9.906
25 January 2019 12.005 12.301 0.237 25.543
* Other costs represent the compensation paid to Market Participants due to the intervention event (for example, to compensate for
energy generation which is displaced by RERT capacity), and to Eligible Persons (SRA holders) due to changes in interconnector flows,
and therefore changes in the value of Settlement Residues.
The average cost of RERT for 24 and 25 January 2019 was approximately $10,000/MWh, representing a lower
cost per MWh for energy consumers than the market price cap and price of wholesale energy at the time of
load shedding, of $14,500/MWh.
For South Australia, AEMO’s RERT report69 indicates average RERT costs on an annualised basis of $0.16/MWh
(commercial and industrial) and $0.80 per residential consumer.
7.2.1 AEMO/ARENA demand response pilot program
This pilot program is a three-year joint initiative between AEMO and ARENA, seeking to enable up to 160 MW
of demand response in Victoria, South Australia, and New South Wales. The aim is to trial a strategic reserve
model (referencing international market designs) for reliability or emergency demand response, to inform
future market design as well as contributing reserves for the 2018-19 and future summers.
AEMO and ARENA designed the demand response pilot around defined products (see Table 12) and
availability of reserves when required during the year. The design of these products was based on input from
a stakeholder session in May 2017, AEMO control room requirements, and international experiences. The
benefits of defining standard products are that it:
• Is more manageable for the AEMO control room to operate (compared to working through bespoke
contracts).
66 See https://www.aemo.com.au/-/media/Files/Electricity/NEM/Market_Notices_and_Events/Power_System_Incident_Reports/2019/Load-Shedding-in-VIC-
on-24-and-25-January-2019.pdf. As referenced ,load shedding on 24 January 2019 was limited to the Alcoa Portland aluminium smelter.
67 VCR measures a consumer’s willingness to pay for reliable electricity supply, as a proxy measure to help planning. For more information, see
https://www.aemo.com.au/Electricity/National-Electricity-Market-NEM/Planning-and-forecasting/Value-of-Customer-Reliability-review.
68 See https://aemo.com.au/-/media/Files/Electricity/NEM/Emergency_Management/RERT/RERT-report-for-2018-19.pdf.
69 See https://www.aemo.com.au/-/media/Files/Electricity/NEM/Emergency_Management/RERT/RERT-report-for-2018-19.pdf.

© AEMO 2019 | South Australian Electricity Report 54
• Allows auctions to be run in the future, if a strategic reserve model is pursued. This could lead to better
price discovery and competitive price outcomes.
ARENA is, over a period of three years (2017-20), providing up to $22.5 million of funding for projects in
Victoria and South Australia. ARENA together with the New South Wales Government (on a 50-50 basis) will
provide up to $15 million of funding for New South Wales projects for three years (2017-20).
Successful awardees receive ARENA capital funding grant in the form of availability payments over three
years and were required to sign onto the AEMO Short Notice RERT Panel and offer and be available for Short
Notice RERT if requested. If this RERT is activated, awardees receive usage payments capped at $1,000/MWh,
and Market Customers pay for the activation charges in accordance with the current cost recovery
mechanism for RERT under the NER.
Table 12 AEMO/ARENA demand response trial product specifications
Feature Product 1 Product 2
Notification period 60 minutes 10 minutes
Activation duration 4 hours 4 hours
Activation triggers LOR 2, LOR 3, System Security LOR 2, LOR 3, System Security
Availability 10.00 am to 10.00 pm business days 10.00 am to 10.00 pm business days
Activation frequency 10 per year (40 hours) 10 per year (40 hours)
This program made 141 MW available in year 1 (2017-18) and up to 190 MW available in year 2 (2018-19), rising
to up to 202 MW in year 3, across New South Wales, Victoria, and South Australia. Details of the trial year 1
are available from ARENA70.
7.2.2 Contribution of inverter-based technologies to reliability and security
Batteries and a wind farm in South Australia have recently proven that they are capable of rapid delivery of a
sustained response to a change in frequency. This can be particularly valuable, following a disturbance.
Hornsdale Power Reserve (HPR)
The HPR is registered to provide Contingency FCAS response.
During the QNI separation event on 25 August 2018, it was observed that HPR started responding to
under-frequency and over-frequency in the sub-second time frame. Figure 28 shows the response from HPR
during the event. The frequency response of this battery is a simple proportional response and will result in a
100 MW increase in output from the battery for a frequency decline from 50 Hz to 49 Hz.
The rapid, proportional frequency response from the Hornsdale battery, from charging at -38 MW to
discharging +48 MW, can be seen in Figure 28 and is an example of the capability of power electronic
devices on the power system.
This response is consistent with the design. However, it was observed that the response was so rapid that
settings on some network schemes were required to be updated to account for the rapid changes in power
flow from the battery.
70 See https://arena.gov.au/assets/2019/03/demand-response-rert-trial-year-1-report.pdf.

© AEMO 2019 | South Australian Electricity Report 55
Figure 28 HPR response during 25 August 2018 event
Dalrymple North Battery Energy Storage System
ElectraNet’s objective with the Dalrymple Energy Storage for Commercial Renewable Integration (ESCRI-SA)
project71 was to demonstrate that a battery with a grid forming inverter can operate a small localised islanded
load after a major power outage has occurred. The grid-connected 30 MW/8 MWh BESS system connects via
33 kV underground line cable into the Dalrymple substation. The BESS system has a design life of 12 years.
The Dalrymple North BESS provides a range of services under commercial agreements between ElectraNet
and AGL. The system and its capacity have been optimised to provide fast response as part of South
Australian System Integrity Protection Scheme (SIPS)72 to reduce constraints on the interconnector, trade
FCAS in the NEM, and provide a fallback to support local loads and nearby Wattle Point Wind Farm during
loss of supply. The project is partly funded by ARENA.
System Integrity Protection Scheme
The SIPS is designed to rapidly identify unstable conditions within South Australia and make use of available
energy from BESSs to avoid potential instability of the region. The reserve energy of HPR and available
energy from Dalrymple BESS discharges to the grid if the protection scheme identifies unstable conditions.
The analysis carried out to understand the effectiveness of this scheme, which uses inverter-based
technologies to rapidly discharge energy to the grid, demonstrated that such technologies, especially BESS,
can improve performance of the South Australian system and could help in avoiding unstable conditions
following the loss of multiple generators within South Australia.
71 See https://www.escri-sa.com.au/about/.
72 See https://www.aemo.com.au/-/media/Files/Electricity/NEM/Security_and_Reliability/Reports/2017/FFR-Working-Paper---Final.pdf.

© AEMO 2019 | South Australian Electricity Report 56
Possibility of VPP providing grid services
A few VPP projects (see Section 2) have been proposed in South Australia. These can potentially provide
some of the same services as the Hornsdale battery, including energy arbitrage, reserve energy capacity, and
Contingency FCAS.
In July 2019, AEMO launched the VPP Demonstrations73, which allows participating VPPs to test a new
specification to delivery Contingency FCAS. This makes it easier for VPPs to access FCAS as a value stream
that can be shared with consumers, and provides AEMO with operational visibility of the VPPs so that AEMO
can learn how to integrate VPPs into the NEM at large scale.
The South Australian VPP (SA VPP), controlled by Energy Locals and Tesla, is the first participant in the VPP
Demonstrations and it has benefitted from unusually high FCAS prices in the first few weeks since enrolling.
On 9 October 2019, there was a 748 MW trip of a generating unit at Kogan Creek power station in
Queensland, resulting in an instantaneous drop in frequency to 49.61 Hertz (Hz) (see Figure 29). The SA VPP
was enabled for 1 MW of Raise Contingency FCAS at the time, and automatically responded as expected to
the frequency excursion. This is a real-world example of how VPPs with household consumer devices can
contribute to power system security and earn new value streams that can be shared with consumers.
Figure 29 VPP FCAS Response to Contingency Event on 09 Oct 2019
* Based on 0.7% droop and 1MW Raise Contingency FCAS dispatch
7.2.3 Managing power system security
AEMO has published studies outlining the minimum number of synchronous machines required to maintain
the minimum required fault current levels in South Australia74.
System strength is the ability of the power system to maintain the voltage waveform at any given location,
with or without a disturbance. This includes resisting changes in the magnitude, phase angle, and waveshape
of the voltage.
Fault current level, which is the current flow generated during a fault to keep the system operating, is a guide
to a strong system. As such, where fault current level is above the minimum desired amount, the system
strength is deemed to be sufficient. Large synchronous machines (hydroelectric, gas, and coal generation,
and synchronous condensers) contribute to system strength by their inherent inertia and ability to deliver
fault current at up to eight times their rated current. Inverter-connected generation (batteries, wind, and solar
73 AEMO, NEM VPP Demonstrations, at https://www.aemo.com.au/Electricity/National-Electricity-Market-NEM/DER-program/Pilots-and-Trials.
74 At https://www.aemo.com.au/Media-Centre/South-Australia-System-Strength-Assessment.

© AEMO 2019 | South Australian Electricity Report 57
generation) presently require a strong system to operate securely and do not presently provide inherent
contribution to system strength.
Operating procedures are currently in place to ensure a minimum number of synchronous generating units
are in service in South Australia at all times to prevent the power system breaching secure operating limits,
until a permanent technical solution is completed. This solution (installation of synchronous condensers) is
expected to be operational by mid-2020 (see Section 8).
AEMO’s operating procedures identify the conditions and generator dispatch combinations needed to satisfy
the fault current requirements. Where natural market outcomes do not deliver the specific minimum secure
fault current level, AEMO has powers under the National Electricity Law and the NER to direct the necessary
resources into service.
In 2018-19, AEMO has issued around 153 directions (lasting 3,214 hours) to South Australian generator units to
ensure the correct level of fault current was always maintained. In 2017-18, 99 directions were issued (lasting
1,912 hours). These were security directions for the provision of fault current, not for energy. Where AEMO
issues a direction for energy, this is a reliability direction75.
Figure 30 compares the total number of directions issued on a per-unit basis in the NEM over the last 10
financial years, and Table 13 shows the equivalent directed hours.
Figure 30 Total number of directions issued by AEMO for the NEM on a per-unit basis
Table 13 Total number of directed hours from AEMO directions across the NEM
Financial year ending NSW QLD SA TAS VIC
2010 1.58 12.07 0.17 0.83
2011
2012
2013
75 There were no reliability directions in South Australia in 2017-18 or 2018-19.
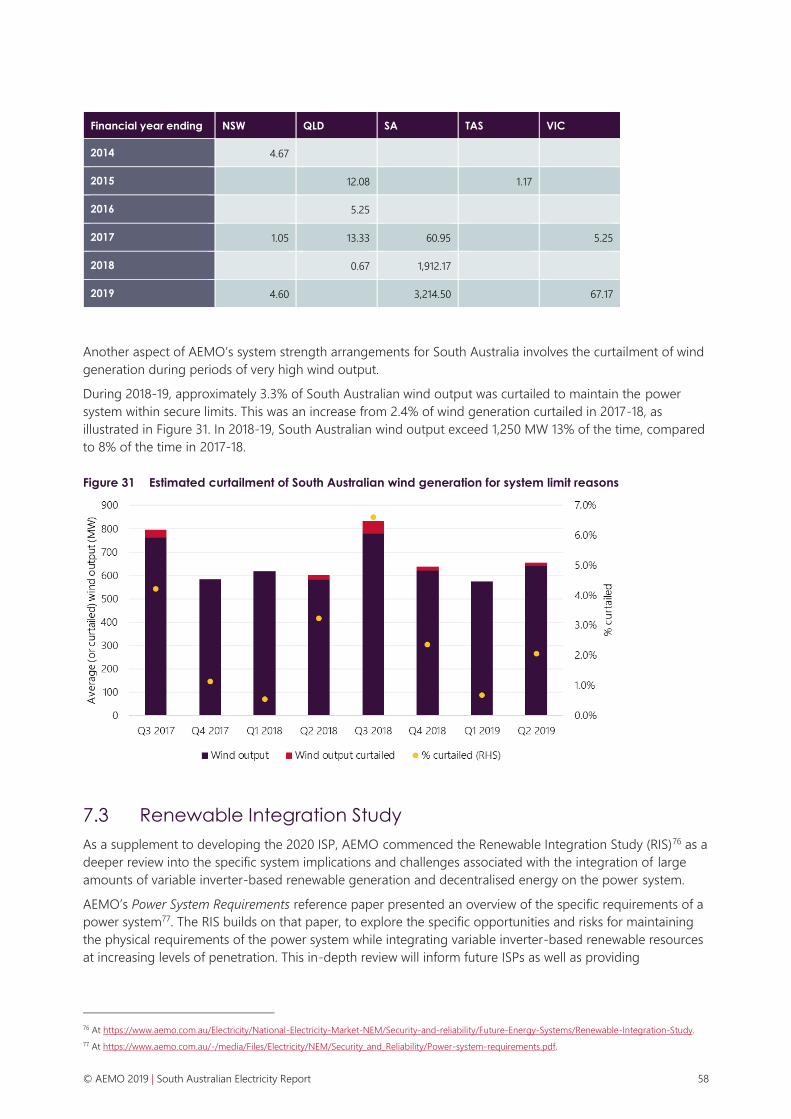
© AEMO 2019 | South Australian Electricity Report 58
Financial year ending NSW QLD SA TAS VIC
2014 4.67
2015 12.08 1.17
2016 5.25
2017 1.05 13.33 60.95 5.25
2018 0.67 1,912.17
2019 4.60 3,214.50 67.17
Another aspect of AEMO’s system strength arrangements for South Australia involves the curtailment of wind
generation during periods of very high wind output.
During 2018-19, approximately 3.3% of South Australian wind output was curtailed to maintain the power
system within secure limits. This was an increase from 2.4% of wind generation curtailed in 2017-18, as
illustrated in Figure 31. In 2018-19, South Australian wind output exceed 1,250 MW 13% of the time, compared
to 8% of the time in 2017-18.
Figure 31 Estimated curtailment of South Australian wind generation for system limit reasons
7.3 Renewable Integration Study
As a supplement to developing the 2020 ISP, AEMO commenced the Renewable Integration Study (RIS)76 as a
deeper review into the specific system implications and challenges associated with the integration of large
amounts of variable inverter-based renewable generation and decentralised energy on the power system.
AEMO’s Power System Requirements reference paper presented an overview of the specific requirements of a
power system77. The RIS builds on that paper, to explore the specific opportunities and risks for maintaining
the physical requirements of the power system while integrating variable inverter-based renewable resources
at increasing levels of penetration. This in-depth review will inform future ISPs as well as providing
76 At https://www.aemo.com.au/Electricity/National-Electricity-Market-NEM/Security-and-reliability/Future-Energy-Systems/Renewable-Integration-Study.
77 At https://www.aemo.com.au/-/media/Files/Electricity/NEM/Security_and_Reliability/Power-system-requirements.pdf.

© AEMO 2019 | South Australian Electricity Report 59
foundational engineering advice to government and administrative policy-makers to support their
consideration of future changes needed in electricity regulations and market designs.
The RIS is being undertaken in a series of steps:
1. A review of leading international experience in wind and solar PV integration.
2. Detailed analysis of phenomena specifically related to wind and solar PV technologies78, including:
– Managing changes in wind and solar output.
– Assessing the adequacy of frequency control in the power system.
– Operating with increasing levels of DER.
3. Presenting a view of what operating the NEM could look like over the next decade. This will include the
combined results of this international review, AEMO’s detailed analysis in the RIS, and the results of
ongoing industry investigation into the more localised limits to wind and solar PV penetration (for
example, network congestion and localised system strength).
4. Engaging with local and international organisations and independent experts to review and collaborate on
AEMO’s preliminary findings.
5. A final report in Q1 2020 into the technical challenges and any possible identified system limits associated
with integrating increasing levels of variable inverter-based resources, and a roadmap of priorities to
manage these challenges.
In its first deliverable, AEMO supplemented previous studies with a review on how Australia compares with
other international power systems79. The objectives of the international review were:
• First, comparison of the technical challenges that Australia has experienced or identified with the
experience of other jurisdictions to reveal any previously undetected challenges.
• Second, updating understanding of how other jurisdictions are managing the technical requirements of
their power systems during the transformation, and what practices appear effective from a technical
perspective.
• Third, evaluating these various approaches to see if there are lessons that can be applied to achieve better
outcomes in Australia’s NEM and WEM.
AEMO stresses that this international review is to help inform potential approaches to current and emerging
technical challenges, not necessarily to prescribe specific approaches that have worked overseas.
Although the physics underlying power system operation are universal, the need for a particular solution is
impacted by different features of each system, including the level of interconnection with adjacent systems,
geographic size, generation mix, and local climate conditions.
Prevailing regulatory and market design considerations also influence how any necessary requirements can
be most effectively implemented in a particular jurisdiction.
This international review identified five key insights, which are summarised below and explored in more detail
in the full RIS report:
1. South Australia is already experiencing some of the highest levels of wind and solar generation in the
world, including one of the highest levels of residential solar PV.
2. Successfully integrating high levels of DER requires an increasing level of visibility, predictability, and
controllability of these small distributed devices. Australia can learn from several jurisdictions in its
approaches to these challenges.
78 The study uses a projected generation mix and network configuration in 2025 as a focus for its detailed analysis. 2025 was chosen as the focus for the first
stage of the RIS to enable more detailed focus and increase confidence and certainty in outcomes of power system models, because AEMO has a
reasonable level of information about the generation projects that might be connected out to 2025.
79 See https://www.aemo.com.au/-/media/Files/Electricity/NEM/Security_and_Reliability/Future-Energy-Systems/2019/AEMO-RIS-International-Review-Oct-
19.pdf.

© AEMO 2019 | South Australian Electricity Report 60
3. Managing variability and uncertainty is increasingly challenging at higher levels of wind and solar
generation. Australia can learn from others in their approaches, including the assessment of system
ramping requirements and fleet capability.
4. Australia should consider international approaches to frequency management in high renewable
generation systems, including approaches to maintaining sufficient inertia and enablement of primary
frequency response on all generators.
5. International power system operators have taken a staged approach to operating power systems with
progressively less synchronous generation online. A similar approach could be considered in Australia.
Figure 32 Large international power systems operating with high instantaneous
penetrations of wind and solar generation, and Australian comparisons
Data sources: Denmark (https://docstore.entsoe.eu/Documents/Publications/Statistics/Factsheet/entsoe_sfs2018_
web.pdf and http://osp.energinet.dk/_layouts/Markedsdata/framework/integrations/markedsdatatemplate.aspx?
language=en), Ireland and Northern Ireland (http://www.eirgridgroup.com/site-files/library/EirGrid/System-and-
Renewable-Data-Summary-Repor%20July%202019t.xlsx), Great Britain (https://www.gov.uk/government/
statistics/uk-energy-in-brief-2019 and https://gridwatch.co.uk/), Hawaii (https://www.hawaiianelectric.com/about-
us/power-facts), Texas (http://www.ercot.com/content/wcm/lists/172484/ERCOT_Quick_Facts_01.17.19.pdf), Australia
(https://assets.cleanenergycouncil.org.au/documents/resources/reports/clean-energy-australia/clean-energy-
australia-report-2019-fact-sheet.pdf, and internal database).
The review found that South Australia has experienced some of the highest instantaneous penetrations of
wind and solar generation in the world, second only to Denmark (see Figure 32).
The report identified that South Australia operates under more challenging conditions than Denmark given its
substantially lower level of interconnection, as shown in Figure 33 below. It can also be seen that South
Australia experiences the lowest proportional minimum demand of any of the power systems assessed.
The results of AEMO’s detailed studies will be published in a final RIS report, currently planned for the first
quarter of 2020. Further information on the RIS, supplementary resources, and links to other related projects
are available on the AEMO website80.
80 At https://www.aemo.com.au/Electricity/National-Electricity-Market-NEM/Security-and-reliability/Future-Energy-Systems/Renewable-Integration-Study.

© AEMO 2019 | South Australian Electricity Report 61
Figure 33 Installed components of large international power systems relative peak demand
Data sources: Australia (AEMO, Generation Information: https://www.aemo.com.au/Electricity/National-Electricity-Market-NEM/Planning-and-forecasting/Generation-information, Australian PV Institute, PV Postcode Data: https://pv-
map.apvi.org.au/postcode) Great Britain (Department for Business, Energy & Industrial Strategy, Digest of UK Energy Statistics: https://www.gov.uk/government/statistics/electricity-chapter-5-digest-of-united-kingdom-energy-statistics-
dukes; Department for Business, Energy & Industrial Strategy, Solar Photovoltaics Deployment: https://www.gov.uk/government/statistics/solar-photovoltaics-deployment) Oahu (Hawaiian Electric, Power Facts: https://www.hawaiianelectric
.com/about-us/power-facts; Hawaii State Energy Office, Hawaii Renewable Energy Projects Directory: https://energy.ehawaii.gov/epd/public/energy-projects-list.html)Ireland (EirGrid, All-Island Generation Capacity Statement 2018-2027:
http://www.eirgridgroup.com/site-files/library/EirGrid/Generation_Capacity_Statement_2018.pdf; Sustainable Energy Authority of Ireland, Ireland’s Solar Value Chain Opportunity: https://www.seai.ie/publications/Solar-Chain-Opportunity-
report.pdf) Denmark (Energi Data Service, Capacity Per Municipality Data: https://www.energidataservice.dk/en/dataset/capacitypermunicipality; IEA PV Power Systems Programme, National Survey Report of Photovoltaic Applications in
Denmark 2017: http://iea-pvps.org/index.php?id=93&eID=dam_frontend_push&docID=4457) Germany, Italy (ENTSO-E, Net Generating Capacity: https://www.entsoe.eu/data/power-stats/net-gen-capacity/; ENTSO-E, Ten Year Network
Development Plan 2018 Executive Report, Appendix: https://tyndp.entsoe.eu/Documents/TYNDP%20documents/TYNDP2018/consultation/Main%20Report/TYNDP18%20Exec%20Report%20appendix.pdf, Bloomberg New Energy Finance,
New Energy Outlook 2019 data viewer: https://about.bnef.com/new-energy-outlook/)Texas (ERCOT, Capacity changes by fuel type: http://www.ercot.com/content/wcm/lists/162615/Capacity_Changes_by_Fuel_Type_Charts_November_2018
.xlsx; ERCOT, Unregistered DG Installed Capacity Quarterly Report, http://www.ercot.com/services/rq/re/dgresource; U.S. Energy Information Administration, Electric Power Monthly with Data for July 2019:
https://www.eia.gov/electricity/monthly/current_month/epm.pdt Table 6.2.B)California (California ISO, Key Statistics August 2019: California Energy Commission, Electric Generation Capacity & Energy: http://www.caiso.com
/Documents/MonthlyStats-August2019.pdf https://ww2.energy.ca.gov/almanac/electricity_data/electric_generation_capacity.html; California Distributed Generation Statistics: https://www.californiadgstats.ca.gov/charts/nem; Self-Generation
Incentive Program, State-wide Report: https://www.selfgenca.com/documents/reports/statewide_projects).
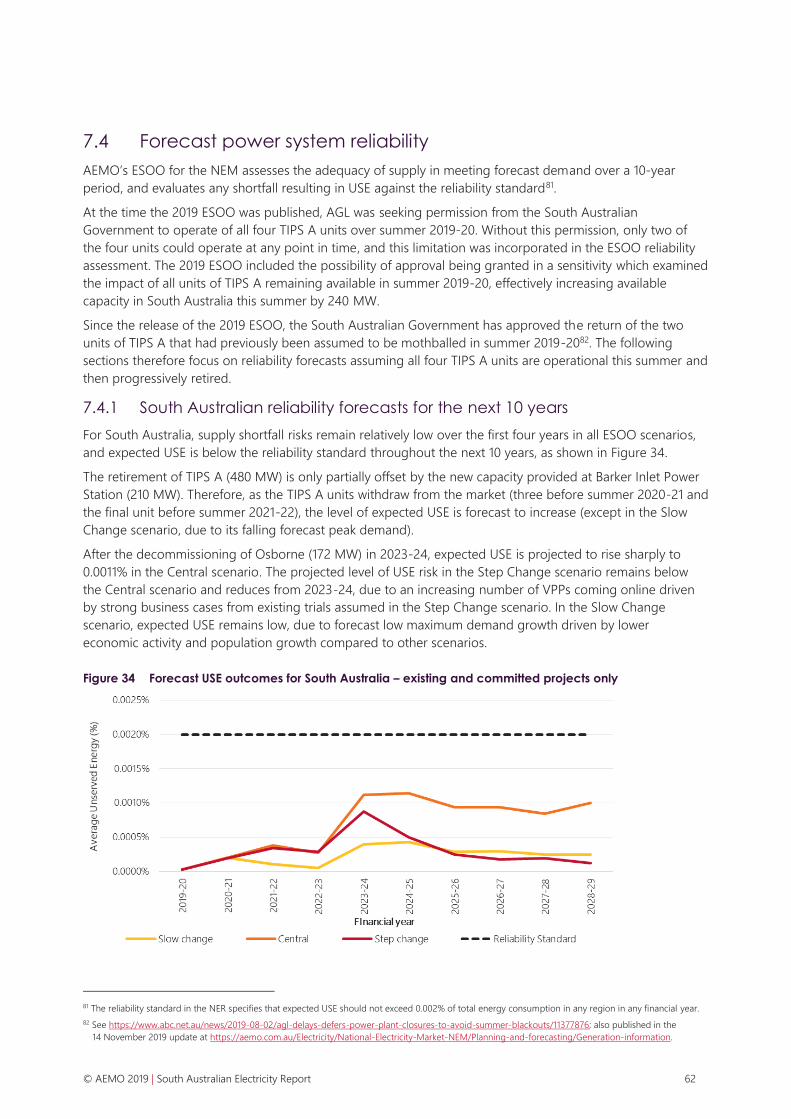
© AEMO 2019 | South Australian Electricity Report 62
7.4 Forecast power system reliability
AEMO’s ESOO for the NEM assesses the adequacy of supply in meeting forecast demand over a 10-year
period, and evaluates any shortfall resulting in USE against the reliability standard81.
At the time the 2019 ESOO was published, AGL was seeking permission from the South Australian
Government to operate of all four TIPS A units over summer 2019-20. Without this permission, only two of
the four units could operate at any point in time, and this limitation was incorporated in the ESOO reliability
assessment. The 2019 ESOO included the possibility of approval being granted in a sensitivity which examined
the impact of all units of TIPS A remaining available in summer 2019-20, effectively increasing available
capacity in South Australia this summer by 240 MW.
Since the release of the 2019 ESOO, the South Australian Government has approved the return of the two
units of TIPS A that had previously been assumed to be mothballed in summer 2019-2082. The following
sections therefore focus on reliability forecasts assuming all four TIPS A units are operational this summer and
then progressively retired.
7.4.1 South Australian reliability forecasts for the next 10 years
For South Australia, supply shortfall risks remain relatively low over the first four years in all ESOO scenarios,
and expected USE is below the reliability standard throughout the next 10 years, as shown in Figure 34.
The retirement of TIPS A (480 MW) is only partially offset by the new capacity provided at Barker Inlet Power
Station (210 MW). Therefore, as the TIPS A units withdraw from the market (three before summer 2020-21 and
the final unit before summer 2021-22), the level of expected USE is forecast to increase (except in the Slow
Change scenario, due to its falling forecast peak demand).
After the decommissioning of Osborne (172 MW) in 2023-24, expected USE is projected to rise sharply to
0.0011% in the Central scenario. The projected level of USE risk in the Step Change scenario remains below
the Central scenario and reduces from 2023-24, due to an increasing number of VPPs coming online driven
by strong business cases from existing trials assumed in the Step Change scenario. In the Slow Change
scenario, expected USE remains low, due to forecast low maximum demand growth driven by lower
economic activity and population growth compared to other scenarios.
Figure 34 Forecast USE outcomes for South Australia – existing and committed projects only
81 The reliability standard in the NER specifies that expected USE should not exceed 0.002% of total energy consumption in any region in any financial year.
82 See https://www.abc.net.au/news/2019-08-02/agl-delays-defers-power-plant-closures-to-avoid-summer-blackouts/11377876; also published in the
14 November 2019 update at https://aemo.com.au/Electricity/National-Electricity-Market-NEM/Planning-and-forecasting/Generation-information.

© AEMO 2019 | South Australian Electricity Report 63
Although expected USE remains below the current reliability standard, from 2023-24 additional strategic
reserves would be required in the Central scenario to reduce the risk of a major load shedding event to a
one-in-10-year event, as shown in Table 14.
Table 14 Additional reserves required to reduce risk of major load shedding to a one-in-10 year event
Financial Year Additional reserves (MW) required to reduce risk of major
load shedding >0.002% to a one-in-10 year event
2019-20 0
2020-21 0
2021-22 0
2022-23 0
2023-24 135
2024-25 150
2025-26 95
2026-27 100
2027-28 70
2028-29 105
It should be noted that the reliability projections do not incorporate:
• The impact of the temporary diesel generators in South Australia this summer (or their change to market
scheduled generators next year). These generators are expected to be available for use as a last resort to
avoid load shedding in South Australia and may be offered for service in the RERT.
• Transmission or generation investment that is not yet committed. EnergyConnect was not assumed
committed in the assessment, as the AER is yet to make its final decision on this investment.
• Any actions that may be taken under RERT this summer.
They reliability forecasts also represent USE outcomes before any equitable load shedding principles are
applied, as discussed in the next section.
7.4.2 Short-term reliability risks this summer
Figure 34 indicates that the level of USE in South Australia is projected to be below the reliability standard this
summer. However, the projections provided in the ESOO do not incorporate the impact of the equitable load
shedding principle applied in the NEM. Instead, the annual USE reported in a region reflects the source of any
supply shortfall and is intended to provide participants with the most appropriate locational signals to drive
efficient market responses.
An equitable load shedding principle applies in the NEM to avoid unfairly penalising one region for a supply
deficit spread through several interconnected regions83.
While the ESOO analysis does not consider this principle, any risks of load shedding projected in Victoria
could result in the supply deficit being shared across both Victoria and South Australia if there is headroom
on the interconnectors.
83 See NER clause 4.8.9(i) and the Reliability Panel’s Guidelines for Management of Electricity Supply Shortfall Events, at https://www.aemc.gov.au/sites/
default/files/content//Guidelines-for-Management-of-Electricity-Supply-Shortfall-Events.PDF.

© AEMO 2019 | South Australian Electricity Report 64
For Victoria, prior to actions being taken to procure additional reserves, the expected level of USE is just
above the reliability standard for this summer, with a tight supply-demand balance exacerbated by the risk of
delayed return to service of units currently on long-term outages (Loy Yang A2 and Mortlake Unit 12).
7.4.3 Managing forecast reliability risks
Given the potential USE risk forecast in Victoria, the application of the equitable load shedding principle could
result in greater supply scarcity risks in South Australia this summer than forecast in the ESOO. AEMO is
working with the Victorian and South Australian Governments and relevant industry parties to lower this risk.
This includes:
• Procuring RERT, where permitted by the NER, to supplement the AEMO/ARENA demand response trial
(see Section 7.2.1) which is still running.
• Working with generators and transmission network service providers (TNSPs) to maximise resource
availability during the summer months.
7.5 Regulatory changes to improve reliability and security
Several important changes to the NEM’s regulatory framework have been, or are being, implemented that will
support security and reliability of the South Australian power system, as discussed below.
Protected event declaration
Following the 28 September 2016 black system event in South Australia, AEMO initiated an operational action
plan to limit flow on the Heywood interconnector during destructive wind conditions in South Australia
(under NER 4.3.1(v)). For transparency, and to provide certainty to the market, AEMO submitted a request to
the Reliability Panel to declare these conditions as a protected event, which was approved by the Reliability
Panel in June 2019. Based on historical weather conditions, AEMO expects this protected event will be
activated approximately twice per year.
Frequency control and power system resilience
In response to both the findings of the 28 August 2018 system event and overall long-term degradation in
frequency control quality, AEMO has submitted two new rule change requests to the AEMC. These aim at
significantly increasing primary frequency response (PFR) in the NEM, which is a key component of frequency
control that is poorly catered for in the current NER.
AEMO’s two rule change proposals focus on:
• Changes to the NER requiring all capable scheduled and semi-scheduled generating units to operate
continuously in a frequency responsive mode as defined in a proposed instrument called the PFRR
(Primary Frequency Response Requirements).
• Changes to the NER to remove a number of disincentives to generators providing PFR. AEMO has also
commenced a targeted scope consultation on the Causer Pays Procedure and the Market Ancillary
Services Specification (MASS) to address elements of these existing disincentives. This Consultation is
expected to be completed in the first quarter of 2020, but has some dependency on the progress of the
AEMC’s rule change process.
The AEMC has combined the above two proposals with another rule change request by Dr Peter Sokolowski
that proposes a mandatory PFR, similar to AEMO’s first proposal84.
Final determinations on these proposed Rules are expected in early 2020.
84 See https://www.aemc.gov.au/news-centre/media-releases/consultation-commences-proposed-rules-better-control-power-system.

© AEMO 2019 | South Australian Electricity Report 65
Mechanisms to enhance power system resilience
The Council of Australian Governments (COAG) Energy Council asked the AEMC to identify and report on any
systemic issues which contributed to the black system event in South Australia on 28 September 2016.
As part of this review, the AEMC has proposed measures to identify and manage different categories of
power system security risk, including expanding the way in which AEMO manages power system security risk
from two sources of uncertainty (credible indistinct risks and non-credible indistinct risks).
The measures proposed by the AEMC include:
• Adding a variable margin to the largest single credible contingency for which AEMO maintains a secure
operating state for credible indistinct risks.
• Expanding the existing power system frequency risk review to cover a broader range of potential risks
impacting power system security (beyond frequency events).
• Streamlining and extending the protected events framework and providing for an ‘ad hoc protected
operation’ framework, allowing AEMO to manage ‘non-credible indistinct’ risks emerging in real time
without a protected event declaration.
• Monitoring interconnector flows against a standard for non-credible indistinct risks.
AEMO has closely engaged with the AEMC throughout the review process and provided two submissions to
the AEMC’s staff discussion paper85. A final report is expected to be published in December 2019.
System restart services, standards, and testing
The NEM power system continues to transition away from the traditional synchronous generation and load
centres that characterised the grid when the current system restart ancillary services (SRAS) framework was
introduced. To maintain reliable and sustainable capability to restart the NEM power system, AEMO
submitted a rule change proposal to the AEMC on 29 July 2019 to change the NER for the purposes of:
• Incentivising the provision of both system restart and restoration support capabilities from a range of
different technologies.
• Facilitating more extensive testing to verify the viability of system restart paths, increasing the level of
assurance that system restoration will succeed.
On 19 September 2019, the AEMC commenced consultation on this rule change proposal86, consolidated with
a rule change request from the AER that aims to improve clarity and transparency of obligations of parties
involved in the SRAS framework.
The final determination is expected to be published in May 2020.
Retailer Reliability Obligation
In 2018-19, the Energy Security Board (ESB) developed legislation and NER amendments to give effect to the
Retailer Reliability Obligation (RRO)87. The objective of this obligation is to incentivise retailers and other
market customers to support the reliability of the NEM through contracting and investment in resources. The
RRO commenced on 1 July 2019 with the first reliability gap assessments in the 2019 ESOO for the NEM.
No T-3 reliability instrument request has been made by AEMO this year for South Australia or any other NEM
region, since the expected USE forecast for 2022-23 in the 2019 ESOO did not meet the “material reliability
gap” threshold of 0.002% of total energy consumed.
85 AEMO’s submission is at https://www.aemc.gov.au/sites/default/files/2019-09/AEMO%20-%20Submission%20to%20the%20Discussion%20Paper%20-
%20EPR0057.pdf.
86 The consultation paper is on the AEMC’s website, at https://www.aemc.gov.au/rule-changes/system-restart-services-standards-and-testing.
87 For more on the Retailer Reliability Obligation, see http://www.coagenergycouncil.gov.au/publications/consultation-retailer-reliability-obligation-
legislative-amendments and Chapter 4A of the NER.
© AEMO 2019 | South Australian Electricity Report 66
Under the South Australian application legislation88, the South Australian Minister has powers to make a T-3
reliability instrument for the South Australian region three years out (and 15 months out in transitional years).
Modifying the reliability standard
The current reliability standard is based on the expected USE within a given financial year not exceeding
0.002%. Because applying this standard requires the averaging of annual USE over all possible outcomes, it
effectively averages out the risk of experiencing the rapidly growing number of events which can cause severe
load shedding over the summer period. While AEMO has attempted to ‘operationalise’ the risks within the
existing standard as much as possible, a modified reliability framework that enables AEMO to ensure
customers are not exposed to significant involuntary load shedding in nine out of 10 years is necessary. As
highlighted in the 2019 ESOO, AEMO is exploring the development of a modified standard that can more
cost-effectively and reliably provide the requisite level of dispatchable resources.
Integrating energy storage systems into the NEM
AEMO has submitted a rule change request to the AEMC that would more efficiently accommodate
increasing numbers of connection points with bi-directional electricity flows89. Various elements of this
proposal would support power system reliability and security outcomes, including:
• Clarifying the treatment of bi-directional facilities in the reliability standard and the RRO.
• Improving the way in which bi-directional facilities are accounted for in market forecasting processes.
• Improving the information in the central dispatch process for bi-directional facilities.
• Applying appropriate technical requirements and performance standards to bi-directional facilities.
This request is pending initiation by the AEMC.
DER Register
AEMO is in the final stages of the initial implementation of a DER Register for the NEM, which is scheduled
to commence on 1 December 2019. This follows the AEMC’s September 2018 approval of amendments to
the NER. The register will provide AEMO, NSPs, and other stakeholders with static data about DER. This will
support improvements to AEMO’s forecasting and power system modelling and improved power system and
network operation, and promote better investment decisions for NSPs.
Updates to Australian Standards
The current performance standards for smaller distribution-connected generation do not capture all the
performance requirements needed to optimise and support a secure power system under high levels of DER
penetration, support energy affordability energy and allow consumers to pursue individualised services.
AEMO is currently working on reviewing both AS/NZS4777.2 and AS/NZS4755 to better support power
system security90, including amendments to:
• Improve clarity regarding withstand requirements and align with international best practice and the NER.
• Optimise and coordinate both Volt-Var and Volt-Watt settings to maximise these capabilities.
• Define measurement accuracy for protection and control functions.
• Review mechanisms for promoting compliance within the standards.
• Introduce appropriate measures to coordinate or remote query device settings, while supporting system
wide cyber-security.
These adaptations are occurring as part of the Australian Standards processes.
88 National Electricity (South Australia) (Local Provisions) Regulations 2019.
89 For more on this Rule change request, see https://www.aemc.gov.au/rule-changes/integrating-energy-storage-systems-nem.
90 See https://www.aemo.com.au/Electricity/National-Electricity-Market-NEM/DER-program/Standards-and-Protocols.

© AEMO 2019 | South Australian Electricity Report 67
8. Future developments
The 2018 ISP identified several strategic developments that would support economic
utilisation of NEM generation assets to deliver energy to consumers reliably, securely, and
at least cost.
For South Australia, this included the development of interconnection between South
Australia and New South Wales (EnergyConnect, currently pending regulatory approval),
synchronous condensers to address issues of system strength, and orchestration methods
for DER.
Recent market developments and government initiatives are also providing strong signals
for increased generation supply in the future.
8.1 Relating the Integrated System Plan to South Australia
In July 2018, AEMO published the inaugural ISP91. The ISP focused on the optimal integration of renewable
energy zones (REZs) into an overall strategic NEM-wide network development plan. The next ISP will be
published in 2020, with a Draft due to be published for consultation in December 2019.
The ISP has reinforced the need for independent, integrated, transparent, NEM-wide planning, rather than
project-by project-assessments, to optimise local project requirements. The strategic developments of a
portfolio of network and non-network developments provide critical diversity and reliability benefits from
existing and new diverse renewable resources, maximising the value from available resources and
infrastructure and minimising the overall investment needs.
Outcomes from the ISP studies relating to the South Australian network included:
• The need for synchronous condensers to be progressed as soon as possible to supply both system
strength and inertia to the South Australian region.
• The need for a new interconnection between South Australia and New South Wales.
• The importance of coordinating DER to realise the potential it could provide to the market and system
operations.
The ISP demonstrated potential REZ development areas in South Australia which are supported by existing
transmission capacity and system strength. These were Northern South Australia (solar) and Mid-North
(wind). The Riverland REZ was identified as an optimal area for development in conjunction with new
transmission investment between South Australia and New South Wales.
Figure 35 shows the South Australian REZ candidates considered in the analysis.
The ESB is currently undertaking a review on how to best make the ISP actionable92.
91 See http://www.aemo.com.au/Electricity/National-Electricity-Market-NEM/Planning-and-forecasting/Integrated-System-Plan.
92 See http://coagenergycouncil.gov.au/publications/energy-security-board-converting-isp-action.

© AEMO 2019 | South Australian Electricity Report 68
Figure 35 South Australian Renewable Energy Zone candidates
8.1.1 Progress of transmission projects
System strength
Following AEMO’s declaration93 of a system strength gap in South Australia in October 2017, ElectraNet
investigated options to address system strength and inertia while also keeping costs down (refer to the Main
Grid System Strength Contingent Project)94. The installation of synchronous condensers on the network was
determined to be the most efficient, cost-effective option.
A synchronous condenser operates in a similar way to large electric motors and generators. It contains a
synchronous motor whose shaft spins freely and can adjust technical conditions on the power system.
Synchronous condensers are an important source of system strength and inertia and are essential irrespective
of future new interconnection development.
From a regulatory standpoint, ElectraNet’s project utilised transitional provisions within the NER relating to
system strength, rather than the RIT-T process. Under this alternate approach, ElectraNet lodged an
economic evaluation report with the AER on 18 February 201995. After submitting a contingent project
application (to allow ElectraNet to access funds for this project) on 28 June 2019, the AER approved funding
for the project on 9 August 2019.
In August 2019, ElectraNet provided an update on this project96, estimating that the first two of four planned
synchronous condensers will be installed at the Davenport substation in mid-2020, and the second two will
be installed at the Robertstown substation by the end of 2020. ElectraNet estimates that the full solution will
be commissioned by early 2021.
93 As identified in the Update to the 2016 NTNDP, October 2017, at https://www.aemo.com.au/-/media/Files/Electricity/NEM/Planning_and_Forecasting/
NTNDP/2017/Second_Update_to_the_2016_NTNDP.pdf.
94 AER. ElectraNet – Main Grid System Strength Contingent Project, at https://www.aer.gov.au/networks-pipelines/determinations-access-arrangements/
contingent-projects/electranet-main-grid-system-strength-contingent-project.
95 ElectraNet. Addressing the System Strength Gap in SA, at https://www.aer.gov.au/networks-pipelines/determinations-access-arrangements/contingent-
projects/electranet-economic-evaluation-main-grid-system-strength-project-contingent-project-trigger.
96 ElectraNet. Strengthening South Australia’s power system, at https://www.electranet.com.au/what-we-do/projects/power-system-strength/.

© AEMO 2019 | South Australian Electricity Report 69
Figure 36 Proposed synchronous condenser solution in South Australia
Source: ElectraNet
EnergyConnect – a new interconnection between South Australia and New South Wales
The 2016 NTNDP97 recommended that a new interconnector be established between New South Wales and
South Australia. This outcome was confirmed in the 2018 ISP, which indicated that a major new interconnector
between South Australia and New South Wales was expected to be economically beneficial, under almost all
plausible futures98.
This upgrade would:
• Allow energy from other NEM regions to be transported to South Australia, providing cost reductions in
South Australia through fuel savings from reduced GPG requirements.
• Allow for potential new REZs to be accessed along the new transmission corridor.
• Help use resources more efficiently across the NEM, with greater supply sharing between New South
Wales, Victoria, and South Australia
In February 2019, ElectraNet completed the South Australia Energy Transformation RIT-T, which demonstrated
that a new South Australia to New South Wales interconnector would deliver economic benefits and reduce
residential electricity bills99.
The option recommended by ElectraNet is consistent with the ISP100 and is shown in Figure 37.
97 AEMO. 2016 NTNDP, at https://www.aemo.com.au/-/media/Files/Electricity/NEM/Planning_and_Forecasting/NTNDP/2016/Report/2016-NATIONAL-
TRANSMISSION-NETWORK-DEVELOPMENT-PLAN.pdf.
98 The ISP assessed potential developments under a range of scenarios so modelling outcomes would be robust. See Chapter 2 of the ISP, at
http://www.aemo.com.au/Electricity/National-Electricity-Market-NEM/Planning-and-forecasting/Integrated-System-Plan.
99 See https://www.electranet.com.au/projects/south-australian-energy-transformation/ for more information.
100 ElectraNet. South Australia Energy Transformation RIT-T, at https://www.electranet.com.au/projects/south-australian-energy-transformation/.

© AEMO 2019 | South Australian Electricity Report 70
Figure 37 Interconnector options and variants assessed by ElectraNet in the SAET RIT-T
Source: ElectraNet
The regulatory approval for EnergyConnect is currently pending the AER’s determination that the RIT-T has
been satisfied. If approved, the interconnector has an estimated delivery time of 2022 to 2024, depending on
the time taken to gain environmental and other necessary approvals. The South Australian Government is
supporting the early completion of this link in stages.
8.2 Integration of Distributed Energy Resources (DER)
AEMO has established a DER Program101 focused on optimising the integration of these resources into the
grid. The aim is to create a DER market that will allow consumers to maximise the full value of their systems
by enabling them to not just generate and export energy, but for DER to also provide system security services
or potentially peer-to-peer energy trading.
To deliver this, the DER Program is trialling VPPs, including one in South Australia, implementing a DER
Register, and working on improving inverter Standards. These Standards will ensure DER deliver state-of-art
capabilities that support system security while also enabling consumers to access such new services at a time
of their choosing.
AEMO is working in collaborative partnership with Energy Networks Australia, and AEMO and distribution
network service providers (DNSPs) are designing the Distribution System and Distribution Market Operator
roles that will enable the operating framework for VPPs to integrate into AEMO’s management of the power
system.
In South Australia, the focus is also on system analysis, so AEMO can better operate a power system with high
levels of DER penetration. This includes work in collaboration with SAPN on managing minimum demand and
considering any technical limits to DER export into the transmission system.
101 See https://www.aemo.com.au/Electricity/National-Electricity-Market-NEM/DER-program for more information.

© AEMO 2019 | South Australian Electricity Report 71
8.3 Additional supply developments
As at 14 November 2019102, new generation investment in South Australia continues to focus on renewable
developments and battery storage/VPP, with the largest projects in these categories being:
• Goyder South hub – wind (1,200 MW).
• Yorke Peninsula Wind Farm (up to 635.8 MW).
• Goyder South Hub – solar (600 MW).
• Bridle Track Solar Project (up to 300 MW).
• Goyder South Hub – BESS (900 MW).
• SA Government VPP – stage 3 (245 MW).
Given the penetration of renewable generation, there will be increasing value in generation technologies that
can complement the natural variability of renewable generation by providing rapid start capabilities and
increased operational flexibility, such as battery or pumped hydro storages, or flexible thermal generation.
As at 14 November 2019, AEMO’s Generation Information update identified 65 energy generation
developments in South Australia, totalling 10,773 MW. Table 15 aggregates these developments by energy
source, while Figure 38 shows the location and capacity of only those projects whose status is reported as
more advanced than Publically announced103.
Table 15 South Australian prospective generation projects by energy source, as at 14 November 2019
Energy source Number of
projects
Capacity
(MW)
Capacity (% of
total projects
tracked)
Change in number
of projects from
July 2018
Change in
capacity from
July 2018 (MW)
Gas 9 715 6.6% 3 -164
Diesel 0 - 0.0% -1 -30
Solar 23 3,271 30.4% 2 665
Biomass 0 - 0.0% -1 -15
Wind 13 4,027 37.4% 0 1,083
Water 7 995 9.2% 4 240
Storage – battery and VPP 13 1,765 16.4% 3 1,247
Total 65 10,773 100.0% 10 3,026
Note: on 19 November 2019, Neoen announced104 that Hornsdale Power Reserve will be expanded by 50% to 150 MW capacity, however
this announcement was outside of the reporting period for Generation Information reported in the 2019 SAER. Therefore, it is not
included in this table or the report commentary.
102 Date based on latest AEMO Generation Information Page at 14 November 2019. More recent information may be available by time of publication, at
https://www.aemo.com.au/Electricity/National-Electricity-Market-NEM/Planning-and-forecasting/Generation-information.
103 Refer to project status definitions on AEMO’s Generation Information Page, 14 November 2019, at https://www.aemo.com.au/Electricity/National-
Electricity-Market-NEM/Planning-and-forecasting/Generation-information.
104 See https://hornsdalepowerreserve.com.au/hornsdale-power-reserve-to-be-expanded/

© AEMO 2019 | South Australian Electricity Report 72
Figure 38 Location and capacity of South Australian generation projects

© AEMO 2019 | South Australian Electricity Report 73
9. Gas supply for GPG
AEMO’s 2019 Gas Statement of Opportunities105 (GSOO) for eastern and south-eastern
Australia highlights that the gas supply-demand balance is projected to remain tight, with
production in Southern Australia continuing to decline, and supplies from Queensland
limited by pipeline capacity. The 2019 GSOO forecasts the potential for supply gaps from
2024 onwards, unless additional southern reserves and resources, or alternative
infrastructure, are developed.
The 2019 GSOO supply adequacy forecasts for eastern and south-eastern Australia do not identify
region-specific risks, but the report contains further information on gas adequacy, and on potential
opportunities for infrastructure investment or reserves development, under a range of future scenarios.
9.1 South Australian gas consumption forecasts
Over the next 10 years, significant reductions in South Australia’s total demand for natural gas are expected
compared to historical usage, due primarily to reduced demand for gas for GPG, as shown in Figure 39.
Figure 39 South Australian gas consumption – historical and forecast (Neutral scenario), 2014 to 2038
This GPG projection is based on generation and interconnector outcomes from AEMO’s 2018 ISP, with new
interconnector development and high penetration of new renewable generation and storage technologies.
105 AEMO, 2019 GSOO, March 2019, at http://aemo.com.au/Gas/National-planning-and-forecasting/Gas-Statement-of-Opportunities. The published GSOO
report does not include region-specific forecasts, but forecast data is available at http://forecasting.aemo.com.au/.

© AEMO 2019 | South Australian Electricity Report 74
The potential construction of the EnergyConnect interconnector between South Australia and New South
Wales, combined with new renewable generation driven by the Victorian Renewable Energy Target (VRET)
and federal Large-scale Renewable Energy Target (LRET), are forecast to lead to lower levels of annual
generation from South Australian GPG. GPG will still be required to meet South Australian demand in periods
when the sun is not shining and there is little or no wind, but demand for gas will become more variable
across the year.
While GPG usage in South Australia is forecast to increase between 2025 and 2038 as further coal generation
is forecast to retire in the NEM, within this timeframe AEMO does not forecast GPG levels returning to the
levels seen historically.
Over this same period, residential and commercial gas consumption is forecast to have a very minor decline,
due to connections growth being outpaced by the expectation of further energy efficiency measures and
increases in the preference for fuel switching to using electrical appliances instead of gas. The industrial
sector is forecast to remain stable at current levels out to 2038, with no strong drivers for growth identified
that would alter consumption patterns for the industrial segments.
9.2 Natural gas reserves and resources, and infrastructure
South Australia has traditionally sourced natural gas from the Otway, Cooper and Eromanga basins106. Over
the past several years, the LNG export market has changed domestic contract dynamics, such that a large
portion of the supply from the Cooper and Eromanga basins is being used for LNG export. However,
declining supplies from the Otway basin are driving this trend to reverse again, with Cooper and Eromanga
basin gas and further supplies from Queensland being sent south to meet demand in South Australia and the
other southern states.
As at 31 December 2018, eastern and south-eastern Australian proven plus probable (2P) natural gas
reserves107 totalled 42,633 petajoules (PJ), of which 12,830 PJ was classified as developed.
The total gas produced across eastern and south-eastern Australia during the 2018 calendar year was 1,818 PJ.
Based on advice from gas producers, and as reported in the 2019 GSOO, total gas production across eastern
and south-eastern Australia is forecast to increase from 1,933 PJ in 2019 to 2,063 PJ in 2022. These production
forecasts, however, include volumes from fields not yet producing, with some level of uncertainty as to
whether they will eventuate. If these anticipated projects are removed from the production forecasts and only
currently producing fields and committed projects are considered, the east coast production forecasts
indicate that only 1,984 PJ may be produced in 2022, a difference of 79 PJ.
Natural gas is delivered to South Australia through an interconnected pipeline network from Victoria, New
South Wales, and Queensland, as well as from the Cooper Basin.
Table 16 lists the major gas pipelines that supply natural gas to South Australian consumers, and Figure 39
shows the gas producing basins and infrastructure supplying eastern and south-eastern Australia.
Gas can flow from Queensland to South Australia via the South West Queensland Pipeline and the Moomba
processing facility in the Cooper Basin. Gas supplied from offshore Victoria can be delivered to South
Australia either:
• Directly along the South East Australia Pipeline, or
• Via multiple pipelines in an anti-clockwise direction through the Victoria–New South Wales Interconnector,
the Moomba to Sydney Pipeline, then south along the Moomba to Adelaide Pipeline System.
106 The Cooper and Eromanga basins span South Australia, New South Wales, and Queensland, and the point of gas extraction may not necessarily be in
South Australia.
107 2P is considered the best estimate of commercially recoverable reserves.

© AEMO 2019 | South Australian Electricity Report 75
Figure 40 Gas producing basins and infrastructure supplying eastern and south-eastern Australia

© AEMO 2019 | South Australian Electricity Report 76
Table 16 Major gas pipelines relating to South Australia
Gas pipeline Length (km) Year of first
gas flow
Capacity reported (Terajoules [TJ]/d)
Moomba to Adelaide Pipeline 1,185 1969 246 (South), 85 (North)
Moomba to Sydney Pipeline 2,030 1998 489 (South-East), 120 (North-West)
South East Australia Gas Pipeline 680 2004 250**
South West Queensland Pipeline* 937 1996 404 (West), 340 (East)
Victoria – New South Wales Interconnector 143 1998 223 (North), 159 (South)
* Includes the Queensland – South Australia – New South Wales (QSN) Link.
** South East Australia Gas Pipeline capacity has been reduced to 250 TJ/d as some of the capacity has been converted to storage.
9.2.1 Daily demand for GPG supply
In 2018–19 GPG continued to play an important role in meeting South Australia’s electricity demand,
particularly when the wind was still and solar generation output was low, as demonstrated in Figure 27 (in
Section 7.1.2).
Since the closure of Northern Power Station in May 2016 and Victoria’s Hazelwood Power Station in March
2017, South Australia’s reliance on GPG when VRE generation is low has increased and, coupled with more
VRE being installed, has led to increases in daily gas demand and more frequent peaks. Since summer 2018-
19 the variability in gas demand for power generation has become increasingly apparent, with clear peaks and
troughs in demand as wind generation varied due to passing weather systems. The recent poor reliability of
Victorian coal-fired generators has further contributed to this increase in GPG gas demand volatility.
Figure 41 shows that there has been an increase in the number of days when total gas demand (gas system
demand108 and power generation) exceeded 300 TJ/d compared to 2015. The increase in South Australian gas
system demand during the winter months for residential heating is also apparent. Total gas demand
approached 400 TJ/d on several days during winter 2018 and winter 2019.
The figure also shows that, over the same time period, combined gas pipeline capacity (Moomba to Adelaide
Pipeline and South East Australia Gas Pipeline) has been reducing, with daily demand for gas getting close to
pipeline capacity several times in 2019.
During periods of very high South Australian GPG, liquid fuel (usually diesel) is used to supplement gas
supplies. Figure 42 compares the output of GPG compared to the natural gas usage information from the Gas
Bulletin Board (GBB). This additional information has only been available on the GBB since 1 October 2018.
Outside of Victoria, AEMO does not have real-time gas pipeline flow information, and it does not have access
to liquid fuel usage and inventories for any power stations. Discrepancies between the generation data and
GBB data in Figure 42 are an indicator of when liquid fuel may have been used to supplement gas supplies.
In both Figure 41 and Figure 42 two large spikes in “gas” powered generation output are evident:
• The winter 2016 event coincided with an outage on the Victoria – South Australia interconnector. AEMO
was advised of very high diesel use for power generation during this outage.
• The second spike, in late January 2019, was during the heat event that impacted South Australia and
Victoria. This event included Victorian load shedding on 24 and 25 January due to high electricity demand
coupled with coal-fired generator outages (the 24 January Victorian demand reduction also assisted South
Australia).
Liquid fuel was also used to support gas fired generation output during this heat event.
108 System demand comprises of residential, commercial and industrial gas usage.

© AEMO 2019 | South Australian Electricity Report 77
Figure 41 South Australian daily gas usage and pipelines capacities (October 2014 to October 2019)
Note: data is derived from analysis of GBB flows and capacities, and NEM generation data.
Figure 42 South Australian gas generation demand (October 2014 to October 2019)

© AEMO 2019 | South Australian Electricity Report 78
A1. Data sources and reporting methodology
A1.1 Introduction
This section outlines and clarifies the various data sources used throughout the 2019 SAER and its
corresponding data files, as well as relevant analysis/reporting methodologies employed.
Each aspect considered can be assumed to apply throughout the report and data files, except where noted
by any listed exceptions.
A1.2 Times and dates
Timestamps shown in analysis (figures and tables) are NEM time (market time) – that is, Australian Eastern
Standard Time (AEST) with no daylight savings, unless otherwise indicated. However, where times are written
throughout the report text, they will be in local time (Adelaide time, and adjusted where necessary for
daylight savings).
In line with electricity industry seasonal forecasting and reporting, “summer” refers to the period from
1 November to 31 March, and “winter” from 1 June to 31 August. “Shoulder” refers to 1 September to
31 October and 1 April to 31 May.
For selected metrics, denoted in their title by use of the word “workday”, all Saturdays, Sundays and gazetted
South Australian public holidays have been excluded from analysis.
A1.3 Prices
A1.3.1 Electricity
Electricity price analysis used 30-minute (ending) spot prices for each NEM region as relevant to the metric.
Unless otherwise stated in the title of the metric, analysis is using nominal dollar values. For certain metrics
labelled as “real June 2019”, the trends (or input to the trends) are presented in real June 2019 dollars, using
the Adelaide Consumer Price Index (CPI) as the basis for adjustment.
A1.3.2 Gas
Reported prices come from the average of daily ex-ante price for each market analysed. The markets
referenced, with regards to the figures as numbered in the data file, are:
• Short Term Trading Market (STTM) Adelaide Hub for “ADL” in Figure 6.5, and “South Australia” in Figure
6.14.
• STTM Sydney Hub for “SYD” in Figure 6.5.
• STTM Brisbane Hub for “BRI” in Figure 6.5.
• Victorian declared wholesale gas market (DWGM) for “VIC” in Figure 6.5.

© AEMO 2019 | South Australian Electricity Report 79
A1.5 Generation capacity
The SAER and its data files report on a variety of capacities for the supply sources reported on. The megawatt
capacity used in any given analysis will depend on what is available and what is reasonable for the metric
being sought.
The general principles for capacity sources are:
• AEMO registered capacity is used for registered generators.
– ONSG references AEMO registered capacity if available, otherwise an approximate value obtained
by AEMO.
• Estimated aggregate capacity is used for rooftop PV and PVNSG, as outlined in Section A1.8.
• Nameplate capacity (including forecast nameplate capacity) is used for metrics concerning AEMO
published Generation Information.
• Interconnector capacity is not included in analysis of generation capacity, but where reporting on
interconnector power flows, it is sometimes compared to its nominal capacity at a point in time (without
considering shorter-term constraints that can apply).
Capacity analysis rules include:
• Exclusion of wind farm output and/or capacity applies for the time before the wind farm first reached 90%
of registered capacity, unless specifically noted otherwise.
• For “capacity factor” analysis, all generators exclude periods when, for the analysis period in question,
there was not a long enough portion of the time that had generator at normal availability. Such exclusion
reasons could include market withdrawals or commissioning periods.
A1.6 Data sources for generation and supply
Most of the analysis for electricity generation and supply (including consumption and demand) is based on
5-minute averages of AEMO’s SCADA metering, including scheduled generators and loads, significant non-
scheduled wind farms and diesel generators, as well as interconnector flows. In cases where analysis is at the
30-minute level, the six relevant 5-minute averages are averaged further to a 30-minute value.
Exceptions include:
• Rooftop PV and PVNSG – refer to Section A1.8.
– Note that Figure 9 uses ASEFS2 estimates for rooftop PV rather than the ESOO modelling used in the
rest of the reporting.
• ONSG – aggregated from settled market meter data.
• Historical minimum or maximum operational demand as measured over a given period, for example, daily,
seasonal and yearly values in various figures and tables – these are taken from 30-minute averages of
AEMO’s SCADA metering.
• Figure 9 and Figure 30 use either 5-minute snapshots or 30-minute averages of AEMO’s SCADA metering.
– Figure 30 also makes estimates of expected wind farm output had there been no curtailment directed.
• Figure 31 and Figure 32 have specific data sources as listed under the figures in the report.
© AEMO 2019 | South Australian Electricity Report 80
A1.7 Consumption and demand definitions
Consumption refers to electricity used over a period of time and is measured in GWh, whereas demand refers
to electricity used at a particular time (or the average over a short period of time like five or 30 minutes) and
is measured in MW.
This report generally considers consumption or demand over reporting periods such as a financial year,
summer, winter or calendar month.
For historical and forecast consumption or demand based on annual or seasonal periods, the 2019 SAER uses
outcomes from the 2019 ESOO, noting that the 2018-19 annual consumption value builds on the 2019 ESOO
value by providing full year actual estimates.
A1.7.1 Operational reporting
This report often presents AEMO’s operational data for historical results, estimates, and forecasts. Operational
data comprises the electricity consumed by the NEM’s transmission and distribution networks to supply
residential and business customers, as well as the inherent electrical losses in the networks.
Furthermore, operational reporting is defined as that electricity supplied by scheduled, semi-scheduled, and
significant non-scheduled generating units, and includes net interconnector imports when reporting on a
particular NEM region. It excludes electricity used by scheduled loads (such as scheduled battery storage
units) or electricity supplied by SNSG and rooftop PV.
Table 4.12 in the data file lists the South Australian generators included in the operational reporting for the
2019 SAER. The exception is Figure 9 in the report, which uses a slightly different set of generators, as there
were some changes that occurred to the operational list from October 2019 (due to reclassification of the
Temporary Generation North and South diesels to be excluded, and the registration of Barker Inlet Power
Station and Lake Bonney BESS1).
A1.7.2 Underlying reporting
Underlying consumption and demand refer to electricity consumed by customers at their premises, supplied
from both the grid and rooftop PV combined (including any estimated battery storage assumed
charge/discharge patterns), but it does not include any contribution from SNSG.
A1.7.3 “Sent-out” versus “as-generated” data
Sent-out data is measured at each generating system’s connection point. This represents the electricity
supplied to the market, and excludes its auxiliary loads. As-generated data, measured at each generating unit
terminal, represents its entire output, including the energy supplied to its auxiliary loads.
Analysis in this report and its data files is as-generated, except where explicitly noted that it is sent-out.
A1.8 Generator fuel grouping
When reporting on generation supply by fuel or energy groupings, whether for capacity or generation:
• Gas refers to scheduled gas generation only.
• Wind refers to semi-scheduled and significant non-scheduled wind farms.
• Solar refers to semi-scheduled solar PV farms only.
• “Storage – Battery” refers to the generation output of scheduled battery energy storage systems.
• Rooftop PV refers to behind-the-meter rooftop solar PV systems up to 100 kW capacity (so excluding
PVNSG).

© AEMO 2019 | South Australian Electricity Report 81
• ONSG refers to other non-scheduled generation as described in Table 4.16 of the data file. Note that the
fuel types in the ONSG category could overlap with other categories, but the reporting remains in the
ONSG (and SNSG) category only.
• PVNSG refers to PV non-scheduled generation as described in Section 2.2 of the report.
• SNSG refers to ONSG plus PVNSG.
• “Diesel + SNSG” refers to scheduled diesel units, the Temporary Generation North and South generators
and SNSG.
– Diesel, if mentioned apart from the above definition, comprises only scheduled and diesel units plus
Temporary Generation North and South generators.
A1.9 Solar PV estimates
A1.9.1 Rooftop PV
Capacity and generation methodology for rooftop PV are outlined in Section 2.1. Noting that methodology is
improved for 2019 compared to 2018 reporting, rooftop PV related metrics will not be the same as in the 2018
SAER, even for coincident time periods analysed.
Furthermore, in the 2019 SAER and data files, the rooftop PV capacity and generation estimates build further
on those used for the 2019 ESOO, incorporating updated estimates principally for 2018-19.
For comparisons in reporting year, shown in various metrics, it is to be noted that the 2018 ESOO (and
likewise the 2018 SAER) maintained the same rooftop PV installed capacity forecasts (and hence generation
forecasts) across all its scenarios.
A1.9.2 PVNSG
The 2019 ESOO modelled PVNSG capacity using estimates from APVI data available at https://pv-
map.apvi.org.au/power-stations, for generators in the range 100 kW to 30 MW, with data up to April 2019.
This is contrasted to the 2018 ESOO, which used CER data directly.
For PVNSG generation analysis, the 2019 ESOO used the Solar Advisory Model (https://sam.nrel.gov/), which
is different to the modelling for the 2018 ESOO.
The SAER uses ESOO outcomes for PVNSG in both the 2018 and 2019 reports, so reported data for 2019 will
not match that of 2018 (due to above capacity input and generation modelling differences), even for
coincident time periods analysed.
Furthermore, the 2019 SAER’s PVNSG capacity and generation estimates build further upon those used for
the 2019 ESOO, incorporating updated estimates for the entire historical reporting period, based on more
recent APVI capacity data.
A1.10 Interconnector flows
In some interconnector-related metrics, individual interconnectors are reported on separately, and will be
named as appropriate (Heywood or Murraylink).
However, for many metrics, the “combined” or “total” interconnector flows are reported, and this is assumed
to be the case even without these qualifying descriptors denoted.
In these cases, the data reported is taken as the time-aligned net MW flow in to or out of South Australia, at
every 5-minute (averaged) period considered. The time-aligned data is then averaged further (to say
30 minutes) or aggregated, to say an annual GWh amount.
Thus, the combined or total interconnector metrics represent analysis of net boundary flows to or from South
Australia at each point in time.

© AEMO 2019 | South Australian Electricity Report 82
A2. Data spreadsheet index
As part of the SAAF suite, several data spreadsheets are available online for download109. These data
spreadsheets contain all the tables and data underpinning the figures presented in this report, as well as
additional tables and figures not covered in this report.
The tables below allow for the mapping of the tables and figures in this report to their corresponding items in
the data spreadsheets, where applicable.
A2.1 Tables
Report table number Corresponding data pack
table number
Table 1 N/A
Table 2 Table 3.3
Table 3 Table 3.2
Table 4 Table 4.3
Table 5 Table 4.25
Table 6 Table 4.4 and Table 4.5
Table 7 Table 4.8
Table 8 Table 4.9
Table 9 Table 6.1
Table 10 Table 7.5
Table 11 Table 7.3
Table 12 Table 7.4
Table 13 Table 7.6
Table 14 Table 7.7
Table 15 Table 8.2
Table 16 Table 9.1
109 At https://www.aemo.com.au/Electricity/National-Electricity-Market-NEM/Planning-and-forecasting/South-Australian-Advisory-Functions.

© AEMO 2019 | South Australian Electricity Report 83
A2.2 Figures
Report figure number Corresponding data pack
figure number
Report figure number Corresponding data pack
figure number
Figure 1 Figure 2.1 Figure 22 Figure 6.9
Figure 2 Figure 2.2 Figure 23 Figure 6.15
Figure 3 Figure 2.3 Figure 24 Figure 6.14
Figure 4 Figure 2.4 Figure 25 Figure 6.7
Figure 5 Figure 3.1 Figure 26 Figure 6.8
Figure 6 Figure 3.2 Figure 27 Figure 7.9
Figure 7 Figure 3.10 Figure 28 N/A
Figure 8 Figure 3.11 Figure 29 N/A
Figure 9 Figure 3.15 Figure 30 Figure 7.2
Figure 10 Figure 3.14 Figure 31 Figure 7.11
Figure 11 Figure 3.16 Figure 32 N/A
Figure 12 Figure 3.8 Figure 33 N/A
Figure 13 Figure 3.9 Figure 34 Figure 7.3
Figure 14 N/A but PDF available online110 Figure 35 N/A
Figure 15 Figure 4.2 Figure 36 N/A
Figure 16 Figure 4.7 Figure 37 N/A
Figure 17 Figure 4.10 Figure 38 N/A but PDF available online111
Figure 18 Figure 5.1 Figure 39 Figure 9.1
Figure 19 Figure 5.2 Figure 40 N/A
Figure 20 Figure 6.1 Figure 41 N/A
Figure 21 Figure 6.3 Figure 42 N/A
110 At https://www.aemo.com.au/Electricity/National-Electricity-Market-NEM/Planning-and-forecasting/South-Australian-Advisory-Functions.
111 At https://www.aemo.com.au/Electricity/National-Electricity-Market-NEM/Planning-and-forecasting/South-Australian-Advisory-Functions.

© AEMO 2019 | South Australian Electricity Report 84
Glossary, measures, and abbreviations
Glossary
This document uses many terms that have meanings defined in the National Electricity Rules (NER). The NER
meanings are adopted unless otherwise specified.
Term Definition
committed projects Generation that is considered to be proceeding under AEMO’s commitment criteria (see Generation
Information on AEMO’s website, link in Table 1).
electrical energy Average electrical power over a time period, multiplied by the length of the time period.
electrical power Instantaneous rate at which electrical energy is consumed, generated, or transmitted.
generating capacity Amount of capacity (in megawatts) available for generation.
generating unit Power stations may be broken down into separate components known as generating units and may be
considered separately in terms (for example) of dispatch, withdrawal, and maintenance.
installed capacity The generating capacity (in megawatts) of the following (for example):
• A single generating unit.
• A number of generating units of a particular type or in a particular area.
• All of the generating units in a region.
For rooftop PV, the total amount of cumulative rooftop PV capacity installed at any given time.
maximum demand Highest amount of electrical power delivered, or forecast to be delivered, over a defined period (day,
week, month, season, year) either at a connection point or simultaneously at a set of connection points.
non-scheduled
generation Generation by a generating unit that is not scheduled by AEMO as part of the central dispatch process
and has been classified as a non-scheduled generating unit in accordance with Chapter 2 of the NER.
operational
consumption The electrical energy supplied by scheduled, semi-scheduled, and significant non-scheduled generating
units, less the electrical energy supplied by small non-scheduled generation.
Units of measure
Abbreviation Expanded name
GWh Gigawatt hour
kV Kilovolt
kW Kilowatt
kWh Kilowatt hour
MW Megawatt

© AEMO 2019 | South Australian Electricity Report 85
Abbreviation Expanded name
MWh Megawatt hour
PJ Petajoule
TJ Terajoule
Abbreviations
Abbreviation Expanded name
AEMC Australian Energy Market Commission
AEMO Australia Energy Market Operator
AER Australian Energy Regulator
AEST Australian Eastern Standard Time
ARENA Australian Renewable Energy Agency
CCGT Combined-cycle gas turbine
CER Clean Energy Regulator
COAG Council of Australian Governments
CPI Consumer Price Index
CSIRO The Commonwealth Scientific and Industrial Research Organisation
DC Direct current
DER Distributed energy resources
DSP Demand side participation
ENA Energy Networks Australia
ESB Energy Security Board
ESOO Electricity Statement of Opportunities
EV Electric vehicle
FCAS Frequency control ancillary services
GPG Gas-powered generation
GSOO Gas Statement of Opportunities
HPR Hornsdale Power Reserve
ISP Integrated System Plan
LNG Liquefied natural gas
LOR Lack of Reserve
LRET Large-scale renewable energy target
NEM National Electricity Market

© AEMO 2019 | South Australian Electricity Report 86
Abbreviation Expanded name
NER National Electricity Rules
OCGT Open-cycle gas turbine
PHEV Plug-in hybrid electric vehicle
POE Probability of exceedance
PV Photovoltaic
PVNSG Photovoltaic non-scheduled generation
QSN Queensland – South Australia – New South Wales
RERT Reliability and Emergency Reserve Trader
REZ Renewable energy zone
SAAF South Australian Advisory Functions
SAER South Australian Electricity Report
SAET South Australia Energy Transformation
SAPN SA Power Networks
SIPS System Integrity Protection Scheme
SNSG Small Non-scheduled Generation
TAPR Transmission Annual Planning Report
TNSP Transmission network service provider
TWAP Time-weighted average price
USE Unserved energy
VPP Virtual power plant
VRET Victorian Renewable Energy Target
VWAP Volume-weighted average price
WEM Wholesale Electricity Market (in Western Australia)


![THE SOUTH AUSTRALIAN GOVERNMENT GAZETTE · 712 the south australian government gazette [28 february 2008. 28 february 2008] the south australian government gazette 713. 714 the south](https://img.dokumen.tips/doc/110x75/60a2527d46c825459e780070/the-south-australian-government-gazette-712-the-south-australian-government-gazette.jpg)


